Article

Can a Policy Mix Achieve a Collaborative Effect? Exploring the Nested Implementation Process of Urban Carbon Emission Reduction Policies

1
Institute of Urban and Demographic Studies, Shanghai Academy of Social Sciences, Shanghai 200020, China
2
China Institute for Urban Governance, Shanghai Jiao Tong University, Shanghai 200030, China
3
Institute of Politics and Public Administration, Shanghai Academy of Social Sciences, Shanghai 200020, China
4
School of Government, Nanjing University, Nanjing 210023, China
*
Authors to whom correspondence should be addressed.
Sustainability 2024, 16(15), 6529; https://doi.org/10.3390/su16156529
Submission received: 16 May 2024 / Revised: 14 July 2024 / Accepted: 22 July 2024 / Published: 30 July 2024
(This article belongs to the Special Issue Environmental Economics in Sustainable Social Policy Development)

Abstract

:
China’s government has adopted several carbon emission reduction policies to strive to achieve the dual carbon goal of “carbon peaking and carbon neutrality”. In practice, various multi-objective policy instruments are implemented in a staggered manner, which might lead to the overestimation or underestimation of single-policy effect evaluation. This paper evaluates the combined effect of the Low-carbon City Pilot (LCP) and Comprehensive Demonstration City of Energy Saving and Emission Reduction Fiscal Policy (CCEEFP), investigating whether their carbon emission reduction effects are complementary and achieve collaborative outcomes. The empirical results indicate that the LCP, the CCEEFP, and their nested implementation could all promote carbon emission reduction. Their collaborative policy effects are sustained, being more obvious in higher-grade cities. Furthermore, there is a greater adoption of the source treatment technology for carbon emissions. And the implementing order of these policies could affect governance performance because of the “path dependence” of local government’s attention towards multi-objective policy intentions. The empirical evidence demonstrates that policymakers should carefully design policy mix particulars towards a common purpose and carefully co-ordinate their implementation process.

1. Introduction

The global average temperature has continued to rise over the past 10 years, accompanied by the frequent occurrence of extreme weather phenomena such as heat waves, serious droughts, and tropical cyclones. This has resulted mainly from the carbon dioxide emissions produced by human activities. According to a survey report issued by the United Nations Environment Programme (UNEP), human activities have caused serious environmental problems, resulting in economic losses of over USD 80 billion in 2021, equivalent to 11% of the current global GDP. Urbanization activities happening in cities have been proved to be the main factor causing carbon emissions [1].
In order to promote economic transformation and actively showcase its image as a responsible major country, the Chinese government explicitly proposed a dual carbon goal of “carbon peaking and carbon neutrality” in September 2020. Specifically, it aims to achieve its highest carbon emissions by 2030 and realize a net zero carbon emission goal by 2060 [2].
In practice, the central government of China laid emphasis on energy saving and emission reduction at the beginning of the 21st century, which was elevated to national planning in 2001. In 2006, the State Council of China released the “Decision on implementing the Scientific Development Concept and promoting environmental protection”, which explicitly requested local governments to attach importance to environmental governance. Based on the Scientific Development Concept issued by President Hu Jintao, the Chinese central government has gradually formulated multiple laws and regulations on promoting “energy saving and emission reduction”, which have sent a strong signal of a new “war against environmental problems” to local governments. A large number of urban environmental and emission reduction policies were therefore adopted, including the Low-carbon City Pilot (LCP, started in 2010) and the Comprehensive Demonstration City of Energy Saving and Emission Reduction Fiscal Policy Pilot (CCEEFP, started in 2011).
It may be found that several policies issued by the Chinese central government have similar and even repetitive carbon emission reduction goals, which indicates that the outcome of previous policies might deviate from the intention when they were formulated [3,4]. Two reasons could be concluded to explain the phenomenon. Firstly, from the perspective of policy design, there may be a lack of systematic consideration of integrated environmental governance frameworks [5], and the subsequent policies are supplementary to the original policy. Secondly, from the perspective of policy implementation, the process of implementing the various policies might be competitive or neutral [6]. When the policy mix is not properly coordinated, the nested implementing of policies might cause them to crowd each other and create a “policy mess” [7]. As a result, it is necessary to evaluate the policy effect from a comprehensive perspective instead of adopting an over-simplistic analysis of single policies [8]. Nonetheless, although various policies have been designed to stimulate carbon emission reduction, there is a lack of research on the interaction between two types of policy instruments within the multi-objective policy mix [9], which could reflect the attention allocation of local governments under resource scarcity constraints.
This paper takes as an example the nested implementation of the LCP and CCEEFP, which both set the goal of urban carbon emission reduction, and it explores the interaction when these two policies are piloted in a nested way. Specifically, three research questions are addressed: (1) Can the LCP and CCEEFP policies significantly promote urban carbon emission reduction separately? Furthermore, what is the interaction effect between LCP and CCEEFP when their piloting is nested? Could the policies achieve a collaborative policy effect? (2) Does their interaction have a sustainable effect on urban carbon emission reduction? And do the effects of this interaction vary with different urban characteristics? (3) Carbon emission reduction mechanisms and evolution paths could be calculated to deeply explore the process of the nested implementation of pilot policies, especially to identify the effect difference for a multi-objective policy mix. A staggered difference-in-difference method was adopted to identify the causal relationship between the nested piloting of policies and carbon emission reduction, which could correct the potential bias of the two-way fixed effect estimator in the case of multiple policy implementation.
The remainder of the paper is organized as follows. Section 2 is a literature review. Section 3 briefly introduces the LCP and CCEEFP and puts forward several empirical hypotheses. Section 4 provides information on the methods and data, while Section 5 analyzes the empirical results. Section 6 summarizes the conclusions and their policy implications.

2. Literature Review

Policy experiment, the source of a policy pilot [10], is treated as a unique governance measure, which has been gradually and deeply explored by scholars since the beginning of the 21st century [11,12]. The existing literature mainly focuses on the analysis of theoretical connotations of policy experiment [13], summarizing the experience of policy experiment cases [14] and evaluating the effects of various randomized experimental models [15,16]. Research on policy experiment has laid the foundation for the study of policy pilots in China.
The policy pilot is a native governance strategy and policy instrument in China, representing a distinctive governance mechanism developed by the Chinese government in practice. Initially, the policy pilot was regarded as a crucial institution design explaining the rapid development of China’s economy since the Reform and Open period [17]. Montinola et al. argued that the policy pilot benefits from China’s decentralized institution [18], rooted in the reshaped central–local government relationship characterized by an upward shift in financial power and a downward shift in administrative power [19]. The policy pilot is a dynamic evolutionary process with phased characteristics, encompassing the pilot stage of “first try” and the policy diffusion stage from point to surface [20].
In the field of environmental policy pilot implementation, two perspectives are considered to identify the factors influencing the effectiveness of pilot implementations. Firstly, internal factors within governance institutions play a role. Eckerberg explored the impact of discretion on environmental governance performance [21]. The relationship between central and local governments and the provision of institutional supply have also been confirmed to affect the implementation of environmental policies in the USA and Canada [22]. Secondly, external factors related to social–economic development also influence the effectiveness of environmental policy pilots. Specifically, the level of economic development [23] and public awareness of environmental protection are significant factors [24].
When an individual environmental policy struggles to achieve ideal outcomes, a policy mix is expected to provide complementary effects [25]. Scholars have increasingly focused on the effects of nested piloting to explore policy interactions [26]. It has been confirmed that a policy mix performs better in reducing plastic pollution than a single policy [27]. However, due to differences in policy goals and instruments, the effects of an environmental policy mix are not always complementary and are sometimes conflicting [28].
It could be observed that a substantial body of literature has deeply explored the field of environmental policy piloting. Concurrently, the impact of policy mix implementation is gaining increasing attention. However, most scholars have evaluated the separate effects of individual environmental policies on governance performance, assuming that one policy’s effect is independent of another, which is rarely the case in practice [29]. Even though some studies have recognized the competitive or complementary relationships among policies, few have considered the staggered implementation and have overlooked the importance of the order of pilot policies. This order reflects the evolutionary trend of nested piloting of environmental policies with a multi-objective policy mix. This study takes the nested implementation of LCP and CCEEFP policies as an example, comprehensively evaluating their individual and collaborative effects on urban carbon emission reduction. Additionally, the study aims to elucidate the carbon emission reduction mechanisms and evolution paths to thoroughly explore the interaction of pilot policies with nested implementation.

3. Policy Background and Hypotheses

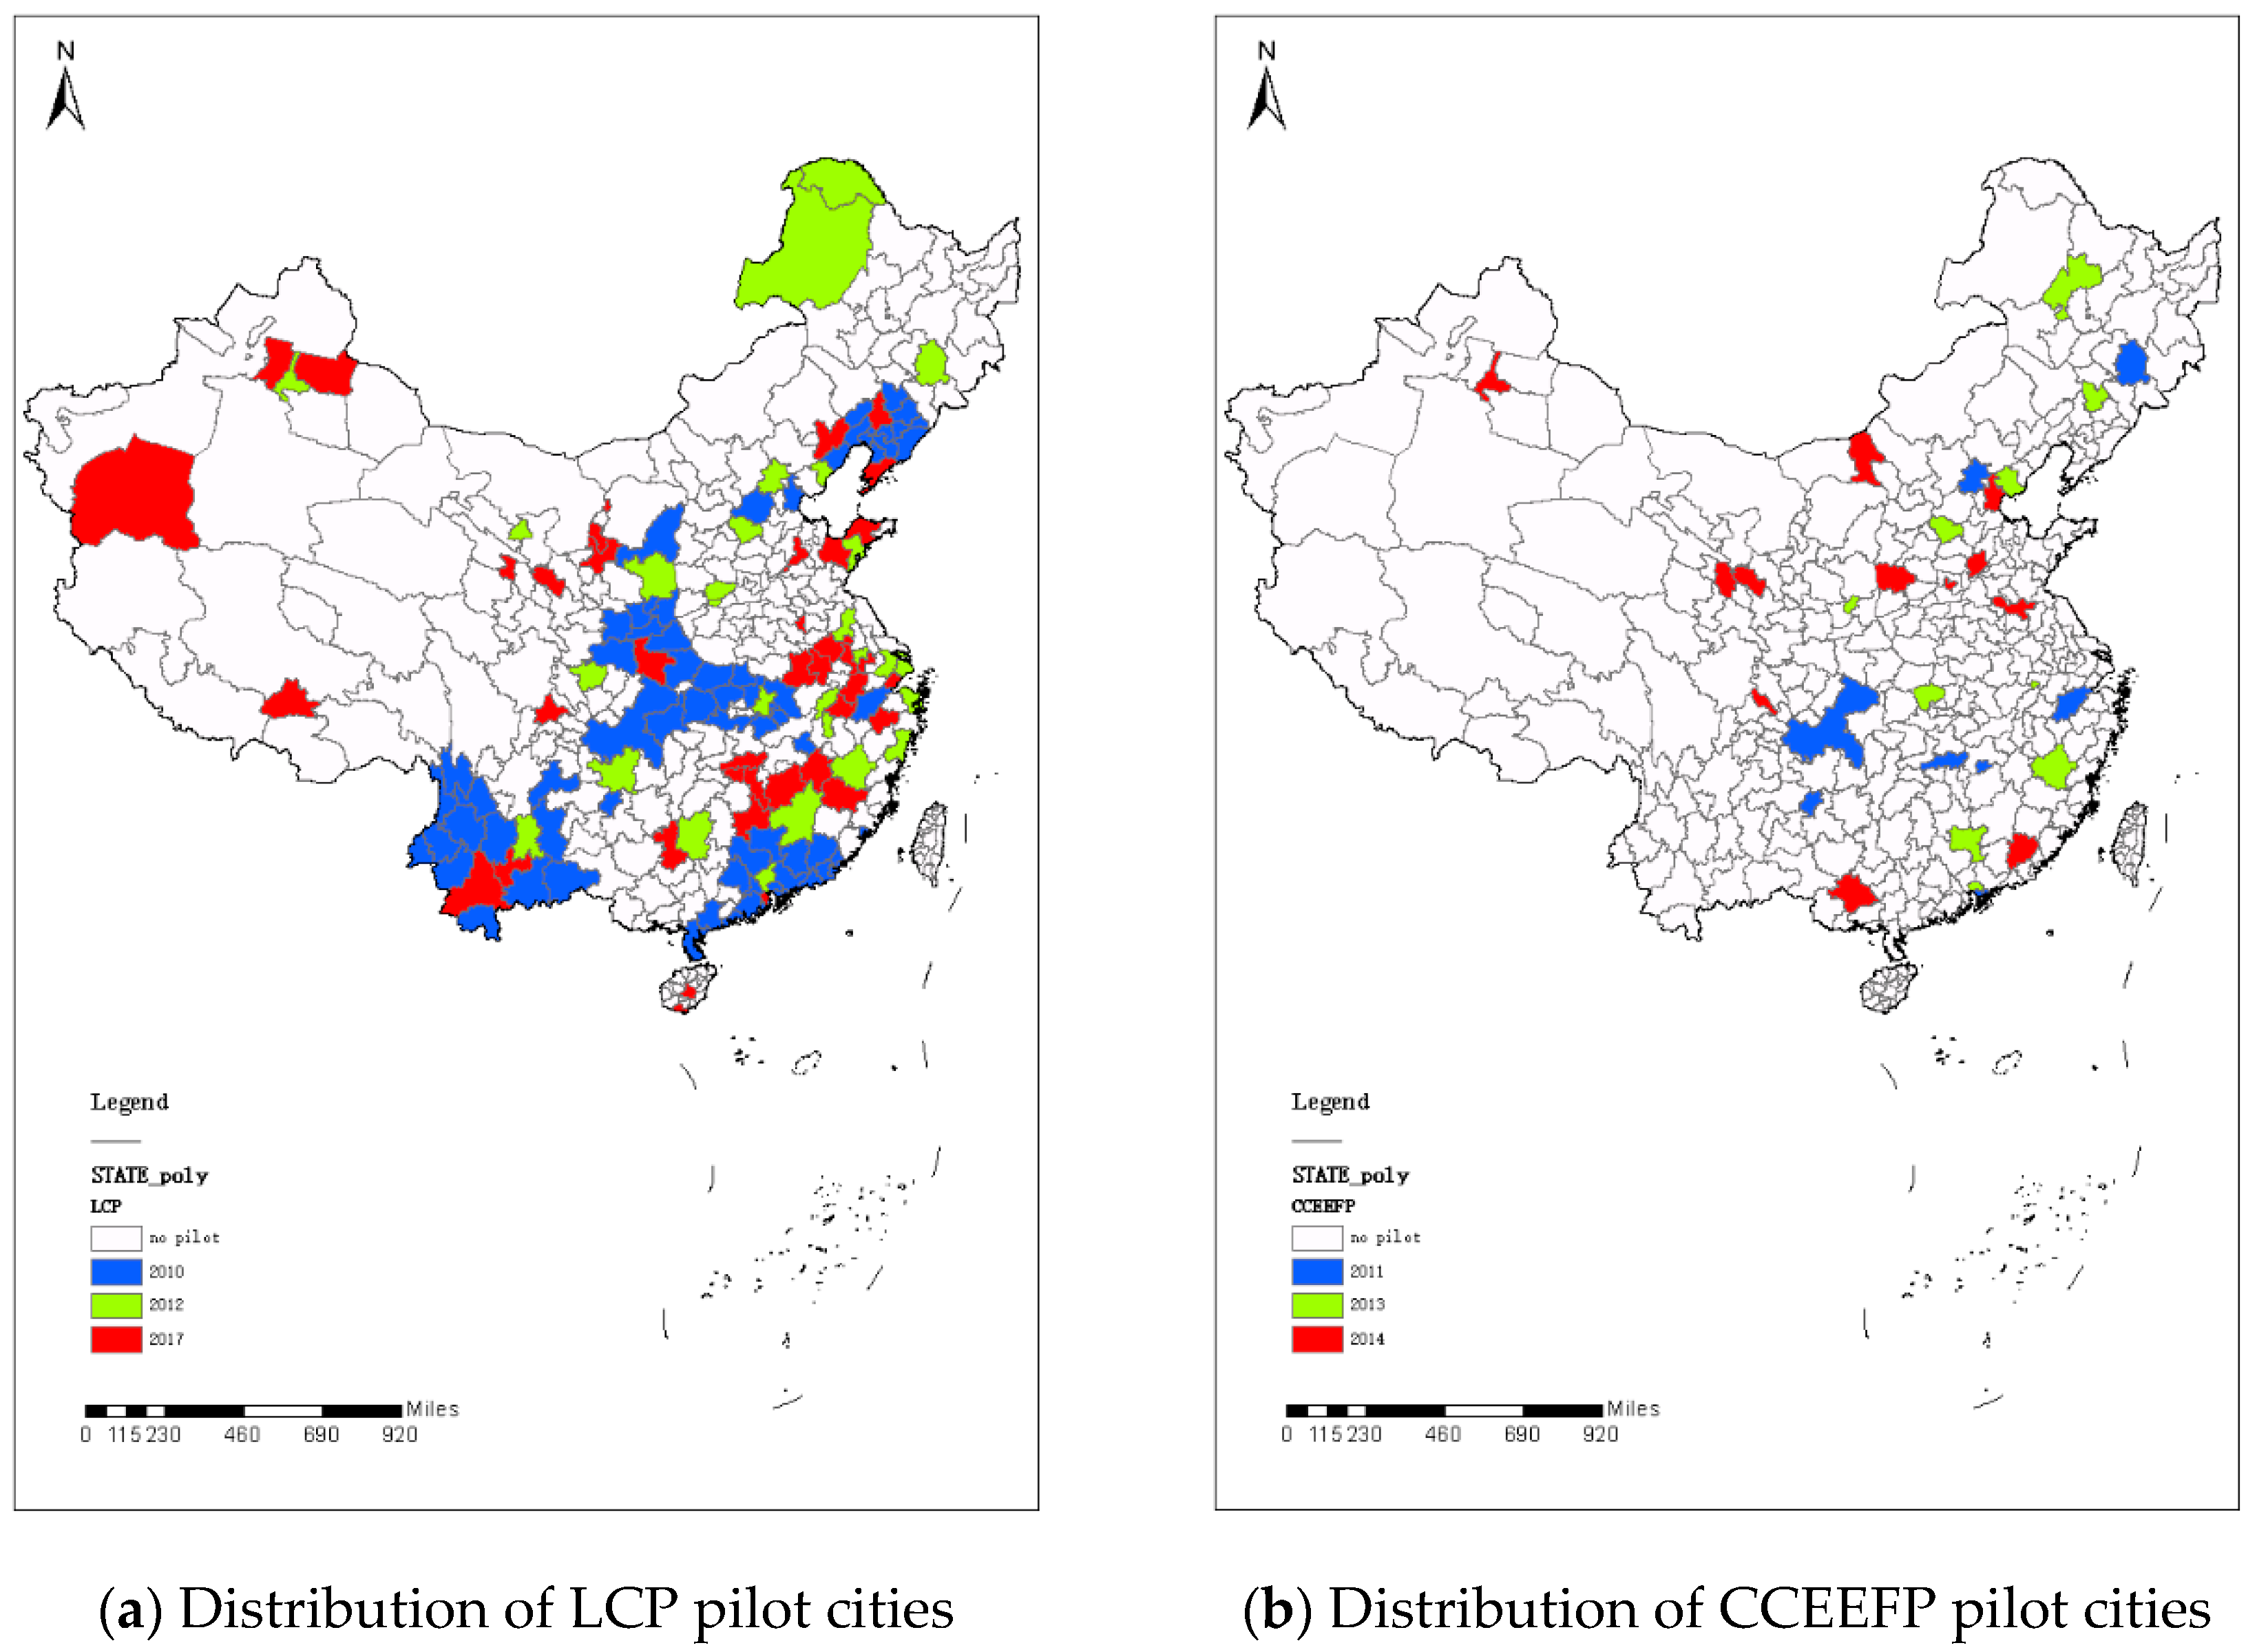
3.1. LCP and CCEEFP Policies

The LCP and CCEEFP projects are both pivotal pilot policies aimed at reducing carbon emissions. The LCP policy is a significant environmental reform initiated in response to the low-carbon development requirements set forth at the 15th APEC leaders’ meeting. As a key component of actions to achieve China’s 2030 greenhouse gas emission control target, the National Development and Reform Commission (NDRC) of China launched the first phase of the LCP program in 2010, involving five provinces and eight cities. In 2012, one province and 28 cities were approved for the second wave of LCP implementation, followed by an additional 45 cities in 2017. The LCP policy aims to promote carbon emission reduction by seeking more environmentally friendly resource allocation methods, specifically through the development of green technology and the promotion of green innovation. Although the LCP was promoted by the central government of China, it provided limited financial input and related policy supporting [30]. According to the Policy Process Theory analysis framework (Table 1), it can be concluded that the LCP offers only weak incentives to local governments.
The CCEEFP policy is another significant initiative designed to promote green innovation and low-carbon technology transformation. In 2011, the Ministry of Finance and the NDRC launched the first wave of the CCEEFP with eight cities. The pilot range was extended in 2013 and 2014, eventually covering a total of 30 pilot demonstration cities in three phases. Unlike the LCP, the CCEEFP employs two robust policy instruments: financial incentive and top-down environmental regulation (Table 1). The central government provides incentive funds of CNY 400–600 million per year to pilot demonstration cities to achieve technological innovation and low-carbon development. Additionally, these pilot cities are required to participate in a set of performance evaluation systems [31]. Through competitive evaluation, dynamic adjustment of pilot cities, and public supervision, the CCEEFP offers strong incentives for cities to advance projects related to energy saving and emission reduction. However, the CCEEFP also includes another policy target aimed at reducing pollutant emissions, which could divert the attention of local governments.
Overall, through policy process theory analysis, it can be observed that the LCP and CCEEFP have complementary policy instruments and their nested implementation can achieve collaborative effects. The CCEEFP, with its dual goals of carbon reduction and pollutant reduction, reflects the allocation of attention by local governments under resource scarcity constraints. The details of these pilot cities, including the timing of policy implementation and their locations, are illustrated in Figure 1 (Figure 1a shows the distribution of LCP pilot cities, while Figure 1b shows the distribution of CCEEFP pilot cities across three waves) and Figure 2. It can be observed that the pilot cities are randomly distributed across eastern, central, and western regions, suggesting a random piloting approach. Additionally, the nested implementation characteristic of these two policies is evident in Figure 2. The interlaced timing of their pilot phases aligns with the gradual reform process and is consistent with China’s governance logic of “from point to surface” in China [25].

3.2. Main Regressions Hypotheses

3.2.1. The LCP Policy and Carbon Emission Reduction

The LCP policy is an effective tool for controlling carbon emissions, capable of achieving reductions by optimizing energy consumption structures, improving energy utilization efficiency, reducing the proportion of high pollution industries, and establishing an industrial system characterized by low-carbon, green, environmentally friendly, and circular features [32]. Previous rounds of pilot implementations have confirmed its effectiveness in achieving desired results [33]. The LCP policy typically encourages enterprises to adopt low-carbon production modes by stimulating green innovation and providing funds to guide innovators in updating their green technology [34]. Thus:
Hypothesis 1 (H1):
Carbon emission reduction performance of LCP cities is better than these non-LCP cities.

3.2.2. The CCEEFP Policy and Carbon Emission Reduction

Unlike general environmental regulation policies, the CCEEFP policy aims to achieve green and low-carbon transformation. It not only addresses the pollution behaviors of local stakeholders through strong environmental regulation measures but also reshapes the resource allocation pattern through financial subsidies, investment, and policy supporting [31]. If executed properly, it can effectively balance the environmental, economic, and social benefits, coordinating the relationship between environmental protection and socio-economic development [35]. Moreover, it serves as an important method for the central government to reverse local behaviors and curb the free-riding strategies of local governments under the fiscal decentralization institution [36]. Thus:
Hypothesis 2 (H2):
Carbon emission reduction performance of CCEEFP cities is better than these non-CCEEFP cities.

3.2.3. The Nested Pilot of the LCP and CCEEFP and Carbon Emission Reduction Performance

Due to the complementarity or crowding out effects of various policy instruments, the nested implementation of policy mixtures might produce different results. The policy complementary effect occurs when the combined benefits of various policies are greater than the effects of each policy individually [37]. According to the policy process analysis in Table 1, the LCP pilot offers weak incentives and soft constraints on local governments, while the CCEEFP pilot provides strong financial incentives and strict environmental regulations. This suggests a complementary relationship between the policy instruments of the LCP and CCEEFP policies. Furthermore, both policies can stimulate green innovation to control carbon emissions through source treatment [24]. Thus:
Hypothesis 3 (H3):
The nested implementation of LCP and CCEEFP policies have complementary effects on carbon emission reduction performance.
The theoretical analysis above can identify the separate and collaborative effects of the carbon emission reduction policy mix. However, it is also important to explore the carbon abatement mechanisms and their evolution paths, including the implementing order. Consequently, the empirical research framework is outlined in Figure 3.

4. Methods and Data

4.1. Methodology

In this paper, the LCP and CCEEFP are regarded as natural experiments, allowing us to adopt the difference-in-difference (DID) method to identify the net policy effects of these two pilot policies. Considering China’s approach to policy piloting, the LCP and CCEEFP policies are implemented nationwide in several waves. Accordingly, we use the staggered difference-in-difference method, and the model is shown as follows:
Y i t = α 0 + β 0 D I D _ L C P i t + ρ X i t + μ i + λ t + ε i t
Y i t = α 0 + β 0 D I D _ C C E E F P i t + ρ X i t + μ i + λ t + ε i t
Y i t = α 0 + β 0 D I D _ L C P i t × D I D _ C C E E F P i t + ρ X i t + μ i + λ t + ε i t
where Y i t is the dependent variable representing the CO2 emission density in city i at year t. It can also represent the CO2 emissions scale in robustness check and SO2 emission density in mechanism analysis. D I D _ L C P i t and D I D _ C C E E F P i t are dummy variables indicating the piloting of the LCP and CCEEFP policies, respectively. μ i denotes the city-fixed effects, capturing the time-invariant characteristics of different cities, while λ t denotes the year-fixed effects, capturing yearly factors common to all cities. X i t represents the covariates and ε i t is the error term. The three coefficients of core explanatory variables are of particular interest. In Equation (1), β 0 estimates the impact of LCP; in Equation (2), β 0 estimates the impact of CCEEFP on carbon emission reduction. In Equation (3), the interaction term D I D _ L C P i t × D I D _ C C E E F P i t represents the nested implementation of the LCP and CCEEFP policies and β 0 estimates the combined impact of these nested piloting policies on carbon emission reduction.

4.2. Variables

4.2.1. Dependent Variable: Indictors of Carbon Emissions and Pollutant Emissions

The dependent variable in the baseline regression of this study is CO2 emission density, while CO2 emission scale is used as an indicator in the robustness check. Additionally, SO2 emission density is employed in the evolution path analysis to discern the governance preferences of local governments towards multi-objective policy implementation. The emission density variables related to GDP are adjusted to the level of 2006 constant prices [38].

4.2.2. Control Variables

Several conventional variables are used as control variables that might affect carbon emission governance performance. These variables cover the fields of population scale, economic development, economic structure, and energy consumption. Population scale, which can influence carbon emissions, is controlled using population density (pop_den). GDP (gdp, CNY 100 million, converting to the level of 2006 constant prices) is used to gauge the degree of economic development. Economic structure is measured by the percentage of secondary industry output (second) and the proportion of foreign investment in GDP (foreign_gdp). Lastly, indictors related to energy consumption intensity and energy-resource structure, which also affect carbon emissions [39], are measured by energy consumption divided by GDP (energy_coms) and the proportion of coal consumption (coal_coms), respectively.

4.3. Data Collection

This paper utilizes a sample of 283 cities over the period from 2006 to 2020. The carbon emission and SO2 emission data are sourced from the China Carbon Emission Accounting Database and the China Environment Yearbook [40]. The related social–economic data come from the China City Statistical Yearbooks, China Region Statistical Yearbooks, and China Energy Statistical Yearbooks. Information on the implementation of the LCP and CCEEFP programs is primarily collected from official central government documents and government websites. Table 2 presents the descriptive statistics.

5. Empirical Results

5.1. Baseline Model Results

As shown in Table 3, Model 1 and Model 2 illustrate the independent effects of the LCP and CCEEFP policies, respectively, while Model 3 captures the interaction effect of these two policies. To ensure the accuracy of the empirical results, city-fixed and year-fixed effects are controlled for in all regressions to address potential issues with unobservable factors. In Model 1, the coefficient for the LCP policy is significantly negative at the 1% level (DID_LCP, β = −0.00143***), indicating that cities implementing the LCP can effectively reduce carbon emissions. Similarly, in Model 2, the coefficient for the CCEEFP policy is significantly negative at the 1% level (DID_CCEEFP, β = −0.00173***), suggesting that the CCEEFP also achieves carbon emission reduction. Notably, the absolute value of the CCEEFP coefficient is greater than that of the LCP, indicating that the CCEEFP’s carbon emission reduction performance is more sensitive to the combined effects of strong financial incentives and environmental regulations. Overall, Hypotheses 1 and 2 are fully supported.
Model 3 examines whether LCP and CCEEFP policies are complementary. The interaction term coefficient for the LCP and CCEEFP policies is significant and negative (DID_nested, β = −0.00118**), indicating that the nested implementation of these two pilot policies has a complementary effect on promoting carbon emission reduction, thus empirically validating Hypothesis 3. This result supports the conclusion of previous studies that co-ordinated policies are more effective than single policies, and an effective policy mix can achieve better performance [41]. The LCP provides pilot cities with greater autonomy by encouraging green innovation and environmentally friendly resource allocation [42], while the CCEEFP enforces strict regulations on industrial production and offers targeted financial incentives [43]. The nested implementation of these two policies generates collaborative effects, enhancing overall policy performance.

5.2. Robustness Test

5.2.1. Parallel Trend Test
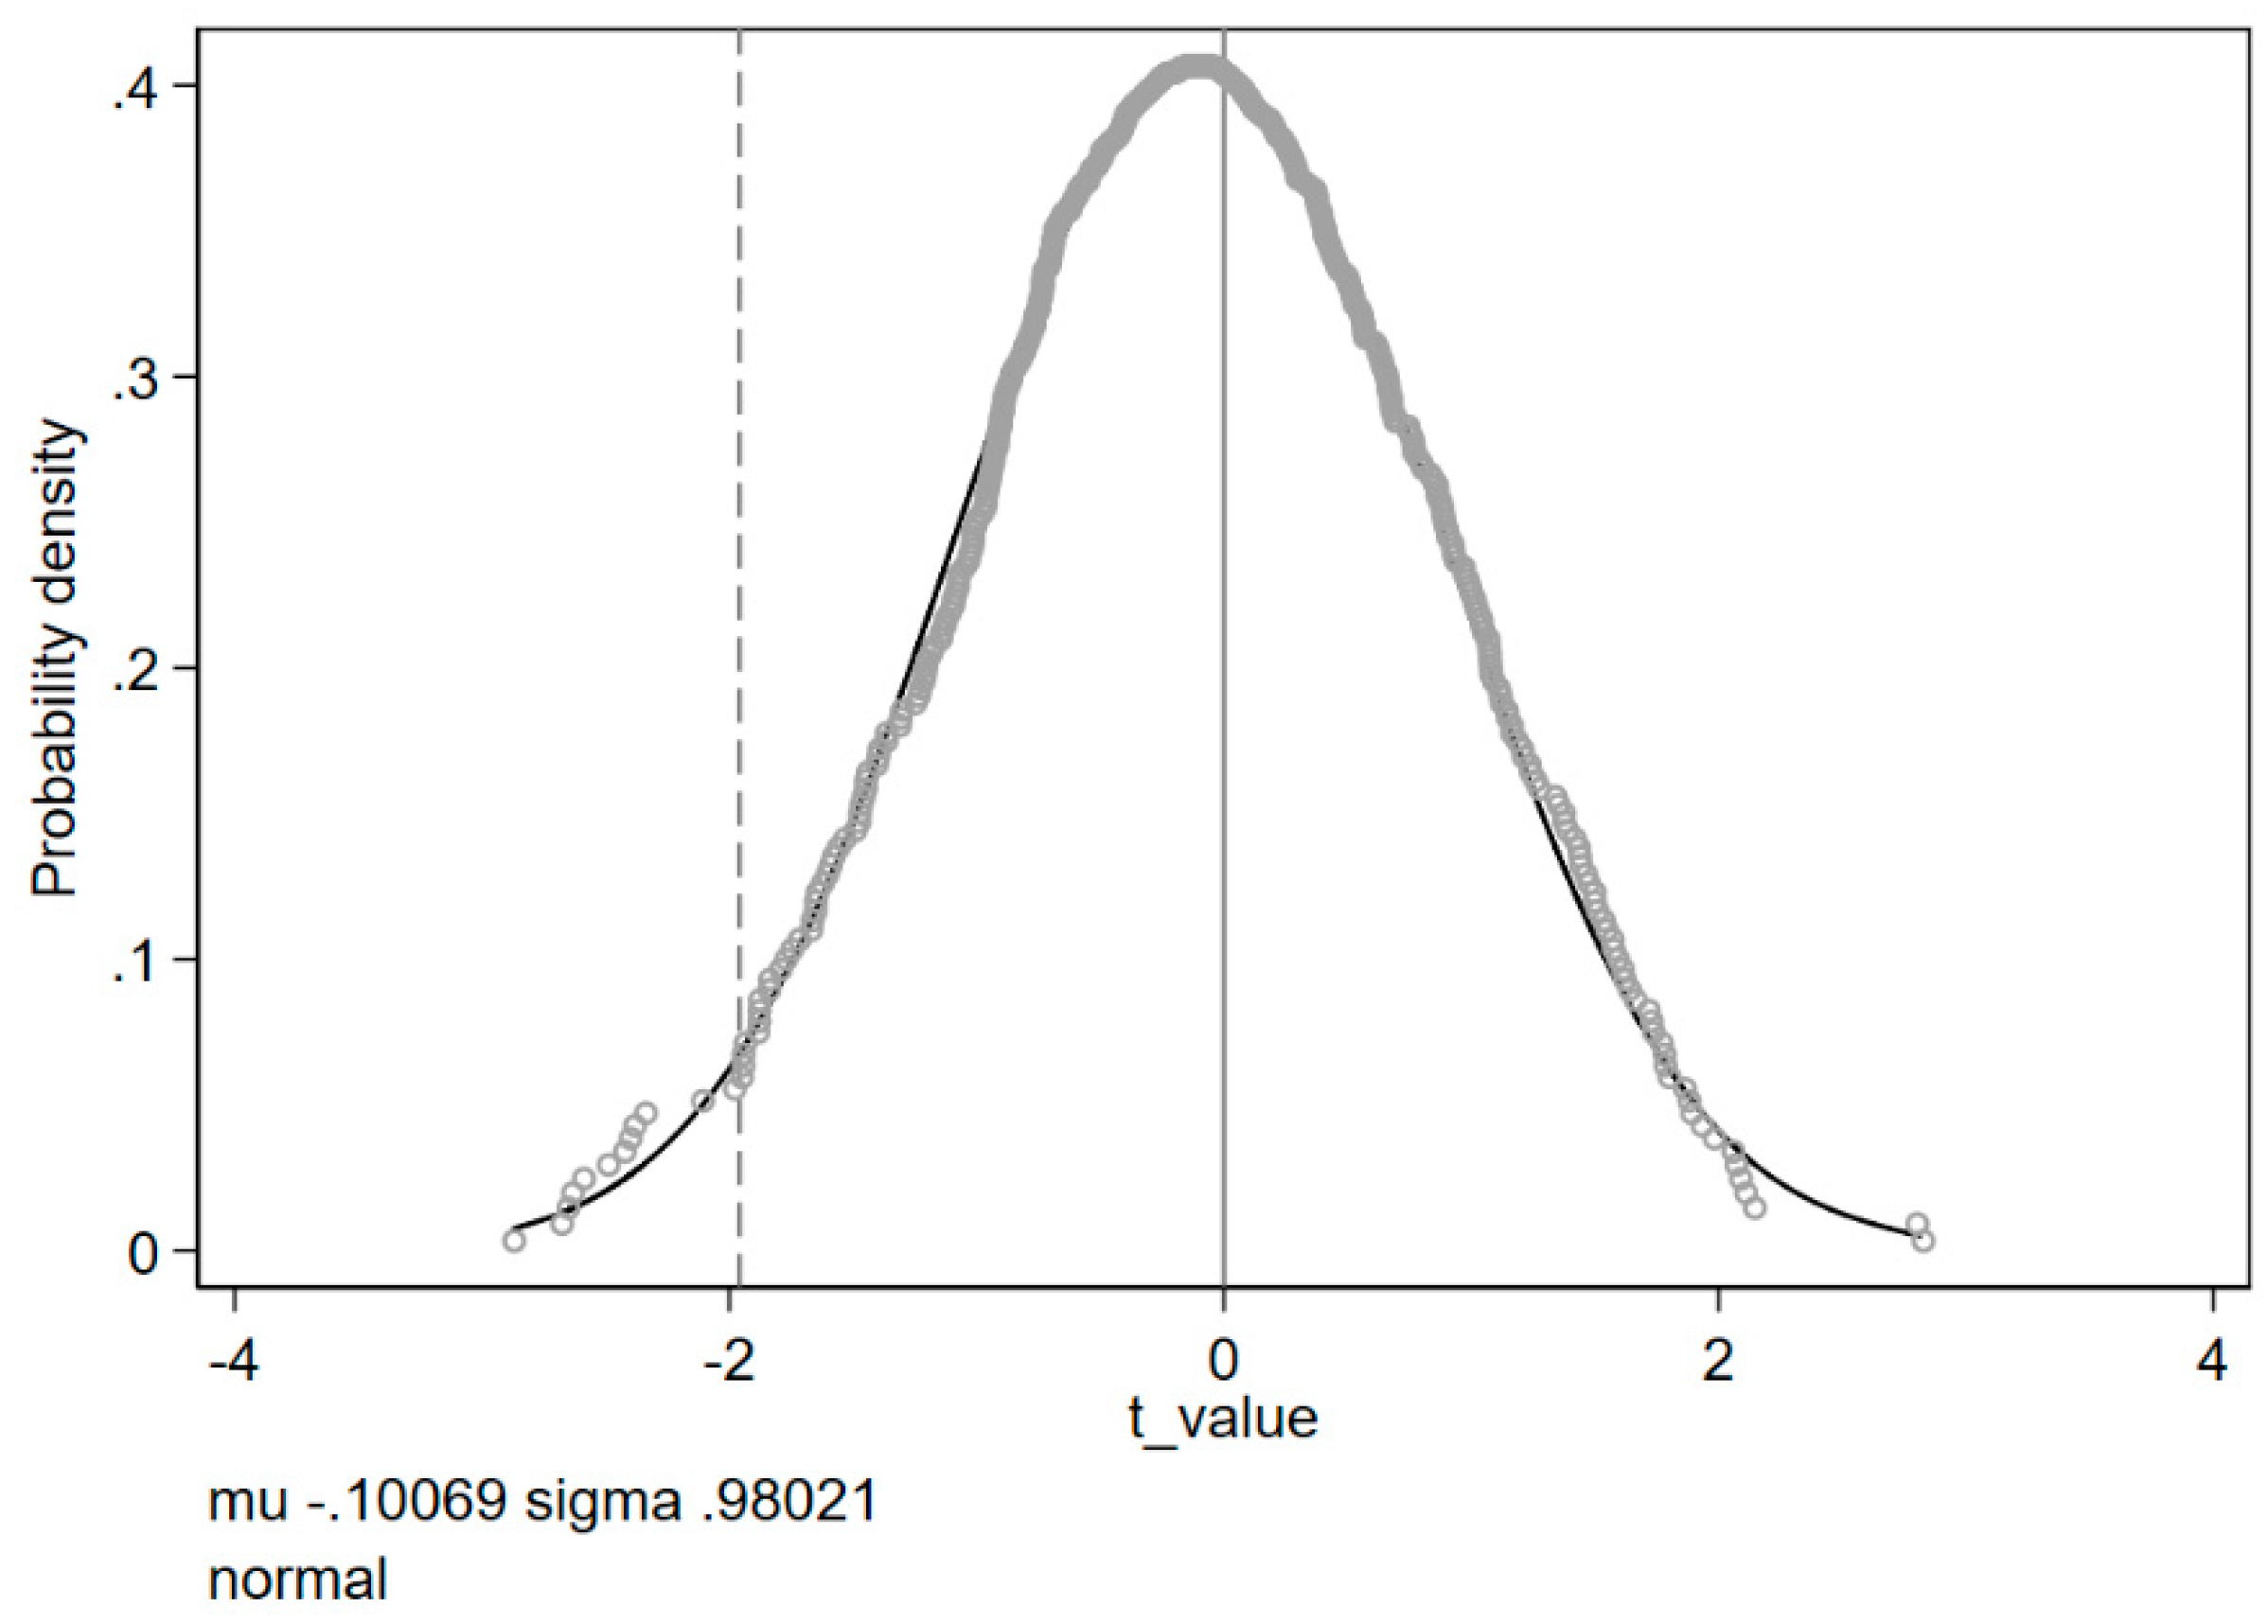
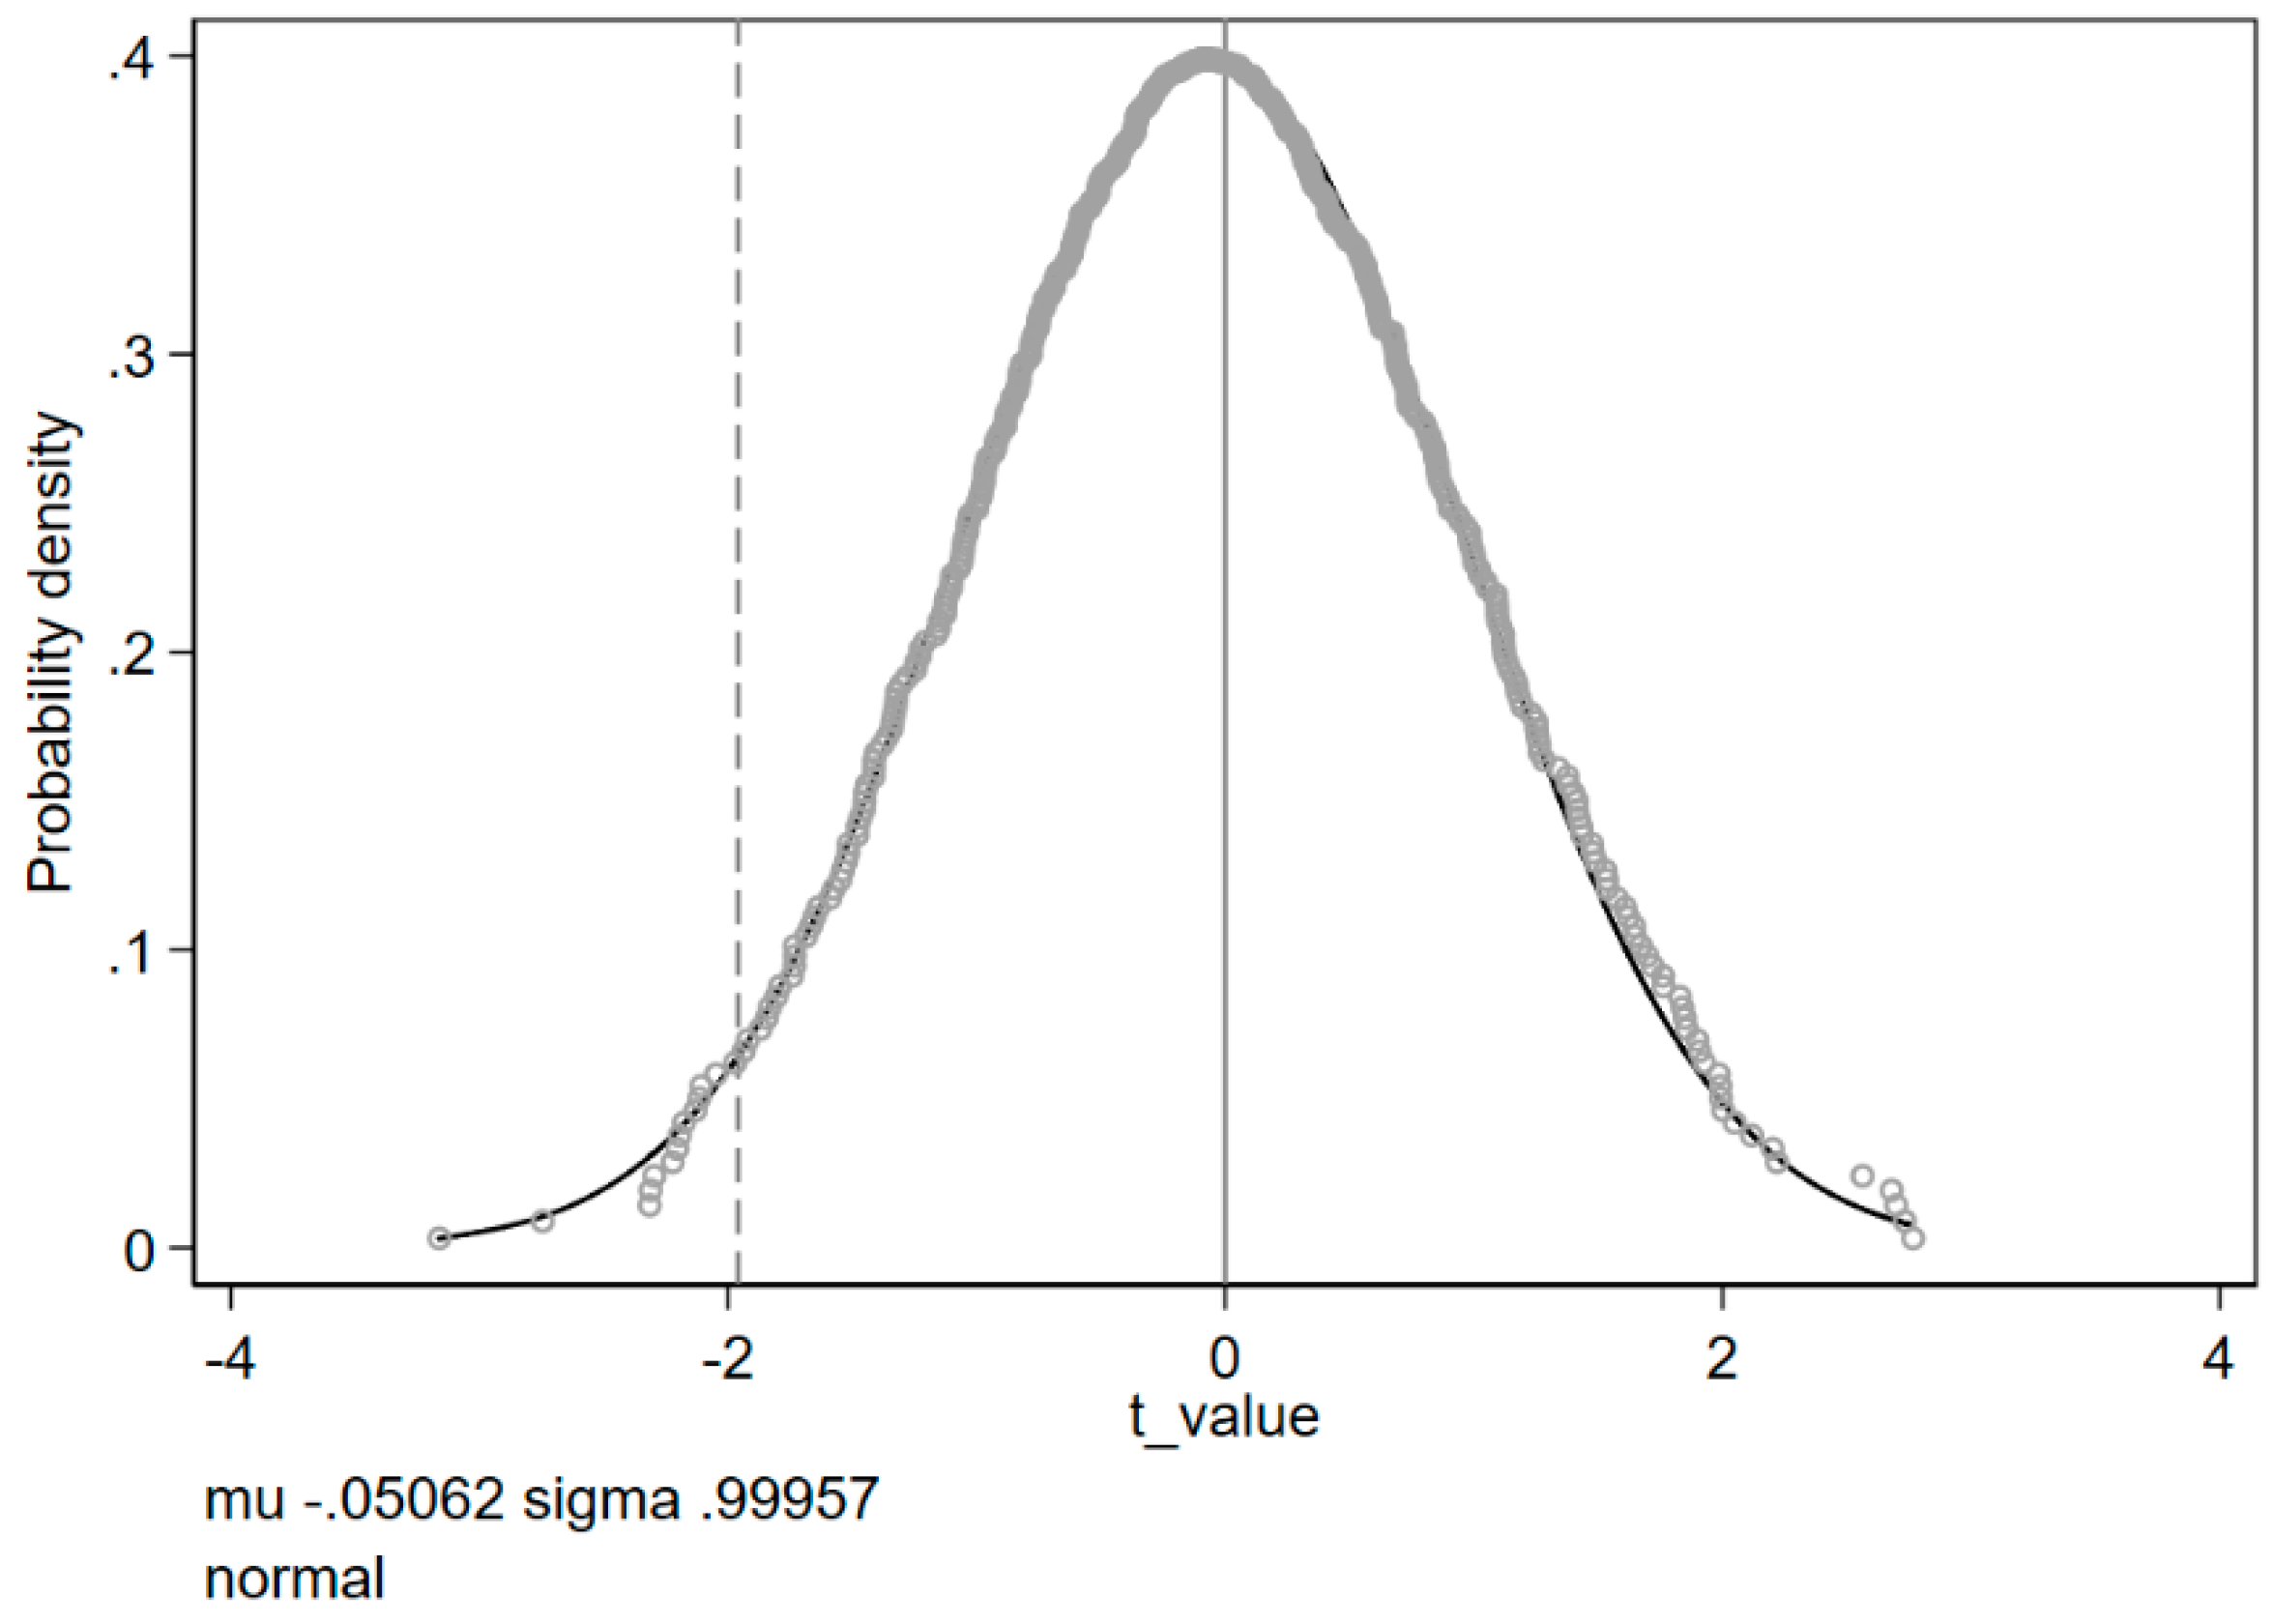
The core premise of the DID method is the parallel trends assumption. To test this assumption, we use the event study method, following the approach of Laporte and Windmeijer [44]. We include an interaction term policyi × yeart, which represents the interaction between the policy dummy and the year dummy from the period from 2006 to 2020:
Y i t = α + j = 2006 2020 β j p o l i c y _ L C P i × y e a r t + ρ X i t + μ i + τ t + ϵ i t
Y i t = α + j = 2006 2020 β j p o l i c y _ C C E E F P i × y e a r t + ρ X i t + μ i + τ t + ϵ i t
Y i t = α + j = 2006 2020 β j p o l i c y _ n e s t e d i × y e a r t + ρ X i t + μ i + τ t + ϵ i t
where the dummy interaction terms p o l i c y _ L C P i × y e a r t , p o l i c y _ C C E E F P i × y e a r t , and p o l i c y _ n e s t e d i × y e a r t in Equations (4)–(6) indicate whether city i is a site for the LCP policy, the CCEEFP policy, or the nested implementation of these policies in year j, respectively. The other variables in Equations (4)–(6) are defined similarly to those in Equations (1)–(3). Figure 4, Figure 5 and Figure 6 illustrate the dynamic effects of the LCP, CCEEFP, and their nested implementation, respectively. The x-lines represent the years after or before policy intervention, while their y-lines represent the CO2 emission density. Specifically, we test the parallel trend in 4 years before the LCP and CCEEFP policies, while 3 years before the nested implementation of policy mix. To show the dynamic trend more straightforwardly, the core coefficients and their 90% confidence intervals (CIs) are plotted in parallel trend figures for carbon emission intensity. If the vertical lines are intersected with the horizontal axis, it means the distinctions of carbon emission between experimental group and control group samples are not significant.
Figure 4 and Figure 5 indicate that the coefficients of interaction terms are not significant prior to the implementation of the LCP and CCEEFP policies, respectively. This indicates that there is no clear distinction in carbon emission between the experimental and control group samples before the policy interventions. In other words, there is no evidence suggesting that the central government selected demonstration cities based on their dynamic patterns of carbon emission intensity. This supports the parallel trends assumption for both the LCP and CCEEFP policies. Additionally, it is observed that the coefficient of the policy effect becomes significantly negative two years after the LCP implementation, while it becomes significantly negative in the current year for the CCEEFP implementation. This suggests that the LCP policy has a lagged effect on carbon emission reduction, while the CCEEFP policy has an immediate effect. Similarly, the coefficients for p o l i c y _ n e s t e d i × y e a r t are insignificant three years before the nested implementation, confirming that the parallel trends assumption holds (Figure 6). The policy mix begins to have a significant effect on carbon emission reduction one year after policy nested implementation.

5.2.2. Placebo Test

To ensure that the empirical results are not due to random chance, we conduct a placebo test for the effects of the LCP and CCEEFP policies, following methodologies from previous studies [45,46]. In this test, 123 cities are randomly selected as virtual LCP cities and 30 cities are randomly selected as virtual CCEEFP cities, with the remaining cities serving as the control group. We then perform the same staggered DID regression as specified in Equations (1) and (2). The simulation process is repeated 1000 times to verify the reliability of the placebo test. Figure 7 and Figure 8 display the kernel density distributions and T values of the 1000 regression coefficients for the LCP and CCEEFP models, respectively. The x-lines represent the T-value coefficients, while the y-lines show the density of p-values. A similar placebo test is conducted for the nested implementation of the policy mix, and the result is provided in Figure 9.
The results show that the estimated coefficients are predominantly clustered around 0, with only a few samples exceeding the critical value of −1.96. This indicates that most p-values are above the 10% significance level. Therefore, the placebo test suggests that the two policies and their nested implementation have no significant impact on carbon emission reduction when piloting cities are randomly allocated. This supports the reliability of our benchmark results.

5.2.3. Other Robustness Tests

To ensure the accuracy of empirical conclusions, we conduct three additional robustness checks. First, as discussed in the variables selection part, we replace the dependent variable (carbon emission intensity, CO2_den) with carbon emission scale (CO2). The results remain consistent with the baseline results (see Models 1, 2, and 3 of Table 4). Second, we apply the method of PSM-DID, which involves matching samples between the control group and the treated group before performing the DID regression. This approach helps mitigate endogenous problems caused by sample selection bias [47]. The results again show significant negative effects of the LCP, CCEEFP, and the nested implementation of the policy mix, aligning with the baseline estimates. Third, considering the carbon emission reduction performance of four municipalities (Beijing, Shanghai, Tianjin, and Chongqing) is directly assessed by the central government, which might affect the low-carbon governance preferences of local governments, we remove these four municipalities from the sample and rerun the staggered DID regressions. Models 7, 8, and 9 in Table 4 confirm the negative separate effects of the LCP and CCEEFP policies on carbon emission, as well as the collaborative carbon emission reduction effect between the two policies. In summary, these robustness checks indicate that the baseline regression results are robust.

5.3. Heterogeneity Test

Policies do not operate in isolation and the effects of given policies can vary among heterogenous cities. In the context of carbon emission reduction, the governance ability of local governments and socio-economic conditions play crucial roles in governance performance [48,49]. Generally, cities with higher administrative grades tend to have stronger governance capacities and more favorable socio-economic conditions [50]. This paper analyzes the heterogeneity of carbon emission reduction performance from the perspective of administrative grades. The high-grade cities group includes 35 cities (4 municipalities, 26 provincial capital cities, and 15 sub-provincial cities, with 10 of these sub-provincial cities also being provincial capitals). The remaining cities are categorized into the low-grade group.
Table 5 indicates a significant negative effect of LCP, CCEEFP, and their nested implementation in both high-grade and low-grade cities. However, the absolute values and significance of the coefficients are higher in high-grade cities (Models 2, 4, and 6) compared to low-grade cities (Models 1, 3, and 5). Firstly, high-grade cities already benefit from sufficient financial subsidies and resource allocation autonomy [51]. They also face more rigorous top-down assessments and wider public scrutiny [52,53], enabling them to achieve better carbon emission reduction performance with the implementation of single energy policies. Secondly, high-grade cities have more political resources and stronger connections with the central government, enhancing their ability to co-ordinate the LCP and CCEEFP policies and effectively utilize resources. This makes the complementary effect of these two policies more significant in high-grade cities.

5.4. Influencing Mechanism and Evolution Path

5.4.1. The Carbon Emission Reduction Mechanism Analysis

According to the empirical results in the dynamic effects analysis, the LCP and CCEEFP policies could achieve long-term carbon emission reduction effects, indicating that the policy implementation is not merely campaign-style enforcement and that a sustained carbon emission reduction mechanism is at work. To uncover the carbon emission reduction mechanisms of these two policies and their nested implementation, we conduct a mediation effect analysis from the perspective of governance instruments, which could be classified into end treatment and source treatment technologies of carbon emission [54]. These can be measured by variables such as infrastructure investment in environmental protection (environmental infrastructure expenditure) and green technology innovation (green patents number per 10 thousand people). The panel data for these mechanism variables is collected from the China City Statistical Yearbooks, the Statistical Yearbook of each city, and the Database of National Intellectual Property Patent. We construct a series of mechanism variables and replace the dependent variable in Equations (1)–(3). The empirical results are presented in Table 6.
Models 1, 3, and 5 indicate the relationship between policy intervention and environmental infrastructure investment, while Models 2, 4, and 6 indicate the relationship between policy intervention and green technology innovation. It is found that the enforcement of the LCP policy significantly increases the number of green patents, while the enforcement of the CCEEFP policy significantly increases both environmental infrastructure expenditure and the number of green patents. This suggests that the LCP policy mainly promotes carbon emission reduction through green technology innovation (source treatment), whereas the CCEEFP policy utilizes both source treatment and end treatment methods for carbon emission reduction. These findings align with the policy process analysis in Table 1 and confirm the results of previous research [55,56,57]. Furthermore, the nested implementation of the two policies promotes both the construction of environmental infrastructure and the increase in the number of green patents. However, the promotion effect on green technology innovation (β = 3.101***) is comparatively higher than that on environmental infrastructure investment (β = 2.054**). This provides additional evidence of the collaborative effect of the nested implementation of LCP and CCEEFP policies, suggesting that this approach fosters a green-innovation-oriented carbon reduction path.

5.4.2. The Nested Evolution Path

In practice, various policy instruments are employed to achieve carbon abatement, but evaluating the impact of a single policy pilot may result in either an overestimation or underestimation of its effect. Figure 2 illustrates that the LCP and CCEEFP policies are implemented in a nested manner, with these two policies being alternately enforced in some cities. Consequently, the sequence of policy implementation may influence the effectiveness of carbon emission reduction. We employ a staggered DID approach with the following empirical strategy: in Model 1, cities that first implement LCP and then CCEEFP are considered the treatment group, while cities that only implement LCP are the control group. In Model 2, cities that first implement CCEEFP and then LCP are the treatment group, with cities that only implement CCEEFP serving as the control group. Given that the CCEEFP also targets pollutant reduction, we replace the dependent variable with SO2 emission intensity for robustness checks (Models 3 and 4). This approach aims to derive general insights into how local governments allocate attention when confronted with multi-objective and multi-scheme tasks amidst resource constraints. The empirical results are shown in Table 7.
As shown in Table 7, the results from Models 1 and 2 indicate that, while the nested implementation with different orders could both promote carbon emission reduction, the absolute value and significance of coefficient in the situation of LCP first, then CCEEFP (β = −0.00396***) is higher than the coefficient of CCEEFP first, then LCP (β = −0.00155*). This discrepancy reflects a “Path Dependence” in the governance preferences of local governments. When LCP is implemented first, the task of carbon emission reduction was valued. If the city subsequently adopts CCEEFP, additional attention and financial resources are allocated to carbon emission reduction rather than pollutant reduction. Conversely, when CCEEFP is firstly implemented, both carbon emission and pollutant reduction tasks are considered. If LCP is later introduced, the lack of continuous financial support may limit the local governments’ incentive to persist in carbon emission reduction, given the context of resource scarcity.
To confirm the assumption of “Path Dependence” in local governments’ behavior preferences, we substitute the dependent variable with SO2 emission density, which is solely targeted by CCEEFP. The results from Models 3 and 4 demonstrate that SO2 emission density significantly decreases only in the scenario where LCP is implemented first, followed by CCEEFP. This finding supports the accuracy of the previous results.

6. Conclusions and Policy Implications

6.1. Conclusions

China’s achievements and policy instruments for carbon emission reduction have gradually garnered global attention. Most carbon emission reduction practices employ multiple policy instruments, which are alternately implemented to achieve their goals. This paper provides a comprehensive evaluation of the carbon emission reduction effects under a pilot policy mix, focusing on whether the LCP and CCEEFP policies are complementary or have a crowding-out effect. Additionally, this paper explores the emission reduction mechanisms and the evolutionary paths associated with the nested implementation of these pilot policies.
Our empirical results confirm that both the LCP and CCEEFP policies significantly promote carbon emission reduction. Moreover, the nested implementation of these policies demonstrates a collaborative effect, aligning with the analysis provided by Policy Process Theory. This collaboration ensures sustained emission reduction effects. Our heterogeneity analysis reveals that cities with higher administrative grades achieve better carbon emission reduction performance due to their greater resources and strong co-ordination capabilities. Additionally, regarding the carbon emission reduction mechanisms, source treatment technologies are more frequently utilized during the nested implementation of LCP and CCEEFP policies [58]. The evolution mechanism shows that the path dependence of earlier policies is evident when pilot policy combinations are implemented under resource scarcity constraints.

6.2. Policy Implications

The results offer three policy implications. First, the identified causal relationships between the LCP, CCEEFP policies, and carbon emission reduction suggest potential advantages for China in deploying these carbon abatement policies nationwide. These findings could also be extended to other developing countries to achieve the goals of “carbon peaking and carbon neutrality”. In order to realize sustained carbon emission reduction outcomes, it is essential to adopt related measures with source treatment technologies, such as green-innovation-oriented incentives, considering their long-term benefits.
Second, the collaborative effect of the nested implementation of LCP and CCEEFP is confirmed. However, simply increasing the number of carbon emission reduction policies may not necessarily enhance their effectiveness. According to policy process theory, only policies with complementary targets and incentive instruments can achieve collaborative effects. On one hand, the policy mix should be designed within an integrated governance framework, with subsequent policies supplementing the original policy targets. On the other hand, the policy mix should include complementary incentive instruments that facilitate the coordinated implementation of multiple policies. The combination of LCP and CCEEFP policies successfully achieves collaborative carbon reduction. Therefore, pre-evaluation of policy mixes should be conducted during the policy design process for local governments.
Third, it is essential to arrange a suitable order for policy mix implementation. Given the strong path dependence in local government’s attention and resource allocation, it is necessary to prioritize policies with more urgent targets. However, if a previous policy deviates from its original targets, additional resources should be invested in the subsequent supplementary policy to ensure its effective enforcement.

Author Contributions

Y.Z. (Yihang Zhao) conceived and designed the research question. Y.Z. (Yuanyuan Zhang) and S.W. constructed the models and analyzed the optimal solutions. Y.Z. (Yihang Zhao) and Y.Z. (Yuanyuan Zhang) wrote the paper. Y.Z. (Yuanyuan Zhang) and S.W. reviewed and edited the manuscript. All authors have read and agreed to the published version of the manuscript.

Funding

This work was supported by the Major Series Project of Shanghai Academy of Social Sciences (2024ZD023), Yancheng Philosophy and Social Science Planning Project (24skB12).

Institutional Review Board Statement

Not applicable.

Informed Consent Statement

Not applicable.

Data Availability Statement

Date are contained within the article.

Acknowledgments

We want to thank the anonymous referees for their constructive suggestions on the earlier draft of our paper, upon which we have improved the content.

Conflicts of Interest

The authors declare no conflicts of interest.

References

  1. Qian, Y.; Chakraborty, T.C.; Li, J.; Li, D.; He, C.; Sarangi, C.; Leung, L.R. Urbanization impact on regional climate and extreme weather: Current understanding, uncertainties, and future research directions. Adv. Atmos. Sci. 2022, 39, 819–860. [Google Scholar] [CrossRef] [PubMed]
  2. Chen, X.; Di, Q.; Jia, W.; Hou, Z. Spatial correlation network of pollution and carbon emission reductions coupled with high-quality economic development in three Chinese urban agglomerations. Sustain. Cities Soc. 2023, 94, 104552. [Google Scholar] [CrossRef]
  3. Huo, H.; Zhang, Q.; Wang, M.Q.; Streets, D.G.; He, K. Environmental implication of electric vehicles in China. Environ. Sci. Technol. 2010, 44, 4856–4861. [Google Scholar] [CrossRef]
  4. Wang, K.; Zheng, L.J.; Zhang, J.Z.; Yao, H. The impact of promoting new energy vehicles on carbon intensity: Causal evidence from China. Energy Econ. 2022, 114, 106255. [Google Scholar] [CrossRef]
  5. Banister, D.; Anderton, K.; Bonilla, D.; Givoni, M.; Schwanen, T. Transportation and the environment. Annu. Rev. Environ. Resour. 2011, 36, 247–270. [Google Scholar] [CrossRef]
  6. Van der Heijden, J. Experimentation in policy design: Insights from the building sector. Policy Sci. 2014, 47, 249–266. [Google Scholar] [CrossRef]
  7. Crespi, F.; Ghisetti, C.; Quatraro, F. Environmental and innovation policies for the evolution of green technologies: A survey and a test. Eurasian Bus. Rev. 2015, 5, 343–370. [Google Scholar] [CrossRef]
  8. Ossenbrink, J.; Finnsson, S.; Bening, C.R.; Hoffmann, V.H. Delineating policy mixes: Contrasting top-down and bottom-up approaches to the case of energy-storage policy in California. Res. Policy 2019, 48, 103582. [Google Scholar] [CrossRef]
  9. Greco, M.; Germani, F.; Grimaldi, M.; Radicic, D. Policy mix or policy mess? Effects of cross-instrumental policy mix on eco-innovation in German firms. Technovation 2022, 117, 102194. [Google Scholar] [CrossRef]
  10. Heilmann, S. From local experiments to national policy: The origins of China’s distinctive policy process. China J. 2008, 59, 1–30. [Google Scholar] [CrossRef]
  11. Eckert, S.; Börzel, T.A. Experimentalist governance: An introduction. Regul. Gov. 2012, 6, 371–377. [Google Scholar] [CrossRef]
  12. Cheng, C.; Li, C. Laboratories of democracy: Policy experimentation under decentralization. Am. Econ. J. Microecon. 2019, 11, 125–154. [Google Scholar] [CrossRef]
  13. Eisenhardt, K.M.; Graebner, M.E. Theory building from cases: Opportunities and challenges. Acad. Manag. J. 2007, 50, 25–32. [Google Scholar] [CrossRef]
  14. Sabel, C.F.; Zeitlin, J. Learning from difference: The new architecture of experimentalist governance in the EU. Eur. Law J. 2008, 14, 271–327. [Google Scholar] [CrossRef]
  15. McFadgen, B.; Huitema, D. Experimentation at the interface of science and policy: A multi-case analysis of how policy experiments influence political decision-makers. Policy Sci. 2018, 51, 161–187. [Google Scholar] [CrossRef] [PubMed]
  16. Pathak, M.; Shukla, P.R. Co-benefits of low carbon passenger transport actions in Indian cities: Case study of Ahmedabad. Transp. Res. Part D Transp. Environ. 2016, 44, 303–316. [Google Scholar] [CrossRef]
  17. Heilmann, S. Policy experimentation in China’s economic rise. Stud. Comp. Int. Dev. 2008, 43, 1–26. [Google Scholar] [CrossRef]
  18. Montinola, G.; Qian, Y.; Weingast, B.R. Federalism, Chinese style: The political basis for economic success in China. World Politics 1995, 48, 50–81. [Google Scholar] [CrossRef]
  19. Lau, L.J.; Qian, Y.; Roland, G. Reform without losers: An interpretation of China’s dual-track approach to transition. J. Political Econ. 2000, 108, 120–143. [Google Scholar] [CrossRef]
  20. Heilmann, S.; Shih, L.; Hofem, A. National planning and local technology zones: Experimental governance in China’s Torch Programme. China Q. 2013, 216, 896–919. [Google Scholar] [CrossRef]
  21. Eckerberg, K. Implementation of environmental protection in Swedish forestry: A policy perspective. For. Ecol. Manag. 1986, 17, 61–72. [Google Scholar] [CrossRef]
  22. Huque, A.S.; Watton, N. Federalism and the implementation of environmental policy: Changing trends in Canada and the United States. Public Organ. Rev. 2010, 10, 71–88. [Google Scholar] [CrossRef]
  23. Grossman, G.M.; Krueger, A.B. Economic growth and the environment. Q. J. Econ. 1995, 110, 353–377. [Google Scholar] [CrossRef]
  24. Zhao, Y.; Zhang, X.; Wang, Y. Evaluating the effects of campaign-style environmental governance: Evidence from Environmental Protection Interview in China. Environ. Sci. Pollut. Res. 2020, 27, 28333–28347. [Google Scholar] [CrossRef]
  25. Zhang, P.; Zhou, D.; Guo, J. Policy complementary or policy crowding-out? Effects of cross-instrumental policy mix on green innovation in China. Technol. Forecast. Soc. Change 2023, 192, 122530. [Google Scholar] [CrossRef]
  26. Li, X.; Yao, X. Can energy supply-side and demand-side policies for energy saving and emission reduction be synergistic?—A simulated study on China’s coal capacity cut and carbon tax. Energy Policy 2020, 138, 111232. [Google Scholar] [CrossRef]
  27. Dhanshyam, M.; Srivastava, S.K. Effective policy mix for plastic waste mitigation in India using System Dynamics. Resour. Conserv. Recycl. 2021, 168, 105455. [Google Scholar] [CrossRef]
  28. Costantini, V.; Crespi, F.; Palma, A. Characterizing the policy mix and its impact on eco-innovation: A patent analysis of energy-efficient technologies. Res. Policy 2017, 46, 799–819. [Google Scholar] [CrossRef]
  29. Zheng, J.; Shao, X.; Liu, W.; Kong, J.; Zuo, G. The impact of the pilot program on industrial structure upgrading in low-carbon cities. J. Clean. Prod. 2021, 290, 125868. [Google Scholar] [CrossRef]
  30. Zhuang, G. Policy design logic of low-carbon city pilots in China. China Popul. Resour. Environ. 2020, 30, 19–28. (In Chinese) [Google Scholar]
  31. Tian, S.; Sun, L.; Xu, Z.; Fan, Z. Research on the promoting function of fiscal policy for enterprise transformation and upgrading under green and low carbon development goal. Public Financ. Res. 2022, 474, 79–96. (In Chinese) [Google Scholar]
  32. Huang, H.; He, G.; Xiao, Y. Carbon emission reduction effect of the low-carbon city construction pilot program. Resour. Sci. 2023, 45, 1044–1058. (In Chinese) [Google Scholar] [CrossRef]
  33. Khanna, N.; Fridley, D.; Hong, L. China’s pilot low-carbon city initiative: A comparative assessment of national goals and local plans. Sustain. Cities Soc. 2014, 12, 110–121. [Google Scholar] [CrossRef]
  34. Jing, W.; Zhang, L. Environmental regulation, economic opening and China’s industrial green technology progress. Econ. Res. J. 2014, 9, 34–47. (In Chinese) [Google Scholar]
  35. Pu, Z.; Fu, J. Economic growth, environmental sustainability and China mayors’ promotion. J. Clean. Prod. 2018, 172, 454–465. [Google Scholar] [CrossRef]
  36. Chen, G.; Xu, J.; Qi, Y. Environmental (de) centralization and local environmental governance: Evidence from a natural experiment in China. China Econ. Rev. 2022, 72, 101755. [Google Scholar] [CrossRef]
  37. Ozusaglam, S.; Kesidou, E.; Wong, C.Y. Performance effects of complementarity between environmental management systems and environmental technologies. Int. J. Prod. Econ. 2018, 197, 112–122. [Google Scholar] [CrossRef]
  38. He, L.; Zhang, X. The distribution effect of urbanization: Theoretical deduction and evidence from China. Habitat Int. 2022, 123, 102544. [Google Scholar] [CrossRef]
  39. Yang, Z.; Gao, W.; Han, Q.; Qi, L.; Cui, Y.; Chen, Y. Digitalization and carbon emissions: How does digital city construction affect China’s carbon emission reduction? Sustain. Cities Soc. 2022, 87, 104201. [Google Scholar] [CrossRef]
  40. Chen, J.; Gao, M.; Cheng, S.; Hou, W.; Song, M.; Liu, X.; Liu, Y.; Shan, Y. County-level CO2 emissions and sequestration in China during 1997–2017. Sci. Data 2020, 7, 391. [Google Scholar] [CrossRef]
  41. Lee, K.; Leung, J.Y.; Pinedo, M.L. Coordination mechanisms with hybrid local policies. Discret. Optim. 2011, 8, 513–524. [Google Scholar] [CrossRef]
  42. Yu, Y.; Zhang, N. Low-carbon city pilot and carbon emission efficiency: Quasi-experimental evidence from China. Energy Econ. 2021, 96, 105125. [Google Scholar] [CrossRef]
  43. Jin, H.; Yang, J.; Chen, Y. Energy saving and emission reduction fiscal policy and corporate green technology innovation. Front. Psychol. 2022, 13, 1056038. [Google Scholar] [CrossRef] [PubMed]
  44. Laporte, A.; Windmeijer, F. Estimation of panel data models with binary indicators when treatment effects are not constant over time. Econ. Lett. 2005, 88, 389–396. [Google Scholar] [CrossRef]
  45. Chetty, R.; Looney, A.; Kroft, K. Salience and taxation: Theory and evidence. Am. Econ. Rev. 2009, 99, 1145–1177. [Google Scholar] [CrossRef]
  46. Wang, S.; Zhang, R.; Wan, L.; Chen, J. Has central government environmental protection interview improved air quality in China? Ecol. Econ. 2023, 206, 107750. [Google Scholar] [CrossRef]
  47. Heyman, F.; Sjöholm, F.; Tingvall, P.G. Is there really a foreign ownership wage premium? Evidence from matched employer–employee data. J. Int. Econ. 2007, 73, 355–376. [Google Scholar] [CrossRef]
  48. Li, L.; Zheng, Y.; Zheng, S.; Ke, H. The new smart city programme: Evaluating the effect of the internet of energy on air quality in China. Sci. Total Environ. 2020, 714, 136380. [Google Scholar] [CrossRef]
  49. Liu, Y.; Dong, F. How technological innovation impacts urban green economy efficiency in emerging economies: A case study of 278 Chinese cities. Resour. Conserv. Recycl. 2021, 169, 105534. [Google Scholar] [CrossRef]
  50. Wang, Y.; Wang, C.; Hong, J.; Nian, M. Natural conditions, administrative hierarchy and urban development in China. J. Manag. World 2015, 1, 41–50. (In Chinese) [Google Scholar]
  51. Cartier, C. A political economy of rank: The territorial administrative hierarchy and leadership mobility in urban China. J. Contemp. China 2016, 25, 529–546. [Google Scholar] [CrossRef]
  52. Wang, Y.; Zhao, Y. Is collaborative governance effective for air pollution prevention? A case study on the Yangtze river delta region of China. J. Environ. Manag. 2021, 292, 112709. [Google Scholar] [CrossRef]
  53. Tan, R.; He, Q.; Zhou, K.; Song, Y.; Xu, H. Administrative hierarchy, housing market inequality, and multilevel determinants: A cross-level analysis of housing prices in China. J. Hous. Built Environ. 2019, 34, 845–868. [Google Scholar] [CrossRef]
  54. Fan, Z.; Zhao, R. Does rule of law promote pollution control? Evidence from the establishment of the environmental court. Econ. Res. J. 2019, 54, 31–37. (In Chinese) [Google Scholar]
  55. Liu, X.; Li, Y.; Chen, X.; Liu, J. Evaluation of low carbon city pilot policy effect on carbon abatement in China: An empirical evidence based on time-varying DID model. Cities 2022, 123, 103582. [Google Scholar] [CrossRef]
  56. Zeng, S.; Jin, G.; Tan, K.; Liu, X. Can low-carbon city construction reduce carbon intensity? Empirical evidence from low-carbon city pilot policy in China. J. Environ. Manag. 2023, 332, 117363. [Google Scholar] [CrossRef]
  57. Xue, F.; Chen, X. The carbon emission reduction effect of green fiscal policy: Evidence from the “National Comprehensive Demonstration City of Energy Saving and Emission Reduction Fiscal Policy”. J. Financ. Econ. 2022, 48, 79–93. (In Chinese) [Google Scholar]
  58. Wan, A.; Huang, Y. Carbon reduction technology selection mechanisms for low-carbon cities and innovative cities. China Polpulation Resour. Environ. 2024, 34, 23–31. (In Chinese) [Google Scholar]
Figure 1. Distribution of pilot cities with LCP and CCEEFP policies.
Sustainability 16 06529 g001
Figure 2. The nested implementation of the LCP and CCEEFP policies in China.
Sustainability 16 06529 g002
Figure 3. Research framework.
Sustainability 16 06529 g003
Figure 4. Parallel trend test of LCP policy.
Sustainability 16 06529 g004
Figure 5. Parallel trend test of CCEEFP policy.
Sustainability 16 06529 g005
Figure 6. Parallel trend of nested implementation.
Sustainability 16 06529 g006
Figure 7. Placebo test for LCP.
Sustainability 16 06529 g007
Figure 8. Placebo test for CCEEFP.
Sustainability 16 06529 g008
Figure 9. Placebo test for nested pilot policies.
Sustainability 16 06529 g009
Table 1. The comparison of LCP and CCEEFP according to policy process theory.
Pilot PoliciesPolicy TargetPolicy ImplementationPolicy EvaluationPolicy Termination
LCPCarbon emission reductionWeak incentive and soft constraint (publicity, communication and evaluation, capacity building)Task decomposition;
Self-assessment
Batch piloting
CCEEFPCarbon emission reduction;
Pollutant emission reduction
Strong incentive and strict measures (financial support and top-down environmental regulation)Refining evaluation indictors;
Top-down assessment;
Public supervision.
Competitive adjustment;
Deduction of funds
Table 2. Descriptive statistics.
VariablesCategoryObsMeanS.D.MinMax
co2_denDV42450.02570.0170.0020.127
co2424527.30424.1341.845230.712
so2_den424580.777172.11404930.267
DID_LCPKV42450.2180.41301
DID_CCEEFP42450.04270.20201
DID_nested42450.02470.15501
pop_denCV4245430.61331.5294.72648.11
gdp42451585.3862258.1475225,388.3
foreign_gdp424529.41928.5390.02311.13
second42450.4890.1070.1480.91
energy_coms424520.61815.2840.36694.494
coal_coms42450.9980.3640.06922.345
Note: DV denotes the dependent variables; KV denotes the key explanatory variables and it contains the dummy variables of the LCP and CCEEFP implementation and their interaction term; CV is the control variables in main regressions.
Table 3. Baseline estimates.
VariableModel 1Model 2Model 3
DID_LCP−0.00143 ***
(−5.32)
DID_CCEEFP -0.00173 ***
(−3.74)
DID_nested −0.00118 **
(−1.98)
pop_den−1.69 × 10⁻⁷−6.87 × 10⁻⁸−2.78 × 10⁻⁸
(−0.16)(−0.06)(−0.03)
gdp−1.27 × 10⁻⁶ ***−1.35 × 10⁻⁶ ***−1.39 × 10⁻⁶ ***
(−13.66)(−14.89)(−15.18)
foreign_gdp−0.00003 ***−0.00003 ***−0.00003 ***
(−6.58)(−5.93)(−5.96)
second0.0143 ***0.0135 ***0.0138 ***
(8.92)(8.37)(8.56)
energy_coms0.00069 ***0.00071 ***0.00071 ***
(54.07)(57.87)(58.12)
coal_coms−0.00137 *−0.00163 **−0.00168 **
(−1.93)(−2.31)(−2.37)
Constant0.00871 ***0.00879 ***0.00864 ***
(6.32)(6.36)(6.24)
City FEYesYesYes
Year FEYesYesYes
Observations424542454245
R-squared0.19610.18880.1881
Note: robust T-values are given in parentheses; * indicates p < 0.10, ** indicates p < 0.05, *** indicates p < 0.01.
Table 4. Other robustness tests.
Replacing Dependent VariablePSM-DIDFour Municipalities Excluded
Model 1Model 2Model 3Model 4Model 5Model 6Model 7Model 8Model 9
DID_LCP−0.933 *** −0.0014 ** −0.00082 ***
(−3.59) (−2.09) (−3.02)
DID_CCEEFP −1.28 *** −0.00299 *** −0.00098 **
(−3.04) (−2.93) (−2.47)
DID_nested −1.578 *** −0.00254 * −0.00297 ***
(−2.81) (−1.77) (−5.65)
Control variablesYesYesYesYesYesYesYesYesYes
City FEYesYesYesYesYesYesYesYesYes
Year FEYesYesYesYesYesYesYesYesYes
Observations424542454245329840574137418541854185
R-squared0.67980.69270.68160.08250.14210.24390.66340.17850.4219
Note: robust T-values are given in parentheses; * indicates p < 0.10, ** indicates p < 0.05, *** indicates p < 0.01.
Table 5. Heterogeneity test of administrative grade.
Administrative GradeModel 1Model 2Model 3Model 4Model 5Model 6
Low CitiesHigh CitiesLow CitiesHigh CitiesLow CitiesHigh Cities
DID_LCP−0.00065 **−0.00121 **
(−2.21)(−2.54)
DID_CCEEFP −0.00097 *−0.00297 ***
(−1.68)(−5.65)
DID_nested −0.000386 ***−0.00336 ***
(−2.64)(−5.03)
pop_den1.01 × 10−66.41 × 10⁻⁶ ***−1.78 × 10−67.17 × 10−6 ***4.22 × 10−77.35 × 10−6 ***
(1.38)(5.42)(−1.49)(5.68)(0.71)(5.56)
gdp−2.91 × 10⁻⁶ ***−9.06 × 10⁻⁸−2.76 × 10⁻⁶ ***−6.90 × 10−81.58 × 10−7−1.96 × 10⁻⁸
(−14.48)(−0.70)(−17.29)(−0.60)(1.04)(−0.16)
foreign_gdp−0.00004 ***−0.00003 ***−0.00004 ***−0.00002 ***−0.00003 ***−0.00002 ***
(−6.69)(−4.70)(−7.70)(−4.44)(−6.20)(−4.37)
second0.0097 ***0.0124 **0.0108 ***0.0131 **0.002240.00953
(4.90)(1.97)(6.45)(2.13)(1.07)(1.57)
energy_coms0.00069 ***0.00273 ***0.00066 ***0.00259 ***0.000314 ***0.00262 ***
(28.51)(6.98)(49.83)(7.60)(9.42)(7.79)
coal_coms−0.00749 ***0.00545 ***−0.00277 ***0.00493 ***−0.00867 ***0.0054 ***
(−7.41)(3.56)(8.99)(3.28)(−9.02)(3.53)
City FEYesYesYesYesYesYes
Year FEYesYesYesYesYesYes
Observations372052537205253720525
R-squared0.68450.36960.67840.42190.16770.4234
Note: robust T-values are given in parentheses; * indicates p < 0.10, ** indicates p < 0.05, *** indicates p < 0.01.
Table 6. The carbon emission reduction mechanism analysis.
Carbon Emission Reduction MechanismInfrastructureGreenInfrastructureGreenInfrastructureGreen
Model 1Model 2Model 3Model 4Model 5Model 6
DID_LCP1.1572.238 ***
(1.33)(2.62)
DID_CCEEFP 2.631 ***2.517 ***
(3.52)(2.93)
DID_nested 2.054 **3.101 ***
(2.22)(2.98)
Control variablesYesYesYesYesYesYes
City FEYesYesYesYesYesYes
Year FEYesYesYesYesYesYes
Observations424542454245424542454245
R-squared0.13160.52180.11850.30710.20240.4146
Note: robust T-values are given in parentheses; ** indicates p < 0.05, *** indicates p < 0.01.
Table 7. The nested evolution path analysis of LCP and CCEEFP.
Nested Evolution MechanismCO2_denSO2_den
LCP First, Then CCEEFPCCEEFP First, Then LCPLCP First, Then CCEEFPCCEEFP First, Then LCP
Model 1Model 2Model 3Model 4
DID−0.00396 ***−0.00155 *−37.154 ***−20.858
(−5.88)(−1.72)(−5.13)(−1.45)
Control variablesYesYesYesYes
City FEYesYesYesYes
Year FEYesYesYesYes
Observations900315900315
R-squared0.64180.55740.65150.4930
Note: robust T-values are given in parentheses; * indicates p < 0.10, *** indicates p < 0.01.
Disclaimer/Publisher’s Note: The statements, opinions and data contained in all publications are solely those of the individual author(s) and contributor(s) and not of MDPI and/or the editor(s). MDPI and/or the editor(s) disclaim responsibility for any injury to people or property resulting from any ideas, methods, instructions or products referred to in the content.

