Review

The Use of Agricultural Databases for Crop Modeling: A Scoping Review

by
Thando Lwandile Mthembu
1,*,
Richard Kunz
1,
Shaeden Gokool
1 and
Tafadzwanashe Mabhaudhi
1,2,3
1
Centre for Water Resources Research, School of Agricultural, Earth & Environmental Science, University of KwaZulu-Natal, Private Bag X01, Scottsville, Pietermaritzburg 3209, South Africa
2
Centre for Transformative Agricultural and Food Systems, School of Agricultural, Earth & Environmental Sciences, University of KwaZulu-Natal, Private Bag X01, Scottsville, Pietermaritzburg 3209, South Africa
3
Centre on Climate Change and Planetary Health, London School of Hygiene and Tropical Medicine, London WC1E 7HT, UK
*
Author to whom correspondence should be addressed.
Sustainability 2024, 16(15), 6554; https://doi.org/10.3390/su16156554
Submission received: 1 July 2024 / Revised: 25 July 2024 / Accepted: 30 July 2024 / Published: 31 July 2024
(This article belongs to the Special Issue Sustainable Agriculture Development: Challenges and Oppotunities)

Abstract

:
There is growing interest in promoting neglected and underutilized crop species to enhance agrobiodiversity and contribute to food systems transformation under climate change. A lack of available measured data has hindered the mainstreaming of these crops and limited the ability of agricultural databases to be used for calibrating and validating crop models. This study conducts a systematic scoping review and bibliometric analysis to assess the use of agricultural databases for crop modeling. The Biblioshiny App v4.1.2 and VOSviewer software v1.6.20 were used to analyze 51 peer-reviewed articles from Scopus and Web of Science. Key findings from this review were that agricultural databases have been used for estimating crop yield, assessing soil conditions, and fertilizer management and are invaluable for developing decision support tools. The main challenges include the need for high-quality datasets for developing agricultural databases and more expertise and financial resources to develop and apply crop and machine learning models. From the bibliometric dataset, only one study used modeled data to develop a crop database despite such data having a level of uncertainty. This presents an opportunity for future research to improve models to minimize their uncertainty level and provide reliable data for crop database development.

1. Introduction

Crop production is affected by climatic variability, soil fertility, weed development, and excessive water usage [1,2,3]. There is a strong link between changes in rainfall patterns and land degradation due to issues, including but not limited to extreme climatic events such as floods and droughts [4,5]. This highlights the importance of identifying and promoting the cultivation of crops with characteristics suitable to withstand the negative impacts of climate change.
Crop modeling involves the use of mathematical and computational approaches to simulate crop development [6]. It assists in assessing climate change impacts, optimizing agricultural practices, enhancing food security, and informing policy through integrating soil, weather, and crop physiological data [7]. Once crop models have been calibrated using measured data, they can reduce field experiment expenses by simulating crop development data such as water use and yield across variable agroecologies [7,8]. However, they cannot be considered substitutes for field experiments [7].
Despite the projection of being unable to meet the future food demands of the ever-growing population, major staple crops, such as maize, rice, and wheat, remain widely promoted at the commercial scale even though they are highly susceptible to the impacts of climate change [9]. Since there has been an over-dependence on these major staple crops, there is limited knowledge and understanding of neglected and underutilized crop species (NUS) such as cassava, cowpea, bambara groundnut, sweet potato, and taro across different agroecologies. This is a major problem as it has hindered the promotion and production of NUS at the commercial scale despite their potential benefits of being nutrient-dense while consuming water efficiently and producing adequate yields [8].
The shortage of information about nutritional value, potential yield, and water use characteristics of NUS has made their commercial adoption risky [9] and hindered the accuracy of crop model simulations. Therefore, addressing this knowledge gap requires incorporating in situ data about these crops into an accessible database [10]. Making such information available to farmers or agricultural practitioners can promote the cultivation of NUS and guide and inform management practices about their cultivation [10]. Information related to the cultivation of NUS, such as climate, soil, and crop development data, can be obtained from field trials [7]. These data are vital for developing parameter files used in crop models to simulate temporal and spatial crop growth under variable climatic and land use scenarios [11,12].
Modi and Mabhaudhi [13] advised the increased modeling of the water requirements and potential yield of NUS using crop growth models, especially across different agroecologies. These models require some baseline information as inputs before performing any modeling scenario [7,13]. Therefore, the limited information on NUS may be utilized to generate outputs for various scenarios. This can provide invaluable information for developing extensive crop databases to guide and inform precision agricultural practices. The outcome of NUS modeling research may contribute to the commercial promotion of these crops, which may aid in alleviating food insecurity and malnutrition, especially for people living in rural areas and with low-income levels [8,14]. Furthermore, promoting NUS may improve crop diversification, broadening the food basket through improved yield production.
The development of agricultural databases, which are a collection of structured information related to crop water use, yield, and nutritional value, has assisted farmers by providing informative crop-related data, which are suitable to answer pre-planting questions [10,15]. Most agricultural databases consist of measured data for major food crops [10]. This highlights the research gap of extremely limited databases of measured data related to NUS. This has presented opportunities for incorporating digital technologies such as crop simulation and machine learning models in research about crop database development. Furthermore, this may assist in influencing farmers to make well-informed decisions related to promoting these crops [3,13].
To this end, a systematic scoping review was conducted to provide a bibliometric and systematic evaluation of the use of agricultural databases for crop modeling purposes to guide and inform farmers’ decision-making. Bibliometric analysis can assess scientific data from published research [16,17]. It can also structure the evolution of various research focus areas. The specific objectives of this review were to assess the following:
  • availability and use of measured data in agricultural database development and evaluation; and
  • application of agricultural databases.
The above was then used to identify potential opportunities to explore in future research. It is expected that outcomes from this review will complement the existing knowledge base on this topical research focus area. This review may assist developing nations that lack sufficient resources to conduct field trials by informing measures to maximize limited measured data through crop modeling to ultimately develop and apply agricultural databases.
This review is divided into five sections. A background related to the review is presented in Section 1. The approaches used to select and assess relevant literature are provided in Section 2. In Section 3, the key findings of the bibliometric analysis are detailed. The review’s objectives are concisely discussed in Section 4, and conclusions of the study are provided in Section 5.

2. Materials and Methods

This study was structured in sections that focused on (i) establishing developments in using or developing agricultural databases for crop modeling purposes and (ii) highlighting current challenges and opportunities to address them using modeling approaches.

2.1. Literature Search, Article Selection, and Eligibility Analysis

This systematic review adhered to the Preferred Reporting Items for Systematic Reviews and Meta-Analyses (PRISMA) guidelines [18,19]. The Scopus [20] and Web of Science [21] abstract and citation databases were used to search for published peer-reviewed literature on 29 March 2024. From both Scopus and Web of Science, bibliometric datasets were developed using a search query string that consisted of the following keywords: “crop modeling/modelling” AND “database”. A global search was conducted to encompass peer-reviewed literature from researchers on a worldwide scale. No geographic limitations or time restrictions were applied when searching due to the limited information available on this research focus area, allowing for a wider search criterion. However, articles not written in English were excluded from the search results. The selected peer-reviewed literature encompassed original research articles to ensure consistency in evaluating the impact of original contributions in this research focus area. The search results retrieved 67 and 30 references from Scopus and Web of Science, respectively. These references (n = 97) were then exported into two BibTeX files, which were imported into the R environment using the Bibliometrix-R package v4.3.0. A single dataset of all retrieved references was compiled before they were screened for eligibility. The screening process involved using the Preferred Reporting Items for Systematic Reviews and Meta-Analyses extension for Scoping Reviews (PRISMA-ScR) framework [22], which is based on the PRISMA guidelines to guide the selection of articles to include and exclude from the literature review, as shown in Figure 1.
A total of 19 duplicate articles were identified and excluded from the review process. Biased reporting in the review was reduced by defining eligibility criteria and following the PRISMA-ScR framework to guide the selection of studies to include and exclude from the review. Data from the articles were analyzed using the eligibility criteria for the review, which were based on (i) studies that focus on using and/or developing agricultural databases based on in situ or modeled data and (ii) articles that were accessible and available for download. These eligibility criteria excluded a further 15 articles from the review process. The screening process, therefore, yielded 63 articles deemed suitable for the review, of which 12 could not be accessed (i.e., downloaded); thus, the final bibliometric dataset consisted of 51 articles. To ensure that the eligibility criteria of the PRISMA-ScR framework were met, two additional independent researchers assessed the remaining 51 articles included in this literature review. In addition to the information provided by the bibliometric analysis, additional literature (grey and academic) not captured by the search query string but found relevant by the co-authors was included in the review. This included both original research articles and review articles. The inclusion of review articles was influenced by their comprehensive nature and broad appeal, making them likely to receive more citations relative to original research articles.

2.2. Analyses Conducted to Identify Research Developments, Challenges, and Potential Opportunities

Selected articles from the literature search were used to (i) assess the use and/or development of agricultural databases and their influence on crop modeling and (ii) identify current challenges and potential opportunities in this research field. Despite the final bibliometric dataset consisting of only 51 articles, a bibliometric analysis was conducted as it remains a valuable tool for assessing trends associated with key thematic areas, global distribution of articles over time, and author collaborations in specified research focus areas [23]. The analysis of citation patterns, keywords, and collaboration networks aids in gaining insight into the development and dissemination of information, even within a limited dataset [24]. Furthermore, bibliometric analysis is a valuable tool for identifying highly influential papers and emerging research topics, which is important for comprehending the current and future directions of a specified research field [23]. The selected articles were, therefore, analyzed using the Biblioshiny App and VOSviewer software [25,26]. The Biblioshiny App was leveraged to generate author citation analyses, thematic author keyword and keyword plus graphs, and a global publication and collaboration distribution map. Additionally, VOSviewer was used to perform a co-occurrence analysis of key terms that highlight prominent thematic areas. Due to the bibliometric analysis leveraging an occurrence and co-occurrence of key terms and providing computed frequency distributions, a bias assessment was not conducted.
To adequately address the review’s objectives, Section 3 highlights the developments made in this research field. Section 4 of the review provides a critical analysis and interpretation of the results. The main thematic areas prominent in this research field are also assessed in this section. Contributions to new knowledge and potential opportunities that may be explored in the future, based on the identified research gaps, are also presented in Section 4 and Section 5 of the review.

2.3. Limitations of the Review

The literature search may have excluded studies suitable for this review due to the search query string used. Only literature published in English from two citation databases (e.g., Scopus and Web of Science) was sought. This limited the ability to access relevant literature published in other languages from other citation databases. Despite this, the findings reported in this review were based on various research contributions that provided sufficient information to form meaningful conclusions.
It is important to note that the findings presented in this review may be constrained due to the subjective criteria and methods employed to source and assess the literature. Despite this, it is envisaged that this review will promote and enhance the existing knowledge base and encourage further interest in this emerging research field.

3. Results

The results of the bibliometric analysis reflect the use of agricultural databases for crop modeling purposes. Key thematic areas identified and the global distribution of publications are presented next, including author collaborations in this research focus area.

3.1. Historical Evolution

A summary of important information obtained from the final bibliometric dataset is presented in Table 1. “Author keywords” refer to those selected by each author that best describe their publication, while “Keywords plus” identifies words or phrases appearing in titles of references within each publication, excluding the publication’s title and author keywords [27].
Research related to agricultural databases’ use (or development) in crop modeling first emerged in 1999 and has gradually increased at a growth rate of 4.68% per year. The highest number of articles published in a single year was six in 2021 (blue bars in Figure 2). For all articles, the average number of total citations per year peaked at 10.68 in 2002 (orange bars in Figure 2), whereas the average number of total citations per article was also highest in 2002 (purple line in Figure 2). Citable years, which peaked at 25 (grey bars in Figure 2), represent the number of years in which publications are considered eligible for citation. Researchers use this metric to track and assess a publication’s impact and influence over time.

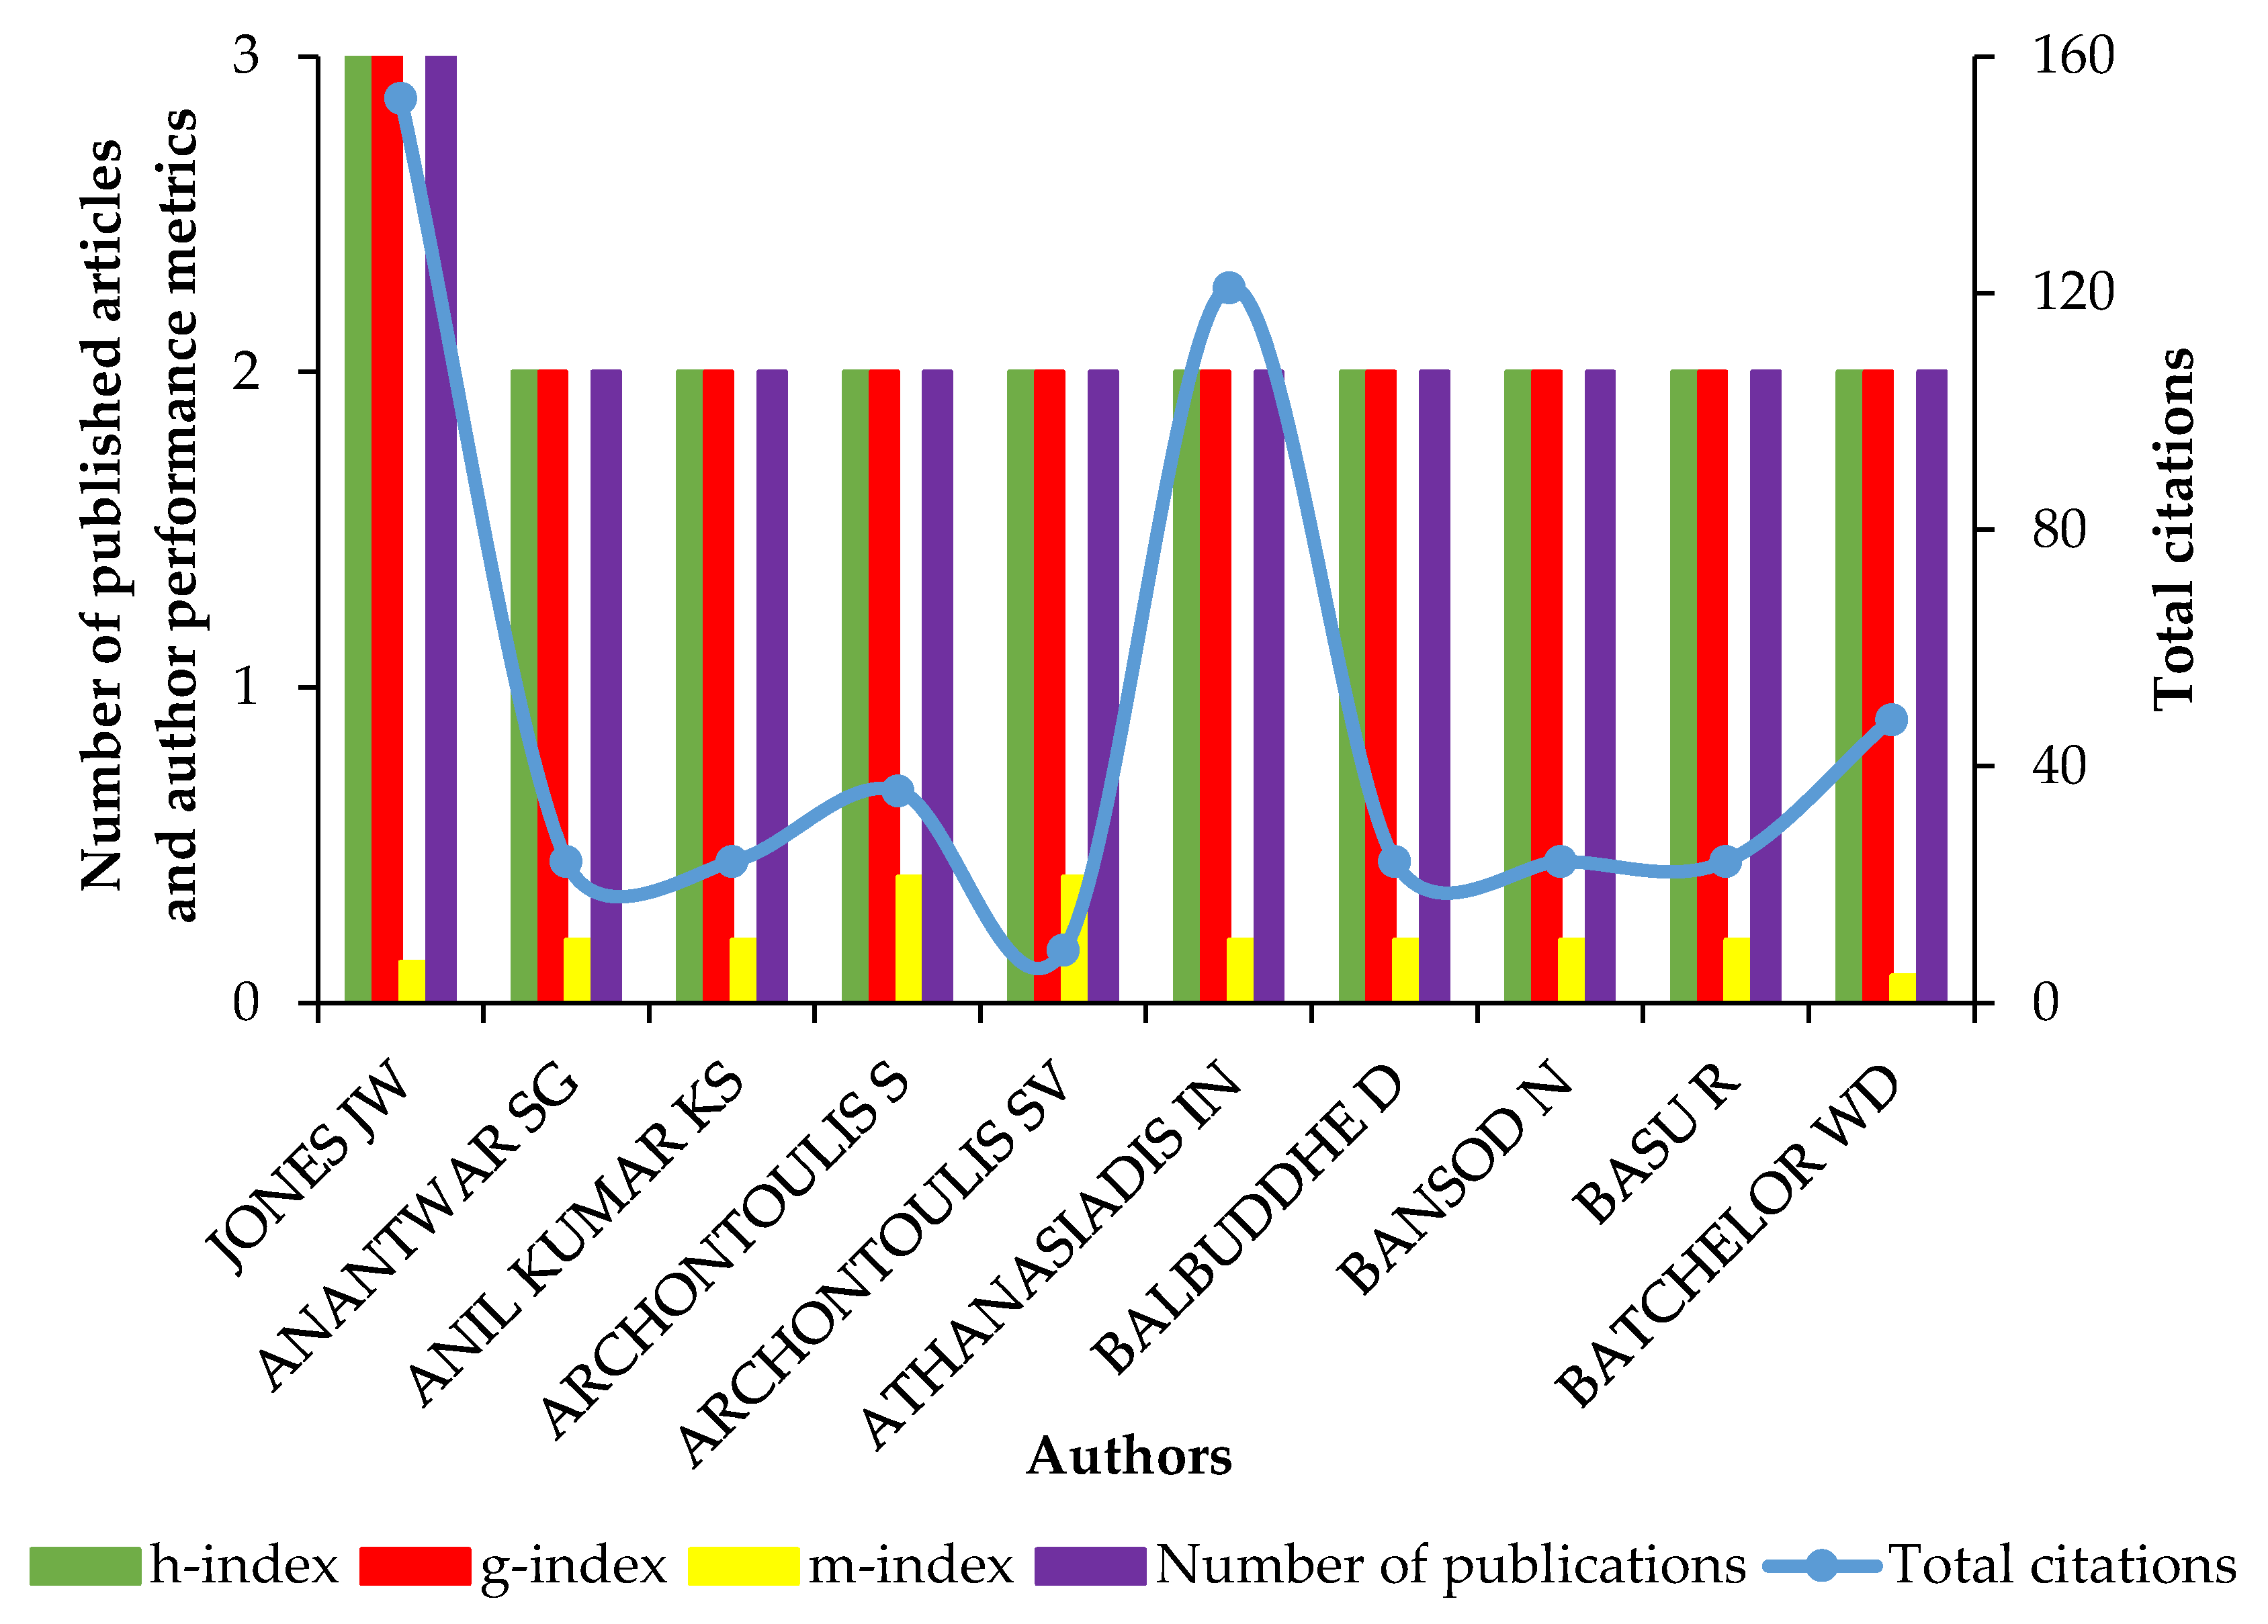
3.2. Analysis of Authors by Publication Citations

A total of 350 authors contributed to the 51 reviewed publications (Table 1). Performance metrics for the top ten authors that published more than one article are presented in Figure 3. James Jones and Ioannis Athanasiadis are the most cited authors, with 153 and 121 citations, respectively, due to their pioneering research in crop modeling and agricultural systems. James Jones is a leading researcher focused on developing and applying crop models to enhance agricultural productivity and sustainability [28,29]. Such research highlights the importance of improving agricultural decision support systems through integrating biophysical and socio-economic data [28,29]. Ioannis Athanasiadis is a prominent author involved in agricultural system and environmental software research, emphasizing the importance of developing innovative computational methods to improve agricultural decision-making [30].
The h-, g-, and m-indices assess the quality and significance of each author’s publications and are specific to the selected research focus area. The h- and g-indices quantify the impact and productivity of an author’s research outputs [31]. The g-index also focuses on highly cited publications [32]. Dividing the author’s h-index by the number of years since their work was first published forms the m-index. The latter measures academic research performance by evaluating a researcher’s collaboration and co-authorship patterns [32].
Table S1 in the Supplementary Material presents an analysis of selected publications according to their total citations (TCs), TCs per year, and normalized TCs. The study conducted by Brisson et al. [33], which evaluated the performance of the STICS (Simulator mulTIdisciplinary for Crop Standard [34]) model in simulating wheat and maize yield, received the highest number of TCs. It was one of the top three studies with more than 10 TCs per year and was moderately ranked in terms of the normalized citation performance metric. It is highly cited due to detailing robust methodologies that use multiple crop models to assess climate change impacts on agricultural productivity. The normalized citation performance metric is determined by comparing a publication’s citation count to the average citation count of publications in the same research focus area, year, and document type. This metric is a valuable indicator in a bibliometric analysis as it allows for the assessment of variations in citation practices across diverse fields and time periods, provisioning equitable measures of impact [35]. Other most cited authors in this research focus area include Helder Fraga, Dilli Paudel, Pytrik Reidsma, and Jeffrey White. The most widely used journal was Computers and Electronics in Agriculture due to its specialization in promoting research that applies technological and computational approaches to enhance agricultural practices, making it important for studies focused on crop modeling and precision agriculture.

3.3. Assessment of Author Keyword and Keyword Plus Frequency and Co-Occurrence

Figure 4 presents the 10 most frequently used author keywords (cf. Section 3.1), with “crop modelling” and “crop modeling” being used the most due to their inclusion in the search query string used to identify publications considered in this review. These keywords indicate that crop simulation models such as the Agricultural Production Systems Simulator (APSIM [36]) have been widely used to assess the impacts of climate change on staple crops such as wheat, maize, and soybean. For adequate calibration, crop models such as APSIM require extensive in situ data [36], which are widely available for major staple crops due to their high commercial interest and demand. However, this is not the case for NUS due to their limited research focus.
From Figure 5, “crop yield”, “database”, “agricultural modelling”, “climate change”, and “evapotranspiration” are among the top twenty words appearing in titles of references within a publication, i.e., defined as keywords plus (cf. Section 3.1). Phrases such as “crop yield”, “evapotranspiration”, “climate change”, and “soil water” highlight various forms of data that may be simulated using crop models that were calibrated using input data sourced from agricultural databases. The terms “crop modelling” (author keyword) and “agricultural modelling” (keyword plus) suggest the main use of agricultural databases. From Figure 5, the majority of papers modeled maize (Zea mays), wheat (Triticum aestivum), and soybean (Glycine max) in Europe. The centralization of major staple crop modeling in Europe reflects the substantial resources and infrastructure available to conduct agricultural research in the Global North relative to the Global South, which may lack such resources [37]. The absence of NUS in Figure 5 further highlights how under-researched they are due to insufficient field trials conducted and their low commercial interest [38].
A keyword co-occurrence network was performed on 41 of the 209 author keywords (Table 1) that appeared at least four times using VOSviewer version 1.6.20 [26]. In Figure 6, each node’s size represents each theme’s relevance. The line length between two nodes represents the robustness of their relationship. The co-occurrence analysis identified four clusters of related words/phrases (e.g., colored blue, yellow, green, and red). The blue cluster highlights crop simulation models for mainly maize and wheat in Europe. For example, Brisson et al. [33] developed an agronomic database for maize and wheat grown in France across different agroecological zones, which contained data on, inter alia, crop variety, sowing date, and plant density, as well as climate, soil, irrigation, and nitrogen fertilizer requirements. Furthermore, the authors used the database to define crop phenological stages (e.g., emergence, flowering, and physiological maturity) for both crops. The database was used to calibrate and validate the STICS model, which was then run to predict maize and wheat yields.
The yellow cluster highlights the use of databases to provide input data for crop models to simulate the impacts of climate change on crop evapotranspiration (i.e., crop water use). For example, Duveiller et al. [39] used the MARS Crop Yield Forecasting System (MCYFS) [40] to develop a database of future European weather datasets to reduce uncertainty in climate change and agricultural analyses to guide and inform policymaking. The database provides short-term (e.g., 2020 to 2030) weather data that can be used as input data for crop models, enabling their output to assess the impact of changing climatic conditions on crop water use and growth.
The green cluster in Figure 6 highlights the use of remote sensing to provide input data (e.g., leaf area index) for crop models for simulating biomass and yield of soybeans in the United States of America (USA). For example, Wu et al. [41] conducted field trials in China over four years to measure the leaf area index, biomass, and yield of 72 soybean varieties. Key parameters defining crop phenological growth stages (i.e., flowering and maturity) were also developed. Climate, soil, and crop physiological data were inputted into APSIM to provide leaf area index, biomass, and yield simulations across diverse environments.
The red cluster in Figure 6 highlights the need for soil data and crop parameters to run crop models. For example, Wimalasiri et al. [42] used APSIM to simulate rice yields with soil data from both the Soilgrids [43,44] and Openlandmap [45] databases. Furthermore, Nehbandani et al. [46] assessed the quality of measured soil data in the HC27 database [47] as input for the SSM-iCrop2 [48] model to perform crop biomass and yield predictions. The red cluster, therefore, supports the finding that the main use of agricultural databases was to provide soil rather than crop physiological information to facilitate crop modeling (e.g., [42,46,49,50]).

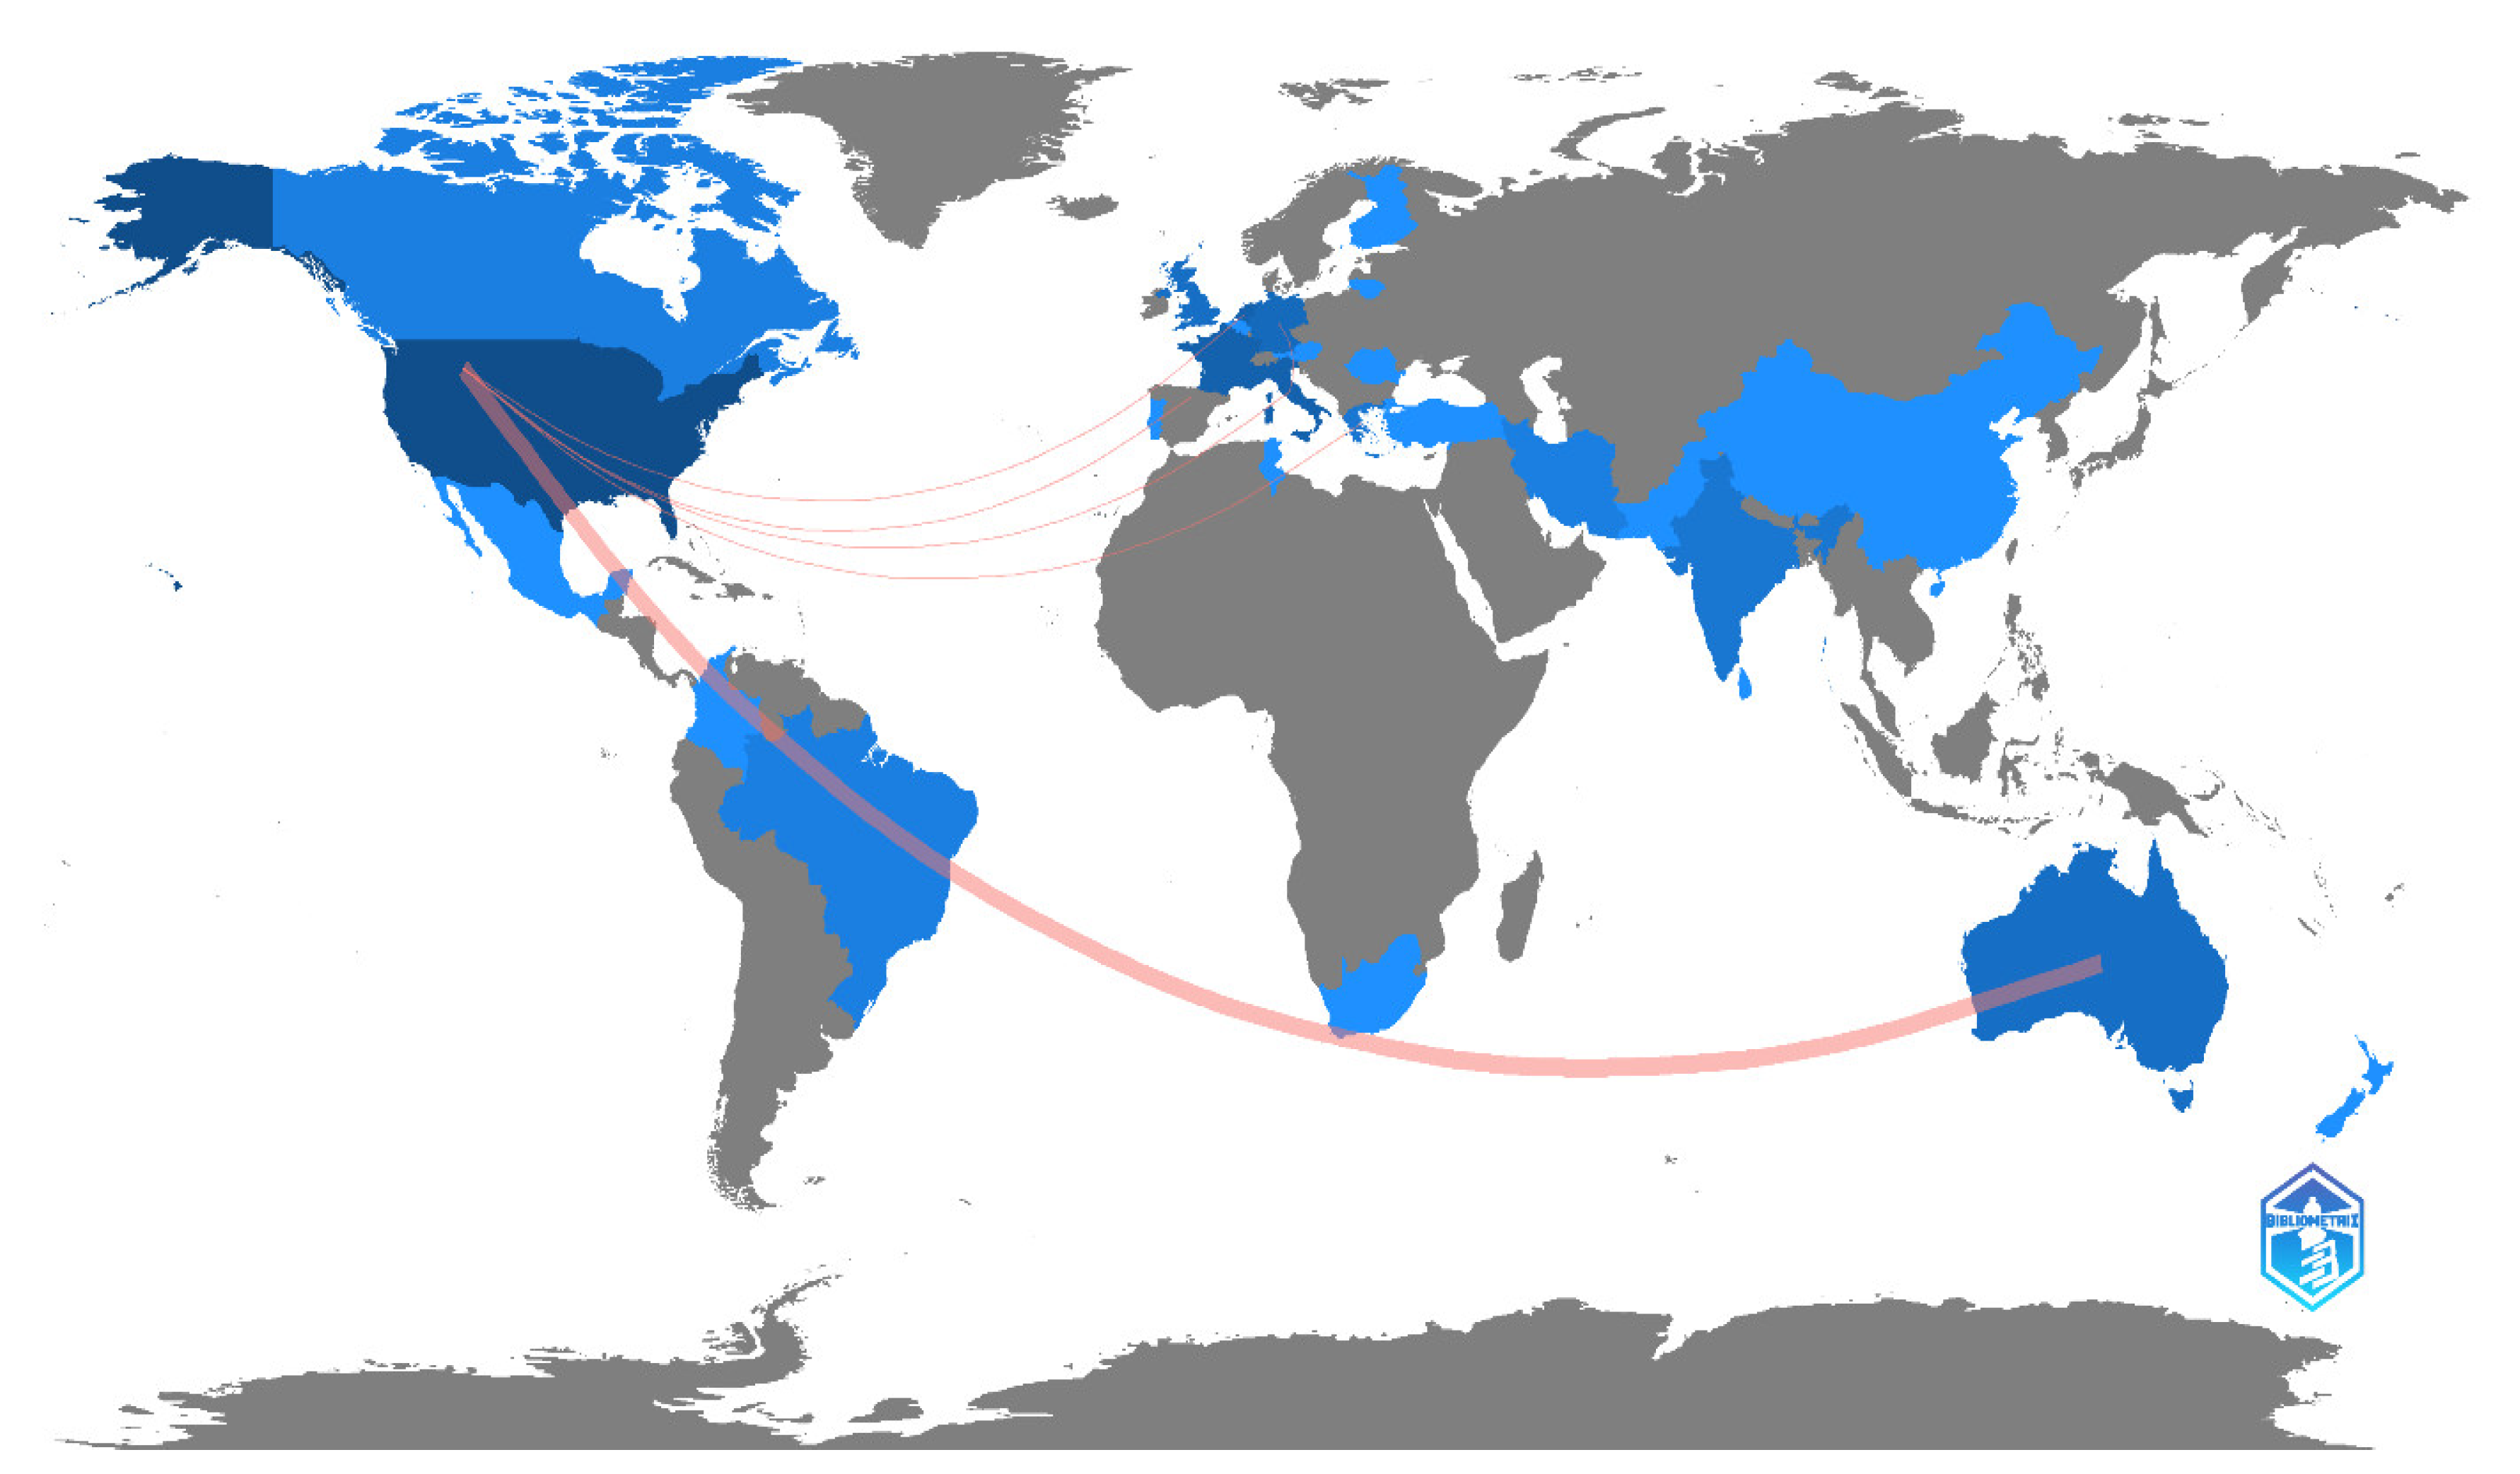
3.4. Analysis of Global Distribution of Publications and Collaborations

The global distribution of published research on the use of agricultural databases in crop modeling is presented in Figure 7. The darker the shade of blue, the higher the number of publications from that country, while the lines represent the level of international collaboration between authors from each country. A total of 26 countries are involved in this research field, with the USA producing the most publications (and the highest TCs and average citations per publication), followed by France, Australia, and the Netherlands.
Most of the collaborations between authors from different countries only produced one publication. However, collaborations between authors from Italy and Germany, Australia and the USA, France and the USA, Greece and the USA, Italy and the USA, and the Netherlands and the USA produced thirteen publications, accounting for 22% of the total. The most international collaborations (3) occurred between Australia and the USA. South Africa is the only African country in the Global South involved in this research focus area, with only one publication involving authors from the Netherlands (Figure 7). Studies by van Ittersum et al. [51,52] demonstrated extensive involvement in crop modeling, climate change, and sustainable agricultural research due to the availability of substantial funds, collaborative networks, and high-quality research infrastructure. Similarly, the United States Department of Agriculture and institutions such as the University of California, Davis, in the USA, have made substantial contributions to crop modeling and precision agricultural research [53]. This highlights a disparity within this research focus area between the Global South relative to the Global North.

4. Discussion

The previous section provided results of a bibliometric and systematic evaluation to assess the use of agricultural databases for crop modeling purposes. Clusters of themes that explained the use of agricultural databases were identified. The development and use of databases storing (i) crop parameters and (ii) soil data were among the broad themes identified, along with assessing climate change impacts on crop production. This is expected since crop models can only be run with the necessary climate and soil data inputs, including reliable crop parameters.
From the bibliometric analysis, soil databases were used more prominently than climate or crop physiological datasets. This may be due to the latter two datasets being more readily available and accessible, as well as being easier to develop from in situ measurements and remote sensing, whereas soil information may be less readily available. Hence, most reviewed studies used digital soil databases for crop modeling since obtaining soil parameters for multiple grid points across large fields can be expensive and impractical [15].

4.1. Soil Data for Crop Modelling

Wimalasiri et al. [42] highlighted the wide availability of climate data in local, regional, and global databases, unlike observed soil data, which is mostly unavailable, thus making it difficult to perform accurate crop model simulations. Global soil databases such as HC27 consist of measured soil data and have been developed for crop and hydrological modeling to address the paucity of data obtained from in situ measurements. The database provides soil texture, rooting depth, and organic carbon content for crop modeling. Nehbandani et al. [46] evaluated soil information obtained from HC27 against measured soil data by simulating the water use and yield of apricots, chickpeas, and sugar beets using the SSM-iCrop2 model across three climatic zones in Iran. Soil data from HC27 produced simulations that were not significantly different from those obtained with actual soil data concerning the mean, distribution, and variance. Similarly, Wimalasiri et al. [42] simulated rice yields across Sri Lanka with the APSIM model using soil data obtained from measurements and two digital soil maps, namely Soilgrids and Openlandmap. However, the latter produced significantly higher yields when compared to simulations using observed soil data. This suggests that the accuracy and reliability of data from the soil maps require improvement due to the overestimation of yields. This highlights the importance of obtaining reliable in situ datasets for agricultural database development to facilitate accurate crop modeling processes. The conflicting outcomes of these two studies emphasize the important role of data source accuracy for crop modeling purposes. Therefore, it is necessary for additional research to determine which soil databases work best in specific regions. Furthermore, this work should also be replicated using other crop models (e.g., AquaCrop).
Irmak et al. [15] developed a large database of simulated soybean yields using the CROPGRO-Soybean model [54]. Numerous model runs were performed for 48 grid points across a 12-hectare field in the USA. Since crop yield can be affected by drainage, rooting depth, and soil fertility, five combinations of soil input parameters were used: (i) saturated hydraulic conductivity of the bottom soil layer, (ii) tile drainage spacing, (iii) maximum rooting depth, (iv) surface runoff curve number, and (v) soil fertility. Model runs were repeated for seven soil types with varying drainage (from very poor to well-drained). A search algorithm was used to identify optimum soil parameter combinations for each grid point where the root mean square error between the simulated and measured yields was the lowest. Hence, the modeling approach provided estimated soil parameters rather than measured data due to the high cost and time required to measure soil parameters across large fields.
The development of a database of crop yields using a modeling approach in this study was not ideal. However, due to insufficient financial support, time, and resources to conduct adequate field trials, developing a database of simulated agricultural data can enhance clarity by providing information that may improve agricultural management practices and, thus, guide and inform the decision-making by farmers across different locations.
The availability of in situ soil data is important for accurate crop model simulations as they affect key parameters, including soil water retention, root growth, and nutrient availability [11]. For NUS, which have historically been under-researched, the lack of measured soil datasets across different agroecologies has negatively affected their promotion. This highlights the importance of pooling the limited soil data available and suitable for NUS and developing databases that include such data to enhance the accuracy and application of crop models for NUS.

4.2. Climate Data for Crop Modelling

The availability of climate datasets in most countries in the Global North may differ from those in the Global South. Most countries in the Global North (e.g., France, Greece, and the USA) have produced substantially more studies on agricultural databases for crop modeling than those in the Global South (e.g., South Africa and the Democratic Republic of Congo). This is primarily due to limited funding to conduct field experiments to obtain in situ data in the Global South relative to the Global North. For example, over the past 40 years, the number of weather stations in the Democratic Republic of Congo and Madagascar has declined from over 55 to less than 9 and over 300 to less than 50, respectively [55]. Similarly, the rainfall monitoring network developed and maintained by the South African Weather Service consisted of 3000 rain gauges in the 1970s, which declined to 1200 sites by 2015 [56]. The closure of rainfall monitoring stations is mostly due to reduced funds for maintaining (and expanding) the network. Reducing climate datasets in countries in the Global South has restricted agricultural database development relative to most countries in the Global North. The lack of monitoring networks advocates using a modeling approach to developing agricultural databases.
In crop models, climate data such as precipitation, temperature, relative humidity, and solar radiation are essential for crop water use and yield simulations under variable environmental conditions [11]. The reduction of climate data collection in the Global South has hindered the increased modeling of NUS, which possess traits of adapting to variable climate [38]. Therefore, developing climate databases consisting of detailed records for regions that are suitable for NUS cultivation may improve the development and applicability of reliable models for these crops.
In contrast, the South African Environmental Observation Network aims to identify, predict, and react to environmental changes. They are developing reliable, long-term datasets containing measured climate and vegetation water use data. Such organizations are important for providing reliable data for crop modeling and monitoring the changing climate. Furthermore, a declining monitoring network increases the difficulty in infilling missing data, considering available monitoring stations are spaced further apart. According to Pegram et al. [56], rainfall stations located more than 30 km2 away should not be used to infill missing data.

4.3. Crop Data for Model Calibration

Crop models have become useful tools for assessing crop water use and yield under variable climatic conditions, from which effective adaptation strategies can be developed [7,57,58]. Despite a model’s level of sophistication and capabilities, it cannot compensate for poor input data. High-quality growth and yield data to develop, calibrate, and evaluate crop simulation models are essential to their performance.
However, insufficient high-quality crop datasets currently exist to calibrate and validate crop models to improve confidence in simulations for NUS [7,13]. This is mostly due to the high cost of resources (e.g., irrigation equipment, fertilizers, pesticides, and herbicides) and the time required to conduct field experiments to measure yields across different agroecologies and seasons. In addition, agronomists and skilled labor are also required but may be lacking in some instances. A paradigm shift is required to reallocate research funding away from major staple crops to NUS, as this may aid in improving the availability of data related to their soil and weather requirements and management factors, which are all important for the modeling process.
Previously, limited funding was made available in South Africa to conduct field trials for NUS, which are necessary for developing databases containing measurements essential for model calibration and validation. However, since 2013, the Water Research Commission in South Africa has prioritized research funding for NUS [8]. This effort has culminated in the calibration and validation of the AquaCrop model for numerous NUS such as amaranth (Amaranthus spp.) [59], bambara groundnut (Vigna subterranea) [60], cowpea (Vigna unguiculata) [61], pearl millet (Pennisetum glaucum) [62], sorghum (Sorghum bicolor) [63], sweet potato (Ipomoea batatas) [38,64], and taro (Colocasia esculenta) [38,65].
In addition, there are collaborative initiatives to improve agrobiodiversity and broaden the food basket sustainably [66]. These initiatives, among others, include cooperative projects such as the Agricultural Model Intercomparison and Improvement Project and the Consortium of International Agricultural Research Platform for Big Data in Agriculture. These two initiatives focus on collecting measured crop data for crop modeling, including NUS.
The prioritization and subsequent funding to conduct more NUS research represents a substantial improvement in the quality and availability of in situ data for model calibration and validation, which can improve crop water use and yield predictions. This further highlights the importance of obtaining high-quality empirical input data for crop models to guide and inform the enhancement of agricultural productivity and sustainability. For example, increasing the availability of measured data for NUS can enable researchers to conduct innovative studies on these crops across different locations to discover breakthroughs that promote precision agricultural practices, which can benefit both small- and large-scale farmers.

4.4. Other Applications of Agricultural Databases

In addition to calibrating and validating crop simulation models [15,41], agricultural databases of measured crop and soil data can be used to train and test machine learning algorithms to predict crop yield, as demonstrated by Paudel et al. [67]. These authors developed a modular and reusable workflow for machine learning model development for large-scale crop yield predictions. For crops including barley, sugar beet, sunflower, potato, and wheat grown in the Netherlands and Germany, they found comparable early-season predictions to the European Commission’s MCYFS, which does not use machine learning.
Machine learning algorithms can also derive relationships between target (e.g., yield) and predictor (e.g., climate and edaphic) variables. Subsequently, these algorithms have been used for various purposes ranging from yield prediction to fertilizer applications and water stress identification. Machine learning algorithms have also been used to (i) highlight the impact of poor weed management on crop performance [3] and (ii) identify the most suitable crop management practices that may limit crop yield losses [67].

4.5. Way Forward

Running a crop model at a national scale is computationally expensive. Kunz et al. [38,68,69] developed a fully automated method to run the AquaCrop model for 5838 homogeneous response zones, each with representative soil data and 50 years of climate data from 1950 to 1999. It required developing over 10,000 lines of code written in Intel Python v3.9.12, Intel Fortran v2021.60, and Unix Ubuntu v22.04.2, which have been continually refined since 2014 to substantially reduce the time taken to perform these model runs. Despite this, a national-scale run takes 3 to 7 h, depending on the crop and the length of its growth cycle [38].
Furthermore, running crop simulation models is a complex and impractical process for many farmers [70]. This may be due to a lack of (i) expertise and (ii) input data (e.g., climate and soil) required to use these models. This has also resulted in the poor adoption of irrigation scheduling decision support tools (DSTs) within the South African sugarcane industry [71]. Furthermore, based on a survey conducted over two irrigation districts in Canada, Bjornlund et al. [72] observed that less than 30% of farmers used computers, phones, monitoring instruments, and web-based programs to guide and inform irrigation scheduling. Hence, farmers prefer using simple tools that are easy to understand to guide and inform their farming practices [73].
Singels et al. [74] developed a user-friendly, online DST called MyCanesim that reduces farmers’ exposure to complex modeling systems. This DST consists of a sugarcane model linked to a weather and soil database, where the user (e.g., farmer or agricultural extension officer) provides site-specific data via a web-based interface such as their location (for selection of a nearby weather station), total available water, soil drainage rate, irrigation schedule (if applicable), as well as planting and harvest dates. The model then simulates canopy cover (%), yield (crop and sucrose in t ha−1), and crop water use (mm) [74].
Owing to the complexity of (i) running mechanistic crop simulation models, especially for multiple locations, and (ii) developing online DSTs such as MyCanesim, there is a need to develop simplified crop yield prediction models that require minimal predictor variables (e.g., climate, soils, and altitude) using a suitable machine learning algorithm. This approach, which also reduces system complexity, may prove easier for farmers to use for decision-making. However, developing simplified yield prediction models also requires reliable yield data. While such data are largely available and accessible for many staple crops such as maize, wheat, and soybean, a paucity of measured data are available for NUS.
From the bibliometric dataset, only one study [15] developed a crop database of modeled soybean yield data, which was then used to estimate soil parameters that minimized the difference between observed and simulated yields. Hence, developing crop databases using modeled rather than measured data provides a possible solution, especially for NUS, which remain under-researched compared to conventional crops. This solution has been made possible through research funding provided by the Water Research Commission since 2013, which resulted in the calibration of AquaCrop for seven NUS (cf. Section 4.3), including the ability to run AquaCrop nationally.
However, developing a crop database of simulated yields for NUS should only be considered an interim alternative to using measured data. Although unconventional, using simulated data for decision-making allows more time for field trials.

5. Conclusions

Agricultural databases provide data suitable for facilitating yield predictions through crop modeling. A lack of available measured data has limited the development of agricultural databases. Therefore, a systematic scoping review was conducted to provide a bibliometric and systematic evaluation of the use of agricultural databases for crop modeling. The bibliometric analysis highlighted the limited availability of measured datasets, with the available ones being used for developing databases that primarily focus on major staple crops, including maize, soybean, and wheat. This highlights the importance of developing more crop databases, especially for NUS, which are globally under-researched. In addition to model calibration and validation, agricultural databases were found to be suitable for training and testing machine learning models for crop yield predictions and identifying management practices that maximize crop yields. Insufficient high-quality datasets available for developing and applying such databases using these models was one of the main challenges identified. Many farmers lack the expertise required to apply such models. This has presented opportunities for researchers to develop user-friendly simplified yield prediction models that require minimal input variables, which agricultural extension officers and farmers may use to help answer pre-planting questions. This may assist in maximizing the limited data available, which may be useful for developing nations in the Global South that lack access to sufficient measured data due to limited financial support and resource constraints.
From the bibliometric dataset, one study used modeled data to develop a crop database despite having a level of uncertainty. This presents opportunities for future research to improve model simulations to minimize their uncertainty level and provide reliable data for crop database development. Therefore, developing crop databases using modeled data is proposed as an interim solution whilst costly and time-consuming field trials are being conducted. These databases may compensate for the lack of in situ data by providing simulated data that may improve the calibration of crop models and their validation across diverse agroecologies.
Globally, there are insufficient crop databases available for NUS, nor have machine learning models been used to simulate the yield and water use of NUS. Therefore, developing a crop database consisting of simulated data for NUS may be considered a novel approach to enhancing the existing knowledge base for these crops and, thus, may contribute to promoting their adoption and uptake by both small- and large-scale farmers. This could expand agricultural production and improve agricultural diversification.

Supplementary Materials

The following supporting information can be downloaded at: https://www.mdpi.com/article/10.3390/su16156554/s1, Table S1. Global citation scores of 51 articles on research related to the use of agricultural databases, ranked by total citations [75,76,77,78,79,80,81,82,83,84,85,86,87,88,89,90,91,92,93,94,95,96,97,98,99,100,101,102,103,104,105,106,107,108,109,110,111,112,113,114].

Author Contributions

Conceptualization, T.L.M. and R.K.; methodology, T.L.M., R.K., S.G. and T.M.; software, T.L.M. and S.G.; validation, T.L.M., R.K., S.G. and T.M.; formal analysis, T.L.M.; investigation, T.L.M. and S.G.; resources, T.L.M. and R.K.; data curation, T.L.M., R.K. and S.G.; writing—original draft preparation, T.L.M.; writing—review and editing, T.L.M., R.K., S.G. and T.M.; visualization, T.L.M.; supervision, R.K., S.G. and T.M.; project administration, T.L.M. and R.K.; funding acquisition, R.K. All authors have read and agreed to the published version of the manuscript.

Funding

This research was funded by the Water Research Commission (WRC) through WRC Project 2023/2024-01254 titled: “Developing a database and utility tool for underutilised indigenous crops for increased agricultural diversification in South Africa”.

Data Availability Statement

No new data were created or analyzed in this study. Data sharing is not applicable to this article.

Acknowledgments

The authors would like to express their appreciation to the anonymous reviewers for providing their invaluable input to this article.

Conflicts of Interest

The authors declare no conflicts of interest. The funders had no role in the design of the study, in the collection, analyses, or interpretation of data, in the writing of the manuscript, or in the decision to publish the results.

References

  1. Mabhaudhi, T.; Chibarabada, T.; Modi, A. Water-food-nutrition-health nexus: Linking water to improving food, nutrition, and health in Sub-Saharan Africa. Int. J. Environ. Res. Public Health 2016, 13, 107. [Google Scholar] [CrossRef] [PubMed]
  2. Distefano, T.; Kelly, S. Are we in deep water? Water scarcity and its limits to economic growth. Ecol. Econ. 2017, 142, 130–147. [Google Scholar] [CrossRef]
  3. Meunier, C.; Alletto, L.; Bedoussac, L.; Bergez, J.E.; Casadebaig, P.; Constantin, J.; Gaudio, N.; Mahmoud, R.; Aubertot, J.N.; Celette, F.; et al. A modelling chain combining soft and hard models to assess a bundle of ecosystem services provided by a diversity of cereal-legume intercrops. Eur. J. Agron. 2022, 132, 126412. [Google Scholar] [CrossRef]
  4. Bocchiola, D.; Nana, E.; Soncini, A. Impact of climate change scenarios on crop yield and water footprint of maize in the Po valley of Italy. Agric. Water Manag. 2013, 116, 50–61. [Google Scholar] [CrossRef]
  5. Bocchiola, D. Impact of potential climate change on crop yield and water footprint of rice in the Po valley of Italy. Agric. Syst. 2015, 139, 223–237. [Google Scholar] [CrossRef]
  6. Sinclair, T.R.; Seligman, N.G. Crop modelling: From infancy to maturity. Agron. J. 1996, 88, 694–704. [Google Scholar] [CrossRef]
  7. Mabhaudhi, T. Drought Tolerance and Water-Use of Selected South African Landraces of Taro (Colocasia esculenta L. Schott) and Bambara Groundnut (Vigna subterranea L. Verdc). Ph.D. Thesis, University of Kwazulu-Natal, Pietermaritzburg, South Africa, 31 December 2012. Available online: https://researchspace.ukzn.ac.za/server/api/core/bitstreams/fc88b879-5c7e-46ba-baff-508d10a68ce4/content (accessed on 30 May 2024).
  8. Modi, A.T.; Mabhaudhi, T. Developing a Research Agenda for Promoting Underutilised, Indigenous, and Traditional Crops; WRC Report No. KV 362/16; Water Research Commission (WRC): Pretoria, South Africa, 2016; pp. 1–105. Available online: https://www.wrc.org.za/wp-content/uploads/mdocs/KV362_172.pdf (accessed on 30 May 2024).
  9. Modi, A.T.; Mabhaudhi, T. Determining Water Use of Indigenous Grain and Legume Food Crops; WRC Report No. TT 710/77; Water Research Commission (WRC): Pretoria, South Africa, 2017; pp. 8–294. Available online: https://www.wrc.org.za/wp-content/uploads/mdocs/TT%20710-17.pdf (accessed on 30 May 2024).
  10. Nizar, N.M.M.; Jahanshiri, E.; Tharmandram, A.S.; Salama, A.; Sinin, S.S.M.; Abdullah, N.J.; Zolkepli, H.; Wimalasiri, M.; Suhairi, T.A.S.T.M.; Hussin, H.; et al. Underutilised crops database for supporting agricultural diversification. Comput. Electron. Agric. 2021, 180, 105920. [Google Scholar] [CrossRef]
  11. FAO (Food and Agriculture Organization). Understanding AquaCrop; Book 1; FAO: Rome, Italy, 2022; pp. 4–52. Available online: https://www.fao.org/3/cc2380en/cc2380en.pdf (accessed on 30 May 2024).
  12. Wimalasiri, E.M.; Jahanshiri, E.; Chimonyo, V.; Azam-Ali, S.N.; Gregory, P.J. Crop model ideotyping for agricultural diversification. MethodsX 2021, 8, 101420. [Google Scholar] [CrossRef] [PubMed]
  13. Modi, A.T.; Mabhaudhi, T. Water Use of Crops and Nutritional Water Productivity for Food Production, Nutrition and Health in Rural Communities in KwaZulu-Natal; WRC Report No. KV 2493/1/20; Water Research Commission (WRC): Pretoria, South Africa, 2020; pp. 9–148. Available online: https://wrc.org.za/?mdocs-file=59747 (accessed on 30 May 2024).
  14. Wimalasiri, E.M.; Jahanshiri, E.; Perego, A.; Azam-Ali, S.N. A novel crop shortlisting method for sustainable agricultural diversification across Italy. Agronomy 2022, 12, 1636. [Google Scholar] [CrossRef]
  15. Irmak, A.; Jones, J.W.; Batchelor, W.D.; Paz, J.O. Estimating spatially variable soil properties for application of crop models in precision farming. Trans. ASAE 2001, 44, 1343. [Google Scholar] [CrossRef]
  16. Chen, H.; Feng, Y.; Li, S.; Zhang, Y.; Yang, X. Bibliometric analysis of theme evolution and future research trends of the type a personality. Pers. Individ. Differ. 2019, 150, 109507. [Google Scholar] [CrossRef]
  17. Rey-Martí, A.; Ribeiro-Soriano, D.; Palacios-Marqués, D. A bibliometric analysis of social entrepreneurship. J. Bus. Res. 2016, 69, 1651–1655. [Google Scholar] [CrossRef]
  18. Moher, D.; Liberati, A.; Tetzlaff, J.; Altman, D.G. Preferred reporting items for systematic reviews and meta-analyses: The PRISMA statement. BMJ 2009, 339, b2535. [Google Scholar] [CrossRef] [PubMed]
  19. Page, M.J.; McKenzie, J.E.; Bossuyt, P.M.; Boutron, I.; Hoffmann, T.C.; Mulrow, C.D.; Shamseer, L.; Tetzlaff, J.M.; Akl, E.A.; Brennan, S.E.; et al. The PRISMA 2020 statement: An updated guideline for reporting systematic reviews. BMJ 2021, 372, n71. [Google Scholar] [CrossRef] [PubMed]
  20. Scopus. Available online: https://www.scopus.com (accessed on 29 March 2024).
  21. Web of Science. Available online: https://www.webofscience.com (accessed on 29 March 2024).
  22. Tricco, A.C.; Lillie, E.; Zarin, W.; O’Brien, K.K.; Colquhoun, H.; Levac, D.; Moher, D.; Peters, M.D.; Horsley, T.; Weeks, L.; et al. PRISMA extension for scoping reviews (PRISMA-ScR): Checklist and explanation. Ann. Intern. Med. 2018, 169, 467–473. [Google Scholar] [CrossRef] [PubMed]
  23. van Raan, A.F.J. Advanced bibliometric methods as quantitative core of peer review based evaluation and foresight exercises. Scientometrics 1996, 36, 397–420. [Google Scholar] [CrossRef]
  24. Small, H. Co-citation in the scientific literature: A new measure of the relationship between two documents. J. Am. Soc. Inf. Sci. 1973, 24, 265–269. [Google Scholar] [CrossRef]
  25. Aria, M.; Cuccurullo, C. Bibliometrix: An R-tool for comprehensive science mapping analysis. J. Informetr. 2017, 11, 959–975. [Google Scholar] [CrossRef]
  26. Van Eck, N.; Waltman, L. Software survey: VOSviewer, a computer program for bibliometric mapping. Scientometrics 2010, 84, 523–538. [Google Scholar] [CrossRef] [PubMed]
  27. Abafe, E.A.; Bahta, Y.T.; Jordaan, H. Exploring biblioshiny for historical assessment of global research on sustainable use of water in agriculture. Sustainability 2022, 14, 10651. [Google Scholar] [CrossRef]
  28. Jones, J.W.; Hoogenboom, G.; Porter, C.H.; Boote, K.J.; Batchelor, W.D.; Hunt, L.A.; Wilkens, P.W.; Singh, U.; Gijsman, A.J.; Ritchie, J.T. The DSSAT cropping system model. Eur. J. Agron. 2003, 18, 235–265. [Google Scholar] [CrossRef]
  29. Jones, J.W.; Antle, J.M.; Basso, B.; Boote, K.J.; Conant, R.T.; Foster, I.; Godfray, H.C.J.; Herrero, M.; Howitt, R.E.; Janssen, S.; et al. Toward a new generation of agricultural system data, models, and knowledge products: State of agricultural systems science. Agric. Syst. 2017, 155, 269–288. [Google Scholar] [CrossRef] [PubMed]
  30. Janssen, S.J.C.; Porter, C.H.; Moore, A.D.; Athanasiadis, I.N.; Foster, I.; Jones, J.W.; Antle, J.M. Towards a new generation of agricultural system data, models and knowledge products: Information and communication technology. Agric. Syst. 2017, 155, 200–212. [Google Scholar] [CrossRef] [PubMed]
  31. Hirsch, J.E. An index to quantify an individual’s scientific research output. Proc. Natl. Acad. Sci. USA 2005, 102, 16569–16572. [Google Scholar] [CrossRef] [PubMed]
  32. Egghe, L. Theory and practise of the g-index. Scientometrics 2006, 69, 131–152. [Google Scholar] [CrossRef]
  33. Brisson, N.; Ruget, F.; Gate, P.; Lorgeou, J.; Nicoullaud, B.; Tayot, X.; Plenet, D.; Jeuffroy, M.H.; Bouthier, A.; Ripoche, D.; et al. STICS: A generic model for simulating crops and their water and nitrogen balances. II. Model validation for wheat and maize. Agronomie 2002, 22, 69–92. [Google Scholar] [CrossRef]
  34. Brisson, N.; Mary, B.; Ripoche, D.; Jeuffroy, M.H.; Ruget, F.; Nicoullaud, B.; Gate, P.; Devienne-Barret, F.; Antonioletti, R.; Durr, C.; et al. STICS: A generic model for the simulation of crops and their water and nitrogen balances. I. Theory and parameterization applied to wheat and corn. Agronomie 1998, 18, 311–346. [Google Scholar] [CrossRef]
  35. Waltman, L.; van Eck, N.J.; van Leeuwen, T.N.; Visser, M.S.; van Raan, A.F.J. Towards a new crown indicator: Some theoretical considerations. J. Informetr. 2011, 5, 37–47. [Google Scholar] [CrossRef]
  36. Keating, B.A.; Carberry, P.S.; Hammer, G.L.; Probert, M.E.; Robertson, M.J.; Holzworth, D.; Huth, N.I.; Hargreaves, J.N.; Meinke, H.; Hochman, Z.; et al. An overview of APSIM, a model designed for farming systems simulation. Eur. J. Agron. 2003, 18, 267–288. [Google Scholar] [CrossRef]
  37. Pingali, P.L. Green Revolution: Impacts, limits, and the path ahead. Proc. Natl. Acad. Sci. USA 2012, 109, 12302–12308. [Google Scholar] [CrossRef] [PubMed]
  38. Kunz, R.; Reddy, K.; Mthembu, T.; Lake, S.; Mabhaudhi, T.; Chimonyo, V. Crop and Nutritional Water Productivity of Sweet Potato and Taro; WRC Report No. 3124/1/24; Water Research Commission (WRC): Pretoria, South Africa, 2024; pp. 1–263. Available online: https://www.wrc.org.za/wp-content/uploads/mdocs/31241.pdf (accessed on 30 May 2024).
  39. Duveiller, G.; Donatelli, M.; Fumagalli, D.; Zucchini, A.; Nelson, R.; Baruth, B. A dataset of future daily weather data for crop modelling over Europe derived from climate change scenarios. Theor. Appl. Climatol. 2017, 127, 573–585. [Google Scholar] [CrossRef]
  40. Micale, F.; Genovese, G. Methodology of the MARS Crop Yield Forecasting System, 1st ed.; Meteorological Data Collection, Processing, and Analysis: Wageningen, The Netherlands, 2004; pp. 1–45. Available online: https://www.researchgate.net/profile/FabioMicale/publication/286193319_Meteorological_data_collection_processing_and_analysis/links/60648e65a6fdcc83855aa61a/Meteorological-data-collection-processing-and-analysis.pdf (accessed on 30 May 2024).
  41. Wu, Y.; Wang, E.; He, D.; Liu, X.; Archontoulis, S.V.; Huth, N.I.; Zhao, Z.; Gong, W.; Yang, W. Combine observational data and modelling to quantify cultivar differences of soybean. Eur. J. Agron. 2019, 111, 125940. [Google Scholar] [CrossRef]
  42. Wimalasiri, E.M.; Jahanshiri, E.; Suhairi, T.A.S.T.M.; Udayangani, H.; Mapa, R.B.; Karunaratne, A.S.; Vidhanarachchi, L.P.; Azam-Ali, S.N. Basic soil data requirements for process-based crop models as a basis for crop diversification. Sustainability 2020, 12, 7781. [Google Scholar] [CrossRef]
  43. Hengl, T.; De Jesus, J.M.; MacMillan, R.A.; Batjes, N.H.; Heuvelink, G.B.; Ribeiro, E.; Samuel-Rosa, A.; Kempen, B.; Leenaars, J.G.; Walsh, M.G.; et al. SoilGrids1km—Global soil information based on automated mapping. PLoS ONE 2014, 9, e105992. [Google Scholar] [CrossRef]
  44. Hengl, T.; Mendes de Jesus, J.; Heuvelink, G.B.; Ruiperez Gonzalez, M.; Kilibarda, M.; Blagotić, A.; Shangguan, W.; Wright, M.N.; Geng, X.; Bauer-Marschallinger, B.; et al. SoilGrids250m: Global gridded soil information based on machine learning. PLoS ONE 2017, 12, e0169748. [Google Scholar] [CrossRef]
  45. Hengl, T.; Wheeler, I. Soil Organic Carbon Content in × 5 g/kg at 6 Standard Depths (0, 10, 30, 60, 100 and 200 cm) at 250 m Resolution, 5th ed.; International Food Policy Research Institute: Washington DC, USA, 2013; pp. 1–15. [Google Scholar] [CrossRef]
  46. Nehbandani, A.; Soltani, A.; Taghdisi Naghab, R.; Dadrasi, A.; Alimagham, S.M. Assessing HC27 soil database for modeling plant production. Int. J. Plant Prod. 2020, 14, 679–687. [Google Scholar] [CrossRef]
  47. Koo, J.; Dimes, J. HC27 Generic Soil Profile Database, 5th ed.; International Food Policy Research Institute: Washington DC, USA, 2013; pp. 1–10. Available online: http://hdl.handle.net/1902.1/20299 (accessed on 30 May 2024).
  48. Soltani, A.; Alimagham, S.M.; Nehbandani, A.; Torabi, B.; Zeinali, E.; Dadrasi, A.; Zand, E.; Ghassemi, S.; Pourshirazi, S.; Alasti, O.; et al. SSM-iCrop2: A simple model for diverse crop species over large areas. Agric. Syst. 2020, 182, 102855. [Google Scholar] [CrossRef]
  49. McNunn, G.; Heaton, E.; Archontoulis, S.; Licht, M.; VanLoocke, A. Using a crop modeling framework for precision cost-benefit analysis of variable seeding and nitrogen application rates. Front. Sustain. Food Syst. 2019, 3, 108. [Google Scholar] [CrossRef]
  50. Gladish, D.W.; He, D.; Wang, E. Pattern analysis of Australia soil profiles for plant available water capacity. Geoderma 2021, 391, 114977. [Google Scholar] [CrossRef]
  51. van Ittersum, M.K.; Cassman, K.G.; Grassini, P.; Wolf, J.; Tittonell, P.; Hochman, Z. Yield gap analysis with local to global relevance—A review. Field Crops Res. 2013, 143, 4–17. [Google Scholar] [CrossRef]
  52. van Ittersum, M.K.; Ewert, F.; Heckelei, T.; Wery, J.; Alkan Olsson, J.; Andersen, E.; Bezlepkina, I.; Brouwer, F.; Donatelli, M.; Flichman, G.; et al. Integrated assessment of agricultural systems—A component-based framework for the European Union (SEAMLESS). Agric. Syst. 2008, 96, 150–165. [Google Scholar] [CrossRef]
  53. Hatfield, J.L.; Boote, K.J.; Kimball, B.A.; Ziska, L.H.; Izaurralde, R.C.; Ort, D.; Thomson, A.M.; Wolfe, D. Climate Impacts on Agriculture: Implications for Crop Production. Agron. J. 2011, 103, 351–370. [Google Scholar] [CrossRef]
  54. Boote, K.J.; Jones, J.W.; Hoogenboom, G. Simulation of crop growth: CROPGRO model. In Agricultural Systems Modelling and Simulation, 1st ed.; CRC Press: Boca Raton, FL, USA, 1998; Volume 18, pp. 651–692. [Google Scholar] [CrossRef]
  55. Asfaw, W.; Rientjes, T.; Haile, A.T. Blending high-resolution satellite rainfall estimates over urban catchment using Bayesian Model Averaging approach. J. Hydrol. Reg. Stud. 2023, 45, 101287. [Google Scholar] [CrossRef]
  56. Pegram, G.G.S.; Sinclair, S.; Bardossy, A. New Methods of Infilling Southern African Raingauge Records Enhanced by Annual, Monthly and Daily Precipitation Estimates Tagged with Uncertainty; WRC Report No. 2241/1/15; Water Research Commission (WRC): Pretoria, South Africa, 2016; pp. 1–70. Available online: https://www.wrc.org.za/wp-content/uploads/mdocs/2241%20-1-16.pdf (accessed on 30 May 2024).
  57. Steduto, P.; Hsiao, T.C.; Raes, D.; Fereres, E. AquaCrop-The FAO crop model to simulate yield response to water: I. Concepts and underlying principles. Agron. J. 2009, 101, 426–437. [Google Scholar] [CrossRef]
  58. Singels, A.; Jones, M.R.; Porter, C.; Smit, M.A.; Kingston, G.; Marin, F.; Chinorumba, S.; Jintrawet, A.; Suguitani, C.; Van Den Berg, M.; et al. The DSSATv4. 5 Canegro model: A useful decision support tool for research and management of sugarcane production. ISST 2010, 26, 211–219. Available online: https://www.researchgate.net/profile/A-Singels-2/publication/282090662 (accessed on 30 May 2024).
  59. Nyathi, M.K.; Van Halsema, G.E.; Annandale, J.G.; Struik, P.C. Calibration and validation of the AquaCrop model for repeatedly harvested leafy vegetables grown under different irrigation regimes. Agric. Water Manag. 2018, 208, 107–119. [Google Scholar] [CrossRef]
  60. Mabhaudhi, T.; Modi, A.T.; Beletse, Y.G. Parameterization and testing of AquaCrop for a South African bambara groundnut landrace. Agron. J. 2014, 106, 243–251. [Google Scholar] [CrossRef]
  61. Kanda, E.K.; Senzanje, A.; Mabhaudhi, T. Modelling soil water distribution under moistube irrigation for cowpea (VIGNA unguiculata (L.) Walp.) crop. Irrig. Drain. 2020, 69, 1116–1132. [Google Scholar] [CrossRef]
  62. Bello, Z.A.; Walker, S. Calibration, and validation of AquaCrop for pearl millet (Pennisetum glaucum). Crop Pasture Sci. 2016, 67, 948–960. [Google Scholar] [CrossRef]
  63. Hadebe, S.T.; Modi, A.T.; Mabhaudhi, T. Calibration and testing of AquaCrop for selected sorghum genotypes. Water SA 2017, 43, 209–221. [Google Scholar] [CrossRef]
  64. Beletse, Y.G.; Laurie, R.; Du Plooy, C.P.; Laurie, S.M.; Van den Berg, A. Simulating the yield response of orange fleshed sweet potato’Isondlo’to water stress using the FAO AquaCrop model. In Proceedings of the ISHS Acta Horticulturae 1007: II All Africa Horticulture Congress, Skukuza, Kruger National Park, South Africa, 20 September 2013. [Google Scholar] [CrossRef]
  65. Mabhaudhi, T.; Modi, A.T.; Beletse, Y.G. Parameterisation and evaluation of the FAO-AquaCrop model for a South African taro (Colocasia esculenta L. Schott) landrace. Agric. For. Meteorol. 2014, 192, 132–139. [Google Scholar] [CrossRef]
  66. Chimonyo, V.G.P.; Chibarabada, T.P.; Choruma, D.J.; Kunz, R.; Walker, S.; Massawe, F.; Modi, A.T.; Mabhaudhi, T. Modelling neglected and underutilised crops: A systematic review of progress, challenges, and opportunities. Sustainability 2022, 14, 13931. [Google Scholar] [CrossRef]
  67. Paudel, D.; Boogaard, H.; de Wit, A.; Janssen, S.; Osinga, S.; Pylianidis, C.; Athanasiadis, I.N. Machine learning for large-scale crop yield forecasting. Agric. Syst. 2021, 187, 103016. [Google Scholar] [CrossRef]
  68. Kunz, R.P.; Mengistu, M.; Steyn, J.M.; Doidge, I.; Gush, M.; Du Toit, E.; Davis, N.; Jewitt, G.; Everson, C. Assessment of Biofuel Feedstock Production in South Africa: Technical Report on the Field-Based Measurement, Modelling and Mapping of Water Use in Biofuel Crops; WRC Report No. 1874/2/15; Water Research Commission (WRC): Pretoria, South Africa, 2015; pp. 1–233. Available online: https://www.wrc.org.za/wp-content/uploads/mdocs/1874-2-151.pdf (accessed on 30 May 2024).
  69. Kunz, R.; Masanganise, J.; Reddy, K.; Mabhaudhi, T.; Lembede, L.; Naiken, V.; Ferrer, S. Water Use and Yield of Soybean and Grain Sorghum for Biofuel Production; WRC Report No. 2491/20; Water Research Commission (WRC): Pretoria, South Africa, 2020; pp. 1–226. Available online: https://www.wrc.org.za/wp-content/uploads/mdocs/2491%20Final%20Report.pdf (accessed on 30 May 2024).
  70. Olivier, F.; Singels, A. Survey of irrigation scheduling practices in the South African sugar industry. SASTA 2004, 78, 239–244. Available online: https://www.researchgate.net/profile/Francois-Olivier-5/publication/260403579 (accessed on 30 May 2024).
  71. Jumman, A. Using System Dynamics To Explore The Poor Uptake Of Irrigation Scheduling Technologies in a Commercial Sugarcane Community in South Africa. Ph.D. Thesis, University of Kwazulu-Natal, Pietermaritzburg, South Africa, 31 December 2016. Available online: https://researchspace.ukzn.ac.za/server/api/core/bitstreams/6c2ebfee-fa3e-4d14-92f2-c0f8ea8797a5/content (accessed on 30 May 2024).
  72. Bjornlund, H.; Nicol, L.; Klein, K.K. The adoption of improved irrigation technology and management practices-A study of two irrigation districts in Alberta, Canada. Agric. Water Manag. 2009, 96, 121–131. [Google Scholar] [CrossRef]
  73. Singels, A.; Kennedy, A.J.; Bezuidenhout, C.N. IRRICANE: A simple computerised irrigation scheduling method for sugarcane. SASTA 1998, 72, 117–122. Available online: https://www.researchgate.net/profile/A-Singels-2/publication/266269880 (accessed on 30 May 2024).
  74. Singels, A. A new approach to implementing computer-based decision support for sugarcane farmers and extension staff: The case of My Canesim. ISSCT 2007, 26, 211–219. Available online: https://www.researchgate.net/profile/A-Singels-2/publication/283994508 (accessed on 30 May 2024).
  75. Fraga, H.; García de Cortázar Atauri, I.; Malheiro, A.C.; Santos, J.A. Modelling climate change impacts on viticultural yield, phenology, and stress conditions in Europe. Glob. Chang. Biol. 2016, 22, 3774–3788. [Google Scholar] [CrossRef] [PubMed]
  76. Reidsma, P.; Ewert, F.; Boogaard, H.; van Diepen, K. Regional crop modelling in Europe: The impact of climatic conditions and farm characteristics on maize yields. Agric. Syst. 2009, 100, 51–60. [Google Scholar] [CrossRef]
  77. White, J.W.; Hunt, L.A.; Boote, K.J.; Jones, J.W.; Koo, J.; Kim, S.; Porter, C.H.; Wilkens, P.W.; Hoogenboom, G. Integrated description of agricultural field experiments and production: The ICASA Version 2.0 data standards. Comput. Electron. Agric. 2013, 96, 1–12. [Google Scholar] [CrossRef]
  78. Pidgeon, J.D.; Ober, E.S.; Qi, A.; Clark, C.J.; Royal, A.; Jaggard, K.W. Using multi-environment sugar beet variety trials to screen for drought tolerance. Field Crops Res. 2006, 95, 268–279. [Google Scholar] [CrossRef]
  79. Jégo, G.; Pattey, E.; Bourgeois, G.; Morrison, M.J.; Drury, C.F.; Tremblay, N.; Tremblay, G. Calibration and performance evaluation of soybean and spring wheat cultivars using the STICS crop model in Eastern Canada. Field Crops Res. 2010, 117, 183–196. [Google Scholar] [CrossRef]
  80. Porter, C.H.; Villalobos, C.; Holzworth, D.; Nelson, R.; White, J.W.; Athanasiadis, I.N.; Janssen, S.; Ripoche, D.; Cufi, J.; Raes, D.; et al. Harmonization, and translation of crop modeling data to ensure interoperability. Environ. Model. Softw. 2014, 62, 495–508. [Google Scholar] [CrossRef]
  81. Han, E.; Ines, A.V.; Koo, J. Development of a 10-km resolution global soil profile dataset for crop modeling applications. Environ. Model. Softw. 2019, 119, 70–83. [Google Scholar] [CrossRef] [PubMed]
  82. Adiku, S.G.K.; Reichstein, M.; Lohila, A.; Dinh, N.Q.; Aurela, M.; Laurila, T.; Aurela, M.; Laurila, T.; Lüers, J.; Tenhunen, J.D. PIXGRO: A model for simulating the ecosystem CO2 exchange and growth of spring barley. Ecol. Model. 2006, 190, 260–276. [Google Scholar] [CrossRef]
  83. Stancalie, G.; Marica, A.; Toulios, L. Using earth observation data and CROPWAT model to estimate the actual crop evapotranspiration. Phys. Chem. Earth 2010, 35, 25–30. [Google Scholar] [CrossRef]
  84. Couëdel, A.; Edreira, J.I.R.; Lollato, R.P.; Archontoulis, S.; Sadras, V.; Grassini, P. Assessing environment types for maize, soybean, and wheat in the United States as determined by spatio-temporal variation in drought and heat stress. Agric. For. Meteorol. 2021, 307, 108513. [Google Scholar] [CrossRef]
  85. Gaiser, T.; Judex, M.; Hiepe, C.; Kuhn, A. Regional simulation of maize production in tropical savanna fallow systems as affected by fallow availability. Agric. Syst. 2010, 103, 656–665. [Google Scholar] [CrossRef]
  86. Awoye, O.H.R.; Pollinger, F.; Agbossou, E.K.; Paeth, H. Dynamical-statistical projections of the climate change impact on agricultural production in Benin by means of a cross-validated linear model combined with Bayesian statistics. Agric. For. Meteorol. 2017, 234, 80–94. [Google Scholar] [CrossRef]
  87. Chandran, P.; Tiwary, P.; Bhattacharyya, T.; Mandal, C.; Prasad, J.; Ray, S.K.; Sarkar, D.; Pal, D.K.; Mandal, D.K.; Sidhu, G.S.; et al. Development of soil and terrain digital database for major food-growing regions of India for resource planning. Curr. Sci. 2014, 107, 1420–1430. Available online: https://www.currentscience.ac.in/Volumes/107/09/1420.pdf (accessed on 30 May 2024).
  88. Mauget, S.; Leiker, G.; Nair, S. A web application for cotton irrigation management on the US Southern High Plains. Part I: Crop yield modeling and profit analysis. Comput. Electron. Agric. 2013, 99, 248–257. [Google Scholar] [CrossRef]
  89. Lagacherie, P.; Cazemier, D.R.; Martin-Clouaire, R.; Wassenaar, T. A spatial approach using imprecise soil data for modelling crop yields over vast areas. Agric. Ecosyst. Environ. 2000, 81, 5–16. [Google Scholar] [CrossRef]
  90. Mandal, U.; Sena, D.R.; Dhar, A.; Panda, S.N.; Adhikary, P.P.; Mishra, P.K. Assessment of climate change and its impact on hydrological regimes and biomass yield of a tropical river basin. Ecol. Indic. 2021, 126, 107646. [Google Scholar] [CrossRef]
  91. Seidl, M.S.; Batchelor, W.D.; Fallick, J.B.; Paz, J.O. GIS–crop model-based decision support system to evaluate corn and soybean prescriptions. Appl. Eng. Agric. 2001, 17, 721. [Google Scholar] [CrossRef]
  92. Bhattacharyya, T.; Sarkar, D.; Ray, S.K.; Chandran, P.; Pal, D.K.; Mandal, D.K.; Prasad, J.V.N.S.; Sidhu, G.S.; Nair, K.M.; Sahoo, A.K.; et al. Georeferenced soil information system: Assessment of database. Curr. Sci. 2014, 107, 1400–1419. Available online: https://www.jstor.org/stable/24107204 (accessed on 30 May 2024).
  93. Russell, G.; Muetzelfeldt, R.I.; Taylor, K.; Terres, J.M. Development of a crop knowledge base for Europe. Eur. J. Agron. 1999, 11, 187–206. [Google Scholar] [CrossRef]
  94. Germeier, C.U.; Unger, S. Modeling crop genetic resources phenotyping information systems. Front. Plant Sci. 2019, 10, 433751. [Google Scholar] [CrossRef] [PubMed]
  95. De Wit, A.J.W.; de Bruin, S.; Torfs, P.J.J.F. Representing uncertainty in continental-scale gridded precipitation fields for agrometeorological modeling. J. Hydrometeorol. 2008, 9, 1172–1190. [Google Scholar] [CrossRef]
  96. Belhouchette, H.; Braudeau, E.; Hachicha, M.; Donatelli, M.; Mohtar, R.H.; Wery, J. Integrating spatial soil organization data with a regional agricultural management simulation model: A case study in northern Tunisia. Trans. ASABE 2008, 51, 1099–1109. [Google Scholar] [CrossRef]
  97. Bauböck, R. Simulating the yields of bioenergy and food crops with the crop modeling software BioSTAR: The carbon-based growth engine and the BioSTAR ET 0 method. Environ. Sci. Eur. 2014, 26, 1. [Google Scholar] [CrossRef]
  98. Yagiz, A.K.; Cakici, M.; Aydogan, N.; Omezli, S.; Yerlikaya, B.A.; Ayten, S.; Maqbool, A.; Haverkort, A.J. Exploration of climate change effects on shifting potato seasons, yields and water use employing NASA and national long-term weather data. Potato Res. 2020, 63, 565–577. [Google Scholar] [CrossRef]
  99. De Peppo, M.; Taramelli, A.; Boschetti, M.; Mantino, A.; Volpi, I.; Filipponi, F.; Tornato, A.; Valentini, E.; Ragaglini, G. Non-Parametric statistical approaches for leaf area index estimation from Sentinel-2 Data: A multi-crop assessment. Remote Sens. 2021, 13, 2841. [Google Scholar] [CrossRef]
  100. Edreira, J.I.R.; Mourtzinis, S.; Azzari, G.; Andrade, J.F.; Conley, S.P.; Specht, J.E.; Grassini, P. Combining field-level data and remote sensing to understand impact of management practices on producer yields. Field Crops Res. 2020, 257, 107932. [Google Scholar] [CrossRef]
  101. Cappelli, G.A.; Ginaldi, F.; Fanchini, D.; Corinzia, S.A.; Cosentino, S.L.; Ceotto, E. Model-Based Assessment of Giant Reed (Arundo donax L.) Energy Yield in the Form of Diverse Biofuels in Marginal Areas of Italy. Land 2021, 10, 548. [Google Scholar] [CrossRef]
  102. Fry, J.; Guber, A.K.; Ladoni, M.; Munoz, J.D.; Kravchenko, A.N. The effect of up-scaling soil properties and model parameters on predictive accuracy of DSSAT crop simulation model under variable weather conditions. Geoderma 2017, 287, 105–115. [Google Scholar] [CrossRef]
  103. Denisov, V.V. Development of the crop simulation system DIASPORA. Agron. J. 2001, 93, 660–666. [Google Scholar] [CrossRef]
  104. Mandrini, G.; Archontoulis, S.V.; Pittelkow, C.M.; Mieno, T.; Martin, N.F. Simulated dataset of corn response to nitrogen over thousands of fields and multiple years in Illinois. Data Brief 2022, 40, 107753. [Google Scholar] [CrossRef] [PubMed]
  105. Shelia, V.; Hoogenboom, G. A new approach to clustering soil profile data using the modified distance matrix. Comput. Electron. Agric. 2020, 176, 105631. [Google Scholar] [CrossRef]
  106. Revill, A.; Bloom, A.A.; Williams, M. Impacts of reduced model complexity and driver resolution on cropland ecosystem photosynthesis estimates. Field Crops Res. 2016, 187, 74–86. [Google Scholar] [CrossRef]
  107. Richter, G.; Schmidt, T.; Franko, U. Using long-term experiments to evaluate models for assessing climatic impacts on future crop production. Arch. Agron. Soil Sci. 2004, 50, 553–562. [Google Scholar] [CrossRef]
  108. Talebi, H.; Samadianfard, S.; Kamran, K.V. Investigating the roles of different extracted parameters from satellite images in improving the accuracy of daily reference evapotranspiration estimation. Appl. Water Sci. 2023, 13, 59. [Google Scholar] [CrossRef]
  109. Dinh, T.L.A.; Aires, F. Nested leave-two-out cross-validation for the optimal crop yield model selection. Geosci. Model Dev. 2022, 15, 3519–3535. [Google Scholar] [CrossRef]
  110. Varón-Ramírez, V.M.; Araujo-Carrillo, G.A.; Guevara, M. Colombian soil texture: Building a spatial ensemble model. Earth Syst. Sci. Data Discuss. 2022, 14, 4719–4741. [Google Scholar] [CrossRef]
  111. Aziz, M.; Tariq, M.; Ishaque, W. Optimization of wheat and barley production under changing climate in rainfed Pakistan Punjab-A crop simulation modeling study. Ann. Arid Zone 2016, 55, 115–127. [Google Scholar] [CrossRef]
  112. Teixeira, E.; Guo, J.; Liu, J.; Cichota, R.; Brown, H.; Sood, A.; Yang, X.; Hannaway, D.; Moot, D. Assessing land suitability and spatial variability in lucerne yields across New Zealand. Eur. J. Agron. 2023, 148, 126853. [Google Scholar] [CrossRef]
  113. Menezes, C.T.; Casaroli, D.; Heinemann, A.B.; Moschetti, V.C.; Battisti, R. The impact of gridded weather database on soil water availability in rice crop modeling. Theor. Appl. Climatol. 2022, 147, 1401–1414. [Google Scholar] [CrossRef]
  114. Fattori, I.M.; Marin, F.R. Assessing the influence of crop model structure on the performance of data assimilation for sugarcane. Comput. Electron. Agric. 2023, 209, 107848. [Google Scholar] [CrossRef]
Figure 1. PRISMA-ScR flow diagram for article selection.
Sustainability 16 06554 g001
Figure 2. Annual distribution of average total citations and articles on research related to the use of agricultural databases in crop modeling.
Sustainability 16 06554 g002
Figure 3. Analysis of the top ten authors with more than one publication in research related to the use of agricultural databases in crop modeling.
Sustainability 16 06554 g003
Figure 4. Frequency of the top ten keywords selected by authors.
Sustainability 16 06554 g004
Figure 5. Top twenty most frequent keywords plus.
Sustainability 16 06554 g005
Figure 6. Co-occurrence network of keywords that appeared at least four times within the final bibliometric dataset.
Sustainability 16 06554 g006
Figure 7. Global distribution of publications and collaborations on research related to the use of agricultural databases in crop modeling.
Sustainability 16 06554 g007
Table 1. Summary of key bibliometric information extracted from the final bibliometric dataset.
DescriptionResultsDescriptionResults
Number of publications51Keywords plus503
Number of journals36Author keywords209
Timespan of publications1999–2023Total number of authors350
Annual growth rate4.68%Single-authored publications2
Average publication age8.06 years
Average number of citations per publication25.02Average number of co-authors per publication8.39
Total number of references1405International co-authorship46.3%
Disclaimer/Publisher’s Note: The statements, opinions and data contained in all publications are solely those of the individual author(s) and contributor(s) and not of MDPI and/or the editor(s). MDPI and/or the editor(s) disclaim responsibility for any injury to people or property resulting from any ideas, methods, instructions or products referred to in the content.

