Article

Assessing the Carbon Footprint of Viticultural Production in Central European Conditions

1
Department of Electrotechnology, Faculty of Electrical Engineering and Communication, Brno University of Technology, Technická 10, 616 00 Brno, Czech Republic
2
Department of Horticultural Machinery, Faculty of Horticulture, Mendel University in Brno, Valtická 337, 691 44 Lednice, Czech Republic
3
Department of Breeding and Propagation of Horticultural Plants, Faculty of Horticulture, Mendel University in Brno, Valtická 337, 691 44 Lednice, Czech Republic
4
Research Institute of Agriculture Engineering, p. r. i., Drnovská 507, 161 01 Prague, Czech Republic
*
Author to whom correspondence should be addressed.
Sustainability 2024, 16(15), 6561; https://doi.org/10.3390/su16156561
Submission received: 14 June 2024 / Revised: 28 July 2024 / Accepted: 29 July 2024 / Published: 31 July 2024
(This article belongs to the Section Sustainable Agriculture)

Abstract

:
A number of factors will increasingly play a role in the sustainability of wine production in the coming period. The current situation suggests that the analysis of energy consumption and greenhouse gas (GHG) emissions will play a particularly important role. The so-called carbon footprint, expressed in CO2 equivalents, is used to express the sum of GHG emissions. This study presents an analysis of vine cultivation in a particular Central European region, with the main focus on quantifying the inputs, yield, fuel consumption, and GHG emissions. The emphasis was placed on conventional, integrated, and ecological production systems of growing, evaluated with the help of the developed AGROTEKIS version 5 software. A total of 30 wine-grower entities in the Morava wine-growing region, the subregion Velké Pavlovice, in the Czech Republic weather climate, were included in the input data survey. By analyzing the aggregated values, the real savings in energy and curbing of CO2 emissions of vineyards could be observed, relating to individual work procedures with lower energy demand used in the vineyard treatment as well as the amounts and doses of agrochemicals used. The average values of the total impacts did not show any statistically significant differences between the conventional (971 ± 78 kg CO2eq·ha−1·year−1) and integrated production systems (930 ± 62 kg CO2eq·ha−1·year−1), whereas the values for the ecological production system were significantly higher (1479 ± 40 kg CO2eq·ha−1·year−1). The results show that growing vines under ecological production conditions generates a higher proportion of the carbon footprint than under conventional production conditions. Overall, the best results can be achieved in an integrated production system.

1. Introduction

Major global challenges that contemporary society face include population growth, an increasing demand for food, scarcity of fresh water, deteriorating environmental quality, and increasingly in recent years, climate change caused by rising concentrations of greenhouse gases [1]. It is precisely because of the continuous increase in greenhouse gas concentrations in the atmosphere that major changes in the global climate system can be expected in the coming period. These changes will have a negative effect on all societal levels, the environment, and agriculture. According to a number of studies, agriculture is the source of 15 to 30% of all GHG emissions [2,3]. For these reasons, new sustainability strategies and cultivation technologies based on mitigation principles are being sought and tested. Overall, viticulture plays a crucial role in global agriculture and economies, combining agricultural production with cultural heritage, tourism, trade, and technological innovation. Its economic significance underscores its impact on local, regional, and global scales. According to the figures given in the report of the International Organization of Vine and Wine [4], the global acreage of vineyards was 7.2 Mha in 2023, which includes vineyards used for wine production, table grapes, and other grape products.
Despite the fact that Europe has seen a gradual decline in cultivated area in recent years due to the economic depression, it remains one of the continents with the largest share of vineyards, accounting for 38% of the world’s area. Moreover, EU Member States account for 62.9% of global wine production [5].
For these reasons, the European Union has introduced a new “farm-to-fork” strategy within the framework of the “European Green Deal” (EC, 2019), which aims at the overall recovery and greening of the entire sector [6] (EC, European Commission, 2020). From the perspective of future development and sustainability, the overall transformation of the wine sector is therefore one of the main priorities for all EU Member States. Roy et al. [7] stated that one of the tools that contributes to the determination of the environmental burden of grape production is an internationally standardized environmental tool called the life cycle assessment (LCA). This tool is often referred to as a “cradle to the grave” analysis. There has been carried out in a number of studies that emphasize the need for LSAs for viticulture and winemaking [8,9,10]. Detailed analysis of the environmental impacts will influence the way in which legislators (e.g., governments) will legislate the future development of agricultural and industrial systems in the food sector. The aim of this system is to identify the most significant environmental burdens associated with the life cycle of the system according to ISO 14040 and 14044 [11,12]. LCA studies apply a number of indicators; one of the most frequently used is the carbon footprint [13,14,15].
According to this approach, carbon footprint analysis quantifies the carbon emissions directly and indirectly caused by the activity or accumulated during the life cycle of the target product [16]. The result is a classification of the production process with a link to greenhouse gas emissions, according to the Kyoto Protocol. These emissions are then expressed in kg of CO2 equivalent (CO2 eq.) (i.e., a measure of the greenhouse effect of the gas with respect to its global warming potential) [17].
Other methods of establishing the carbon footprint are also used in practice. The objectivity of these methods always depends on the collection of consumption data for all emission sources within specified thresholds [18]. For each method, it is necessary to define all the parameters and assumptions made in the calculation of the carbon footprint. The most common principles for determining the carbon footprint are usually a calculation using data on the individual activities carried out multiplied by the standard emission factors. There are also calculation methods based on the principles of models or directly realized measurements [19]. Previous observations have shown that the highest share of GHG emissions in viticulture is due to diesel combustion and the use of pesticides and fertilizers [10,17,20,21,22,23].
Most scientific papers published recently (e.g., [24,25,26,27]) have typically narrowly focused on specific grapevine production systems and do not provide an objective comparison of the amount of greenhouse gas emissions produced. However, there is an increasing need in viticulture practice for comprehensive environmental assessments of all production systems that respect their specific characteristics [24]. For such assessments, very different methodologies and frameworks have been developed and verified, finding applications in agriculture, industry, research, and in the creation of legislative regulations. These methodologies vary significantly in terms of the scope of the input data, the accuracy, and the aspects of sustainability they evaluate (economic, social, cultural, and governance).
Some studies have assessed emission production related to certain issues in grapevine cultivation. For example, Ref. [28] compared the impact of fertilizing vineyard alleys with compost incorporated into the soil against an unfertilized control variant. The results did not confirm significant differences in the amount of emissions produced. Another study [29] focused on reducing the emissions released from soil in tilled vineyards and no-till vineyard alleys also did not demonstrate statistically significant differences. Zhang et al. [30] confirmed that Good Agricultural Practices (GAPs) are fundamental for reducing soil emissions during the irrigation and fertilization of vineyards. These findings could be applied to different vineyard management methods such as mulching the soil surface with organic matter, the handling of pruning, etc. Rose et al. [31] stated that software applications incorporating one or more simulation models and communication functions are suitable tools for decision-making by farmers and advisory entities. These applications allow for the analysis and synthesis of various input data.
One specific example of such a software application is the interactive dialogue program AGROTEKIS, designed for modeling and economically evaluating technological procedures and the resulting economics of crop cultivation. This expert system and its extensive database are jointly used within the framework of international reporting by the Ministry of the Environment of the Czech Republic for the processing of the national emission inventory of pollutants from agricultural machinery operations in the Czech Republic—NFR category 1A.4.c.II-Agriculture, processed according to the methodology of the EMEP/EEA air pollutant emission inventory guidebook within the Convention on Long-Range Transboundary Air Pollution [32].
The database system enables the calculation of the input activity data related to fuel consumption from various agricultural operations, which is then used to calculate the emissions of the monitored pollutants. Summary results of the fuel consumption are provided, for instance, in Chapter III.3.4 of the Informative Inventory Report Czechia, 2023 [33], pp. 42–43. This system allows for a new evaluation approach with several methodological modifications. The main differences lie in the possibility of a comprehensive assessment of different farming systems, which takes into account the ratio of manual and mechanized work operations as well as the soil maintenance system and the use of the latest methodologies for assessing the carbon footprint.
The aim of this paper is a model-based evaluation of the technological practices applied in grapevine cultivation in the realm of Central Europe, with the main emphasis on the quantification of inputs, yield, fuel consumption, and the determination of greenhouse gas emissions, with an overlap of the conventional, integrated, and ecological production systems using the AGROTEKIS software.

2. Materials and Methods

2.1. The Viticultural Area

For the purposes of the model evaluations, data obtained from wine-growing entities farming in the Morava wine-growing region, subregion Velké Pavlovice (Figure 1), were used.

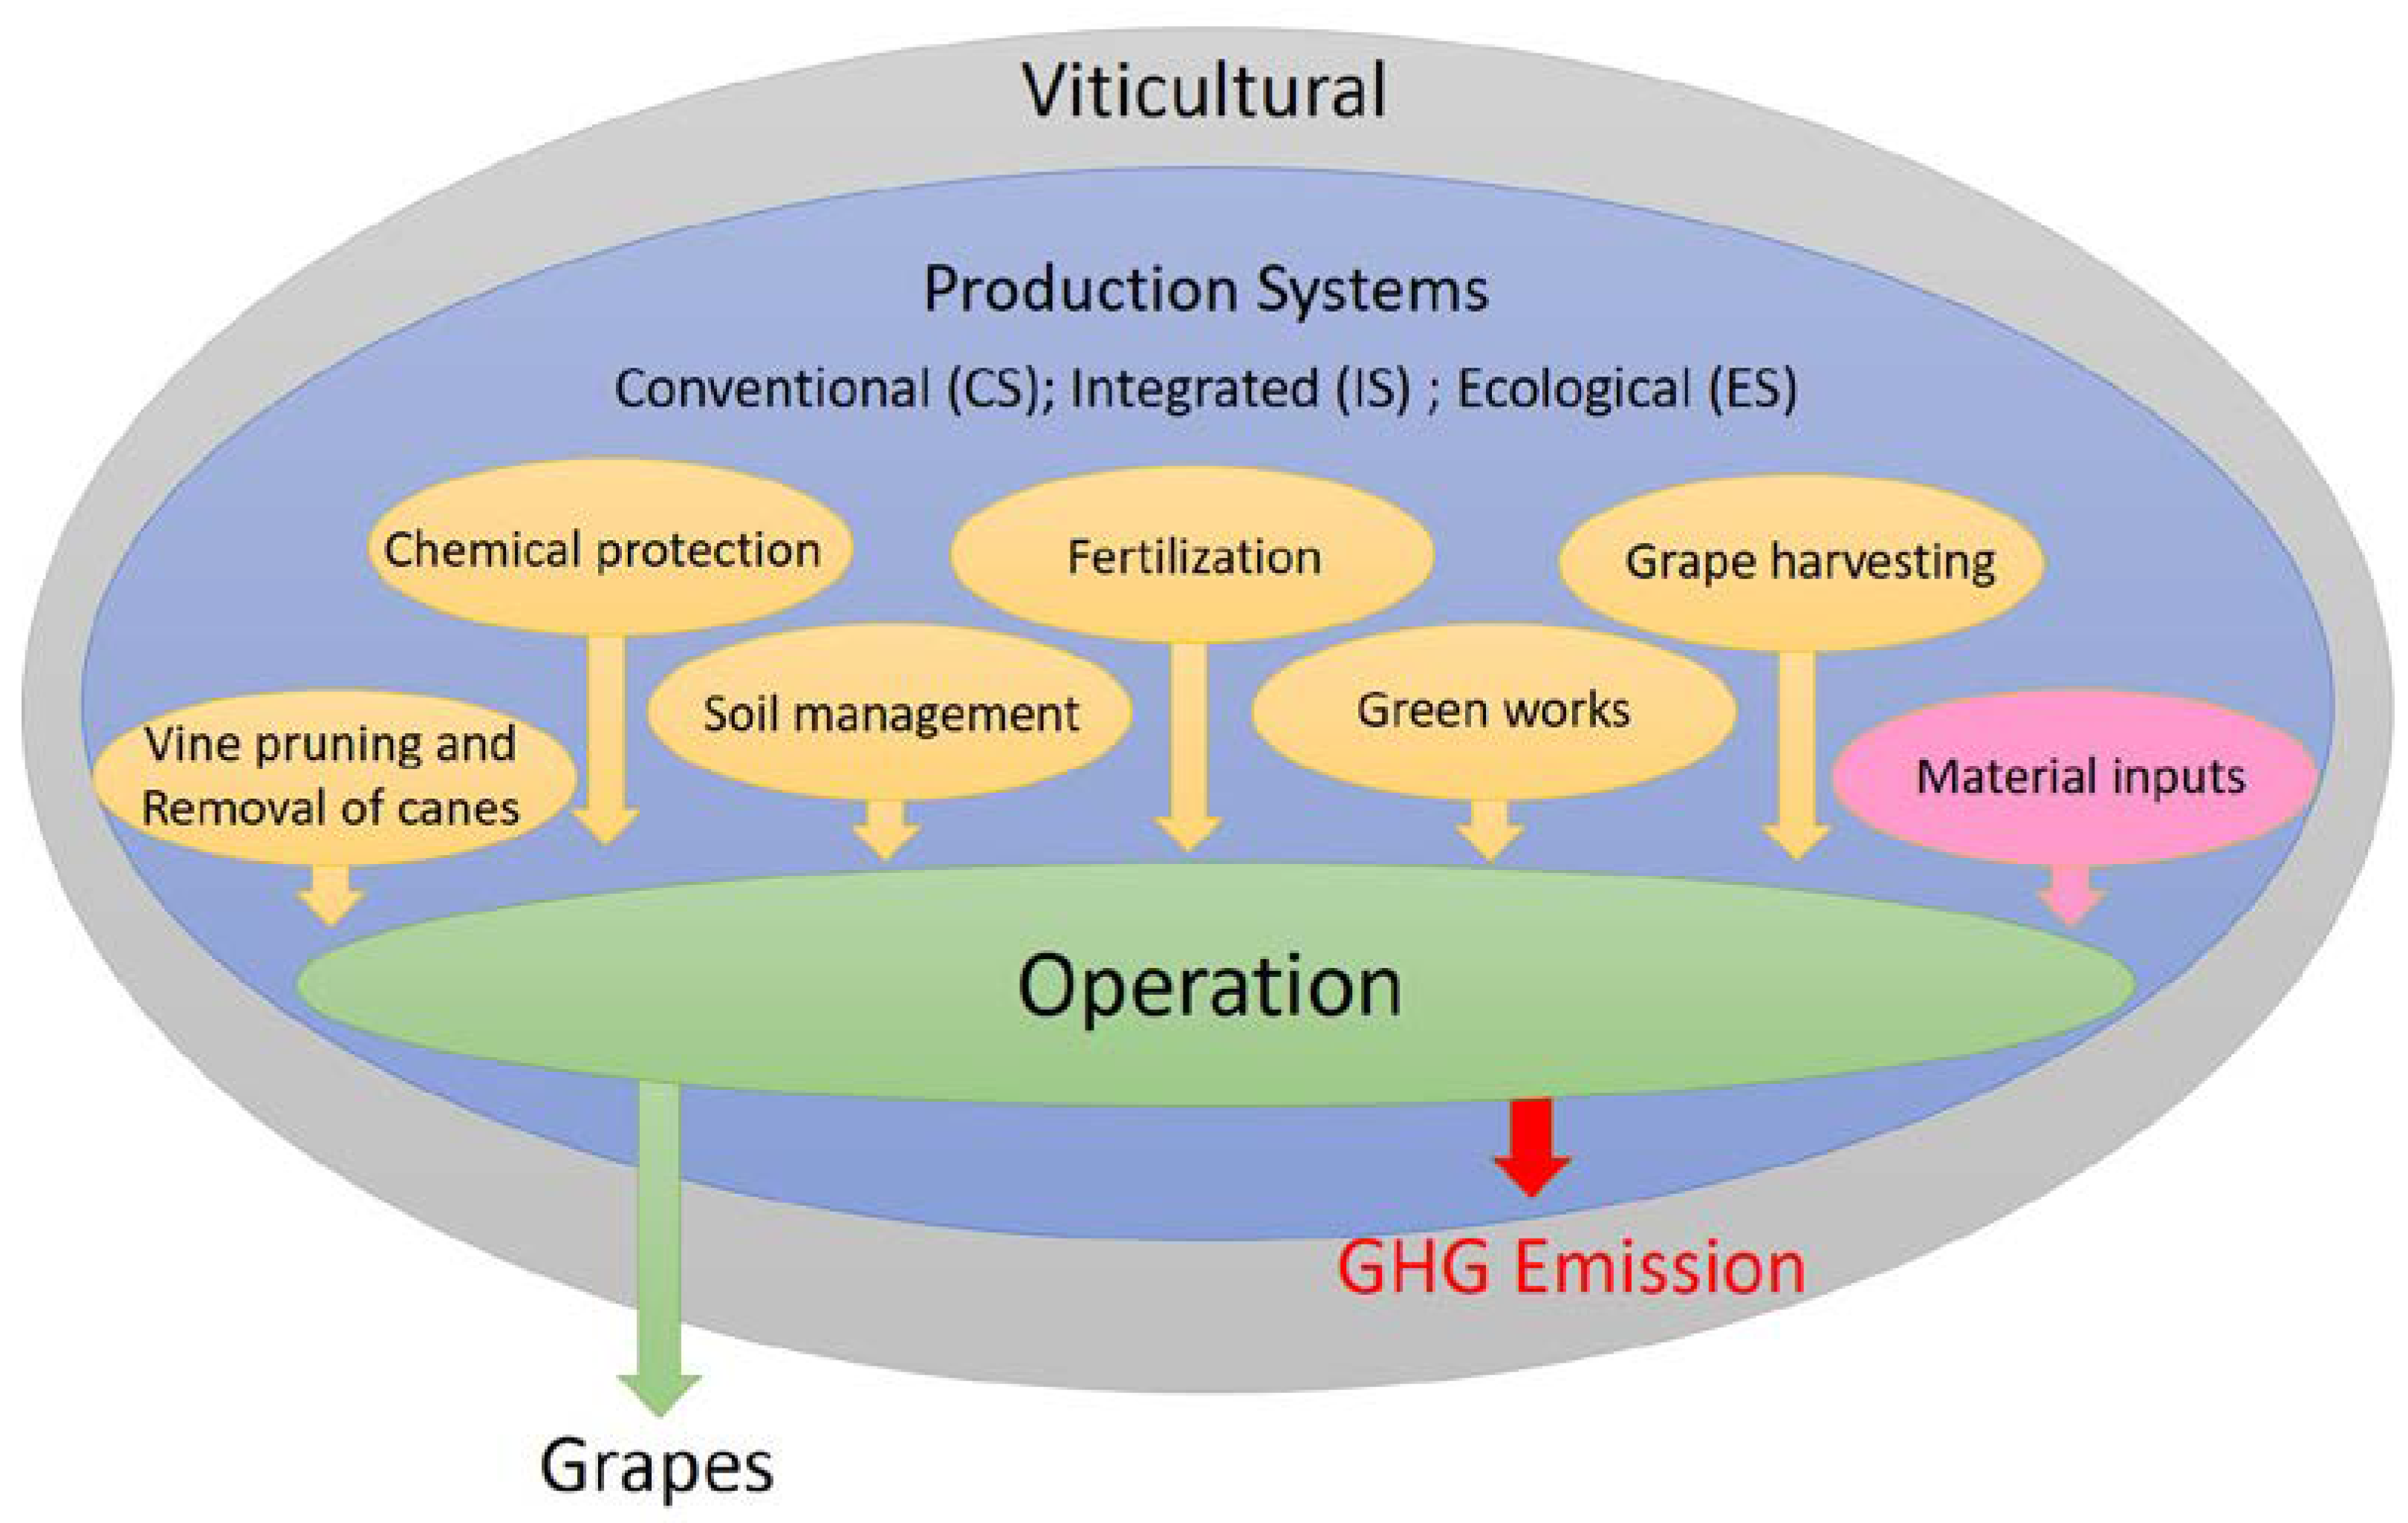
2.2. Data Acquisition and System Boundaries

A total of 30 viticultural entities were included in the input data survey, and the data were collected through a questionnaire survey in the years 2022–2023. Almost 96% of all vineyards registered in the Czech Republic are concentrated in the Morava wine-growing area (colored in Figure 1). The Velké Pavlovice subregion is the largest in terms of vineyard area and covers an area of almost 4800 ha. The long-term average annual temperature is 9.42 °C and the average annual rainfall is 510 mm. The average annual wind speed in the area is 3–5 m·s−1 (at a height of 10 m above the ground).
System boundaries were limited only to the agricultural phase (i.e., grape production) to allow for direct comparisons between different cultivation systems, regardless of the post-agricultural life cycle phases. For each system, the analyses performed respected the work operations implemented such as vine pruning, chemical protection, fertilization, grape harvesting and the main material inputs such as fossil fuels, pesticides, fertilizers, and seed consumption, as shown in Figure 2.
For the purpose of the evaluation, wineries were selected that applied the same variant of the technological procedure, which was the use of alternating every second alley grassed. The bushes were grown with 1.0 m between plants (intra-row) and 2.2 m between rows (inter-row, alleys) with 4545 pcs of vines per ha. The shrubs were grown on a high line with a height of 1.0 m and shaped using a 1-cane (cordon) grape training system. The height of the trellis was 2.1 m. The size categories of vineyards with a cultivated area of 8–10 ha were chosen as the most widespread in terms of representation.
During the surveys conducted in the form of guided personal interviews and obtaining data from the required records, attention was particularly focused on data on the fertilizers and pesticides used (type, active substance) and their application rates, data on manual and mechanized operations and their repeatability during the year, and in the case of mechanized operations, data on the mechanized equipment used, its performance, and fuel consumption. The long-term average grape yield in the Morava wine-growing region is around 6000 kg·ha−1. This reflects the region’s focus on quality wine production, which often involves practices that prioritize grape quality over quantity.

2.3. Life Cycle Inventory (LCI)

Each third of the vineyards applies different production systems—conventional, integrated, and ecological.
The conventional system (CS) of production is the standard method but has the disadvantage of requiring a large volume of inputs. These include, in particular, chemicization [34] (application of industrial fertilizers, non-selective herbicides, broad-spectrum insecticides) and uncoordinated use of mechanization (contributes to compaction of the subsoil due to repeated passes, disturbance of the soil structure by repeated cultivation of the alleys).
The integrated system (IS) is a method of agricultural management aimed at ensuring sustainable development as defined by Article 6 of Act No. 17/1992 Coll. on the Environment (“Permanently Sustainable Development”) [35,36,37]. Registered members of the association must follow strict international criteria set by the IP Association for their vineyards. In the Czech Republic, these criteria are updated approximately every two years under the name ‘Guidelines of the Union of Integrated Grape and Wine Production’. The guidelines are based on vine IP systems developed for Swiss viticulture by Basler [38] and Murisier et al. [39], and are now the basis for international requirements for vine IP systems set by the IOBC.
The IS focuses on maintaining or improving soil fertility and a diverse environment. It employs forecasting and signaling methods for vine protection and nourishment, uses natural biotechnologies and authorized agrochemicals, and strictly controls herbicide application. Herbicides can only be applied at permitted rates and repetitions in the weed-free strip under the trellis. A consistent, systematic approach to vine-growing and processing technology is essential for optimizing both the economic and ecological aspects of production.
The ecological system (ES) of production is part of the so-called alternative agriculture. This system respects the principles of ecological farming, which is controlled by Act 242/2000 Coll., on organic farming, Council Regulation (EEC) No. 2092/91 and Commission Implementing Regulation EU 203/2012. This system strictly adheres to rules in organically certified vineyards, which eliminate the use of mineral fertilizers, pesticides, or synthetically prepared substances like plant hormones. At critical moments, sulfur and copper preparations or natural products (plant extracts) are allowed for fungal disease protection. Pheromones, beneficial organisms, and methods that encourage natural predators are used against pests. Weeds are managed through preventive agrotechnology, green manuring, and mulching. Herbicide use is completely banned. This method maximizes the use of ecosystem information including forecasting, signaling, and expert systems.

2.4. The Software Used and Determination of the Carbon Footprint (CO2eq)

All of the data obtained were input to the AGROTEKIS online modeling database system, Version 5, published in 2022, which is continuously updated in relation to legislative regulations (Research Institute of Agricultural Engineering, p.r.i., Prague, Czech Republic). On the basis of the input data, statistical processing (mean, standard deviation) was carried out, and model variants of technological practices were constructed, respecting the three described production systems.
The determination of the emissions, or carbon footprint, associated with the individual process models was carried out according to a methodology working with typical greenhouse gas emission values according to Chapter VII of Commission Implementing Regulation (EU) 2022/996 [40]. The total GHG emissions related to the model’s technological practices in viticulture production is calculated as the sum of the emissions produced during one year in the composition:
  • Greenhouse gas emissions from fertilizer production and transport (kg CO2eq·ha−1·year−1), these calculations include emissions due to the neutralization of acidification caused by fertilizer. The calculation used here accounts for CO2 emissions from the neutralization of nitrogen fertilizer acidity;
  • Greenhouse gas emissions from the pesticides used (kg CO2eq·ha−1·year−1);
  • Greenhouse gas emissions from the fuel used for the operation of machinery means (kg CO2eq∙ha−1·year−1) [41].
GHG emissions from the production and transport of mineral fertilizers were calculated as follows, in accordance with the methodology:
ehn = Σ mhni × efhni_(kg CO2eq∙ha−1·year−1),
where:
  • mhni je is the amount of the i-th fertilizer (expressed in pure nutrients) that is used on one hectare of land per year;
  • efhni is the emission factor from the production and transport of i-th fertilizer (kg CO2eq·kg nutrient−1) [41].
For the calculations, emission factors according to Annex IX of Implementing Regulation 2022/996 including greenhouse gas emissions from upstream phases of mineral fertilizer production should be used [40].
General emission factors can also be used for the modeling and evaluation of viticulture technologies [42].
The general emission factors for individual fertilizers are:
  • 4.5719 kg CO2eq·kg nutrient−1 applied for nitrogen fertilizers;
  • 0.5417 kg CO2eq·kg nutrient−1 applied for phosphate fertilizer (P2O5);
  • 0.4167 kg CO2eq·kg nutrient−1 applied for potassium fertilizer application in the form of K2O.
The emission factor from the neutralization of nitrogen fertilizers in soil according to Annex IX Implementing Regulation 2022/996 of the Commission Regulation is 0.783 kg CO2-kg N−1 [42].
Data on fertilizer use per hectare of vineyard over the course of one year were used to calculate the total amount of fertilizer. The data were obtained from input information from the vineyard operators surveyed.
The greenhouse gas emissions from the pesticides used were in accordance with the methodology calculated as follows:
ehn = Σ mpei × efpei_(kg CO2eq∙ha−1·year−1),
where:
  • mpei is the amount of the i-th pesticide used per one hectare of land per year;
  • efpei is the emission factor from the production of the i-th pesticide (kg CO2eq·kg nutrients−1) [41].
Emission factors for plant protection products are set out in the ISCC manual [43].
The values of the emission factors used are:
  • 11.552 kg CO2eq·kg active substance−1 for glyphosate;
  • 10.970 kg CO2eq·kg active substance−1 for other plant protection products (ISCC System GmbH, Koeln, Germany, 2021).
The data on the quantities of active substances were obtained from the Register of Authorized Plant Protection Products maintained by the Central Institute for Inspection and Testing in Agriculture. The register is open to the public, and the database contains plant protection products and auxiliary plant protection products authorized for use in the Czech Republic.
Greenhouse gas emissions from fuel used in the operation of machinery were calculated as follows, in accordance with the methodology:
epalPHM = Σ Spali × efpali_(kg CO2eq∙ha−1·year−1),
where:
  • Spali is the total annual amount of the i-th fuel (in this case diesel) used per hectare of land per year (l·ha−1·year−1);
  • efpali is the emission factor from the consumption of the i-th fuel (kg CO2eq·l−1).
The emission factor for diesel fuel according to the Commission Implementing Regulation (EU) 2022/996 on the rules for verifying sustainability and greenhouse gas savings criteria and low risk indirect land use change criteria is 3.4102 kg CO2eq−l·l−1 [43].

2.5. Statistical Evaluation Methods

Each variant measurement was repeated 10 times. The one factor analysis of variance (ANOVA) and Tukey’s honestly significant difference (HSD) tests were conducted to determine the differences among averages at a significance level of α = 0.05. The results were reported as averages and standard deviations. The Statistica 14.0 (TIBCO Software Inc., Palo Alto, CA, USA) software package was used.

3. Results and Discussion

Table 1 provides an overview of the common work operations for each evaluated variant of the technological procedures, categorized by conventional, integrated, and ecological production systems. The overview revealed that many work operations are shared across these systems. However, each production system also has unique characteristics, particularly in the use of plant protection products, fertilizers, and seeds for soil greening between vineyard rows.
For individual operations, it is necessary to take into account their overall frequency during the growing season. Regardless of the production system chosen, comparable categories of machinery are used for each vineyard. In the model calculations carried out using AGROTEKIS, the average values of labor and diesel fuel consumption for a given work operation were then considered (Table 2).
The output report of AGROTEKIS showed that the values of labor intensity range between 278 and 371 h·ha−1. Comparing the labor intensity values with the data reported by Walg [44] for the conditions in Germany (150–300 h·ha−1 for operations with a cultivated area of 30–80 ha), the values were higher, which corresponded to the different size structure of the operations surveyed as well as the lower level of mechanization equipment. Smaller vineyard enterprises in the conditions of the Czech Republic are not equipped with a complete range of mechanization means to ensure all working operations. Therefore, within the framework of the applied technological procedures, part of the operations (especially green work) is carried out in the traditional manual way, which increases the overall level of labor intensity. This higher labor intensity paradoxically leads to lower fuel consumption, and consequently lower emissions. Under Czech conditions, this can reduce the fuel-related emissions by 15–31%. Similarly, for example, Villanueva-Rey et al. [45] compared three different farming systems in Spanish conditions—biodynamic, biodynamic without certification, and conventional. The results obtained demonstrate the greatest reduction in environmental load for the biodynamic system. The main reason given was a reduction of up to 80% in fuel consumption, linked to a lower proportion of mechanized labor operations and a significantly lower consumption of plant protection products and fertilizers.
In contrast, the opposite trend has been observed in more advanced viticultural countries like France and Germany. For example, Ponstein et al. [46], in their study based on cash flow analyses of 14 vineyard operations in Germany, described a higher proportion of fuel consumed by machinery.
The cultivation of fruitful vineyards is influenced by a number of biotic and abiotic factors under operational conditions. These include the interaction of climatic factors, soil conditions, and the chosen farming method, which are linked to the characteristics and doses of fertilizers used and the choice of plant protection products against harmful pathogens. Marras et al. [47] extended the list of factors involved to include the grape variety grown (direct impact on grape yield) and the effect of microclimatic conditions such as temperature, insolation, and total annual rainfall. The ratio of manual to mechanized work operations also plays an important role, depending on the size of the vineyard and its equipment with the necessary machinery. Silva and Silva [48], in their research on the determination of the carbon footprint of viticulture in southern European conditions, stated that the main sources of greenhouse gas emissions included fuel consumption and the use of fertilizers [49]. This corresponded to the values established for the technological practices in conventional, integrated, and ecological production systems (Table 3).
Comparison of the LCA results of the three evaluated production systems using the analysis of aggregated values attributed the actual saving of CO2 emissions in vineyards specifically to the optimal choice of individual work operations within the applied technological procedures. The selection of machinery, the energy intensity of each operation, and its frequency throughout the year as well as the type and quantity of agrochemicals applied, play crucial role. Given the real conditions and requirements for quality vineyard treatment, omitting certain work operations or significantly reducing their frequency while also eliminating plant protection products is highly complex. This requires optimizing technological procedures through effective prognosis and detection methods, combined with the grower’s experience and knowledge of agrotechnical requirements and site-specific conditions.
Table 3 illustrates a significant increase in emissions from fungicides and insecticides used in the ecological production system. This increase was due to the higher concentrations of active substances in these products and the often higher application rates compared to those used in conventional or integrated production systems. This highlights an emerging paradox: while the products used in ecological production systems are more environmentally friendly in terms of the involved chemicals and their residues, their use is associated with significantly higher emissions. Ghiglieno et al. [24] compared the CO2 production of vineyards under conventional and ecological production systems located in the northern Italian region. In the case of emissions from fuel consumption, they reported, with that many significant figures, a mean value of 878.72 kg CO2eq·ha−1·year−1 for vineyards under conventional production and a mean value of 1199.48 kg CO2eq·ha−1·year−1 for vineyards under ecological production. At the same time, the authors pointed out the high variability of the input values. This was due to the different sizes of the farms being investigated, the application of specific work operations, and the equipment required. Also, Tuomisto et al. [50] pointed to a higher environmental GHG emission burden due to the high variability of the applied technological practices, which depend more on the management choices of the winery than on the management system. They considered the input values of the natural and synthetic substances used (fertilizers, sprays) to be the main cause of the emission burden. Gierling et al. [51], and similarly Rouault et al. [25], pointed out the main problem of the increasing emission burden in viticulture as the increasing share of mechanized work operations.
Figure 3 shows the statistical evaluation of the total GHG emissions for the different variants of the applied management systems. The average values of the total impacts did not show any statistically significant differences between the conventional (971.73 ± 78.08 kg CO2eq·ha−1·year−1) and integrated production systems (930.08 ± 62.17 kg CO2eq·ha−1·year−1), whereas the values for the ecological production system were significantly higher (1479.15 ± 40.35 kg CO2eq·ha−1·year−1) with a statistically significant difference.
By converting the average values of the total impacts using data on the average grape production (6 t∙ha−1), the total CO2eq emissions per ton of production can be determined. Thus, in the case of the conventional production system, the total CO2eq per ton of production is 162.30 kg, 155.05 kg in the case of the integrated system, and 246.49 kg in the case of the ecological system. The assessment of the total carbon footprint in fruitful vineyards under conditions in southern Sardinia was addressed by Marras et al. [47]. As a result of their activities, the carbon footprint was quantified at 390 kg CO2eq per ton of production. They attributed the relatively high level of emissions to a higher intensification of production and higher doses of agrochemicals used. Steenwerth et al. [52] reported 87–584 kg CO2 per one ton of grapes and Bartocci and Fantozzi [53] found values of 310–470 kg. CO2 per ton. The assessment of the carbon footprint of fertile vineyards was also addressed by Litskas et al. [54] under the conditions of Cyprus. The carbon footprint was determined to be 850 kg CO2eq per ton of production for the Soultanina variety, 560 kg for the Cabernet Sauvignon variety, and 280 kg for the Xynisteri variety. Additionally, Helfer and Kissinger [55] assessed the carbon footprint of Mediterranean vineyards. Their results indicate that the average emission footprint of productive vineyards here is 342 kg CO2eq per ton of production per year. A detailed analysis of the results confirmed a 37% share of emissions related to fertilizer use, 19% related to fuel consumption, and 17% from supplementary irrigation.
Venkat [56] reported that growing grapevines under ecological production conditions generated a higher carbon footprint than under conventional production conditions. This fact corresponds to a number of factors in the ecological production system such as the high proportion of operations related to chemical protection of the crop, transport, and application of high doses of ecological matter and seeds for the greening of the inter-rows. Last but not least, the lower average yield of grapes was also the cause. A number of studies have concordantly confirmed that, in terms of carbon footprint, conventional cropping systems have a lower environmental impact [56,57].

4. Conclusions

In recent years, viticulture in the Czech Republic has increasingly focused on sustainable grape growing systems. These systems aim to reduce greenhouse gas emissions by minimizing energy and water consumption and the use of agrochemicals (sprays, fertilizers, and other pollutants). The results obtained from a broad survey of input data were utilized as input values for the AGROTEKIS software. The findings demonstrate that the software can serve as an effective tool in viticultural practice, consultancy, and departmental research and enables the rapid and efficient modeling of technological procedures in numerous variants, respecting real-world conditions of viticultural operations. Users can easily translate these results into specific cultivation strategies, thereby reducing the ecological footprint of the wine-growing sector. Key elements of this strategy include selecting suitable mechanization types with higher fuel efficiency or electric motors, reducing the energy intensity of specific work operations (e.g., decreasing the depth and frequency of soil processing), and optimizing the selection and dosage of plant protection products (fungicides, insecticides, and herbicides) as well as other inputs such as fertilizers and seeds. The results confirm that these factors significantly impact the emissions produced.
Future research should involve a broader mapping of input information across various vineyard operation sizes, the selection and optimization of material input rates, and strict adherence to all agrotechnical interventions. Additionally, interactions between the grower, the terroir, and the selection of suitable varieties with natural resistance to fungal diseases should be considered.

Author Contributions

Conceptualization, V.M. and P.V.; Methodology, P.B. (Petr Bača) and P.B. (Patrik Burg); Software, V.M.; Validation, T.B., P.V. and J.B.; Formal analysis, J.B., Z.A. and V.M.; Investigation, V.M., Z.A. and P.V.; Resources, P.B. (Petr Bača) and P.B. (Patrik Burg); Data curation, P.B. (Petr Bača), J.B., V.M. and P.B. (Patrik Burg); Writing—original draft preparation, V.M. and P.V.; Writing—review and editing, P.B. (Petr Bača), P.V. and V.M.; Visualization, T.B.; Supervision, P.B. (Petr Bača) and P.V.; Project administration, P.B. (Petr Bača); Funding acquisition, P.B. (Petr Bača). All authors have read and agreed to the published version of the manuscript.

Funding

This research was funded by the Ministry of Agriculture of the Czech Republic and by Operational Programme Research, Development, and Education—Research Infrastructure for Young Scientists, project number CZ.02.1.01/0.0/0.0/16_017/0002334, the Internal Grant Agency of MENDELU Faculty of Horticulture—The evaluation of different methods of soil surface cultivation in vineyards with regards to CO2 emissions, project number IGA-ZF/2023-ST2-010, and by the specific research project at BUT, project number FEKT-S-23-8286.

Institutional Review Board Statement

Not applicable.

Informed Consent Statement

Not applicable.

Data Availability Statement

Data are contained within the article.

Conflicts of Interest

The authors declare no conflicts of interest.

References

  1. Raihan, A.; Begum, R.; Nizam, M. A meta-analysis of the economic value of forest carbon stock. Malays. J. Soc. Space 2021, 17, 321–338. [Google Scholar] [CrossRef]
  2. Metz, B.; Davidson, O.R.; Bosch, P.R.; Dave, R.; Meyer, L.A. (Eds.) Climate Change 2007 Mitigation of Climate Change; Cambridge University Press: New York, NY, USA, 2007; p. 851. [Google Scholar]
  3. Rinaldi, S.; Bonamente, E.; Scrucca, F.; Merico, M.C.; Asdrubali, F.; Cotana, F. Water and Carbon Footprint of Wine: Methodology Review and Application to a Case Study. Sustainability 2016, 8, 621. [Google Scholar] [CrossRef]
  4. Report: International Organization of Vine and Wine, OIV State of the World Vine and Wine Sector in 2023, Dijon, France. 2024, p. 21. Available online: https://www.oiv.int/sites/default/files/2024-04/OIV_STATE_OF_THE_WORLD_VINE_AND_WINE_SECTOR_IN_2023.pdf (accessed on 14 June 2024).
  5. FAOSTAT. Food and Agriculture Organization of the United Nations (FAO). Statistics. Available online: https://www.fao.org/faostat/en/#data/QCL (accessed on 7 July 2024).
  6. European Commission. Commission Implementing Regulation (EU) 2020/2087 of 14 December 2020, Concerning the Non-Renewal of the Approval of the Active Substance Mancozeb. Off. J. Eur. Union 2020, L 423, 50–52.
  7. Roy, P.; Nei, D.; Orikasa, T.; Xu, Q.; Okadome, H.; Nakamura, N.; Shiina, T. A review of life cycle assessment (LCA) on some food products. J. Food Eng. 2009, 90, 1–10. [Google Scholar] [CrossRef]
  8. Vázquez-Rowe, I.; Villanueva-Rey, P.; Iribarren, D.; Teresa Moreira, M.; Feijoo, G. Joint life cycle assessment and data envelopment analysis of grape production for vinification in the Rías Baixas appellation (NW Spain). J. Clean. Prod. 2012, 27, 92–102. [Google Scholar] [CrossRef]
  9. Neto, B.; Dias, A.C.; Machado, M. Life cycle assessment of the supply chain of a Portuguese wine: From viticulture to distribution. Int. J. Life Cycle Assess. 2013, 18, 590–602. [Google Scholar] [CrossRef]
  10. Rugani, B.; Vázquez-Rowe, I.; Benedetto, G.; Benetto, E. A comprehensive review of carbon footprint analysis as an extended environmental indicator in the wine sector. J. Clean. Prod. 2013, 54, 61–77. [Google Scholar] [CrossRef]
  11. ISO 14040; Environmental Management—Life Cycle Assessment—Principles and Framework. International Organization for Standardization: Geneva, Switzerland, 2006.
  12. ISO 14044; Environmental Management—Life Cycle Assessment—Requirements and Guidelines. International Organization for Standardization: Geneva, Switzerland, 2006.
  13. Čuček, L.; Klemeš, J.J.; Kravanja, Z. A Review of Footprint analysis tools for monitoring impacts on sustainability. J. Clean. Prod. 2012, 34, 9–20. [Google Scholar] [CrossRef]
  14. Laurent, A.; Olsen, S.; Hauschild, M. Limitations of Carbon Footprint as Indicator of Environmental Sustainability. Environ. Sci. Technol. 2012, 46, 4100–4108. [Google Scholar] [CrossRef] [PubMed]
  15. Scipioni, A.; Mazzi, A.; Manzardo, A.; Mastrobuono, M. Monitoring the carbon footprint of products: A methodological proposal. J. Clean. Prod. 2012, 36, 94–101. [Google Scholar] [CrossRef]
  16. Wiedmann, T.; Minx, J. A Definition of Carbon Footprint. CC Pertsova Ecol. Econ. Res. Trends 2008, 2, 55–65. [Google Scholar]
  17. Bosco, S.; Di Bene, C.; Galli, M.; Remorini, D.; Massai, R.; Bonari, E. Greenhouse gas emissions in the agricultural phase of wine production in the Maremma rural district in Tuscany, Italy. Ital. J. Agron. 2011, 6, e15. [Google Scholar] [CrossRef]
  18. Hammerschlag, R.; Barbour, W. Life-Cycle Assessment and Indirect Emission Reductions: Issues Associated with Ownership and Trading; Institute for Lifecycle Environmental Assessment: Seattle, WA, USA, 2003; p. 15. [Google Scholar]
  19. Gao, T.; Liu, Q.; Wang, J. A comparative study of carbon footprint and assessment standards. Int. J. Low-Carbon Technol. 2014, 9, 237–243. [Google Scholar] [CrossRef]
  20. Galli, A.; Kitzes, J.; Pulselli, R.; Borsa, S.; Marchettini, N. Ecological Footprint Analysis Applied to the Production of Two Italian Wines. Agric. Ecosyst. Environ. 2008, 128, 162–166. [Google Scholar] [CrossRef]
  21. Pizzigallo, A.C.I.; Granai, C.; Borsa, S. The joint use of LCA and emergy evaluation for the analysis of two Italian wine farms. J. Environ. Manag. 2008, 86, 396–406. [Google Scholar] [CrossRef]
  22. Benedetto, G. The environmental impact of a Sardinian wine by partial Life Cycle Assessment. Wine Econ. Policy 2013, 2, 33–41. [Google Scholar] [CrossRef]
  23. Fusi, A.; Guidetti, R.; Benedetto, G. Delving into the environmental aspect of a Sardinian white wine: From partial to total life cycle assessment. Sci. Total Environ. 2014, 472, 989–1000. [Google Scholar] [CrossRef]
  24. Ghiglieno, I.; Simonetto, A.; Facciano, L.; Tonni, M.; Donna, P.; Valenti, L.; Gilioli, G. Comparing the Carbon Footprint of Conventional and Organic Vineyards in Northern Italy. Sustainability 2023, 15, 5252. [Google Scholar] [CrossRef]
  25. Rouault, A.; Beauchet, S.; Renaud-Gentie, C.; Jourjon, F. Life Cycle Assessment of Viticultural Technical Management Routes (TMRs): Comparison Between an Organic and an Integrated Management Route. OENO One 2016, 50, 77–89. [Google Scholar] [CrossRef]
  26. Navarro, A.; Puig, R.; Kılıç, E.; Penavayre, S.; Fullana-i-Palmer, P. Eco-innovation and benchmarking of carbon footprint data for vineyards and wineries in Spain and France. J. Clean. Prod. 2017, 142, 1661–1671. [Google Scholar] [CrossRef]
  27. Valenti, L.; Ghiglieno, I.; Sambo, F.; Pitacco, A.; Tezza, L.; Vendrame, N.; Virgili, G.; Minardi, I.; Giovenali, E.; LoBello, J. LIFE15 ENV/IT/000392—LIFE VITISOM Project, viticulture innovation technology and GHG emission monitoring. BIO Web Conf. 2019, 13, 02008. [Google Scholar] [CrossRef]
  28. Schneider, N.; Islam, M.; Wehrle, R.; Pätzold, S.; Brüggemann, N.; Töpfer, R.; Herzog, K. Deep incorporation of organic amendments into soils of a ‘Calardis Musqué’ vineyard: Effects on greenhouse gas emissions, vine vigor, and grape quality. Front. Plant Sci. 2023, 14, 1253458. [Google Scholar] [CrossRef]
  29. Lazcano, C.; Gonzalez-Maldonado, N.; Yao, E.H.; Wong, C.T.F.; Falcone, M.; Dodson Peterson, J.; Casassa, L.F.; Malama, B.; Decock, C. Assessing the Short-Term Effects of No-Till on Crop Yield, Greenhouse Gas Emissions, and Soil C and N Pools in a Cover-Cropped, Biodynamic Mediterranean Vineyard. Aust. J. Grape Wine Res. 2022, 2022, 8100818. [Google Scholar] [CrossRef]
  30. Zhang, J.; Ji, Y.; Guo, Y.; Yin, X.; Li, Y.; Han, J.; Liu, Y.; Wang, C.; Wang, W.; Liu, Y.; et al. Responses of soil respiration and microbial community structure to fertilizer and irrigation regimes over 2 years in temperate vineyards in North China. Sci. Total Environ. 2022, 840, 156469. [Google Scholar] [CrossRef]
  31. Rose, D.C.; Sutherland, W.J.; Parker, C.; Lobley, M.; Winter, M.; Morris, C.; Twining, S.; Ffoulkes, C.; Amano, T.; Dicks, L.V. Decision support tools for agriculture: Towards effective design and delivery. Agric. Syst. 2016, 149, 165–174. [Google Scholar] [CrossRef]
  32. Agency, E.E. EMEP/EEA Air Pollutant Emission Inventory Guidebook 2023. Available online: https://www.eea.europa.eu/publications/emep-eea-guidebook-2023/part-b-sectoral-guidance-chapters/1-energy/1-a-combustion/1-a-4-non-road/at_download/file (accessed on 28 July 2024).
  33. Dvořáková, I.; Filipenská, M.; Kassymova, A.; Machálek, P.; Saarikivi, R.J.; Vodičková, B.; Dědina, M.; Dufek, J.; Geiplová, H.; Kačmárová, Z.; et al. Informative Inventory Report Czechia 2023. Emission Inventories from the Base Year of the Protocols to the Year 2021. Available online: https://cdr.eionet.europa.eu/cz/un/clrtap/iir/envy90dea/CZ_IIR_2023.pdf (accessed on 20 July 2024).
  34. Rich, V. Soviet fertilizers: Going it alone. Nature 1980, 288, 314. [Google Scholar] [CrossRef]
  35. Boller, E.F.; Avilla, J.; Joerg, E.; Malavolta, C.; Wijnands, F.G.; Esbjerg, P. Integrated Production Principles and Technical Guidelines; International Organization for Biological and Integrated Control of Noxious Animals and Plants: Zurich, Switzerland, 2004; Volume 27. [Google Scholar]
  36. Wijnands, F.; Malavolta, C.; Alaphilippe, A.; Gerowitt, B.; Baur, R. IOBC-WPRS IP Objectives and Principles. Available online: https://iobc-wprs.org/wp-content/uploads/2022/06/IOBC-WPRS_IP_objectives_and_principles_4th_edition_2018_EN.pdf (accessed on 28 July 2024).
  37. Malavolta, C.; Duso, C. Grapes (for Wine and Table Grapes). Available online: https://iobc-wprs.org/ip-tools/general-and-crop-specific-ip-guidelines/grapes/ (accessed on 10 July 2024).
  38. Basler, P. Integrierte Produktion im Weinbau. Die Grüne 1990, 39, 9–15. [Google Scholar]
  39. Murisier, F.; Ryser, J.P.; Schwarz, J.J.; Hugon, F. Domaines à techniques intégrées (DTI) en viticulture: Bilan nutritionnel et viticole—Techniques of integrated production in viticulture: Nutritive and viticultural evaluation. Rev. Suisse De Vitic. Arboric. Hortic. 1992, 24, 373–379. [Google Scholar]
  40. EUR-Lex. Commission Implementing Regulation (EU) 2022/996 of 14 June 2022 on Rules to Verify Sustainability and Greenhouse Gas Emissions Saving Criteria and Low Indirect Land-Use Change-Risk Criteria. Available online: https://eur-lex.europa.eu/legal-content/EN/TXT/?uri=CELEX:32022R0996 (accessed on 14 June 2024).
  41. Dědina, M.; Jevič, P.; Abrham, Z.; Čermák, P.; Klír, J.; Wollnerová, J.; Beranová, J. Výpočet Typických Měrných Emisí Skleníkových Plynů z Pěstovaní a Zpracování Zemědělských Surovin pro Stanovení Hodnoty Jejich Emisních Faktorů: Certifikovaná Metodika. [Calculation of Typical Specific Emissions of Greenhouse Gases from the Cultivation and Processing of Agricultural Raw Materials to Determine the Value of Their Emission Factors: A Certified Methodology.]; Výzkumný Ústav Zemědělské Techniky: Praha, Czech Republic, 2023; p. 64. (In Czech) [Google Scholar]
  42. Edwards, R.; Padella, M.; Giuntoli, J.; Koeble, R.; O’ Connell, A.; Bulgheroni, C.; Marelli, L. Definition of Input Data to Assess GHG Default Emissions from Biofuels in EU Legislation; Publications Office of the European Union: Luxembourg, 2017. [Google Scholar]
  43. ISCC. ISCC EU 205 Greenhouse Gas Emissions; ISCC System GmbH: Köln, Germany, 2021; 61p, Available online: https://www.iscc-system.org/wp-content/uploads/2024/01/ISCC_EU_205_Greenhouse-Gas-Emissions_v4.1_January2024.pdf (accessed on 14 June 2024).
  44. Walg, O. Taschenbuch der Weinbautechnik, 2nd ed.; Fachverlag Dr. Fraund GmbH: Mainz, Germany, 2007. [Google Scholar]
  45. Villanueva-Rey, P.; Vázquez-Rowe, I.; Moreira, M.T.; Feijoo, G. Comparative life cycle assessment in the wine sector: Biodynamic vs. conventional viticulture activities in NW Spain. J. Clean. Prod. 2014, 65, 330–341. [Google Scholar] [CrossRef]
  46. Ponstein, H.J.; Meyer-Aurich, A.; Prochnow, A. Greenhouse gas emissions and mitigation options for German wine production. J. Clean. Prod. 2019, 212, 800–809. [Google Scholar] [CrossRef]
  47. Marras, S.; Masia, S.; Duce, P.; Spano, D.; Sirca, C. Carbon footprint assessment on a mature vineyard. Agric. For. Meteorol. 2015, 214, 350–356. [Google Scholar] [CrossRef]
  48. Pinto da Silva, L.; Esteves da Silva, J.C.G. Evaluation of the carbon footprint of the life cycle of wine production: A review. Clean. Circ. Bioecon. 2022, 2, 100021. [Google Scholar] [CrossRef]
  49. Tsalidis, G.A.; Kryona, Z.-P.; Tsirliganis, N. Selecting south European wine based on carbon footprint. Resour. Environ. Sustain. 2022, 9, 100066. [Google Scholar] [CrossRef]
  50. Tuomisto, H.L.; Hodge, I.D.; Riordan, P.; Macdonald, D.W. Does organic farming reduce environmental impacts?—A meta-analysis of European research. J. Environ. Manag. 2012, 112, 309–320. [Google Scholar] [CrossRef]
  51. Gierling, F.; Blanke, M. Carbon reduction strategies for regionally produced and consumed wine: From farm to fork. J. Environ. Manag. 2021, 278, 111453. [Google Scholar] [CrossRef]
  52. Steenwerth, K.L.; Strong, E.B.; Greenhut, R.F.; Williams, L.; Kendall, A. Life cycle greenhouse gas, energy, and water assessment of wine grape production in California. Int. J. Life Cycle Assess. 2015, 20, 1243–1253. [Google Scholar] [CrossRef]
  53. Bartocci, P.; Fantozzi, P.; Fantozzi, F. Environmental impact of Sagrantino and Grechetto grapes cultivation for wine and vinegar production in central Italy. J. Clean. Prod. 2017, 140, 569–580. [Google Scholar] [CrossRef]
  54. Litskas, V.D.; Irakleous, T.; Tzortzakis, N.; Stavrinides, M.C. Determining the carbon footprint of indigenous and introduced grape varieties through Life Cycle Assessment using the island of Cyprus as a case study. J. Clean. Prod. 2017, 156, 418–425. [Google Scholar] [CrossRef]
  55. Hefler, Y.T.; Kissinger, M. Grape Wine Cultivation Carbon Footprint: Embracing a Life Cycle Approach across Climatic Zones. Agriculture 2023, 13, 303. [Google Scholar] [CrossRef]
  56. Venkat, K. Comparison of Twelve Organic and Conventional Farming Systems: A Life Cycle Greenhouse Gas Emissions Perspective. J. Sustain. Agric. 2012, 36, 620–649. [Google Scholar] [CrossRef]
  57. Korsaeth, A. Relations between nitrogen leaching and food productivity in organic and conventional cropping systems in a long-term field study. Agric. Ecosyst. Environ. 2008, 127, 177–188. [Google Scholar] [CrossRef]
Figure 1. Location of the Velké Pavlovice wine subregion in the context of the Czech Republic and Europe.
Sustainability 16 06561 g001
Figure 2. Graphical representation of the evaluated cultivation.
Sustainability 16 06561 g002
Figure 3. Box plot showing the variability of carbon food in different productions systems and the results obtained by the ANOVA analysis. Productions systems with different letters are significantly different.
Sustainability 16 06561 g003
Table 1. Agricultural practices—incoming agrochemicals and materials for conventional, integrated, and ecological vineyard production systems.
Agricultural PracticesProduction System
ConventionalIntegratedEcological
Frequency per YearHectare RateFrequency per YearHectare RateFrequency per YearHectare Rate
Active ingredients of fungicides and insecticidesSulfur12 kg·ha−112 kg·ha−112 kg·ha−1
Sulfur4–8× 4 kg·ha−1
Iprovalicarb0.9 L·ha−10.9 L·ha−1
Metrafenone1–2×0.16 L·ha−11–2×0.16 L·ha−1
Cyprodinil, Fludioxonyl3–5×0.5 kg·ha−13–5×0.5 kg·ha−1
Fluopyram, Tebuconazole1–2×0.4 L·ha−11–2×0.4 L·ha−1
Valifenalate1–2×2 kg·ha−12 kg·ha−1
Difenoconazole, Cyflufenamid1–2×0.65 L·ha−11–2×0.65 L·ha−1
Fosetyl-Al3 kg·ha−13 kg·ha−1
Boscalid, Kresoxim-Methyl0.6 L·ha−10.6 L·ha−1
Bacillus amyloliquefaciens
Folpet
1–2×2 kg·ha−11–2×2 kg·ha−1
Cymoxanil1–2×0.25 kg·ha−10.25 kg·ha−1
Tetraconazole1–2×2 kg·ha−12 kg·ha−1
Cyazofamid2 L·ha−1
Lambda-Cyhalothrin0.15 L·ha−1
Mefentrifluconazol1–2×1 L·ha−1
Copper hydroxide2–4×2 kg·ha−1
Copper oxychloride3–5×1 L·ha−1
Magnesium sulfate—Bitter salt7 kg·ha−1
extract from fermentation of Lactobacillus sp., Yucca extract2–4×1 L·ha−1
Potassium hydrogen carbonate2–4×10 kg·ha−1
Sulfuric acid clay with yeast and plant extracts1x4 kg·ha−1
Active components of herbicides Glyphosate1–4×5 L·ha−11–2×5 L·ha−1
Fertilizer Fertilizer PK 22 × 9300 kg·ha−1300 kg·ha−1
Humic acids made from activated Leonardite200 kg·ha−1
Seeds Standard30 kg·ha−1
Note: “–” not applied.
Table 2. Agricultural practices for conventional, integrated, and ecological grapevine production. Some values may have more significant figures than customary in analytical chemistry.
OperationSystem Management
(Frequency per Year; Labor Intensity; Average Diesel Consumption on One Operation)
Production System
ConventionalIntegratedEcological
Vine pruning and related work operations (cane tying, repairing the trellis)Mechanical winter pruning
(1×; 2.5 h·ha−1; 11.5 ± 1.32 L·ha−1)
with manual cutting
(1×; 50 h·ha−1)
YESYESYES
Manual cane tying
(1×; 25 h·ha−1)
YESYESYES
Repair of trellis
(1×; 4 h·ha−1; 6.00 ± 0.88 L·ha−1)
YESYESYES
Removal of grape canesShredding of grape canes in the inter-row
(1×; 1.7 h·ha−1; 8.5 ± 1.45 L·ha−1)
YESYESYES
Maintenance of the strips between two rows and in the weed free strips under the trellisInter-row mulching
(2–4×; 1.2 h·ha−1; 8.1 ± 0.79 L·ha−1)
YESYESYES
Inter-row cultivation
(3–5×; 1.0 h·ha−1; 6.9 ± 2.19 L·ha−1)
YESYESYES
Intra-row cultivation (under the trellis)
(2–4×; 2.5 h·ha−1; 13.1 ± 1.48 L·ha−1)
YESYESYES
Chemical treatment of the strips (intra-row)
(1–4×; 1.5 h·ha−1; 8.20 ± 0.32 L·ha−1)
YESNONO
Cover crops sowing
(1×; 2.0 h·ha−1; 10.9 ± 0.55 L·ha−1)
NONOYES
Green works (canopy management)Manual shoot thinning (suckering)
(1×; 40 h·ha−1)
YESYESYES
Manual shoot positioning
(2–3×; 50 h·ha−1)
YESYESYES
Shoot topping
(2–3×; 1.7 h·ha−1; 9.5 ± 0.15 L·ha−1)
YESYESYES
Defoliation
(1–2×; 2.5 h·ha−1; 9.0 ± 1.12 L·ha−1)
YESYESYES
Chemical protectionMistblowing
(4–8×; 1.2 h·ha−1; 5.8 ± 1.29 L·ha−1)
YESYESYES
FertilizationDeep root fertilization
(1×; 2.6 h·ha−1; 16.5 ± 3.21 L·ha−1)
YESYESNO
Spreading organic fertilizer
(1×; 1.2 h·ha−1; 7.1 ± 1.44 L·ha−1)
NONOYES
Grape harvestingFully mechanized harvesting
(1×; 3.0 h·ha−1; 23.1 ± 2.45 L·ha−1)
YESYESYES
Grape removal (distance 5 km)
(1×; 0.2 h·ha−1; 1.5 ± 0.10 L·ha−1)
YESYESYES
Sum of labor intensity (h·ha−1)278360371
Sum of diesel consumption (L·ha−1)185198210
Table 3. Mean, standard deviation (SD), minimum, and maximum values of vineyard inputs by surface area (ha) in conventional, integrated, and ecological production systems.
Vineyard Inputs
(kg CO2eq·ha−1·Year−1)
Production System
ConventionalIntegratedEcological
Mean ± SDMean ± SDMean ± SD
min; maxmin; maxmin; max
Fuels for field work673.93 ± 62.01a671.86 ± 58.54a716.14 ± 35.27a
585.24; 736.15595.80; 748.10640.25; 745.95
Synthetic fertilizers47.00 ± 16.55a46.83 ± 0.50a
15.60; 62.7045.40; 58.54
Manufacture and use of seeds9.49 ± 1.98a
7.80; 12.40
Fungicides and insecticides190.68 ± 7.92b190.65 ± 9.22b753.52 ± 17.76a
180.90; 210.15180.00; 210.15723.00; 770.1
Herbicides60.13 ± 18.14a20.74 ± 19.55b
7.92; 82.960.00; 41.48
Note: Data are expressed as an average ± standard deviation, “–” not applied. Averages with different letters within the line are significantly different, according to Tukey’s test (p ≤ 0.05).
Disclaimer/Publisher’s Note: The statements, opinions and data contained in all publications are solely those of the individual author(s) and contributor(s) and not of MDPI and/or the editor(s). MDPI and/or the editor(s) disclaim responsibility for any injury to people or property resulting from any ideas, methods, instructions or products referred to in the content.

