Article

Spatiotemporal Characteristics and Factors Influencing the Cycling Behavior of Shared Electric Bike Use in Urban Plateau Regions

1
School of Earth Sciences, Yunnan University, Kunming 650500, China
2
Yunnan International Joint Laboratory of Critical Mineral Resource, Kunming 650500, China
*
Author to whom correspondence should be addressed.
These authors contributed equally to this work.
Sustainability 2024, 16(15), 6570; https://doi.org/10.3390/su16156570
Submission received: 17 June 2024 / Revised: 12 July 2024 / Accepted: 30 July 2024 / Published: 31 July 2024

Abstract

:
At present, most of the research on shared electric bikes mostly focuses on the scheduling, operation and maintenance of shared electric bikes, while insufficient attention has been paid to the behavioral characteristics and influencing factors of shared cycling in plateau cities. This paper takes Kunming as a research case. According to the user’s cycling behavior, the spatiotemporal cube model and emerging hotspot analysis are used to explore the spatiotemporal characteristics of the citizens’ cycling in the plateau city represented by Kunming, and the method of geographical detectors is used to study the specific factors affecting the shared travel of citizens in Kunming and conduct interactive detection. The findings are as follows: ① the use of shared electric bikes in Kunming varies greatly on weekdays, showing a bimodal feature. In space, the overall distribution of cycling presents a “multi-center” agglomeration feature with distance decay from the center of the main urban area. ② The geographic detector factor detection model quantitatively analyzes the interactive influence between factors, providing a good supplement to the independent influence results of each factor. Through the dual factor interactive detection model, we found that the overall spatiotemporal distribution of cycling during each time period is most significantly affected by the distribution of service facilities, followed by transportation accessibility, land use, and the natural environment. The research results can assist relevant departments in governance of urban shared transportation and provide a reference basis, and they also have certain reference value in urban pattern planning.

1. Introduction

The rapid popularization of shared bicycles has facilitated short-distance travel for citizens, providing good solutions to traffic congestion and actively responding to green travel, thus making corresponding contributions to the green development of cities. However, with the rapid development of bicycles, many problems have gradually emerged, among which the more serious is the cycling problem, which not only affects the city’s appearance but also affects public transportation safety [1]. As one of the representative cities in plateau cities, in 2020, Kunming introduced a shared electric bike that is more suitable for mountain travel. Once launched, the moped was quickly welcomed by the majority of residents. At present, the moped has become the preferred mode of transportation for Kunming residents. The travel situation of Kunming residents has been greatly affected, effectively solving the “last kilometer” problem for Kunming residents. However, there have also been corresponding issues such as disorderly parking and placement of mopeds, mismatched supply and demand time and space, and excessive placement occupying public space [2,3,4,5,6]. In order to better address the above issues, some scholars have studied the spatiotemporal dynamic changes in shared bicycles [7,8,9]. For example, some studies have shown that using the methods of “source” and “sink” to analyze the spatiotemporal distribution of shared bicycles [10] provides a new perspective; they have also explored the mutual influence between shared bicycles and other modes of transportation [11] as well as the impact of shared bicycle spatiotemporal characteristics on adolescent travel patterns [12].
Some studies reveal their spatiotemporal patterns with the purpose of shared bicycle travel [13,14,15,16,17], such as simulating shared bicycle station activities and studying the impact of nearby businesses and jobs on station travel [18]. Taking into account various factors, based on the gravity model and Bayesian rules, the contribution of POI to user cycling needs was confirmed. In addition, some studies have further evaluated the impact of meteorological factors, land use characteristics, and time on the demand for shared bicycles [19,20,21,22]. They have used shared bicycle data to construct a spatial interaction network model, concluding that the selected influencing factors are positively correlated with the spatial interaction network [2]. Some scholars have also used relevant models to predict the demand of shared bicycle users [4,23,24,25]. However, there is very little research on the factors affecting the departure and destination of shared bicycles in plateau cities, and there are also few scholars conducting systematic research on shared electric bike [26]. Few scholars have conducted systematic research on shared electric bikes, predicting their cycling behavior, exploring the spatiotemporal characteristics of shared bicycle travel, and exploring the differences in the impact factors on the distribution of shared bicycle behavior at different spatial scales.
Therefore, based on the order data of the Kunming shared electric bike scheme in late April 2022, from the perspective of space–time cognition theory and mathematical statistics theory, this paper conducts a quantitative analysis of the spatiotemporal change trend of shared electric bikes, classifies the types of spatiotemporal change trend, and visualized the spatio-temporal change trend of shared electric bikes in the form of cold- and hotspot maps, thus mining the distribution pattern of spatio-temporal characteristics of shared electric bikes. In combination with the characteristics of Kunming, we selected ten possible important impact factors and discussed the difference in the impact of various environmental factors on the distribution of shared electric bike behavior at different spatial scales with the help of a geographical detector method to present the spatial and temporal pattern of shared electric bikes in a visual way and visually present the distribution of shared electric bike points, which can provide a reference for relevant departments to manage the shared traffic situation in plateau cities and also has certain reference value in urban pattern planning.

2. Materials and Methods
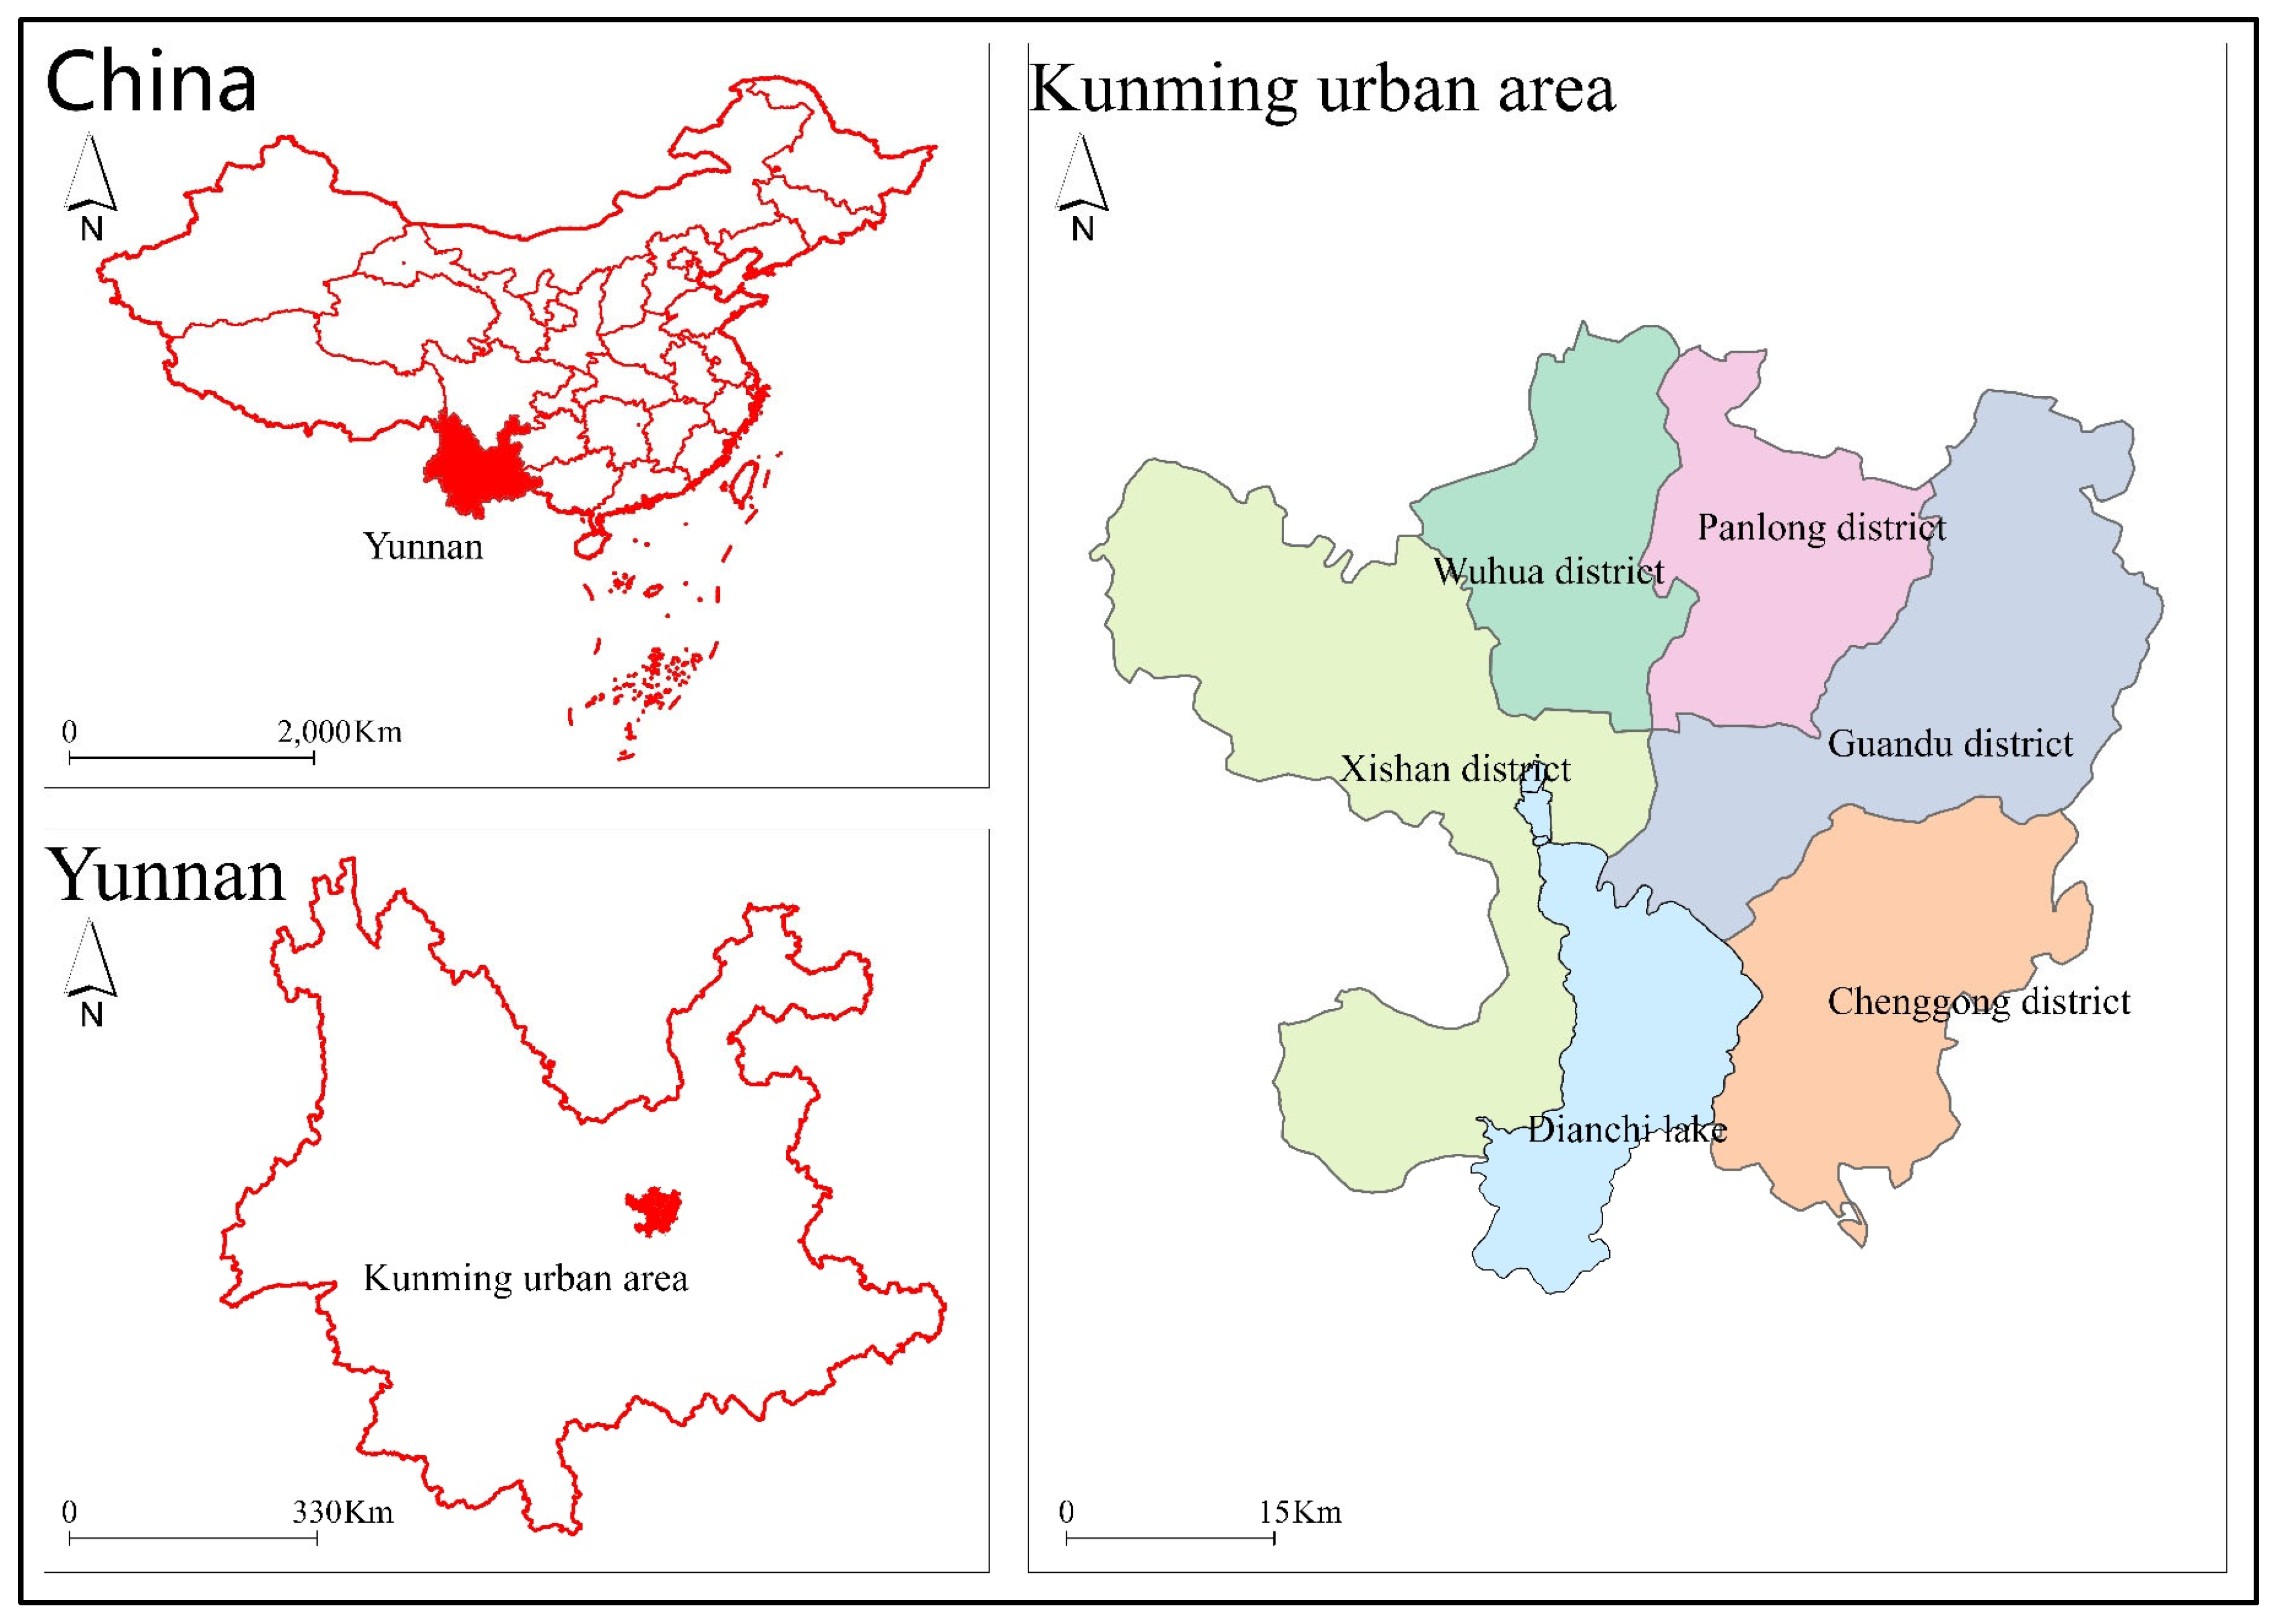
2.1. Study Area

Therefore, in 2020, Kunming, located in the middle of the Yunnan-Guizhou Plateau and the northern part of the Dianchi Lake Basin in Yunnan Province, China, became the first provincial capital city in China to pilot the introduction of a shared electric bike scheme through “replacement”. These shared electric bikes have more accurate positioning, more comfortable cycling, higher-precision electronic fences, and are more suitable for use in high-altitude terrains. In this paper, we select the main urban areas of Kunming (Chenggong District, Guandu District, Panlong District, Wuhua District, and Xishan District) as the study area. These areas are characterized by a concentrated population, higher levels of socio-economic development, and a variety of land use functions including residential areas, work areas, schools, large commercial areas, and transportation hubs (Figure 1). The demand for shared electric bikes is high in these areas, which can effectively reflect the overall situation of short-distance travel in the selected study area. The role of shared electric bikes in this high-density modern city cannot be ignored, as they are closely related to residents’ daily travel. Therefore, it is of great significance to select the shared electric bike data of Kunming City as the research object in this paper.

2.2. Data Sources and Processing Methods

The data sources involved in this paper include Kunming shared electric bike order data and impact factor data. Due to the significant impact of external environmental factors on shared electric bike orders, in order to facilitate the acquisition of universally representative data, a total of 7 days of data from 23 to 29 April 2022, totaling approximately 9,706,320 data information, were selected for the time range selection. The data include both working and rest days and reflect the cycling conditions of shared electric bikes well under good weather conditions. A complete travel record consists of 11 parts (Table 1): order ID, bike type, city name, borrowing date, borrowing time, borrowing longitude, borrowing latitude, returning date, returning time, returning longitude, and returning latitude.
The data applied in this article are divided into two parts, namely the dependent variable shared electric bike travel record data and impact factor data. The sources of all impact factor research data are shown in Table 2.
The impact factor data in this paper are divided into two categories, with a total of ten impact factors. The selection of terrain environmental impact factors only considers the comfort of residents’ shared travel; therefore, terrain environmental factors include elevation (X1) and slope (X2). The built environment factors are divided into three categories: traffic accessibility factors, land use factors, and service facility factors. Among them, the traffic accessibility factors include the density of subway stations (X3), the density of bus stations (X4), and the density of road network (X5), which reflect the convenience and functionality of residents’ transportation in Kunming. Land use factors include POI diversity (X6), which specifically includes name, longitude and latitude information, and classification information. In order to further quantify the impact of POI data on bicycle use at each parking point, kernel density analysis is used to calculate the degree of impact of various POIs around each parking point on the location of the parking point. The land use factors consider the degree of land use mixing and the distribution of the population. The service facility factor includes four categories, namely the distribution density of shopping facilities (X7), catering facilities (X8), residential distribution density (X9), and corporate distribution density (X10), which comprehensively reflect the main needs and destinations of residents’ travel. Since the starting and destination of the shared electric bike ride will be affected by the spatial concentration of such facilities to some extent, the size of the fishing net is designed to be 1 km × 1 km according to the regional characteristics of Kunming, and the impact factors are, respectively, treated with nuclear density and reclassified using the natural breakpoint method.

2.3. Research Methods

The spatiotemporal cube [27,28] is a visualization model used to simultaneously express the spatial position distribution and time series changes in spatiotemporal data. It obtains timestamp point elements through the spatiotemporal cube tool and then aggregates the points into spatiotemporal bars to construct a netCDF (network Common Data Form) data cube. Points within each bar are calculated and the Mann–Kendall statistic is used to measure the trend in bar values across time at each location. The principle and expression form of this model is that each spatiotemporal cube is expressed by two-dimensional plane spatial coordinates (x, y) and the three-dimensional time dimension (t). The spatiotemporal cubes with the same time dimension form a time slice of each time point, and the spatiotemporal cubes with the same spatial coordinate position form a time series of each geographical location. This paper uses ArcgisPro3.0.1 software to generate a spatiotemporal cube model based on shared electric bike order data. The edge distance and time step of the spatiotemporal cube are two necessary parameters for modeling. After multiple experiments, 1 km and 6 h were used as the edge distance and time step. The main function of the spatiotemporal cube model in this study is mainly to preprocess the data for subsequent spatiotemporal hotspot analysis.
Emerging hotspot analysis refers to the method of analyzing trends in clustering of aggregated point data density (count) in spatiotemporal cubes. The main purpose of this study is to identify the spatiotemporal patterns of shared electric bike OD (origin–destination) by combining temporal and spatial features. The principle is to apply the Getis Order method [29] to obtain the Z-values and P-scores of each bar and determine its cold- and hotspot values. The higher the Z-value scores, the tighter the clustering of high values (hotspots). This method evaluates and identifies the clustering strength of the high or low values of the number of shared electric bike location points in the local grid using the Getis Order method’s spatiotemporal statistics. For the spatiotemporal cube element i, the calculation formulas are as follows:
G i * = j = 1 n W i j X j x ¯ j = 1 n W i j n j = 1 n W i j 2 j = 1 n i j n W i j 2 n 1 s
x ¯ = j = 1 n x j n
S = j = 1 n x j n x ¯ 2
Among them, x i is the attribute value of the spatiotemporal neighboring element j ; W i j is the spatiotemporal weight between elements i and j ; and n is the sum of adjacent elements. When the G i * result is a significant positive number, the higher the value, the closer the clustering of shared bike usage values (hotspots); when the result of G i * is significantly negative, the lower the value, the closer the clustering of low shared bike usage values (coldspots).
Geographic detectors [30,31,32,33,34] are a spatial statistical modeling method for quantitatively analyzing spatial heterogeneity and its driving factors. The basic principle of the model is to assume that each variable has influence or explanatory power on the dependent variable, and the spatial distribution of each variable and the dependent variable also has strong consistency. The geographic detector model includes four sub models, namely factor detectors, interaction detectors, ecological detectors, and risk detectors. The most widely used among them are factor detectors and interaction detectors. The former is mainly used to quantify the degree of influence of spatial differentiation driving factors, while the latter is mainly used to quantify the interaction force generated by two driving factors on spatial differentiation. In this article, the geographic detector factor detector submodel and the interaction detector submodel are, respectively, applied to the independent factor influence analysis and interaction factor influence analysis of the spatiotemporal distribution of shared electric bike riding. The basic function of factor detectors is to quantitatively analyze the influence of driving factors behind the spatial differentiation of a certain geographical phenomenon and measure it through the q value results. The calculation formulas are as follows:
S S W = h = 1 L N h σ h 2
S S T = N σ 2
q = 1 h = 1 L N h σ h 2 N σ 2 = 1 s s w s s T
Among them, h = 1, 2, …, L represents the stratification of dependent or independent variables; N h and N represent the number of units in the h region and the entire region, respectively; and σ h 2 and σ 2 are the variance of the Y value of the dependent variable in the h region and the entire region, respectively. SSW and SST are the sum of intra-regional variances and the total variance of the entire region, respectively. The range of q values is [0, 1], and the larger the value, the greater the influence of this factor on the spatiotemporal distribution of shared bicycle riding.
Geographic detectors can not only be used to analyze single-factor interactions but also to detect interactions between two factors. The shared electric moped cycling behavior is affected by the complex urban built environment, and the impact of each built environment factor on shared electric bike riding is not only independent but also interactive between two factors. The interaction detector model is mainly used to study the interaction effects between different influencing factors, that is, to analyze whether the joint influence of influencing factors will enhance or weaken the influence force on the dependent variable Y. Firstly, the two impact factors X are calculated separately, X_1 and X_2 pairs of q values for dependent variable Y: q( X 1 ) and q( X 2 ). Secondly, the q value is calculated when two influencing factors intersect: q( X 1 X 2 ). Finally, q ( X 1 ), q ( X 2 ), and q ( X 1 X 2 ) are compared.

3. Results

3.1. Analysis of Spatiotemporal Characteristics of Cycling

The spatiotemporal cube model (STCM) is a powerful tool for processing and analyzing multidimensional spatiotemporal data. Its basic principle is to combine the two dimensions of time and space to organize and manage data in the form of a cube, thereby achieving multi-dimensional analysis and visualization of complex spatiotemporal phenomena. In existing research, the space–time cube model has been widely used in traffic flow analysis, environmental monitoring, epidemic spread, and other fields, showing great potential in processing complex spatio-temporal data. For example, Wang et al. [35] used the space–time cube model to analyze the spatio-temporal distribution rules of urban traffic flow, providing important decision support for traffic management.
During the process of model construction, it was determined through repeated experiments that setting the side length of the cube to 1 km and the time step to 6 h can not only effectively reflect the spatial distribution of cycling behavior but can also capture changes in the time dimension trend.
Based on the spatiotemporal cube aggregation model and emerging spatiotemporal hotspot analysis, this paper identifies the spatiotemporal patterns of shared electric bike cycling in Kunming City on weekdays and weekends, demonstrating the spatial heterogeneity of cycling start and end points. This paper identifies new hotspots, strengthened hotspots, oscillating hotspots, strengthened coldspots, sustained coldspots, gradually decreasing coldspots, and historical coldspots, with warmspots representing hotspots and cool colors representing coldspots (Figure 2). Among the identified hotspot patterns, the use of shared electric bike within the enhanced hotspot grid has the highest spatiotemporal intensity, followed by newly added hotspots and oscillating hotspots. Hotspots represents highly concentrated areas of shared electric bike use, providing most of the cycle ride start and end points. The cycling characteristics are mainly represented by the “multi-center” agglomeration of distance decay in the center of the main urban area.
From the spatial distribution of specific spatiotemporal model types (Figure 3), the newly added hotspots and the strengthened hotspot model grid only appear on weekdays, located at the edge of Xishan District, Wuhua District, Panlong District, and Guandu District near Dianchi Lake. The spatiotemporal concentration intensity of shared electric bike use on weekends is much lower than that on weekdays. The scattered hotspot pattern grid of the start and end points of weekday cycling is distributed between the southern edge of Futian and the continuous hotspot grid of Luohu District, in an east–west zonal distribution. The spatial distribution of scattered hotspots at the start and end points of weekend cycling is consistent with the spatial distribution of continuous coldspots on weekdays. In addition, the oscillating hotspot mode is the hotspot mode with the largest distribution area on weekdays and weekends, and its spatial distribution is consistent with the overall hotspot trend distribution pattern, that is, the hotspot area at the junction of Wuhua District and Panlong District. The spatial distribution of oscillation hotspots on weekdays and weekends is basically consistent, but the distribution range on weekends is slightly wider than on weekdays. The car demand of residents in Kunming is mainly distributed within the 5 km radiation area of Dongfeng Square Station in the center of the city, the area with a high density of bus stations and in the vicinity of Changshui Airport, showing a trend of gathering from the surrounding to the subway station of Dongfeng Square in the center of the city. New high-usage locations include shopping and entertainment areas such as Baoshan Street and Nanqiang Street.

3.2. Analysis of Detection Results of Factor Detectors

Geographical detectors (GDs) are used to reveal the spatial distribution characteristics of geographical phenomena and their driving factors. They are widely used in many fields such as environmental science, public health, and social economy. For example, Liu et al. [36] used geographical detectors to analyze the spatial and temporal distribution of air pollution and its influencing factors, revealing the relative contributions of different factors to the pollution distribution. The core idea is to detect the influence of geographical factors on the distribution of phenomena by comparing attribute differences in- and outside different spatial units. According to the time–space distribution characteristics of Kunming, the distribution pattern of shared electric bike use in the main urban area of Kunming is mainly related to the regional economic development level, land use, functional area distribution and service facilities. The size of the geographical detector’s q value reflects the influence of factors on shared electric bike cycling. The ranking of q values reflects the relative importance of factors on shared electric bike cycling. The fluctuation of the q value ranking of each factor with scale reflects the relative stability of the factor’s influence (Figure 4).

3.2.1. Analysis of Terrain Environmental Impact Factors

The impact of terrain environmental factors on shared electric bike use is minimal. From the perspective of overall influence, the average q value of elevation influence in terrain environmental factors is 0.146, and the average q value of slope influence is 0.108. The influence of terrain factors (elevation and slope) is relatively small and variable at all time periods, and the impact on shared electric bike is relatively small, with little hindrance to cycling. At peak hours in the morning and evening, as well as other time periods, the influence q values of elevation are 0.1819, 0.1780, and 0.1776, respectively. In terms of time, the elevation influence q value during the early peak period has a greater impact on shared electric bike use compared to other periods. The influence q values of slope are 0.1051, 0.1151, and 0.1126, respectively. Unlike elevation, the slope influence q value during the late peak period is higher than during other periods. Overall, the impact of elevation on shared electric bike used has a greater degree of change compared to slope.

3.2.2. Analysis of Built Environment Impact Factors

(1)
The mean value of the influence factor q of transportation accessibility is 0.7631. Among them, the mean values of the influence factor q of distance from a subway station, distance from a bus station, and road network density are 0.7259, 0.8423, and 0.8376, respectively (Table 3).
(2)
Land use factors only consider the diversity of points of interest (POI), with an average q value of 0.8153.
(3)
The service facility factor has the greatest impact on the characteristic behavior of cycling users, with an average q value of 0.8957 (Table 4). From an overall perspective, the four service facility factors have the greatest impact on the distribution of spatiotemporal characteristics of shared electric bike cycling among all factors: the daily average influence q values of residential community distribution, catering facility distribution, shopping facility distribution, and corporate company distribution are 0.9043, 0.8956, 0.9156, and 0.8673, respectively. The influence q values of the distribution density of shopping facilities during morning and evening peak hours and other periods are 0.8028, 0.8472, and 0.8282, respectively. The influence q values of the distribution density of catering facilities are 0.8592, 0.8836, and 0.7312, respectively. The influence q values of residential distribution density are 0.8173, 0.8480, and 0.8436, respectively. The influence q values of the distribution density of enterprise companies are 0.7225, 0.7415, and 0.8801, respectively. Overall, the four service facility factors have a greater impact during peak hours in the morning and evening, and a smaller impact during other periods. From Figure 3c, it can be seen that the corporate factor has the smallest impact during the morning peak hour at 7 a.m., but its q-value significant increases at 9 a.m. (the time with the highest number of shared electric bike arrivals during the morning peak hour), and on one day, its impact surpassed the catering and shopping facility factors, ranking second in terms of impact.

3.3. Analysis of Detection Results of Interactive Detectors

This paper utilizes the advantage of geographical detectors being able to detect the different impacts of the interaction between two factors, and further explores the influencing factors of the spatiotemporal distribution differences in shared electric bike use during morning and evening peak hours. The explanatory power of interaction detectors for dependent variables generally includes nonlinear weakening, single-factor nonlinear weakening, double-factor enhancement, independence, and nonlinear enhancement. From Table 5, it can be seen that the dominant interaction factors are all in a dual-factor enhanced relationship, indicating that the influence of the interaction between the two factors is greater than that of each individual factor. The comprehensive analysis of the spatiotemporal characteristics of cycling destinations shows that there are significant differences in the spatiotemporal distribution of shared bicycles during morning and evening peak hours. Interaction detection was conducted on four time sections: the morning peak with the highest arrival volume, the morning high peak with the lowest arrival volume, the evening peak with the highest arrival volume, and the evening peak with the lowest arrival volume. The dominant interaction factors with the top 10 q values in the interaction results are shown in Table 6.

4. Discussion

This article is based on the spatiotemporal location data of shared electric bikes in the main urban area of Kunming City in late April 2022, and addresses two questions: what are the spatiotemporal distribution patterns of shared electric bikes in the main urban area of Kunming City? And which factors have significant impacts on the behavioral characteristics of cycling users?
There are a large number of scholars who use relevant data to construct an origin–destination matrix. The use of shared electric bikes shows a clear spatial concentration, with hotspots mainly concentrated in the city center and business districts. This is consistent with the research results of Liu and Wei [37], who found that urban core areas and commercial centers are high-frequency areas for shared bicycle use. Weekend usage patterns are more dispersed, covering more leisure and entertainment areas. This is consistent with the research of Wang et al., Yuan et al., and Zhang et al. [38,39,40], who pointed out that weekend cycling activities are often related to leisure and entertainment activities. Cycling activities on weekdays are mainly concentrated in the morning and evening peak hours, and the purpose of cycling is mainly commuting. This is consistent with the research of Zhao et al. [41], who found that the peak cycling hours on weekdays highly coincide with the peak commuting hours. Cycling activities on weekends are more dispersed in time, indicating that users’ travel time is more flexible and their cycling purposes are more diverse, including shopping, leisure, and entertainment.
From a temporal perspective, compared to rest days, workdays have more new hotspots, are more concentrated, and are used more frequently. Bicycles are more likely to flow in, and it is necessary to focus on the accumulation of mopeds and supply–demand balance issues near these areas, mainly gathered in downtown commercial areas such as Huashan Middle Road, Qingnian Road, Wuyi Road, Dongfeng Road, and Jinbi Road. On rest days, the area where new hotspots are located gradually transforms into a decreasing number of coldspots; the transition from oscillating hotspots to oscillating coldspots is more characterized by an outflow trend, which is speculated to be due to the more dispersed travel behavior of residents and less obvious tidal characteristics. Therefore, it is necessary to focus on the shortage of mopeds near these features. From the comparison between the starting point and ending point, it can be inferred that the oscillation hotspots on weekdays have shifted to gradually decreasing coldspots, which is due to the shared electric bikes gathered at the starting point being driven by residents to the endpoint, which is the point where enterprises, catering facilities, and shopping facilities gather. This is consistent with the situation shown in the relevant literature [42].
In order to understand which factors have a significant impact on the distribution characteristics of citizens’ cycling behavior, we used ten influencing factors to select the help of geographical detectors to further explore the relationship between the spatial and temporal pattern distribution of the starting and ending points of Kunming’s shared electric bike cycling and other environmental factors.
From the comprehensive results of factor detection and interaction detection, the distribution of residential communities is the most influential factor in the morning and evening peak interaction detection and factor detection. Therefore, the distribution of residential communities is the factor that has the greatest impact on the distribution of shared electric bike cycling destinations. It is speculated that because the residential area is one of the most crowded areas at any time, the number of shared electric bike arriving at the residential area by mopeds is high. Because of the focus on the shared electric bike use needs of residents in the residential area, residents pay more attention to the spatial configuration on the micro level in combination with their own needs and preferences. They selectively identify and classify the urban built environment and space to meet their commuting, consumption, and leisure needs.
According to the above analysis, the following suggestions can be made:
(1)
In the future, the travel demand of Kunming residents for shared electric bikes will continue to grow. Therefore, in order to meet the demand of citizens for the use of shared electric bikes, it is recommended that the government reasonably increase the number of shared electric bikes in the areas where they are not put into use, taking into account the density, socio-economic attributes, and land use of bus stations and subway stations. For the supersaturation placement area of shared electric bikes, the placement number of shared electric bikes can be properly controlled or reduced to alleviate pedestrian–vehicle conflict on the sidewalk and reduce the government’s management costs.
(2)
The use of shared electric bikes to connect with public transport is a common combined travel mode for Kunming citizens, especially in the morning and evening rush hours on weekdays. Therefore, it is recommended to vigorously implement the “trinity” public transport comprehensive three-dimensional composite system of “rail transit + conventional public transport + shared electric bike” launched in 2020. It is recommended that the government properly increase the number of shared electric bikes in areas with high public transport density and subway density, consider the demand gap of shared electric bikes and the transfer of some citizens after the elimination of non-new national standard electric vehicles.
(3)
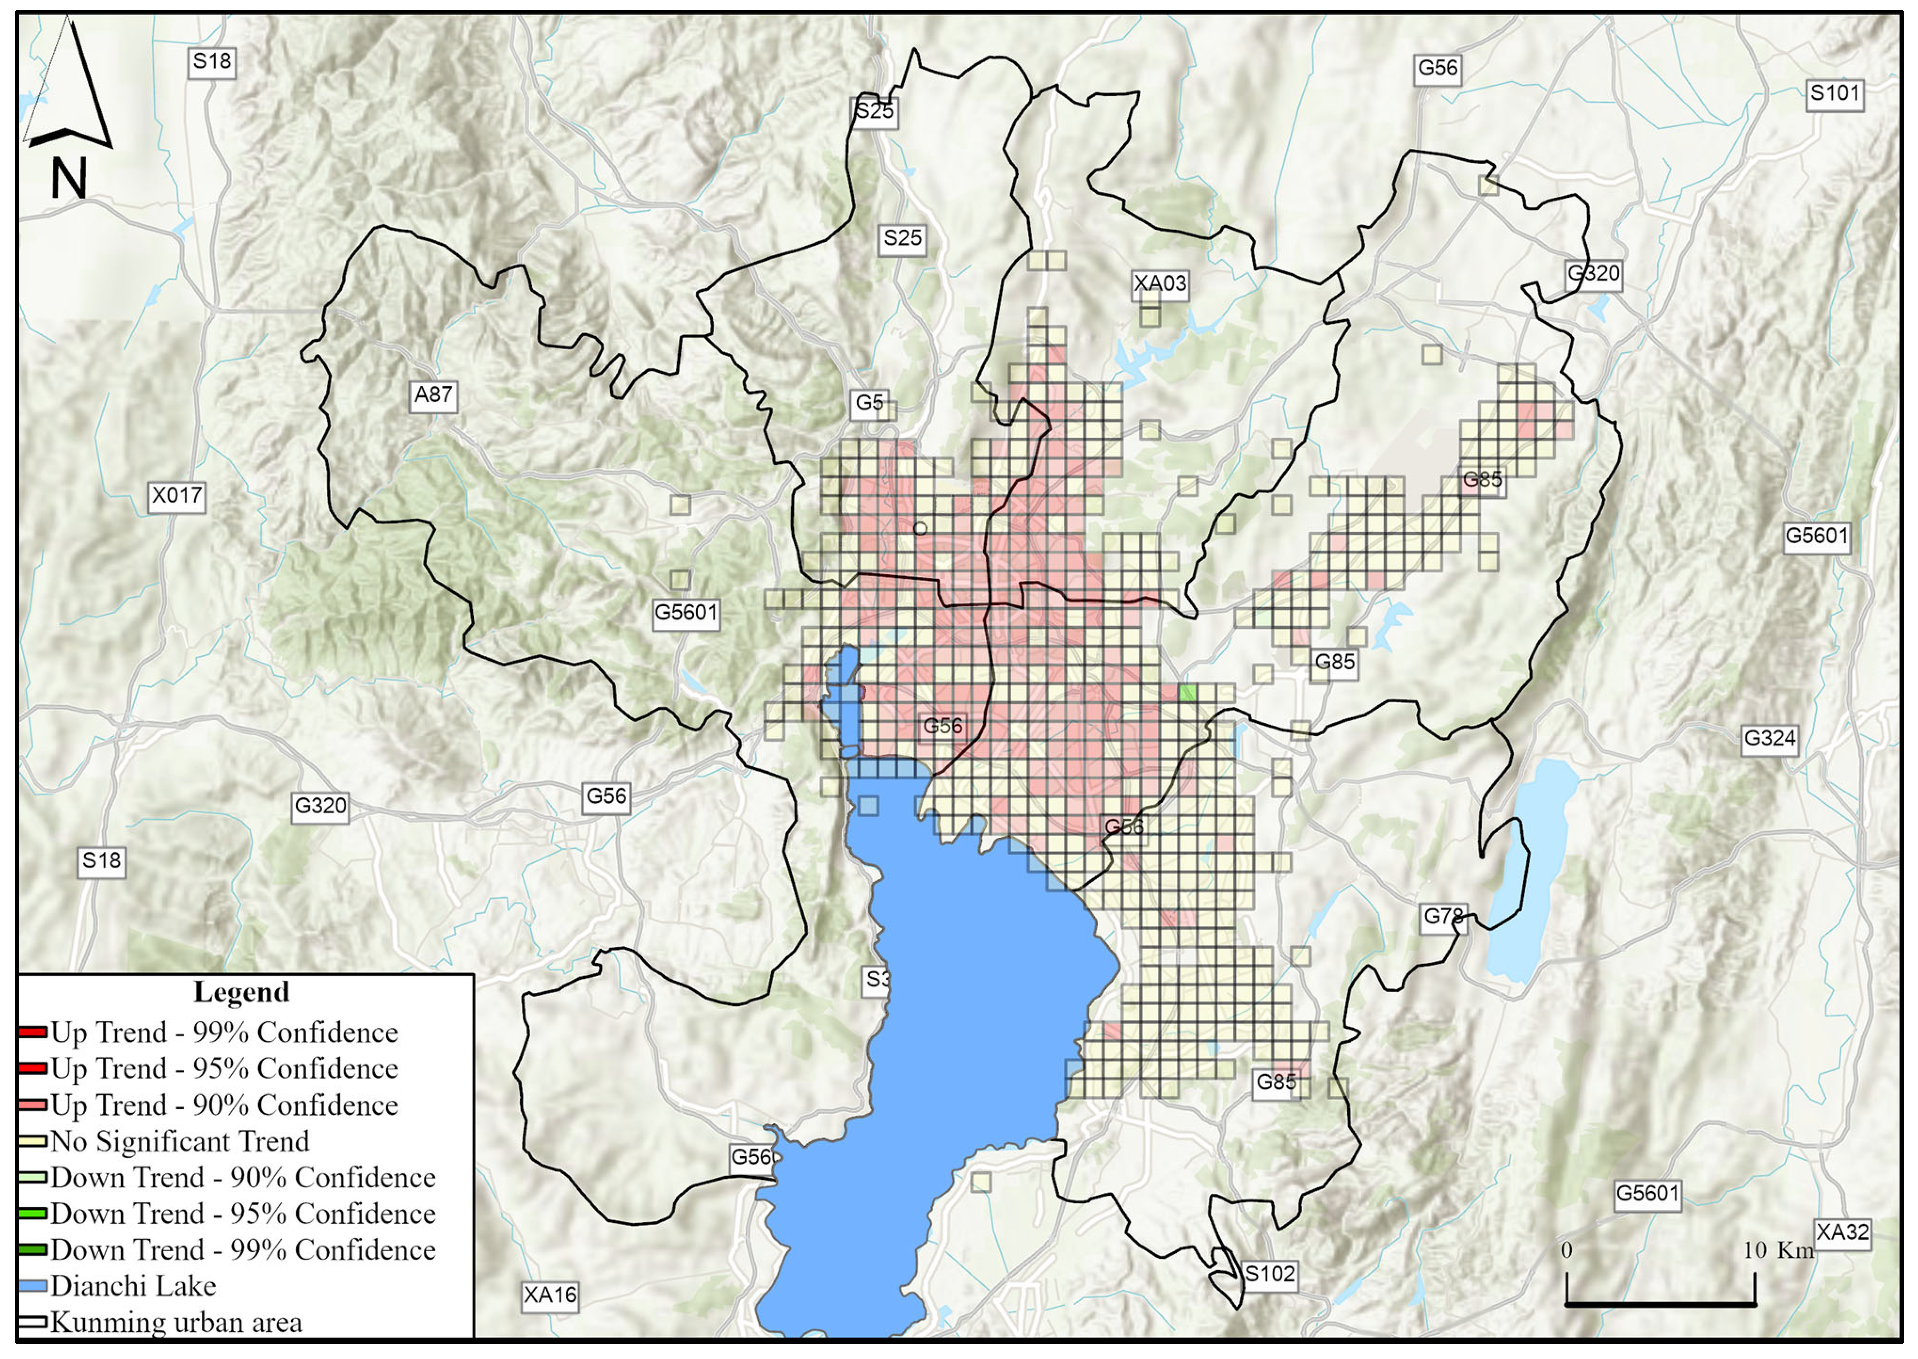
Parking and tidal phenomena are currently major bottlenecks in the development of the industry. The parking foundation and standards for slow-moving roads are still relatively lacking, and relevant bicycle management experience can be referenced [43,44,45]. For example, in the vicinity of tidal zone subway stations, the maximum amount of parking space should be given to shared bicycles rather than motor vehicles. According to the distribution of a large number of shared electric bike OD use modes shown in Figure 4, combined with the plateau mountainous terrain where Kunming is located, and with the help of the field assessment data funded by the project, the suggested location of shared electric bike parking land is shown in the red area (Figure 5).
Shared electric bikes and shared bicycles have great overlap in meeting the needs of short-distance travel. Therefore, there may be a certain degree of customer competition between the two when it comes to short-distance travel. In making a choice between the two, users usually consider the convenience, speed, and cost of travel. Customers who prefer shared electric bikes are mainly office workers, students, and young users. Office workers need to reach their workplace quickly during the morning and evening rush hours, and the speed advantage of shared electric bikes makes them the first choice; students need to move frequently in or around campus, so sharing electric bikes can provide a more efficient way to travel; young users more frequently pursue fashion and novel experiences, and the modernity and convenience of shared electric bikes are more in line with their needs. Customers who prefer shared bicycles are mainly leisure users, fitness enthusiasts, and price-sensitive users. Leisure users ride for leisure during weekends or holidays to enjoy outdoor activities and sports; fitness enthusiasts use cycling as a form of exercise, and riding shared bicycles can achieve fitness goals; price-sensitive users pay more attention to travel costs and choose relatively cheaper prices for shared bikes.
Shared electric bikes provide “the last mile of convenience” for highland urban residents, low carbon and environmental protection, and reduce the pressure on public transportation. However, the market competition for shared electric bikes is fierce. Only by understanding the factors and mechanisms that affect the use of shared electric bikes in the urban built environment, strengthening the adaptability of public space and environment to shared electric bikes, and focusing on good urban dimension control can individuals guide their spatiotemporal behavior choices, promote the benign transformation of urban form and functional structure, and promote the development of low-carbon green cities. Of course, the paper and application based on the starting and ending data of the shared electric bike is still in the preliminary exploration stage, without considering the error caused by individual brand preference and the launching behavior of the shared electric bike, and more indicators need to be selected to characterize the specific conditions of the urban built environment (such as parking conditions, lane conditions, community conditions, etc.), which should be combined with the built environment and the individual society involved in the future further verification and exploration of micro-level surveys such as economics. The Mann–Kendall method is insensitive to seasonal and cyclical changes in the data and may ignore the impact of these factors on trends. These limitations may result in an incomplete analysis of trends in shared electric moped usage patterns. For example, if there are seasonal fluctuations or cyclical changes in the data, the Mann–Kendall method may not be able to accurately identify these changes, thereby affecting the reliability of the research conclusions. Therefore, this paper does not consider the periodic scale on the time scale. The Getis Order * method is very sensitive to the spatial scale of analysis. Different spatial scales may result in different hotspot areas, which requires researchers to carefully select the appropriate scale. Moreover, this method relies on the accuracy and completeness of the data. If the data quality is poor, it may affect the reliability of the analysis results. Therefore, this article repeatedly screens the data to improve the quality, and selects a spatial scale of 1 km, which can provide a more intuitive visualization effect at this scale.

5. Conclusions

The following research conclusions can be drawn from this paper:
By constructing an origin–destination matrix and integrating multi-dimensional data, the travel patterns and influencing factors of shared electric bikes can be fully revealed, providing strong support for the optimization and development of shared travel services. In terms of spatiotemporal characteristics and patterns of cycling, the distribution of shared electric bikes has significant morning and evening peak characteristics in terms of time; the high arrival volume is mainly concentrated during the morning and evening peak commuting period, and the morning peak arrival volume is greater than the evening peak. In space, the overall distribution of cycling shows the characteristics of “multi-center” agglomeration with distance decay from the center of the main urban area. The usage of shared electric bikes in Kunming changes greatly within a day, showing a bimodal characteristic. The demand for shared electric bike borrowing in the morning and evening peaks is mainly distributed near Dongfeng Square, Kunming railway station, Erji Road Station, Chenggong University Town, contiguous areas along the line, and high-density residential areas. This basically corresponds to the daily commuting activities of urban residents. The formation of spatial differentiation of morning and evening peak cycling is mainly affected by the built environment in the area.
In terms of interaction analysis of environmental factors: the comparison between the independent influencing factors and the interactive influencing factors of various factors proves that the influencing factors of shared electric bike cycling are not single, but rather result from the interaction among various built environment factors. The geographical detector factor detection model quantitatively analyzes the interaction influence between factors, which makes a good supplement to the independent influence results of various factors. Through the interactive detection model, it was found that the overall spatiotemporal distribution of cycling during each time period is most significantly affected by the distribution of service facilities, with q-value values above 0.8, followed by transportation accessibility, land use, and the natural environment. The q-value of natural environmental factors was less than 0.2. Among the interaction factors, the interaction between the building category and road network density is relatively high, and their q-values are all above 0.94.
The big data of shared electric bike cycling provides data support for the improvement of urban slow traffic system environment and land use planning. It uses the cycling data to mine residents’ travel rules, hoping to provide effective guidance for the launch and optimal scheduling of moped cycling, scientifically understand the spatial and temporal distribution characteristics of shared electric bike cycling and its influencing factors, and fully explore the scale effect of various factors on cycling, which is the basis for correctly mastering the use rules of shared electric bike. This is of great significance in controlling the number of shared electric bikes and ensuring efficient spatiotemporal scheduling, and provides a reference basis for relevant departments to manage the shared traffic situation in plateau cities. It also has certain reference value in urban pattern planning.

Author Contributions

M.G.: conceptualization, methodology, writing—original draft. C.G.: data curation, software, visualization. S.T.: conceptualization, methodology, writing—original draft. C.F.: writing—review and editing. F.Z.: conceptualization, methodology, writing—review and editing. All authors have read and agreed to the published version of the manuscript.

Funding

This research was funded by Xing Dian Talent Teacher’s Program of Yunnan Province (Grant NO. XDTT202206) and Supported by First Class University Construction Program of Yunnan University (Grant NO. CY22624108).

Institutional Review Board Statement

Not applicable.

Informed Consent Statement

Not applicable.

Data Availability Statement

The cycling data used in this article are in a confidential stage.

Acknowledgments

The authors express their sincere gratitude to Kunming Urban Management Bureau and Liu Yang, Kunming University of Science and Technology.

Conflicts of Interest

The authors declare no conflicts of interest.

References

  1. Peng, S.; Qi, W.; Chao, Z. Research on the influencing factors of green usage behavior and willingness of shared bicycles. J. Arid Land Resour. Environ. 2020, 34, 64–68. [Google Scholar]
  2. Hu, L.; Wen, Z.; Wang, J.; Hu, J. Spatial Interaction Analysis of Shared Bicycles Mobility Regularity and Determinants: A Case Study of Six Main Districts, Beijing. ISPRS Int. J. Geo-Inf. 2022, 11, 477. [Google Scholar] [CrossRef]
  3. Medeiros, R.M.; Bojic, I.; Jammot-Paillet, Q. Spatiotemporal Variation in Bicycle Road Crashes and Traffic Volume in Berlin: Implications for Future Research, Planning, and Network Design. Future Transp. 2021, 1, 686–706. [Google Scholar] [CrossRef]
  4. Niu, J.; Zheng, L.; Li, X. A study on the trip behavior of shared bicycles and shared electric bikes in Chinese universities based on NL model—Henan Polytechnic University as an example. Phys. A 2022, 604, 127936. [Google Scholar] [CrossRef]
  5. Wang, X.; Chen, J. Application of Geographic Information Technology in Shared Cycling. In Proceedings of the 2020 5th International Conference on Technologies in Manufacturing, Information and Computing, Chonburi, Thailand, 21–22 October 2020. [Google Scholar]
  6. Pan, Y.; Li, Y.; Zeng, S.; Hu, J.; Ullah, K. Green Recycling Supplier Selection of Shared Bicycles: Interval-Valued Pythagorean Fuzzy Hybrid Weighted Methods Based on Self-Confidence Level. Int. J. Environ. Res. Public Health 2022, 19, 5024. [Google Scholar] [CrossRef]
  7. Cao, Y.; Wang, Y. Shared Cycling Demand Prediction during COVID-19 Combined with Urban Computing and Spatiotemporal Residual Network. Sustainability 2022, 14, 9888. [Google Scholar] [CrossRef]
  8. Duan, Y.; Zhang, S.; Yu, Z. Applying Bayesian spatio-temporal models to demand analysis of shared bicycle. Phys. A 2021, 583, 126296. [Google Scholar] [CrossRef]
  9. Wu, J.; Wang, L.; Li, W. Usage Patterns and Impact Factors of Public Bicycle Systems: Comparison between City Center and Suburban District in Shenzhen. Int. J. Sustain. Transp. 2021, 15, 215–228. [Google Scholar] [CrossRef]
  10. Gao, Y.; Song, C.; Shu, H.; Pei, T. Analysis of spatiotemporal characteristics and spatial scheduling of the source and sink of Mobike shared bicycles in Beijing. J. Earth Inf. Sci. 2018, 20, 1123–1138. [Google Scholar]
  11. Zhao, P.; Yuan, D.; Zhang, A. The Public Bicycle as a Feeder Mode for Metro Commuters in the Megacity Beijing: Travel Behavior, Route Environment, and Socioeconomic Factors. J. Urban Plan. Dev. 2022, 148, 04021064. [Google Scholar] [CrossRef]
  12. Yang, Z.; Lian, F.; Chen, A. Impacts of Public Bicycles on Young People’s Travel Mode Choices with Consideration of Chosen Intentions. J. Transp. Geogr. 2020, 82, 102625. [Google Scholar] [CrossRef]
  13. Li, S.; Zhuang, C.; Tan, Z.; Gao, F.; Lai, Z.; Wu, Z. Inferring the trip purposes and uncovering spatio-temporal activity patterns from dockless shared bike dataset in Shenzhen, China. J. Transp. Geogr. 2021, 91, 102974. [Google Scholar] [CrossRef]
  14. Li, W.; Wang, S.; Zhang, X.; Jia, Q.; Tian, Y. Understanding intra-urban human mobility through an exploratory spatiotemporal analysis of bike-sharing trajectories. Int. J. Geogr. Inf. Sci. 2020, 34, 2451–2474. [Google Scholar] [CrossRef]
  15. Liu, H.; Lin, J. Associations of built environments with spatiotemporal patterns of public bicycle use. J. Transp. Geogr. 2019, 74, 299–312. [Google Scholar] [CrossRef]
  16. Qin, H.; Yu, B.; Dun, Y.; Bai, A. Effects of Trip Generation and Attraction Attributes on Bicycle-Sharing System Ridership. Sustainability 2022, 14, 3400. [Google Scholar] [CrossRef]
  17. Zhu, Y.; Diao, M. Understanding the spatiotemporal patterns of public bicycle usage: A case study of Hangzhou, China. Int. J. Sustain. Transp. 2020, 14, 163–176. [Google Scholar] [CrossRef]
  18. Wang, X.; Lindsey, G.; Schoner, J.E.; Harrison, A. Modeling Bike Share Station Activity: Effects of Nearby Businesses and Jobs on Trips to and from Stations. arXiv 2016, arXiv:2207.10577. [Google Scholar] [CrossRef]
  19. Li, H.; Xing, Y.; Zhang, W.; Zhang, A. Investigating the Impact of Weather Conditions and Land Use on Dockless Bike-Share Trips in Shanghai, China. J. Clean. Prod. 2020, 275, 122945. [Google Scholar] [CrossRef]
  20. Liu, S.; Zhang, F.; Ji, Y.; Ma, X.; Liu, Y.; Li, S.; Zhou, X. Understanding spatial-temporal travel demand of private and shared e-bikes as a feeder mode of metro stations. J. Clean. Prod. 2023, 398, 136602. [Google Scholar] [CrossRef]
  21. Sun, C.; Lu, J. The relative roles of different land-use types in bike-sharing demand: A machine learning-based multiple interpolation fusion method. Inf. Fusion 2023, 95, 384–400. [Google Scholar] [CrossRef]
  22. Xuan, J.; Chengcheng, X.; Jing, Z.; Qiyu, L. Prediction of spatiotemporal and dynamic demand for non stake shared bicycles on campus. J. Chang’an Univ. (Nat. Sci. Ed.) 2022, 42, 105–115. [Google Scholar]
  23. Chen, Y.; Chen, Y.; Tu, W.; Zeng, X. Is eye-level greening associated with the use of dockless shared bicycles? Urban For. Urban Green. 2020, 51, 126636. [Google Scholar] [CrossRef]
  24. Min, C.; Ying, L.; Yanhui, Z.; Guonian, L.; Zaiyang, M. Prediction for Origin-Destination Distribution of Dockless Shared Bicycles: A Case Study in Nanjing City. Front. Public Health 2022, 10, 849766. [Google Scholar] [CrossRef]
  25. Zhang, S.; Chen, L.; Li, Y. Shared Bicycle Distribution Connected to Subway Line Considering Citizens’ Morning Peak Social Characteristics for Urban Low-Carbon Development. Sustainability 2021, 13, 9263. [Google Scholar] [CrossRef]
  26. Zhang, L.; Yan, J. Study on Activating Neighbourhood Space under the Impact of Shared Cycling Mode. IOP Conf. Ser. Earth Environ. Sci. 2019, 281, 012026. [Google Scholar] [CrossRef]
  27. Wu, P.; Meng, X.; Song, L. Identification and spatiotemporal evolution analysis of high-risk crash spots in urban roads at the microzone-level: Using the space-time cube method. J. Transp. Saf. Secur. 2022, 14, 1510–1530. [Google Scholar] [CrossRef]
  28. Iqbal, M.; Lissandrini, M.; Pedersen, T.B. A foundation for spatio-textual-temporal cube analytics. Inf. Syst. 2022, 108, 102009. [Google Scholar] [CrossRef]
  29. Getis, A.; Ord, J.K. The Analysis of Spatial Association by Use of Distance Statistics. Geogr. Anal. 1992, 24, 189–206. [Google Scholar] [CrossRef]
  30. Huang, J.; Sun, Z.; Du, M. Spatiotemporal characteristics and determinants of agricultural carbon offset rate in China based on the geographic detector. Environ. Sci. Pollut. Res. Int. 2023, 30, 58142–58155. [Google Scholar] [CrossRef] [PubMed]
  31. Jie, L.; Jinliang, W.; Jun, Z.; Chenli, L.; Suling, H.; Lanfang, L. Growing-season vegetation coverage patterns and driving factors in the China-Myanmar Economic Corridor based on Google Earth Engine and geographic detector. Ecol. Indic. 2022, 136, 108631. [Google Scholar] [CrossRef]
  32. Li, X.; Niu, Y.; He, Q.; Wang, H. Identifying driving factors of the runoff coefficient based on the geographic detector model in the upper reaches of Huaihe River Basin. Open Geosci. 2022, 14, 1421–1433. [Google Scholar] [CrossRef]
  33. Zhang, X.; Ma, X.; Wang, X. Using the geographic detector model to identify factors controlling the bioavailability of Sr isotopes in China. Front. Earth Sci. 2023, 11, 1032578. [Google Scholar] [CrossRef]
  34. Zhao, Y.; Wu, Q.; Wei, P.; Zhao, H.; Zhang, X.; Pang, C. Explore the Mitigation Mechanism of Urban Thermal Environment by Integrating Geographic Detector and Standard Deviation Ellipse (SDE). Remote Sens. 2022, 14, 3411. [Google Scholar] [CrossRef]
  35. Wang, H.; Li, X.; Zhang, L. Analysis of urban traffic flow using spatiotemporal cube model. J. Transp. Geogr. 2020, 85, 102729. [Google Scholar] [CrossRef]
  36. Liu, Y.; Zhou, Z.; Wang, Y. Spatiotemporal distribution and driving factors of air pollution: A geographical detector-based analysis. Environ. Pollut. 2019, 254, 113090. [Google Scholar] [CrossRef]
  37. Liu, L.; Wei, Q. Modeling and analysis of shared bike trip patterns integrating multi-source urban data. Transp. Res. Part C Emerg. Technol. 2019, 104, 153–168. [Google Scholar] [CrossRef]
  38. Wang, X.; Li, X.; Zhang, X. Understanding the spatiotemporal patterns of bike-sharing usage and its influential factors in Chicago. J. Transp. Geogr. 2018, 66, 156–168. [Google Scholar] [CrossRef]
  39. Yuan, Q.; Ye, X. Exploring the determinants of bike-sharing usage and their temporal variations: A case study of Suzhou, China. J. Clean. Prod. 2020, 273, 122864. [Google Scholar] [CrossRef]
  40. Zhang, Y.; Liu, X. Analyzing the spatial distribution of dockless bike-sharing system and its influencing factors using geographic information system. Sustain. Cities Soc. 2020, 53, 101928. [Google Scholar] [CrossRef]
  41. Zhao, J.; Deng, W.; Song, Y. Ridership analysis of bikesharing systems using time series clustering. Transp. Res. Part C Emerg. Technol. 2017, 78, 107–120. [Google Scholar] [CrossRef]
  42. Gao, Y.; Song, C.; Sihui, G.; Pei, T. The spatiotemporal characteristics and influencing factors of shared bicycle sources and sinks connecting to subway stations. J. Earth Inf. Sci. 2021, 23, 155–170. [Google Scholar] [CrossRef]
  43. Foschi, R. A Point Processes approach to bicycle sharing systems’ design and management. Soc.-Econ. Plan. Sci. 2023, 87, 101608. [Google Scholar] [CrossRef]
  44. Ritchie, B.W. Bicycle tourism in the South Island of New Zealand: Planning and management issues. Tour. Manag. 1998, 19, 567–582. [Google Scholar] [CrossRef]
  45. Van der Spek, S.C.; Scheltema, N. The importance of bicycle parking management. Res. Transp. Bus. Manag. 2015, 15, 39–49. [Google Scholar] [CrossRef]
Figure 1. Research area map.
Sustainability 16 06570 g001
Figure 2. Distribution pattern of spatiotemporal hotspots for shared electric bikes.
Sustainability 16 06570 g002
Figure 3. Spatial and temporal distribution of shared electric bike cycling OD.
Sustainability 16 06570 g003
Figure 4. Distribution factor detection results of shared electric bike cycling destinations. Note: the line refers to the left vertical coordinate, and the bar chart refers to the right vertical coordinate.
Sustainability 16 06570 g004aSustainability 16 06570 g004b
Figure 5. Suggested site selection for shared electric bike in tidal areas.
Sustainability 16 06570 g005
Table 1. Shared electric bike travel data record table (partial).
Motorcycle ID37501194753750051477
Borrowing shared bike time28 April 2022 12:02:10 a.m.28 April 2022 12:06:38 a.m.
Lending vehicle longitude102.7351685102.7612115
borrowing latitude25.0026577924.95758281
Return time28 April 2022 12:07:46 a.m.28 April 2022 12:20:26 a.m.
Return longitude102.7320703102.7725014
Return latitude24.999823424.92959396
Table 2. Source of influencing factor research data.
CategoryClassificationFactorMean ValueStandard Deviation
Natural environmental factors/Altitude (X1)2050.52156.67
/slope (X2)11.879.26
Built environment factorTraffic accessibility factorDensity of subway stations (X3)0.110.21
Bus station density (X4)1.915.20
Road network density (X5)7.428.25
Land use factorsPOI Diversity (X6)429.001183.00
Service facility factorDistribution density of shopping facilities (X7)13.7261.10
Distribution density of catering facilities (X8)6.6826.05
Residential distribution density (X9)15.4560.00
Distribution density of enterprise companies (X10)14.5954.79
Table 3. Distribution factor category detection results of shared electric bike cycling destinations.
Factor CategoryMorning Peak
(7:00–9:00)
Evening Peak
(17:00–19:00)
Other Time Periods
q Valueq Sortingq Valueq Sortingq Valueq Sorting
Natural environmental factors0.148040.145740.14664
Traffic accessibility factor0.803420.799330.80673
Land use factors0.796030.814120.81802
Service facility factor0.807010.841010.83001
Table 4. Distribution factor detection results of shared electric bike cycling destinations.
CategoryFactorMorning Peak
(7:00–9:00)
Evening Peak
(17:00–19:00)
Other Time Periods
q Valueq Sortingq Valueq Sortingq Valueq Sorting
Natural environmental factorselevation0.189890.178090.17769
slope0.1051100.1151100.112610
Traffic accessibility factorDensity of subway stations0.725970.754770.75417
Bus station density0.842320.861620.86072
Road network density0.837630.803760.80426
Land use factorsPOI Diversity0.789660.818050.83004
Service facility factorDistribution density of shopping facilities0.802850.847240.82825
Distribution density of catering facilities0.859210.883610.73128
Residential distribution density0.817340.848030.84363
Distribution density of enterprise companies0.722580.741580.88011
Table 5. Interactive detection results of the distribution of shared electric bike cycling destinations during morning peak hours.
Saturday at 8:00 (the Morning Peak with the Smallest Arrival Volume)Friday 9:00 (the Morning Peak with the Highest Arrival Volume)
SortDominant Interaction Factorq ValueInteraction ResultsSortDominant Interaction Factorq ValueInteraction Results
1Residential distribution density ⋂ Road network density0.9452Double-factor enhancement1Residential distribution density ⋂ Road network density0.945Double-factor enhancement
2Road network density ⋂ Bus station density0.9389Double-factor enhancement2Road network density ⋂ Bus station density0.9436Double-factor enhancement
3Road network density ⋂ Distribution density of shopping facilities0.9361Double-factor enhancement3Road network density ⋂ Distribution density of shopping facilities0.9411Double-factor enhancement
4Road network density ⋂ Distribution density of catering facilities0.9352Double-factor enhancement4Road network density ⋂ Distribution density of catering facilities0.9405Double-factor enhancement
5POI Diversity ⋂ Distribution density of catering facilities0.918Double-factor enhancement5POI Diversity ⋂ Distribution density of catering facilities0.9141Double-factor enhancement
6POI Diversity ⋂ Distribution density of shopping facilities0.9134Double-factor enhancement6POI Diversity ⋂ Distribution density of shopping facilities0.9082Double-factor enhancement
7POI Diversity ⋂ Bus station density0.9077Double-factor enhancement7POI Diversity ⋂ Bus station density0.9006Double-factor enhancement
8Residential distribution density ⋂ POI Diversity0.9036Double-factor enhancement8Residential distribution density ⋂ POI Diversity0.8876Double-factor enhancement
9Road network density ⋂ Altitude0.8837Double-factor enhancement9Road network density ⋂ Altitude0.8747Double-factor enhancement
10Road network density ⋂ Slope0.8822Double-factor enhancement10Road network density ⋂ Slope0.8722Double-factor enhancement
Table 6. Interactive detection results of the distribution of shared electric bike cycling destinations during evening peak hours.
Saturday at 19:00 (the Evening Peak with
the Smallest Arrival Volume)
Friday at 19:00 (the Evening Peak with
the Highest Arrival Volume)
SortDominant Interaction Factorq ValueInteraction
Results
SortDominant Interaction Factorq ValueInteraction
Results
1Residential distribution density ⋂
Distribution density of shopping facilities
0.9467Double-factor
enhancement
1Residential distribution density ⋂
Road network density
0.9515Double-factor
enhancement
2POI Diversity ⋂ Distribution
density of shopping facilities
0.9459Double-factor
enhancement
2Road network density ⋂
Bus station density
0.9507Double-factor
enhancement
3Density of subway stations ⋂
Distribution density of catering facilities
0.9459Double-factor
enhancement
3Road network density ⋂ Distribution
density of shopping facilities
0.9451Double-factor
enhancement
4Road network density ⋂
Distribution density of shopping facilities
0.9437Double-factor
enhancement
4Road network density ⋂ Distribution
density of catering facilities
0.9426Double-factor
enhancement
5Distribution density of catering facilities
⋂ Bus station density
0.9418Double-factor
enhancement
5POI Diversity ⋂ Distribution
density of catering facilities
0.931Double-factor
enhancement
6Distribution density of catering facilities ⋂
Distribution density of enterprise companies
0.9401Double-factor
enhancement
6POI Diversity ⋂
Bus station density
0.9303Double-factor
enhancement
7Distribution density of enterprise companies ⋂
Distribution density of catering facilities
0.938Double-factor
enhancement
7POI Diversity ⋂ Distribution
density of shopping facilities
0.9296Double-factor
enhancement
8Density of subway stations ⋂ Distribution
density of shopping facilities
0.9302Double-factor
enhancement
8POI Diversity ⋂
Road network density
0.9232Double-factor
enhancement
9Residential distribution density ⋂
Density of subway stations
0.9287Double-factor
enhancement
9Residential distribution density
⋂ POI Diversity
0.9209Double-factor
enhancement
10Residential distribution density ⋂
Distribution density of catering facilities
0.9241Double-factor
enhancement
10Road network density
⋂ Altitude
0.9015Double-factor
enhancement
Note: Set factor X 1 and X 2 interactions, the influence is q X 1 X 2 . If q X 1 X 2 > q X 1 + q X 2 , it is a nonlinear enhancement; if q ( X 1 X 2 ) = q X 1 + q X 2 , the two factors are independent; if q X 1 X 2 > M a x q X 1 , q X 2 , it is a double-factor enhancement; if M i n q X 1 , q X 2 < q X 1 X 2 < M a x q X 1 , q X 2 it is a single-factor nonlinear enhancement; if q X 1 X 2 < M i n q X 1 , q X 2 , it is nonlinear weakening.
Disclaimer/Publisher’s Note: The statements, opinions and data contained in all publications are solely those of the individual author(s) and contributor(s) and not of MDPI and/or the editor(s). MDPI and/or the editor(s) disclaim responsibility for any injury to people or property resulting from any ideas, methods, instructions or products referred to in the content.

