Abstract
This study delves into the impact of industrial intelligence on corporate carbon performance using micro-level data from 1072 listed manufacturing companies in China’s A-share market from 2012 to 2021. Industrial intelligence, through the integration of advanced technologies such as AI, IoT, and big data analytics applied to industrial robots, significantly improves the corporate carbon performance, measured by the carbon intensity and total emissions. Although the total carbon emissions increase due to the output effect, the efficiency optimization effect of industrial intelligence has a greater impact, reducing carbon intensity and emissions. The reduction effect from increased production efficiency outweighs the increase from the output effect. Heterogeneity tests show significant carbon reduction effects of industrial intelligence in industries with heavy and moderate carbon emissions, but an increase in carbon emissions in industries with light carbon emissions. Regional differences also emerge, with more effective carbon reduction in the Yangtze River Delta and Pearl River Delta regions compared to the Beijing-Tianjin-Hebei region. These findings highlight the carbon reduction potential of industrial intelligence across different industries and regions, offering valuable insights for targeted environmental policies and corporate strategies.
1. Introduction
In recent years, reducing carbon emissions has become critically important globally, driven by the urgent need to mitigate climate change and achieve sustainable development. The 2009 Copenhagen Climate Conference resulted in an emissions reduction agreement for 2012 to 2020, and the 2015 Paris Climate Conference adopted the Paris Agreement, which set more urgent carbon reduction targets to foster global cooperation in addressing climate change. Participating countries have developed nationally determined contributions (NDCs), outlining their specific emission reduction goals and pathways, aiming to accelerate the global energy revolution and transition [1,2]. Achieving an effective carbon emission reduction is not only essential for environmental sustainability, but also impacts the economic sustainability and international competitiveness of nations. This imperative is particularly significant for developing countries, which face unique challenges and opportunities in balancing economic growth with environmental sustainability. Developing and transitioning economies tend to rely heavily on the exploitation of natural resources for growth and are encountering several challenges related to resource efficiency and the environmental footprint [3,4]. However, many developing countries including India, Pakistan, and Bangladesh are actively pursuing green growth initiatives such as green finance, green deals, sustainability practices, and circular economy principles [4,5,6]. These efforts highlight the varied approaches and impacts across countries, emphasizing the differences between green finance, green deals, sustainability, circular economy, and green economy initiatives. As the largest developing country, China has set ambitious goals of reaching its carbon peak by 2030 and carbon neutrality by 2060, further intensifying efforts to explore effective carbon reduction strategies. This is not only vital for sustainable environmental development, but also directly impacts the sustainability of the national economy and international competitiveness.
The use of industrial robots exemplifies the application of artificial intelligence in manufacturing [7]. Advancing industrial intelligence is a crucial direction for industrial upgrading and transformation. Represented by industrial robots, industrial intelligence has rapidly developed in China, with an increasing number of industrial enterprises incorporating robots into their production activities. China is the largest user of industrial robots worldwide. In 2016, the sales volume of industrial robots in China reached 87,000 units, accounting for about 30% of the global market share [8]. This has propelled the swift advancement of industrial intelligence, while simultaneously, controlling carbon emissions has become a core national development goal. Both industrial intelligence and carbon reduction are objectives for China’s future development, making the relationship between industrial intelligence and carbon reduction a complex and intriguing issue.
Prior research has not reached a consensus on the relationship between industrial intelligence and carbon emissions, with different studies yielding varied results. Some research has indicated a positive correlation between industrial intelligence and a decrease in carbon intensity [9]. Conversely, other studies suggest that industrial intelligence might have negative impacts; although technological advancements directly reduce carbon dioxide emissions, their indirect effects might lead to an increase in emissions [10]. This inconsistency underscores a critical gap in the literature and highlights the pressing need for more nuanced and comprehensive investigations into the multifaceted impacts of industrial intelligence on carbon emissions. Existing studies have primarily focused on macro-level analyses including national, city, or industry-level carbon emission trends. However, these studies are significantly limited in revealing the impact of industrial intelligence on carbon reduction at the micro-enterprise level. Understanding the relationship at a granular level is crucial, as it allows for the identification of specific mechanisms through which industrial intelligence influences carbon emissions. This study aims to fill this research gap by providing a detailed analysis of how industrial intelligence affects corporate carbon performance, measured by carbon intensity (emissions per unit of output) and total emissions, using data from 1072 listed manufacturing companies in China’s A-share market from 2012 to 2021.
This research not only discusses the role of industrial intelligence in improving overall corporate carbon performance and achieving carbon reduction, but also delves deeper into various industry fields, considering factors such as industry characteristics, regional differences, and corporate outputs, to comprehensively analyze the complex, multi-dimensional nature of this relationship. By analyzing the impact at the micro-enterprise level, we aim to provide a more detailed understanding of how industrial intelligence influences carbon emissions within firms. Through this in-depth analysis from a micro perspective, we can more accurately assess the diversity and complexity of the environmental impacts of industrial intelligence, providing new insights into its specific roles across different economic and environmental contexts. This study’s findings are expected to contribute to the academic discourse and offer practical insights for policymakers and industry leaders aiming to leverage industrial intelligence for sustainable development.
The remainder of this paper is organized as follows. Section 2 proposes the research hypotheses based on a literature review. Section 3 describes the data and models used in this study. Section 4 presents the regression results of the model and their discussion. Finally, Section 5 summarizes the main findings and offers related policy recommendations.
2. Literature Review and Mechanisms of Influence
2.1. Literature Review
With the increasing prominence of environmental challenges, the academic community has intensified research on factors affecting carbon emissions. Since 1980, studies have shown significant growth in this area [11]. Research has primarily focused on the impacts of economic growth, industrial structure, policy interventions, and technological innovations on carbon emissions.
Studies on economic growth, industrial structure, and carbon emissions indicate that economic development, population growth, urbanization, and adjustments in industrial structure significantly influence carbon emissions [12,13,14]. These findings reveal that economic development and industrial structure adjustment are core factors affecting carbon dioxide emissions in China. In contrast, changes in the structure of energy consumption, the degree of openness to foreign trade, and urbanization levels have a relatively minor impact on carbon emissions. Moreover, the hypothesized inverse U-shaped relationship between per capita carbon emissions and the level of economic development has not been strongly supported by these findings.
In terms of policy interventions, studies on carbon emissions trading systems and environmental regulations have also garnered attention. Effective carbon emissions trading systems significantly reduce carbon emissions from businesses and regions, positively impacting air quality [15,16]. Regarding environmental regulations, research shows that the implementation of such regulations has a complex effect on carbon emissions, exhibiting a U-shaped impact at different stages and a dual role of government intervention [17].
The rapid advancement of science and technology has also led to a widespread focus on the multiple impacts of technological innovation on carbon emissions. Research highlights the crucial role of R&D investment and low-carbon energy solutions in reducing carbon emissions [18,19,20]. Further studies have shown that renewable energy consumption and technological innovations play active roles in reducing carbon emissions [21,22,23], with renewable electricity consumption and energy innovations significantly improving the environmental quality and reducing carbon emissions [24]. However, the impact of technological innovation on carbon emissions is not always positive. Studies have also revealed the complex relationship between technological innovation and carbon emissions. Research on the spatial correlation between carbon emissions and R&D intensity indicates that technological innovations in high-income, high-tech, high-carbon-emission countries can significantly reduce carbon emissions in neighboring countries, while the R&D intensity in other countries may increase carbon emissions [25].
With the rapid development of artificial intelligence, research on the economic impacts of industrial intelligence has also increased, focusing on production efficiency, production scale, labor markets, and economic growth. Regarding the effects of artificial intelligence on production efficiency and scale, industrial robots have been found to enhance labor productivity and added value, boosting economic growth by 0.37% and improving the total factor productivity [26]. Studies on the impact of artificial intelligence on the labor market indicate both substitution and production effects [27]. Research on the impact of artificial intelligence on employment shows significant job creation, although studies have also found that industrial intelligence leads to a “polarization” in employment structures [28]. Additionally, the significant impact of artificial intelligence on economic growth and productivity is increasingly acknowledged [29]. Studies have found that high substitution elasticity between artificial intelligence and labor clearly reduces the total demand and slows GDP growth, while lower elasticity may still slow the GDP, productivity, and wage growth [30,31].
Current research has not reached a consensus on the relationship between industrial intelligence and carbon emissions. On the one hand, studies have shown a positive correlation between the increase in industrial robots in China’s industrial sector and a decrease in carbon intensity [9]. Similarly, studies have found that artificial intelligence has a significantly positive effect on reducing carbon emissions in large, technologically advanced cities [32]. On the other hand, studies have also indicated potential negative effects of industrial intelligence such as increased air pollution and exacerbated climate warming. Moreover, although technological progress directly reduces carbon dioxide emissions, its indirect effects may increase emissions [10,33]. Furthermore, some studies have emphasized the differential impacts of industrial intelligence, finding an inverse U-shaped relationship between artificial intelligence technology and carbon emissions, indicating that the carbon reduction effect becomes more apparent as technology reaches a certain level [34]. Studies also show that the impact of artificial intelligence on carbon emissions varies by country, with more significant carbon reduction effects in high-carbon-emission, high-income countries.
The existing literature highlights the complexity of carbon emissions, industrial intelligence, and their interactions, particularly the significant role of industrial intelligence in affecting carbon emissions. These studies demonstrate the potential of technological advancement and intelligence in enhancing production efficiency and reducing carbon emissions, but they also highlight the accompanying additional energy demands and environmental pressures. Although these preliminary studies provide valuable insights into the impact of industrial intelligence on corporate carbon emissions, they largely remain at the macro-level such as national, city, or industry overall carbon emission trends. This study aims to delve into the specific impact of industrial intelligence on carbon emissions and its mechanisms at the micro-enterprise level. By focusing on the micro-level, this research not only examines the overall impact of industrial intelligence on corporate carbon reduction, but also explores how industry characteristics, regional differences, and corporate output affect this relationship. This in-depth analysis helps more accurately assess the complexity and diversity of the environmental impacts of industrial intelligence.
2.2. Mechanisms of Influence
2.2.1. Efficiency Optimization Hypothesis
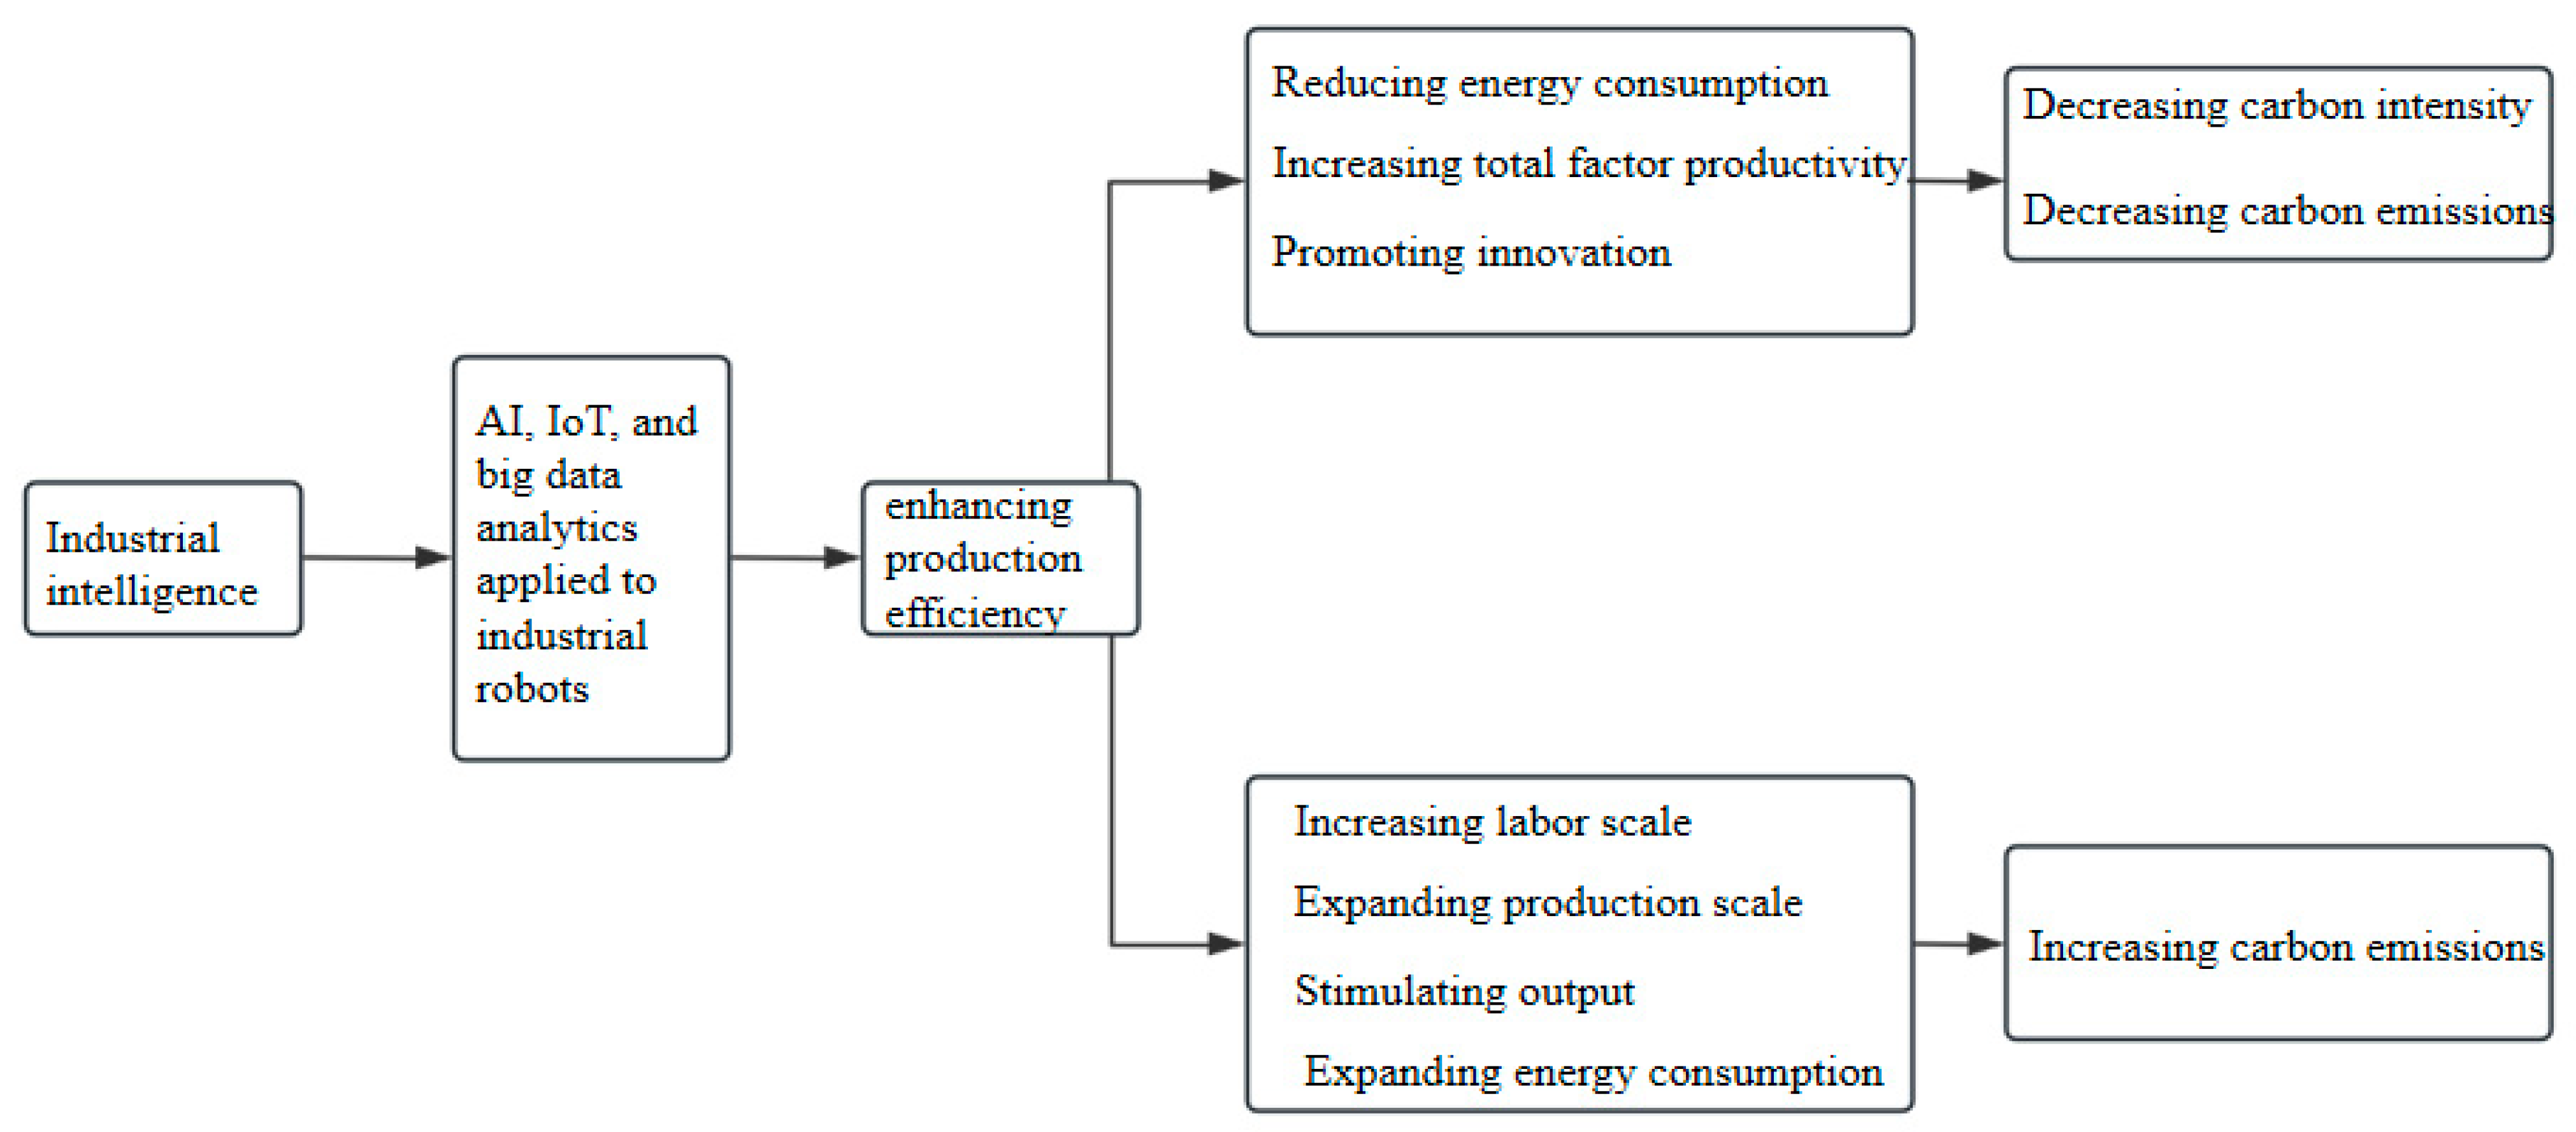
Industrial intelligence reduces carbon emissions and intensity significantly by enhancing production efficiency and refining management processes, largely due to the effective management capabilities of automation control systems. These systems can precisely control resource usage and minimize inefficient energy consumption, thereby optimizing carbon performance, as illustrated in Figure 1. Previous research has demonstrated that artificial intelligence primarily drives economic growth through three mechanisms: enhancing the level of automation and intelligence in production activities, increasing the return on capital to encourage capital accumulation, and improving the total factor productivity [35]. Industrial robots not only promote production efficiency and optimize factor structures, but also foster innovation in production technology, thereby enhancing energy efficiency [36]. By precisely controlling movements and energy consumption, industrial robots avoid unnecessary energy waste, helping lower carbon intensity during production processes. Overall, industrial intelligence significantly enhances corporate production efficiency through automation, intelligent analysis and optimization, and intelligent decision support, playing a key role in reducing carbon emissions and lowering carbon intensity.
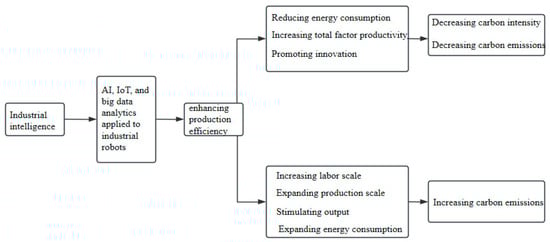
Figure 1.
Mechanisms of industrial intelligence impacting the corporate carbon performance.
Based on the above analysis, the following hypothesis is proposed for verification:
H1.
Industrial intelligence reduces the corporate carbon intensity through energy efficiency optimization.
2.2.2. Output Increase Hypothesis
While industrial intelligence improves production efficiency, it can also lead to an expansion in the labor and production scale, resulting in higher energy consumption and carbon emissions. Studies indicate that enterprises with industrial robots tend to have larger workforces and are more likely to expand employment compared to those without robots. This expansion is due to mechanisms where industrial robots enhance production efficiency, expand production scale, and create demand for related technical positions [37]. The use of robots boosts productivity and energy efficiency, which stimulates increased production and consumption. Industrial robots can increase labor demand in enterprises by expanding the production scale [10,26,27,38]. According to the theory of heterogeneous enterprises, the use of robots can enhance the competitiveness of enterprise products, drive up product demand and output scale, and thus increase the labor demand in production. Enterprises introduce industrial robots to improve production efficiency, thereby increasing the scale of employment [39]. Overall, industrial intelligence can lead to an expansion of production and labor scales, which may stimulate an increase in output accompanied by a greater energy consumption, potentially leading to higher carbon emissions, as shown in Figure 1.
However, the output effect of industrial intelligence on corporate carbon performance is not unequivocally defined. While the total carbon emissions may increase, this does not directly imply that the carbon intensity per unit of output will rise. Improved production efficiency may lead to stable or even reduced carbon intensity. Therefore, the output effect of industrial intelligence on corporate carbon performance still requires further verification.
Based on the above analysis, the following two hypotheses are proposed for verification:
H2A.
From a corporate perspective, when the effect of improved production efficiency is dominant, industrial intelligence reduces corporate carbon emissions.
H2B.
From a corporate perspective, when the output increase effect is dominant, industrial intelligence increases corporate carbon emissions.
3. Data and Model Design
3.1. Sample Data
In this study, we utilized the data of 1072 A-share listed manufacturing companies in China from the years 2012 to 2021. The industries were subdivided using a two-digit code beginning with “c”. The financial data for these firms were sourced from the GTA database and the Wind database. Province-specific variables were obtained from various statistical yearbooks. After excluding companies with significant data deficiencies and those classified as ST (special treatment), the final dataset comprised 10,720 valid observations.
3.2. Variables
3.2.1. Dependent Variables: Carbon Intensity and Carbon Emission Levels
Since direct carbon emission data for manufacturing enterprises are not readily available, we estimated the carbon emissions of firms based on industry-level emissions. Industry carbon emissions were derived from the China Emissions Accounts and Datasets (CEADs) [40,41]. The estimation method, adapted from [42], utilized the following formula to calculate the corporate-level carbon emissions:
where represents the carbon emissions of company i at time t; denotes the total carbon emissions of the industry j; is the main operating cost of company i; and is the total main operating cost of industry j.
When studying the carbon performance, the measures of process-based carbon intensity and outcome-based absolute total emissions (natural logarithm of total emissions) are commonly used and mainstream. These metrics provide a comprehensive assessment of a company’s carbon management and environmental impact. Therefore, in our analysis, the dependent variables were carbon intensity and carbon emission volume. Carbon intensity is defined as the total carbon emissions divided by the operating income, denoted as CEI. This measure reflects how efficiently a company generates revenue relative to its carbon emissions, providing insights into the company’s operational sustainability. Carbon emission volume is defined as the natural logarithm of the company’s carbon emissions, denoted as CE. Together, these two dependent variables offer a nuanced view of corporate carbon performance, capturing both the efficiency of emissions relative to economic activity (carbon intensity) and the absolute scale of emissions (carbon emission volume). This dual approach ensures a holistic understanding of how companies manage their carbon emissions, which is crucial for developing effective carbon reduction strategies and policies.
3.2.2. Independent Variable: Industrial Intelligence
We constructed an index of industrial intelligence for Chinese manufacturing companies by referencing the approaches of [27,43]. The specific calculation method is as follows:
Step 1: Calculate the industry-level industrial robot penetration index, denoted as :
where represents the stock of industrial robots in industry i in year t in China, and represents the number of employees in industry i in China in the base year 2011. denotes the penetration rate of industrial robots in industry i in year t.
Step 2: Construct the company-level degree of industrial intelligence:
This index measures the degree of industrial intelligence of company j in industry i in year t. Here, represents the ratio of the proportion of production workers in company j in industry i in the base year 2012 to the median proportion of production workers across all companies in the manufacturing sector in the same year. This ratio disaggregates the industry-level penetration of industrial robots to the company level, thereby assessing the level of industrial robot application within the company. Changes in the level of industrial robot application at the company level reflect changes in the technological characteristics of the industry, independent of company-specific characteristics. By calculating the company-level degree of industrial intelligence, we gain a deeper understanding of whether companies are broadly applying industrial robots in their production and operations and can quantify the proportion of industrial robots in the production processes of companies. This method of calculation takes into account various factors such as the size of the company, industry characteristics, and technology density. Additionally, this comprehensive approach ensures that the index reflects both the industry-level trends and company-specific adoption of industrial intelligence, providing a robust measure for our analysis.
3.2.3. Control Variables
To control for other factors, based on the existing literature [9,10,32,44], we included the company size, industry competition, foreign direct investment, research and development investment, environmental regulation, and company age as control variables. The data descriptions and statistical summaries of these control variables are presented in Table 1.

Table 1.
Data description and statistical description of the variables.
3.3. Model Design
In order to test the impact of industrial intelligence on corporate carbon performance, the following fixed effects panel regression model was constructed:
In the above model, i denotes each enterprise, t denotes the year, CP denotes the carbon intensity or carbon emission of the manufacturing enterprise, II denotes the degree of industrial intelligence of the manufacturing enterprise, and denotes the control variables including the enterprise size, industry competition, foreign direct investment, R&D investment, environmental regulation, and firm age. denotes the random error term, denotes the enterprise fixed effect, denotes time fixed effects, and denotes the industry fixed effects.
4. Results and Discussion
4.1. Benchmark Regression
Table 2 presents the results of the baseline regression. The goal of this analysis was to evaluate the significant impact of industrial intelligence on the carbon intensity and carbon emission levels of enterprises on both the including and excluding fixed effects. Columns 1 and 2 show the results for the carbon emission intensity (CEI) as the dependent variable, while columns 3 and 4 show the results for carbon emissions (CE) as the dependent variable. Additionally, columns 1 and 3 do not include the fixed effects, whereas columns 2 and 4 include the firm, year, and industry fixed effects.
Table 2.
Benchmark regression results.
The estimated results indicate that industrial intelligence significantly reduces both the carbon intensity and carbon emission levels of enterprises. As indicated in columns 2 and 4 of the table, the impact coefficient of industrial intelligence on carbon intensity was −0.005, and on the carbon emission volume, it was −0.002, both significant at the 1% level. This implies that with every 1% increase in industrial intelligence, there is a 0.005% reduction in carbon intensity and a 0.002% reduction in the carbon emissions of enterprises. The results demonstrate that the coefficient of industrial intelligence, the core explanatory variable, was significant at the 1% level or above, regardless of whether the fixed effects were included or not.
4.2. Robustness Test
4.2.1. Exclusion of Low Carbon Emission Industries
To test the robustness of our findings, we excluded industries within the manufacturing sector that significantly emitted less carbon than others. These include industries such as “comprehensive utilization of waste resources”, “furniture manufacturing”, “wood processing and manufacturing”, “textile and apparel industries”, “manufacturing of cultural, educational, and sports goods”, and “leather, fur, feather (and down) products and footwear manufacturing”.
The purpose of this analysis was to determine whether the relationship between industrial intelligence and carbon emissions holds when low carbon emission industries are excluded, ensuring that the results are not driven by industries with inherently lower emissions. By focusing on industries with higher carbon emissions, we aim to provide a more accurate assessment of the impact of industrial intelligence on carbon reduction.
The estimated results, presented in Table 3, indicate that the impact coefficient of industrial intelligence on carbon intensity was −0.008, significant at the 1% level. Additionally, the impact coefficient of industrial intelligence on the carbon emission volume was −0.002, also significant at the 1% level. These findings suggest a significant negative correlation between industrial intelligence and both carbon intensity and carbon emissions in manufacturing enterprises. This result is consistent with the baseline regression outcomes and confirms that industrial intelligence significantly influences carbon reduction in manufacturing enterprises.
Table 3.
Robustness test I.
4.2.2. Replacement of Explained Variables
To enhance the credibility of this study, we utilized energy consumption data for sub-industries within the manufacturing sector from the CEIC database. We adopted the method described by [45] to estimate the carbon emissions. This approach was used to replace the original dependent variables for robustness testing. The specific calculation formula is as follows:
Here, represents the main operating cost of company i; is the total main operating cost of the sector; is the total energy consumption of the industry; and 2.493 is the conversion factor for carbon dioxide emissions per unit of energy consumption.
The purpose of this analysis was to validate the robustness of the original model by using an alternative method of estimating carbon emissions. By replacing the dependent variables, we aimed to determine whether the significant impact of industrial intelligence on carbon reduction remained consistent. The regression results, presented in Table 4, show that the impact coefficients of industrial intelligence on both carbon intensity and carbon emission volume were −0.001, and both were significant at the 1% level. These findings are highly consistent with the results of the original model analysis, further solidifying the conclusion that industrial intelligence significantly promotes carbon reduction in manufacturing enterprises. This consistency not only verifies the robustness of the model, but also emphasizes the critical role of industrial intelligence in the carbon reduction strategies of manufacturing enterprises.
Table 4.
Robustness test II.
4.2.3. Lag Effect Test
Introducing and applying industrial intelligence technology requires a certain amount of time for preparation, deployment, and adjustment. After implementing industrial intelligence, enterprises may need to adapt to new work processes, train their employees, and adjust their resource allocation. This adjustment period may lead to the fact that the impact of industrial intelligence will not be immediately reflected in carbon emissions, but will have a certain lag. The purpose of this analysis was to examine the delayed impact of industrial intelligence on carbon emissions by using lagged explanatory variables. By replacing the explanatory variables with their values lagged by one period, we aimed to capture the delayed effects of industrial intelligence. The regression results, presented in Table 5, show that the coefficient of the impact of industrial intelligence lagged one period on carbon intensity was −0.003, which passed the 1% significance test. The impact coefficient of industrial intelligence lagged one period on carbon emission was −0.001, which also passed the 1% significance test. These results demonstrate that the application of industrial intelligence reduces the carbon emissions of manufacturing companies, even with a lag.
Table 5.
Robustness test III.
4.3. Heterogeneity Test
4.3.1. Industry Classification
When studying the heterogeneous impact of industrial intelligence on enterprise carbon emissions, the industry to which an enterprise belongs is first categorized into three groups of heavy-carbon emissions, medium-carbon emissions, and light-carbon emissions based on the carbon emissions data. This categorization was to more deeply study the difference in the impact of industrial intelligence under different carbon emission levels. We sought to examine how industrial intelligence affected carbon emissions across industries with varying levels of carbon emissions. By categorizing the industries into heavy-, medium-, and light-carbon emitters, we endeavored to understand the differential impact of industrial intelligence.
According to Table 6, The estimation results showed that industrial intelligence had a significant carbon reduction effect on heavy-carbon emitting industries and medium-carbon emitting industries while it had a carbon increase for light-carbon emitting industries. Compared with heavy- and medium-carbon emitting industries, light-carbon emitting industries usually focus on the production of light products with relatively low impact on the environment such as arts and education, industrial and esthetic, sports and recreational goods manufacturing, printing and recording media reproduction industry, and furniture manufacturing. The products produced by these firms usually do not involve heavy industrial manufacturing or large-scale production processes and therefore generate fewer carbon emissions during the production process. While industrial intelligence can increase productivity and thus reduce energy consumption, the production process itself is already relatively environmentally friendly for light-carbon emitting industries. Therefore, the introduction of robots may not have a significant reduction effect on carbon emissions, and even the yield effect may lead to a slight increase in carbon emissions. This may be the case because the application of robots may lead to more automated production, which increases the demand for energy and raises their carbon emissions. Thus, the increase in productivity is offset to some extent.
Table 6.
Heterogeneity test I.
4.3.2. Regional Categorization
When conducting the heterogeneity test, categorizing regions into different areas such as the Beijing-Tianjin-Hebei region, Pearl River Delta, and Jiangsu-Zhejiang-Shanghai region can help us further explore whether there are regional differences in the impact on carbon emissions.
First, these regions have significant differences in economic development, industrial structure, and environmental management. The Beijing-Tianjin-Hebei region, as one of China’s political, economic, and cultural centers, has well-developed manufacturing industries and infrastructures, but also faces serious environmental challenges. The Pearl River Delta (PRD) region, as China’s manufacturing center, has well-developed manufacturing clusters and advanced scientific and technological innovation capabilities. The Jiangsu-Zhejiang-Shanghai region, on the other hand, is known for its developed economic strength and innovation capabilities.
Based on the above differences, it is reasonable to speculate that there may be differences in the characteristics and carbon emission performance of enterprises in different regions in terms of industrial intelligence applications. To further investigate this, we analyzed the impact of industrial intelligence on carbon emissions by categorizing regions into the PRD, Jiangsu-Zhejiang-Shanghai region, and Beijing-Tianjin-Hebei region. According to Table 7, the regression was performed by categorizing enterprises by region into the PRD, Jiangsu, Jiangsu-Zhejiang-Shanghai region, and Beijing-Tianjin-Hebei region, respectively. The estimation results showed that the industrial intelligence of enterprises in the PRD and Jiangsu-Zhejiang-Shanghai region significantly reduced the carbon intensity and carbon emissions. The coefficients of the impact of industrial intelligence on the carbon intensity and carbon emissions of Beijing-Tianjin-Hebei enterprises did not pass the significance test.
Table 7.
Heterogeneity test II.
The possible reason for the difference between the PRD and Jiangsu-Zhejiang-Shanghai region and Beijing-Tianjin-Hebei is that the Jiangsu-Zhejiang-Shanghai region and the PRD regions mainly focused on low-carbon intensity areas such as high-tech and advanced manufacturing in China’s industrial structure. These regions implemented industrial upgrading and transformation earlier and widely adopted energy-saving and environmentally friendly technologies. These regions are leading the way in R&D, the application and industrial deployment of industrial smart technologies, and are placing greater emphasis on environmental protection and carbon reduction. Governments and enterprises in these regions have invested significant resources in the R&D and application of environmental protection technologies. This tendency to invest in emission reduction significantly enhances the impact of industrial smart technologies in reducing carbon intensity. As a result, when smart technologies are introduced, these regions are more effective in reducing carbon emissions. In contrast, the industrial structure of the Beijing-Tianjin-Hebei region includes more traditional industries. In this region, the secondary industry occupies 50% to 60% of the economy, which indicates that regional economic growth is mainly dependent on the secondary industry [46,47]. This means that in the Beijing-Tianjin-Hebei region, the impact of industrial intelligent technology on carbon emission reduction is relatively small due to the complexity of technology application, industrial inertia, the difficulty of transformation, and differences in technology and management levels.
5. Mechanism Test
According to the established studies and the hypothesis of this study, the impact of industrial intelligence on corporate carbon emissions is mainly reflected in two effects: the efficiency optimization effect and output increase effect. Among them, the efficiency optimization effect is measured by the total factor productivity (TFP), while the output increase effect is measured by enterprise sales (Sales). The purpose of this analysis was to verify the impact mechanisms of industrial intelligence on carbon emissions by distinguishing between these two effects and understanding their respective contributions. By using TFP to measure the efficiency optimization and Sales to measure the output increase, we aimed to capture the dual impact of industrial intelligence on carbon emissions. The results of the regression analysis in Table 8, Table 9 and Table 10 show that the coefficient of industrial intelligence on the total factor productivity was 0.001, which passed the 10% significance test, indicating that industrial intelligence promotes efficiency optimization by increasing the production efficiency. Meanwhile, the impact coefficient of industrial intelligence on sales volume was 0.001, which passed the 5% significance test, indicating that it contributes to the output increase equally significantly.
Table 8.
Testing for differences in coefficients between groups.
Table 9.
Mechanism test I.
Table 10.
Mechanism test II.
In order to verify the efficiency optimization effect and the output increase effect, this study divided the data into two subgroups based on the growth rates of the total factor productivity and sales volume, respectively: the high-growth group and the low-growth group. In order to test the difference in coefficients between groups after subgroup regression, the test based on the seemingly unrelated regression (SUR) model proposed by [48] was used. To apply this method, the data were centered to remove the individual effects. Subsequently, OLS estimation was performed on the processed data, and the test for differences in coefficients between groups was performed accordingly. This process allowed us to effectively compare the differences in the impact of industrial intelligence on the firms’ carbon intensity and emissions across growth groups.
Table 8 demonstrates the results of the test of the difference in coefficients between the group coefficients for dividing the impact of industrial intelligence on carbon performance (CEI) and carbon emissions (CE) into high- and low-growth groups based on the growth rate of the total factor productivity (TFP) and growth rate of sales (Sales). In both dimensions, the impact of industrial intelligence on the carbon intensity and carbon emissions was significantly different between the high- and low-growth groups, whether grouped based on the total factor productivity (TFP) or sales (Sales). This result suggests that the emissions reduction effects of industrial intelligence are comparable across growth scenarios. Specifically, for the total factor productivity based grouping, the effect of industrial intelligence on the carbon performance (Chi2 value of 10.36, p-value of 0.0013) and carbon emissions (Chi2 value of 6.12, p-value of 0.0134) were significantly different between the high- and low-growth groups. Similarly, in the grouping based on the sales growth rate, the impact of industrial intelligence on the carbon performance (Chi2 value of 8.06, p-value of 0.0045) and carbon emissions (Chi2 value of 13.02, p-value of 0.0003) showed significant differences across the growth groups.
In the subgroups based on the growth rate of the total factor productivity (TFP), the results of the coefficient difference test between groups in Table 8 and the regression results in Table 9 show that in the high TFP growth part, the coefficient of the impact of industrial intelligence on carbon intensity was −0.006, and the coefficient of the impact on carbon emissions was −0.002, which both passed the 1% significance test. In the low TFP growth part, the coefficient of the impact of industrial intelligence on carbon intensity was −0.003, and the coefficient of the impact on carbon emissions was −0.001, both of which also passed the 1% significance test. The test for differences in coefficients between groups showed that the impact of industrial intelligence on carbon intensity and carbon emissions was significantly different between the high-growth and low-growth groups, passing the 1% and 5% significance tests, respectively. It is noteworthy that industrial intelligence significantly reduced the carbon intensity and carbon emissions of firms in both the high- and low-growth total factor productivity groups. In particular, industrial intelligence was more effective in reducing the carbon intensity and carbon emissions in the high-growth group, which further verifies that industrial intelligence effectively reduces the carbon footprint of enterprises by improving the production efficiency.
In the grouping based on the sales growth rate, according to the results of the coefficient difference test between groups in Table 8 and the regression results in Table 10, it was found that in the high sales growth part, the impact coefficient of industrial intelligence on carbon emissions was −0.001, which passed the significance test of 5%. In the low sales growth part, the impact coefficient was −0.002, which also passed the 1% significance test. The test for the difference in coefficients between groups showed that the effect of industrial intelligence on carbon intensity and carbon emissions was also significantly different between the high-growth and low-growth groups, passing the 1% significance test. The carbon abatement effect was slightly stronger in the low-growth part of the sales volume than in the high-growth part, suggesting that the increase in production leads to more productive activities, which in turn leads to higher energy consumption and carbon emissions. However, even in this case, industrial intelligence still drives down the total carbon emissions. This suggests that productivity improvements play a more dominant role in the carbon reduction effect, a result that highlights the central role of efficiency optimization in achieving a balance between industrial growth and environmental sustainability, which is more far-reaching than the output increase effect.
The impact of industrial intelligence on carbon intensity showed a more pronounced reduction in carbon intensity in the higher growth segments under both efficiency optimization and the output increase effects. This suggests that although an increase in output may lead to a rise in the total carbon emissions, this does not directly lead to a rise in carbon intensity per unit of output. The impact of industrial intelligence in terms of increased productivity is sufficient to offset, or at least partially offset, the increase in carbon emissions from increased production, resulting in a decrease rather than an increase in carbon intensity per unit of output.
In summary, although the increase in output may lead to an increase in the total carbon emissions, the optimization effect of production efficiency brought about by industrial intelligence has a more far-reaching impact and is able to effectively reduce carbon intensity and carbon emissions per unit of output. Therefore, it can be concluded that industrial intelligence has a significant impact on reducing the carbon intensity and carbon emissions of firms, in general, by improving the production efficiency and optimizing production processes. This finding underscores the important role of industrial intelligence in promoting environmental sustainability while also providing practical guidance on how firms can increase their output while reducing their carbon footprint.
6. Conclusions and Implications
6.1. Conclusions
As a strategic technology leading a new round of technological change and industrial transformation, industrial intelligence is injecting new vitality into the pursuit of sustainable development and the goal of “achieving emission peak and carbon neutrality”. Its importance in the field of carbon emission reduction is gradually becoming more and more prominent. However, despite the fact that the widespread application of industrial intelligence has brought new paths to the economic model and provided a strong impetus to the carbon emission reduction goal, there is a relative scarcity of research and technology on its environmental impacts, especially in terms of carbon emissions. To address this situation, this study focused on the micro-enterprise level and utilized a fixed-effects panel regression model that integrated multiple factors such as enterprise, industry, and time, aiming to deeply explore the relationship between industrial intelligence and carbon emission intensity.
The main findings of the study are as follows. First, the application of industrial intelligence significantly reduced the carbon intensity and carbon emissions of enterprises and improved their carbon performance. This conclusion was further consolidated after being verified by several robustness tests. This conclusion is consistent with the results of previous studies by [9,32]. Second, the study further conducted mechanism tests to reveal two key mechanisms of the impact of industrial intelligence on corporate carbon emission reduction: the productivity improvement effect and the output increase effect.
Through in-depth analysis, the study found that industrial intelligence significantly increased the total factor productivity of enterprises, which not only enhanced productivity, but also effectively reduced their carbon emissions and carbon intensity per unit of output. This finding highlights the important role of intelligent technologies in optimizing resource utilization and improving energy efficiency. On the other hand, although industrial intelligence did increase the firms’ carbon emissions by leading to an increase in the firms’ output, it did not significantly increase the carbon intensity per unit of output, suggesting that although an increase in the scale of production may be accompanied by higher energy consumption and overall carbon emissions, the impacts of industrial intelligence in terms of improved productivity are sufficient to offset or minimize the potential negative impacts on the carbon intensity per unit of output. The carbon abatement effect of productivity improvements is more dominant than the carbon increase effect of the output effect. Third, through further heterogeneity tests, we found that industrial intelligence significantly contributes to corporate carbon emission reduction among firms in heavy- and medium-carbon emitting industries; however, in light-carbon emitting industries, industrial intelligence has a carbon increasing phenomenon. Regional differences are also beginning to emerge, with industrial intelligence applications in the Jiangsu-Zhejiang-Shanghai region and the Pearl River Delta having a better effect on carbon emission reduction than in the Beijing-Tianjin-Hebei region.
6.2. Implications
In summary, this study provides a detailed examination of the relationship between industrial intelligence and carbon emission reduction at the micro-level. By employing a fixed-effects panel regression model that integrates multiple factors such as enterprise, industry, and time, this research offers robust evidence for understanding the mechanisms through which industrial intelligence affects carbon emission reduction. The findings highlight that industrial intelligence significantly enhances the corporate carbon performance by reducing both the carbon intensity and total carbon emissions. This is achieved through productivity improvements and efficient resource utilization, validating the critical role of advanced technologies in environmental sustainability. The results of this study also provide valuable insights for policymakers, suggesting that targeted policies can effectively harness the potential of industrial intelligence to achieve the dual goals of economic development and environmental sustainability. The empirical evidence underscores the necessity of encouraging the development and application of industrial intelligence across various types of enterprises and regions to better meet the environmental goals of “carbon peak” and “carbon neutrality”.
Based on the empirical results of this study, we proposed several policy recommendations to maximize the potential of industrial intelligence in reducing carbon emissions in China. Given the significant potential of industrial intelligence in reducing carbon emissions, China should focus on expanding the application of big data and industrial intelligence technologies across various stages of the production process including product design, manufacturing, and supply chain management. By doing so, the production processes can be optimized, resource use efficiency can be improved, and the green development process can be accelerated. This approach not only addresses environmental concerns, but also enhances the competitiveness and sustainability of Chinese manufacturing firms. Recognizing that different industries have varying responses and needs regarding industrial intelligence, it is essential for the government to develop and implement industry-specific policies. These policies should provide financial support, tax incentives, and intellectual property protection, particularly for high-carbon emission industries. Such measures will promote technological innovation and the application of industrial intelligence technologies in reducing carbon emissions within these sectors. By tailoring policies to the specific needs of each industry, the government can ensure the more effective and efficient adoption of industrial intelligence.
The effectiveness of industrial intelligence applications varies across regions, with some regions exhibiting more significant impacts on carbon emission reduction than others. For instance, the Jiangsu-Zhejiang-Shanghai region and the Pearl River Delta have demonstrated better results compared to the Beijing-Tianjin-Hebei region. To address these disparities, the government should provide a more favorable investment environment and formulate attractive policies to encourage the adoption of industrial intelligence technologies in less advanced regions. Additionally, establishing innovation platforms and fostering regional cooperation can help promote the widespread application of industrial intelligence technologies in carbon emission reduction. To further enhance the impact of industrial intelligence on carbon emission reduction, the government should promote cross-field cooperation between industrial intelligence enterprises, environmental protection departments, and research institutions. Such collaborations can lead to the exploration of innovative applications of industrial intelligence in the environmental field, thereby improving the scientific research and technological capabilities related to carbon emission reduction and environmental protection. By fostering partnerships and joint ventures, the government can facilitate the development of cutting-edge solutions that address both economic and environmental challenges.
These policy recommendations aim to create a supportive ecosystem for the adoption and implementation of industrial intelligence technologies, ensuring that China can achieve its ambitious carbon reduction targets while maintaining economic growth and competitiveness. By integrating advanced technologies into the manufacturing processes and aligning policies with industry-specific and regional needs, China can pave the way for a sustainable and prosperous future. Through these comprehensive policy measures, China can effectively leverage the potential of industrial intelligence to drive both economic and environmental benefits. This study’s findings not only contribute to the academic discourse on industrial intelligence and carbon emissions, but also provide actionable insights for policymakers and industry leaders seeking to enhance their sustainability performance.
While this study has made significant strides in understanding the impact of industrial intelligence on carbon emissions, it is not without its limitations. First, due to the relatively nascent and incomplete ESG carbon disclosure regulations in China, obtaining precise corporate carbon emission data remains challenging. To address this, the study estimated firm-level carbon emissions using industry-level data, which may have introduced some estimation errors and affected the accuracy of the results. Second, the focus of this research was confined to listed manufacturing companies in China, which limits the external validity and generalizability of the findings. Consequently, the conclusions drawn may not be fully applicable to other countries or industries.
Future research can build upon this study in several ways. With the progressive standardization and improvement of ESG disclosure practices, future studies can leverage more detailed and accurate corporate disclosure data, thereby enhancing the precision and reliability of the results. Additionally, extending the research to the supply chain level could provide insights into the synergistic effects of industrial intelligence across upstream and downstream firms, offering a comprehensive assessment of its impact on the entire value chain. Finally, cross-industry comparative studies are crucial; by analyzing the application and effectiveness of industrial intelligence in various industries, future research can identify best practices and facilitate more efficient carbon reduction strategies across different sectors.
Author Contributions
Conceptualization, T.M. and T.L.; Methodology, T.M.; Software, T.M.; Validation, T.M. and T.L.; Formal analysis, T.M.; Investigation, T.M.; Data curation, T.M.; Writing—original draft preparation, T.M.; Writing—review and editing, T.M.; Funding acquisition, T.L. All authors have read and agreed to the published version of the manuscript.
Funding
This research received no external funding.
Institutional Review Board Statement
Not applicable.
Informed Consent Statement
Not applicable.
Data Availability Statement
The data presented in this study are available on request from the corresponding author.
Conflicts of Interest
The authors declare no conflict of interest.
References
- Pavel, C.C.; Lacal-Arántegui, R.; Marmier, A.; Schüler, D.; Tzimas, E.; Buchert, M.; Jenseit, W.; Blagoeva, D. Substitution strategies for reducing the use of rare earths in wind turbines. Resour. Policy 2017, 52, 349357. [Google Scholar] [CrossRef]
- Chien, F.; Chau, K.Y.; Sadiq, M. The effect of energy transition technologies on greenhouse gas emissions: New evidence from ASEAN countries. Sustain. Energy Technol. Assess. 2023, 58, 103354. [Google Scholar] [CrossRef]
- Oliveira, J.A.D.; Ganga, G.M.D.; Filho, M.G.; Silva, D.A.L.; dos Santos, M.P.; Garde, I.A.A.; Penchel, R.A.; Esposto, K.F.; Ometto, A.R. Environmental and operational performance is not always achieved when combined with cleaner production and lean production: An overview for emerging economies. J. Environ. Plan. Manag. 2022, 65, 1530–1559. [Google Scholar] [CrossRef]
- Shi, L.; Liu, J.; Wang, Y.; Chiu, A. Cleaner production progress in developing and transition countries. J. Clean. Prod. 2021, 278, 123763. [Google Scholar] [CrossRef]
- Sikander, M.; Kumar, L.; Naqvi, S.A.; Arshad, M.; Jabeen, S. Sustainable practices for reduction of environmental footprint in tanneries of Pakistan. Case Stud. Chem. Environ. Eng. 2021, 4, 100161. [Google Scholar] [CrossRef]
- Kumar, L.; Naqvi, S.A.; Deitch, M.J.; Khalid, M.J.; Naeem, K.; Amjad, A.Q.; Kumar, A.; Gebremicael, T.G.; Arshad, M. Opportunities and constraints for cleaner production policy in the developing world: A case study of Sindh Region, Pakistan. Environ. Dev. Sustain. 2024, 26, 4391–4434. [Google Scholar] [CrossRef]
- Jung, J.H.; Lim, D.G. Industrial robots, employment growth, and labor cost: A simultaneous equation analysis. Technol. Forecast. Soc. Chang. 2020, 159, 120202. [Google Scholar] [CrossRef]
- Cheng, H.; Jia, R.; Li, D.; Li, H. The rise of robots in China. J. Econ. Perspect. 2019, 33, 71–88. [Google Scholar] [CrossRef]
- Liu, J.; Liu, L.; Qian, Y.; Song, S. The effect of artificial intelligence on carbon intensity: Evidence from China’s industrial sector. Socio-Econ. Plan. Sci. 2022, 83, 101002. [Google Scholar] [CrossRef]
- Luan, F.; Yang, X.; Chen, Y.; Regis, P.J. Industrial robots and air environment: A moderated mediation model of population density and energy consumption. Sustain. Prod. Consum. 2022, 30, 870–888. [Google Scholar] [CrossRef]
- Udara Willhelm Abeydeera, L.H.; Wadu Mesthrige, J.; Samarasinghalage, T.I. Global research on carbon emissions: A scientometric review. Sustainability 2019, 11, 3972. [Google Scholar] [CrossRef]
- Du, L.; Wei, C.; Cai, S. Economic development and carbon dioxide emissions in China: Provincial panel data analysis. China Econ. Rev. 2012, 23, 371–384. [Google Scholar] [CrossRef]
- Mardani, A.; Streimikiene, D.; Cavallaro, F.; Loganathan, N.; Khoshnoudi, M. Carbon dioxide (CO2) emissions and economic growth: A systematic review of two decades of research from 1995 to 2017. Sci. Total Environ. 2019, 649, 31–49. [Google Scholar] [CrossRef] [PubMed]
- Dong, K.; Hochman, G.; Zhang, Y.; Sun, R.; Li, H.; Liao, H. CO2 emissions, economic and population growth, and renewable energy: Empirical evidence across regions. Energy Econ. 2018, 75, 180–192. [Google Scholar] [CrossRef]
- Dechezleprêtre, A.; Nachtigall, D.; Venmans, F. The joint impact of the European Union emissions trading system on carbon emissions and economic performance. In OECD Economics Department Working Papers; No. 1515; OECD Publishing: Paris, France, 2018. [Google Scholar] [CrossRef]
- Gao, Y.; Li, M.; Xue, J.; Liu, Y. Evaluation of effectiveness of China’s carbon emissions trading scheme in carbon mitigation. Energy Econ. 2020, 90, 104872. [Google Scholar] [CrossRef]
- Chen, X.; Chen, Y.E.; Chang, C.P. The effects of environmental regulation and industrial structure on carbon dioxide emission: A non-linear investigation. Environ. Sci. Pollut. Res. 2019, 26, 30252–30267. [Google Scholar] [CrossRef] [PubMed]
- Gillingham, K.; Stock, J.H. The cost of reducing greenhouse gas emissions. J. Econ. Perspect. 2018, 32, 53–72. [Google Scholar] [CrossRef]
- Andersson, J.J. Carbon taxes and CO2 emissions: Sweden as a case study. Am. Econ. J. Econ. Policy 2019, 11, 1–30. [Google Scholar] [CrossRef]
- Li, M.; Wang, Q. Will technology advances alleviate climate change? Dual effects of technology change on aggregate carbon dioxide emissions. Energy Sustain. Dev. 2017, 41, 61–68. [Google Scholar] [CrossRef]
- Hu, K.; Raghutla, C.; Chittedi, K.R.; Zhang, R.; Koondhar, M.A. The effect of energy resources on economic growth and carbon emissions: A way forward to carbon neutrality in an emerging economy. J. Environ. Manag. 2021, 298, 113448. [Google Scholar] [CrossRef]
- Shum, W.Y.; Ma, N.; Lin, X.; Han, T. The major driving factors of carbon emissions in China and their relative importance: An application of the LASSO model. Front. Energy Res. 2021, 9, 726127. [Google Scholar] [CrossRef]
- Ma, Q.; Murshed, M.; Khan, Z. The nexuses between energy investments, technological innovations, emission taxes, and carbon emissions in China. Energy Policy 2021, 155, 112345. [Google Scholar] [CrossRef]
- Balsalobre-Lorente, D.; Shahbaz, M.; Roubaud, D.; Farhani, S. How economic growth, renewable electricity and natural resources contribute to CO2 emissions? Energy Policy 2018, 113, 356–367. [Google Scholar] [CrossRef]
- Chen, Y.; Lee, C.C. Does technological innovation reduce CO2 emissions? Cross-country evidence. J. Clean. Prod. 2020, 263, 121550. [Google Scholar] [CrossRef]
- Graetz, G.; Michaels, G. Robots at work. Rev. Econ. Stat. 2018, 100, 753–768. [Google Scholar] [CrossRef]
- Acemoglu, D.; Restrepo, P. Robots and jobs: Evidence from US labor markets. J. Political Econ. 2020, 128, 2188–2244. [Google Scholar] [CrossRef]
- Sun, Z.; Hou, Y. How Industrial Intelligence Reshapes the Labor Employment Structure. China Ind. Econ. 2019, 5, 61–79. [Google Scholar]
- Cockburn, I.M.; Henderson, R.; Stern, S. The Impact of Artificial Intelligence on Innovation; NBER Working Papers 24449; National Bureau of Economic Research: Cambridge, MA, USA, 2018. [Google Scholar]
- Gries, T.; Naudé, W. Artificial Intelligence, Income Distribution and Economic Growth. 2020. Available online: https://www.iza.org/publications/dp/13606/artificial-intelligence-income-distribution-and-economic-growth (accessed on 7 July 2024).
- Wang, L.; Sarker, P.; Alam, K.; Sumon, S. Artificial intelligence and economic growth: A theoretical framework. Sci. Ann. Econ. Bus. 2021, 68, 421–443. [Google Scholar] [CrossRef]
- Chen, P. Relationship between the digital economy, resource allocation and corporate carbon emission intensity: New evidence from listed Chinese companies. Environ. Res. Commun. 2022, 4, 075005. [Google Scholar] [CrossRef]
- Shen, M.; Li, K.; Qu, R. Technological Progress, Economic Growth, and Carbon Dioxide Emissions: Theoretical and Empirical Research. J. World Econ. 2012, 7, 83–100. [Google Scholar]
- Xue, F.; Liu, J.; Fu, Y. The Impact of Artificial Intelligence Technology on Carbon Emissions. Sci. Technol. Prog. Policy 2022, 39, 1–9. [Google Scholar]
- Chen, Y.; Lin, C.; Chen, X. Artificial Intelligence, Aging, and Economic Growth. China Econ. Rev. 2019, 54, 47–63. [Google Scholar]
- Li, Y.; Zhang, Y.; Pan, A.; Han, M.; Veglianti, E. Carbon emission reduction effects of industrial robot applications: Heterogeneity characteristics and influencing mechanisms. Technol. Soc. 2022, 70, 102034. [Google Scholar] [CrossRef]
- Chen, S.; Chen, D. Haze Pollution, Government Governance, and High-Quality Economic Development. Econ. Res. J. 2018, 53, 20–34. [Google Scholar]
- Autor, D.H. Why are there still so many jobs? The history and future of workplace automation. J. Econ. Perspect. 2015, 29, 3–30. [Google Scholar] [CrossRef]
- Li, L.; Xu, D. Can Robots Enhance Corporate Labor Productivity?—Mechanisms and Facts. J. Ind. Econ. 2020, 3, 127–142. [Google Scholar]
- Shan, Y.; Guan, D.; Zheng, H.; Ou, J.; Li, Y.; Meng, J.; Mi, Z.; Liu, Z.; Zhang, Q. China CO2 emission accounts 1997–2015. Sci. Data 2018, 5, 170201. [Google Scholar] [CrossRef] [PubMed]
- Shan, Y.; Huang, Q.; Guan, D.; Hubacek, K. China CO2 emission accounts 2016–2017. Sci. Data 2020, 7, 54. [Google Scholar] [CrossRef]
- Ren, X.; Li, Y.; Shahbaz, M.; Dong, K.; Lu, Z. Climate risk and corporate environmental performance: Empirical evidence from China. Sustain. Prod. Consum. 2022, 30, 467–477. [Google Scholar] [CrossRef]
- Wang, Y.; Dong, W. How Does the Rise of Robots Affect the Chinese Labor Market?—Evidence from Manufacturing Listed Companies. Econ. Res. J. 2020, 10, 159–175. [Google Scholar]
- Chen, P.; Gao, J.; Ji, Z.; Liang, H.; Peng, Y. Do artificial intelligence applications affect carbon emission performance?—Evidence from panel data analysis of Chinese cities. Energies 2022, 15, 5730. [Google Scholar] [CrossRef]
- Shang, Y.; Raza, S.A.; Huo, Z.; Shahzad, U.; Zhao, X. Does enterprise digital transformation contribute to the carbon emission reduction? Micro-level evidence from China. Int. Rev. Econ. Financ. 2023, 86, 1–13. [Google Scholar] [CrossRef]
- Wang, Z.; Yang, L. Delinking indicators on regional industry development and carbon emissions: Beijing–Tianjin–Hebei economic band case. Ecol. Indic. 2015, 48, 41–48. [Google Scholar] [CrossRef]
- Zhou, J.; Jin, B.; Du, S.; Zhang, P. Scenario analysis of carbon emissions of Beijing-Tianjin-Hebei. Energies 2018, 11, 1489. [Google Scholar] [CrossRef]
- Lian, Y.; Liao, J. How to Test the Differences in Coefficients Between Groups After Grouped Regression? J. Zhengzhou Univ. Aeronaut. Manag. 2017, 35, 97–109. [Google Scholar]
Disclaimer/Publisher’s Note: The statements, opinions and data contained in all publications are solely those of the individual author(s) and contributor(s) and not of MDPI and/or the editor(s). MDPI and/or the editor(s) disclaim responsibility for any injury to people or property resulting from any ideas, methods, instructions or products referred to in the content. |
© 2024 by the authors. Licensee MDPI, Basel, Switzerland. This article is an open access article distributed under the terms and conditions of the Creative Commons Attribution (CC BY) license (https://creativecommons.org/licenses/by/4.0/).