Abstract
This paper argues that operations management needs a commonly understood materiality principle to truly contribute to sustainability. A framework initially developed in international finance is generalized and used to model firms as borrowing resources from a common creditor, the environment, and to establish when a sustainable initiative is material in terms of impact. Our framework also solves the long-standing challenge of measuring impact at the level of an operations unit of analysis.
1. Introduction
Despite the fact that sustainability has become a visible and legitimate concern when assessing the performance of organizations, the practical value of sustainability initiatives often remains controversial. Critics describe corporate sustainability reporting as “fairytales” [1] or “organizational facades” [2]. Pagell and Shevchenko [3] argue that sustainable actions have been limited to harm reduction (e.g., reducing CO2 emissions) and that almost no firms have a track record in harm elimination (e.g., stopping CO2 emissions altogether). Shevchenko et al. [4] further argue that rational business decision-makers have an incentive to offset unsustainable practices and to postpone investments in sustainability since stakeholders do not put adequate pressure on firms to adopt a true sustainability agenda.
At the heart of this argument is a theoretical void about when an investment in sustainability actions becomes material in terms of its impact. Materiality is an established concept in financial accounting and auditing [5]. The materiality principle states that an accounting rule can be ignored if the impact on the financial statements will not mislead investors. Materiality is only an implicit concept in operations management through the use of tools like Pareto diagrams. In the wider area of sustainability, it is not unusual to see materiality being mentioned. Sustainability standards such as the global reporting initiative (GRI) require firms to make a materiality statement. However, they depart from traditional practice in that they rule out the notion of a materiality threshold. Instead, they recommend the reporting of issues based on a diagnostic matrix framework, combining impact and perceived importance by stakeholders. Therefore, in the absence of thresholds, a firm could justify not reporting on a substantive negative impact if stakeholder pressure is low [4]. Similarly, a firm may choose to report its efforts to improve its sustainability on a non-substantive issue that matters very much to stakeholders. Some frameworks, such as planetary boundaries, have proposed thresholds, but the definition of these thresholds has attracted criticism [6]. In this context, it is not surprising that similar firms end up investing in sustainability in very different fashions [6].
The discussion of materiality in the context of sustainability has been confined to sustainability accounting literature. Fiandrino et al. [7] date the emergence of this strand of literature to 2010 and conclude their literature review by stressing stakeholder theory as the emerging framework for defining materiality, very much in line with the GRI approach. Baumuller and Sopp [8] highlight the increasing focus on defining materiality for non-financial measures. They especially focus on how the evolution of materiality thinking in European sustainability reporting regulations has evolved. The key concept of “double materiality” was introduced in 2019 by the European Union. The first materiality has to do with company value, i.e., the traditional accounting materiality. The second materiality captures the environmental and social impact on stakeholders. Double materiality researchers also focus on the relationship between these two forms of materiality.
The research question in this paper is: do we need a sustainability materiality principle in operations management? And if yes, how could we define and implement it?
More generally framed, the research question of this research paper revisits the problem of defining the unit of analysis in sustainable operations management research [9]. It is often stated that sustainability cannot be assessed at the firm-level and that assessments should focus on entire supply chains, while it is also claimed that sustainable operations can only be assessed at the level of industrial ecosystems and/or nation-states. Nonetheless, some sustainable practices can arguably be implemented in specific areas of operations such as industrial buildings and facilities, firm-level supply chains, production processes, design, and product development [10]. This micro-level action vs. macro-level impact relationship reinforces the materiality problem. Some argue that all individuals and businesses should switch off devices that are normally left on standby, offset their commuting and traveling emissions, and encourage fair trade. But conversely, others argue that these actions are immaterial as the unit of analysis is too small to have a planetary-level impact, and that the focus should be, respectively, on low-cost green electricity generation, improved public transportation systems and technologies, and the elimination of economic development gaps. Only a materiality principle can help individuals and businesses take a position between these two extreme viewpoints. In the review of the literature in the following section, we show how the concept of materiality can be linked to the notion of waste in operations management.
1.1. Literature Review: Sustainable Operations Management
As a sub-discipline of operations management, sustainable operations management’s origin can be linked to the 2005 article of Kleindorfer et al. [11]. Sustainable operations management is described along three pillars: (1) green product and process development, (2) lean and green operations management, and (3) remanufacturing and closed-loop supply chains. It is impossible to review all the papers that have been published in sustainable operations management since then, as there are so many (see [12,13,14,15,16,17] for reviews). Pagell and Shevchenko [3] take one step further than simply acknowledging the vibrancy of the field and argue that research in the sustainable supply chain management has no future. What they mean is that all supply chain research should be sustainable supply chain research.
Although this is a commendable and socially responsible viewpoint, it creates a situation where it can be difficult to draw the line between sustainable operations management and environmental science. This is especially true for the first pillar, green product and process development. This is because there is a natural fit between product and process design and the concept of life cycle assessment (LCA). Thus, a lot of sustainable operations research has adopted measurement methods from the sustainability impact assessment literature, for example, the ecological footprint calculator of the center for sustainable economy (myfootprint.org) or the ISO14040 LCA standard [18]. As most sustainable operations papers tend to discuss impact reduction irrespectively of the scale of that reduction, critical perspectives have emerged [3,4,19,20,21]. In the rest of this review, we focus on producing a synthesis of these critical perspectives.
Poor allocation of priorities: The absence of benchmarks or thresholds means that typically an operations manager has to rely on intuition and gut feeling to decide if a sustainability initiative truly does good. This is why the accounting literature on sustainability reporting mentioned in the introduction is critical. In the absence of clear standards and benchmarks, all sustainability claims become subjective.
For example, Sterner’s [22] study of Swedish green procurement practices by public and private building clients reveals that the separation of waste and material use is viewed as an important and a key contractor selection criterion. Operation requirements are viewed as less important and are often overlooked when procuring a building. Sterner highlights that this is an issue as energy use is recognized by the Swedish Ecocycle Council as being much more impactful and important than material use and waste. Sterner’s survey results [22] illustrate perfectly the sustainability postponement effect created by stakeholder’s views as described by Shevchenko et al. [4], i.e., it is easier to demonstrate engagement with an easily implementable initiative (sorting construction waste) to avoid the more risky and complex matter of sourcing buildings that generate lifetime energy savings.
The fact that there is no consensus on what is sustainable or not is caused by two distinct issues with (i) the objective function and (ii) measurement. We discuss the latter in the next section and focus on the ambiguity of the objective here. Pagell and Wu [20] introduce a distinction between sustainability and “true sustainability” to distinguish minor operations improvement that results in greener performance by opposition to tackling the problem head-on. This concept of true sustainability is expanded by Pagell and Shevchenko [3] when they express a concern with the “primacy of profits”, which results in a limited stakeholder view. Historically, operations management as a discipline has always operated within the paradigm of maximizing profits. According to many authors, for sustainable operations management to make a genuine difference, we need a paradigm shift [3,21]. Montabon et al. [19] describe this as a shift from an economic logic to an ecologically dominant logic. Although this is a commendable and socially responsible position, we argue that these contributions are not operations management research. It is not the role of operations management as an academic discipline to teach financial markets, consumers, and society at large how to conduct itself. To remain rooted at the level of operations systems, we need to better specify the pathway between these systems (a micro level of analysis) and the issues that they induce at a macro level (the planetary natural environment).
Uncertain impact assessments: We now turn our focus on the issue of impact measurement, universally depicted as a key issue in sustainable operations management [3,16]. Even though LCA is often described as the best practice, it has many limitations that have been known in environmental science for a long time [23]. Aside from purely operational measurement issues, it is also important to recognize that there are also debates within environmental science about the very definition of sustainability. This debate is relevant to this paper in terms of defining benchmarks and thresholds at a micro, operations system level of analysis.
Levy et al. ([24], p.79) state that “ecology as a science is in a developmental stage, similar to physics before Newton; there is little consensus about which ecosystem characteristics are important”. According to Levy et al., the impact of human activities should be viewed as a set of uncertain variables as there is no consensus on how we perceive natural systems. They illustrate this by presenting four mutually different perceptions. The four perceptions are based (1) on the belief that nature is characterized by a single equilibrium or can adapt to circumstances in different natural equilibria and (2) on whether or not value systems are anthropocentric or biocentric. Table 1 shows these four perceptions and their impact on the ability of operations managers to reduce or eliminate harm (as per the distinction made by Pagell and Shevchenko [3]).

Table 1.
Different perceptions of nature and their implications on sustainability initiatives.
The theoretical propositions made in Table 1 can only be made by considering whether or not ecosystem stability is subject to thresholds. The nature constant view assumes that nature is in a stable equilibrium and has the ability to handle disturbances. In this view, nature is in a stable global equilibrium and there are no limits to development. There are no thresholds to human activity at which natural systems can collapse, and therefore all sustainability initiatives are wasted efforts. The polar opposite of this view is nature ephemeral, where nature is believed to be in an unstable, fragile equilibrium. In this view, any activities that disrupt biodiversity should be discouraged as the objective is to preserve nature at all costs. When thinking of nature as ephemeral, adopting thresholds of materiality would not be advisable as the underlying concern is the fragility of nature.
Table 1 shows two additional, multiple equilibria, perceptions of nature. In the nature balanced view, natural systems handle most disturbances, but a large shock could create an equilibrium shift, i.e., a fundamental change toward a new ecological configuration. These new configurations may or may not align with living human conditions. This is the view adopted by the Brudtland version of sustainable development [24,25]. In the nature balanced view, sustainability initiatives are desirable in order to maintain natural systems in a known, desirable state, i.e., to avoid a large shock. Small-scale/small-impact sustainability initiatives are a waste as nature has the ability to handle minor disturbances. In this view, thresholds are useful to know when to invest in sustainability or not.
Finally, the nature resilient view stems from the observations that natural ecosystems respond and handle surprise by evolving toward fitter and more resilient states. In this view, small-scale sustainability initiatives are a waste as well. Large-scale sustainability initiatives can be controversial if by seeking to preserve the current state of nature the process of adaption which makes ecosystems more resilient is stopped. In other words, there is always a risk when trying to protect nature that nature is becoming more fragile. Instead of using sustainability indicators, we should be using integrity indicators.
Levy et al. ([24], p.80) stress that “none of these competing world views is correct to the exclusion of others” and recommend that the impact of human activities on ecosystems be modeled as uncertain, and we propose to adopt this position in sustainable operations management. We can try to define thresholds, but we have to accept that these are uncertain. Pagell and Shevchencko [3] argue that one of the main limitations of sustainable operations management is “the limits of empiricism”, and our position is that these limits are here to stay. Pagell and Shevchencko [3] recommend a new generation of research focusing on all echelons of a supply chain so that the total supply chain impact can be measured. This is a logical recommendation, but it comes with serious data collection challenges. It also creates a new issue, that of accounting for impact multiple times as the unit of analysis changes (see later section on impact pathways).
Wasted effort (muda): In Table 1, we mentioned that when using different views of nature, some operations initiatives become wasted efforts. This is similar to the well-known operations concept of muda, one of the dimensions of waste in lean thinking. It is best translated as “uselessness”, e.g., work was performed when it was not needed. The research literature has only considered muda in the context of sustainability in the lean and green literature [11,26]. The main argument of lean and green is that because lean removes muda (eliminates unneeded resource utilization, material, etc.), lean contributes to sustainability. Hahn et al. [27] express concerns with this consensus view of sustainability and argue that it leads to watered-down sustainability initiatives. Genuine sustainability challenges are those where a trade-off exists between financial performance and becoming greener. Pagell and Shevchenko [3] describe minor sustainability initiatives as resulting in harm reduction, which they distinguish from the more ambitious goal of harm elimination. Harm elimination however requires radical innovation [21], but this comes with much increased risk levels [4,28].
By criticizing harm reduction, the sustainable operations literature is implicitly recognizing that a sustainability initiative may have no impact, i.e., is a waste of effort. Of course, any sustainability initiative will have some sort of impact reduction, unless it is a case of greenwashing [29]. Even when a small impact exists, the time spent on that initiative could either displace efforts from a more critical initiative (as seen with the example from Sterner, [22]) or have a knock-on effect on sustainability. The latter is a well-known issue in setting standards for offsetting initiatives that have to demonstrate additionality, absence of leakage, and permanence [30].
The wasted effort argument goes against the current sustainability mindset whereby any contribution to reducing the environment is viewed as good, a viewpoint that aligns with the nature ephemeral view described above. Given the popularity of lean management and waste reduction in operations management and of cost/benefit analysis in cost accounting, it is surprising that no research has so far considered the possibility of “sustainability waste”. In this paper, we define sustainability waste by using the EU double materiality definition. Sustainability waste is created when a firm commits its resource in a fashion that decreases its value (a material financial impact), but the environmental or social impact reduction of this commitment is not material.
Impact pathways: As mentioned above, research about the sustainability of operations systems leads to questions regarding the choice of a unit of analysis. Winroth et al. ([9], p. 844) made this their research question when they asked “Which sustainability indicators from existing sustainability frameworks are relevant at the factory level”? Their review allocates sustainability indicators to either global, national, corporate, or factory levels. It would be easy to add further hierarchical levels such as industry, region, district, or individual levels. Pagell and Shevchenko [3] challenge this approach of allocating sustainability indicators to a single link in a supply chain and conclude that the challenge of measuring supply chain impact is a serious limitation of sustainable supply chain management research. We take a different view in this paper in that we recognize the importance of accounting for the actual pathways to planetary-level impacts, but we need a framework that links operations units unequivocally to impact. For example, Pagell and Shevchenko [3] criticize the label of a lean car manufacturer as green (because of their process) when the product of that process can have a lasting negative impact. What is needed in sustainable operations management is a single point of impact measurement to stop accounting for impact multiple times.
1.2. Theoretical Framework
The theoretical starting point of this paper is to recognize that any actor, i.e., a factory or a country, can legitimately ask the question: how (un)sustainable am I? The purpose of this section is to develop a theoretical framework that can be used at any level of operations management (e.g., a national industry, supply chain, or a factory) to answer this question and to identify whether or not action to address unsustainability can have an impact. The framework needs to overcome the issues presented in the previous section: it should help actors identify priorities, avoid wasteful sustainability initiatives (by using a materiality threshold), handle impact uncertainty, and consider impact pathways.
To do this, we propose drawing an analogy between human and organizational actors vis à vis the environment with borrowers’ relationships with creditors. We need this analogy to link sustainable operations management to the concept of an environmental crisis, which Van Wassenhove describes as “sitting on a time bomb [21]”. Currently, a product or process LCA analysis just delivers impact figures. Operations managers are none the wiser about the actual contribution they make to a possible crisis. Our framework is also needed to capture the fact that operations systems contribute to environmental issues collectively, and we need a way to determine a system’s share of responsibility.
A borrower that defaults on a loan will hurt a bank, but most banks have enough performing borrowers and risk management mitigating measures to handle occasional failures. Mass defaulting is an issue though, as witnessed during the credit crunch and during currency crises [31]. Therefore, we conceptualize the natural environment as the common creditor (a shared lender, [31]) from which individuals, firms, and supply chains “borrow” natural resources and end up in debt. To the difference of the financial world, very few of these lenders mean to repay their loans. It is the essence of the sustainability challenge that we face today. The natural environment is a benevolent banker with deep pockets.
Sustainable behavior can be defined as the willingness and ability of actors to repay their debt. If actors believe in the constant nature worldview, they will never do so. This is a rather extreme position to hold, and borrowers will consider the possibility of other worldviews and their shared fate with the lender. When they do so, the question becomes: “Could their borrowing contribute to an ecological crisis?” This question can be answered by using the common creditor framework developed by Caramazza et al. [31], who demonstrate that, in the case of currency crises, the probability of a crisis can be predicted by looking at a common creditor variable. A crisis is defined as putting pressure on a currency beyond a sustainable threshold and depleting currency reserves. A defaulting country might induce a currency crisis elsewhere as the common creditor has to adjust its policies to handle the crisis in the first country.
Translated to the context of this paper, actors at different hierarchical levels (individuals, factories, etc.) borrow natural resources from only one creditor, the environment, and as such, they put environmental pressures that could generate a crisis above an uncertain threshold. Environmental pressure could be the depletion of natural resources, or stressing the environment (e.g., CO2 emissions that borrowers “trust” the environment can process). This conceptualization captures the fact that an actor behaving “sustainably” may not reap any benefits as none of its neighbors behave in the same fashion. Figure 1 shows how to define the relationship of an actor with the common creditor.

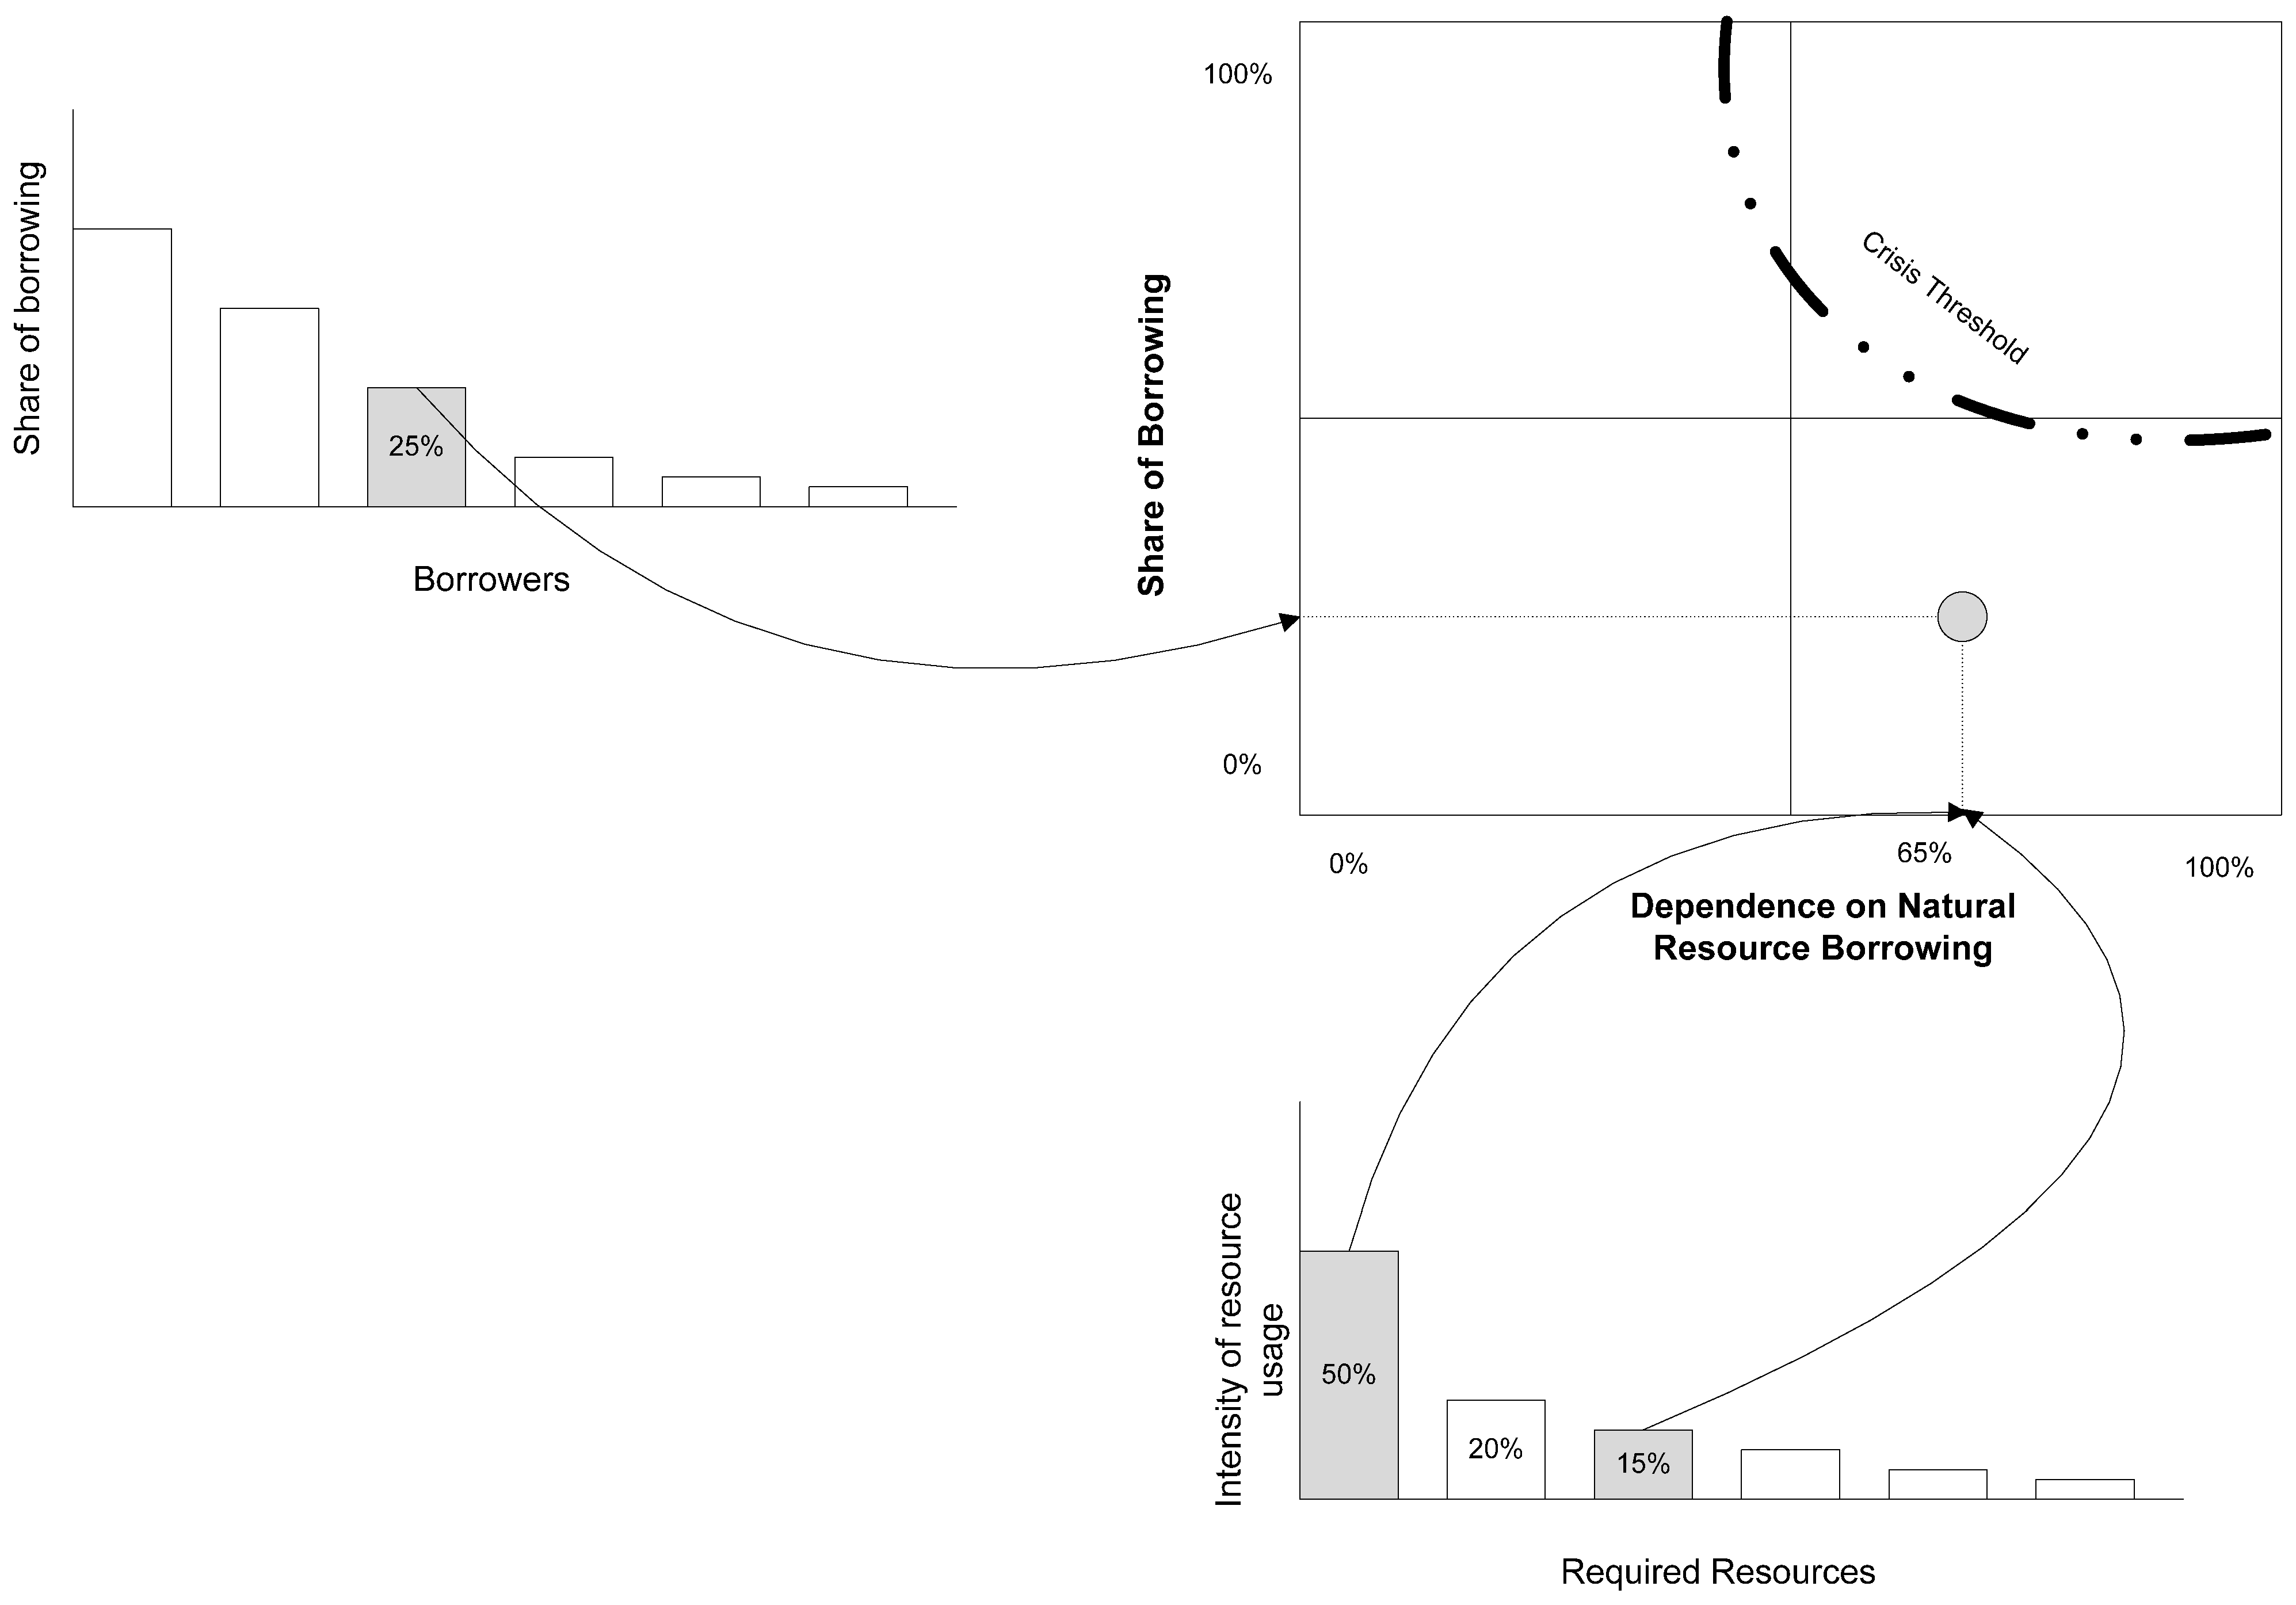
Figure 1.
The common creditor framework.
Figure 1 shows how an actor starts the process by assessing its dependence on natural resources by compiling a Pareto analysis of the scarce resources that are needed in order to run its operations system. Natural resources are shown in grey in the bottom Pareto diagram. In Figure 1, a fictitious company’s operations rely on natural resources as 65% of its total required resources. If a company offsets its use of natural resources, the corresponding percentages would be reduced. This positions the company as being dependent on natural resources in the common creditor frame on the top right of Figure 1. This score is similar to the notion of essentiality [32]. On the left-hand side, the company assesses its borrowing of natural resources against all other borrowers, i.e., against how much is outstanding on loan. In this case, the company has borrowed 25% of all available natural resources. This indicates where the company is positioned in the common creditor frame (grey circle). A sustainability crisis is likely to happen above the threshold line, where an actor is heavily dependent on natural resources and is a substantial borrower. Figure 2 provides a description of the different areas within the common creditor frame.
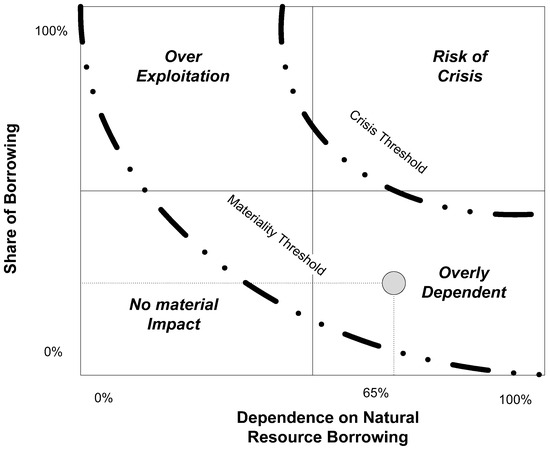
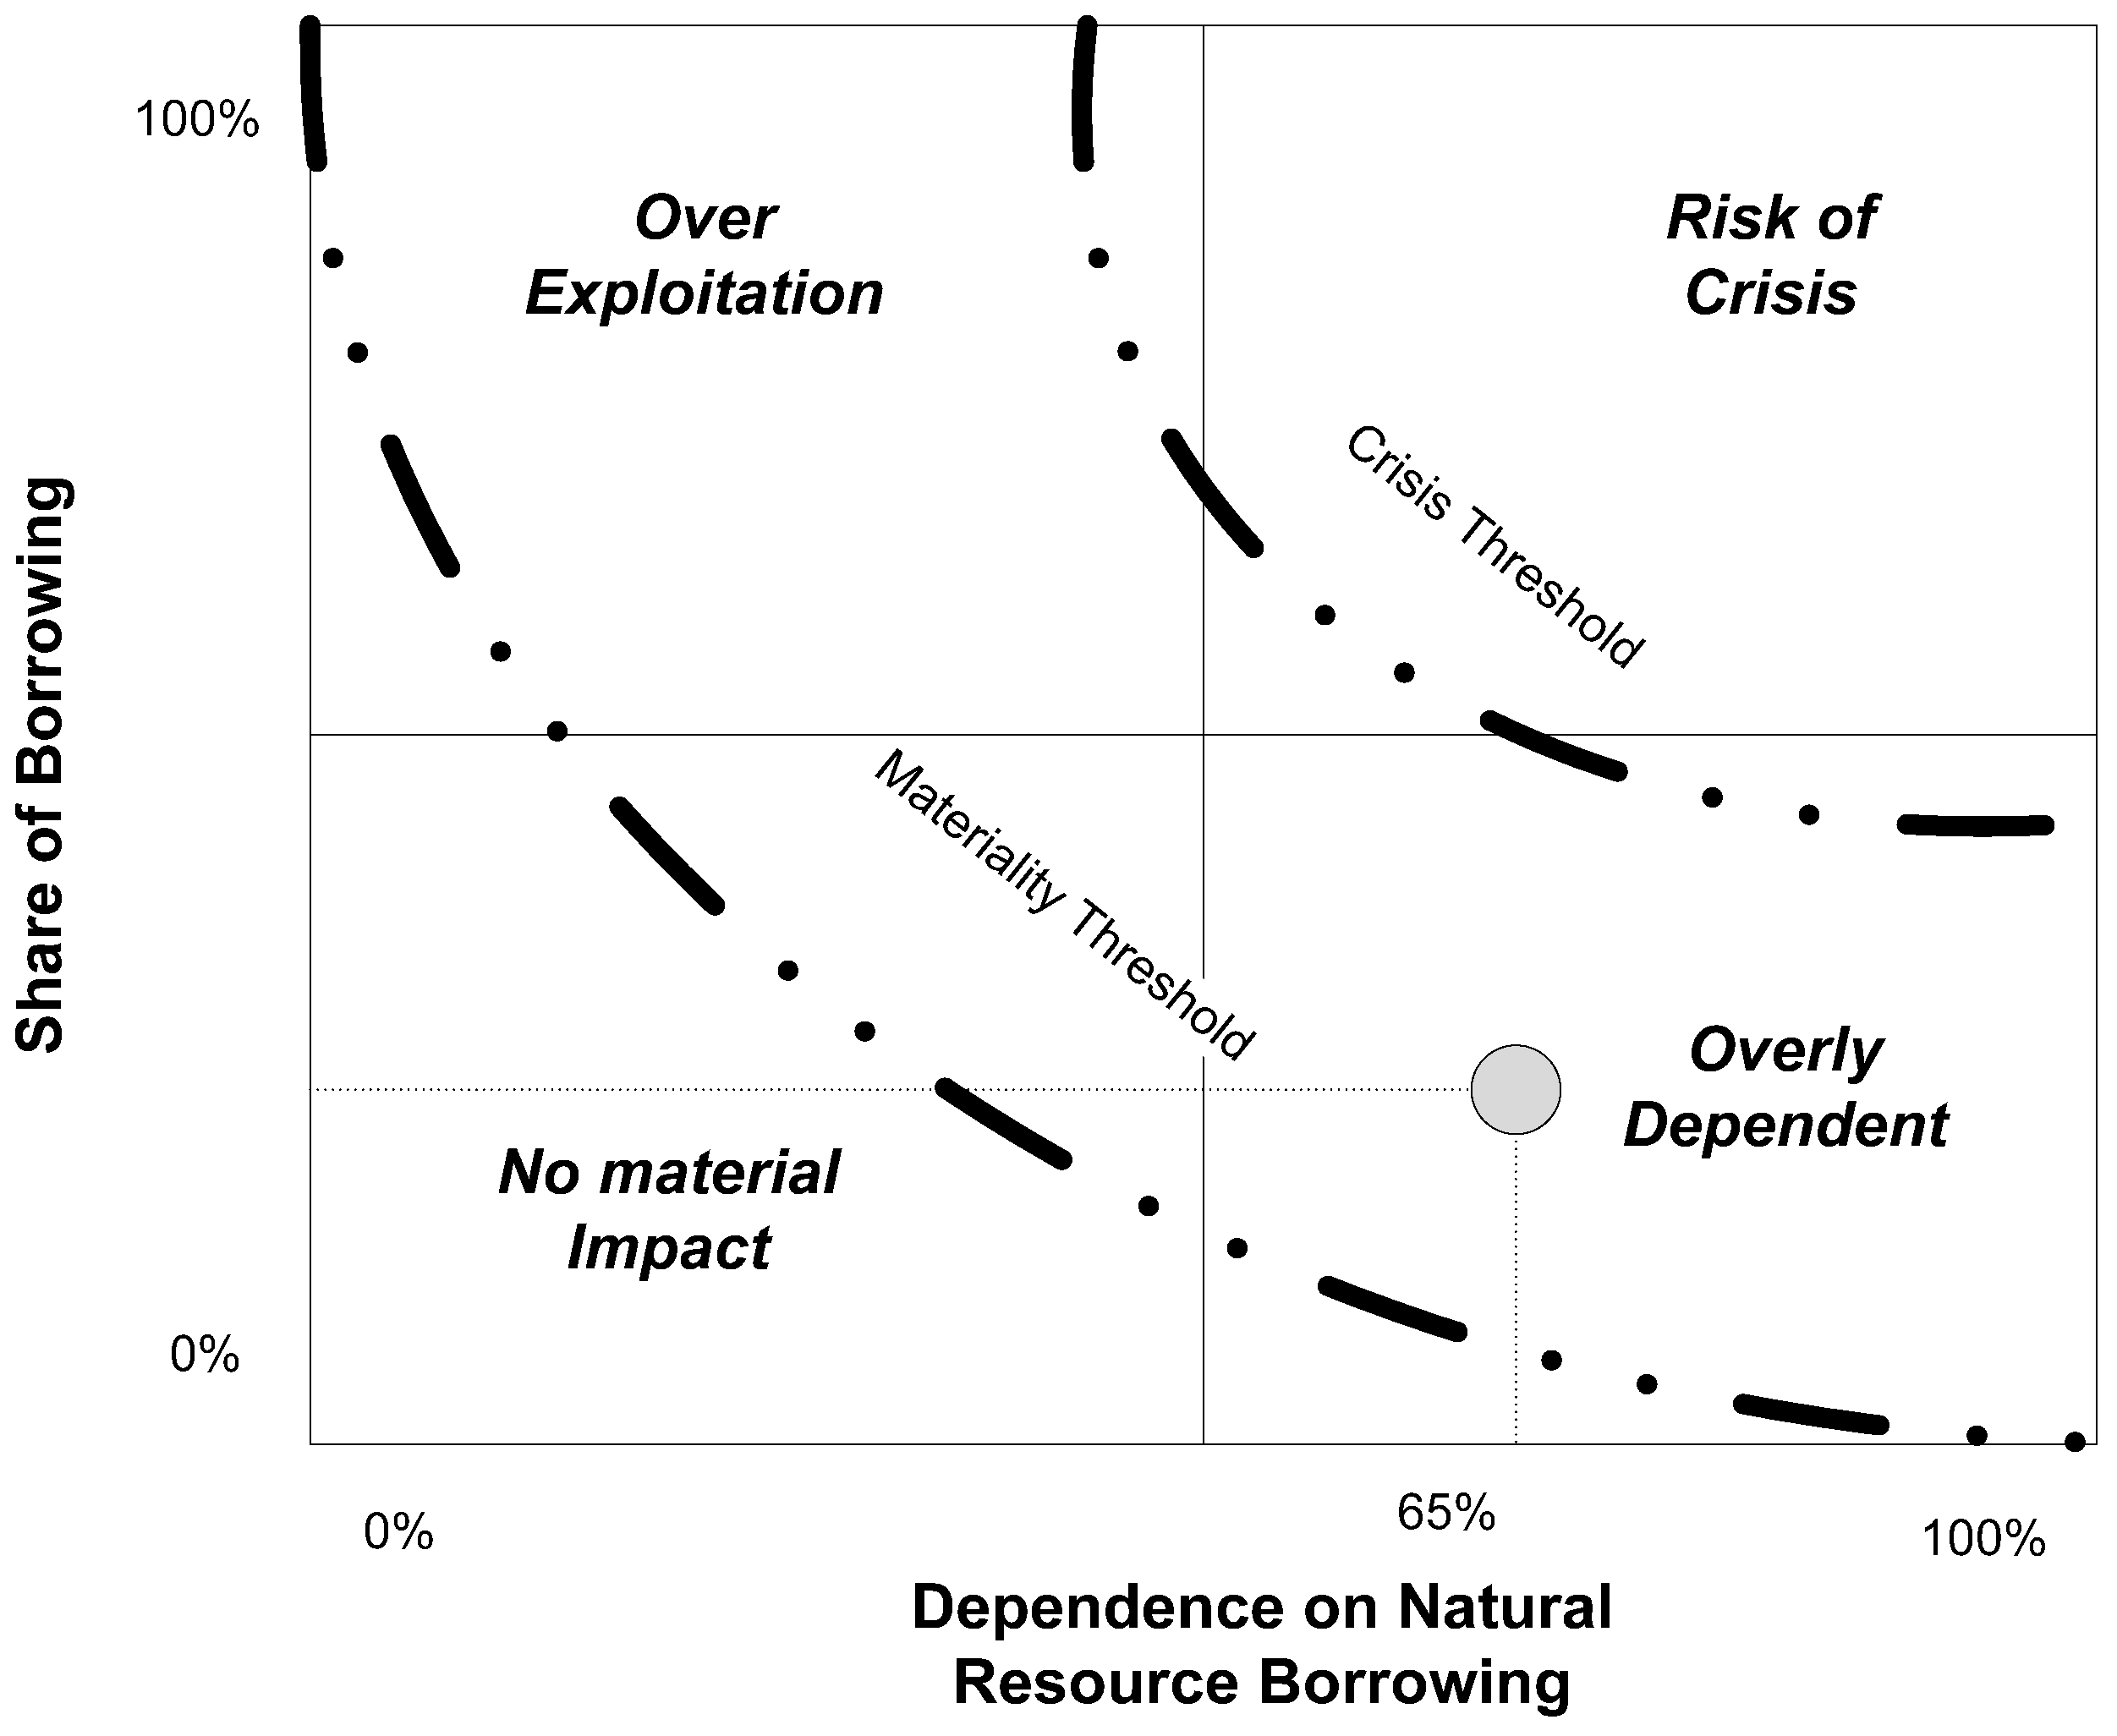
Figure 2.
Materiality and the common creditor framework.
In the original framework, Caramazza et al. [31] use the common creditor score (the product of the x- and y-axis coordinates) as a predictor of the probability that a currency crisis will happen. Their empirical approach is possible as they can define unequivocally a currency crisis. Although this approach could be replicated, such an endeavor is beyond the scope of this paper as the definition of the threshold lines is an environmental science matter. Therefore, the framework shown in Figure 1 and Figure 2 should be assessed as a conceptual model awaiting empirical validation, although an application of the framework based on estimates is presented later in the paper. In this conceptual model, the threshold lines are assumed to exist but are not known in a quantitative fashion. Depending on the worldview adopted by a researcher (cf. Table 1), the position of the lines will change. In the nature ephemeral view, the curves should be shifted downward and to the left. In the nature resilient view, the central band evolves with time. The diagram in Figure 2 is more consistent with the nature balanced view, i.e., the UN Brundtland report.
In the risk of crisis zone in Figure 2, the dependence on natural resources and the extent of borrowing of an actor is such that they could induce an ecological crisis. Such a case can be labeled as unsustainable as if all actors attempted to emulate these actions, the common creditor would indeed “go bankrupt”. Figure 2 introduces a second threshold line, which is defined by a materiality standard. It defines a no material impact zone representing actors who do not depend heavily on natural resources and carry a minor portion of resource borrowings. Their impact on natural systems is not material enough to warrant sustainability initiatives, which would amount to waste unless they are operational improvements in their own right. The central zone is the zone of concern, where either the dependence on natural resources or the level of borrowing is such that there are concerns that the actor could be part, at a higher hierarchical level, of a supply chain or industry which is in the zone of crisis. Table 2 shows how the framework addresses the concerns about sustainability initiatives described in the previous section.
Table 2.
Performance of framework against specifications.
2. Methodology: Framework Instrumentalization
The planetary boundaries framework [33] is the best possible available definition of the “crisis threshold”, i.e., the threshold at which pressure puts on the natural environment (the common creditor from which all operations systems borrow scarce, non-renewable resources) to a potential crisis level. The materiality threshold can be defined as the safe zone threshold of the planetary boundary framework.
In the rest of the paper, we want to illustrate how operations managers and operations management researchers can operationalize the framework with rough estimates, relying on estimation methods akin to the Fermi method, i.e., our approach is very pragmatic. The first challenge is to select a measurement scale and develop a benchmark. We will then look at three case studies to illustrate how the framework can be used in practice.
2.1. Benchmark Definition
To keep the illustration of the framework simple, we use impact figures measured in kg of CO2 equivalent. i.e., the global warming potential (GWP) of a unit of analysis. This choice is motivated by the facts that GWP data are widely available and that it is the dimension of environment impact which is commonly agreed to be the most critical and pressing issue.
The framework can be used with inputs, outputs, yearly data, or full lifecycle data. Although the presentation of the framework was looking at inputs (i.e., borrowing from the environment), output figures, i.e., GWP, can be used as well. Instead of measuring the stress put on the environment when extracting a non-renewable resource (a depletion impact measure), we look at the stress put on the environment by releasing CO2 in the atmosphere, and relying on the environment to process it. As our framework is built around the analogy of the natural environment as a bank, we focus only on environmental sustainability.
Although the framework could be customized to social sustainability impact measures, there are differences between the advent of a social crisis vs. an environmental crisis that make this adaptation challenging. For this reason, the applicability of the framework to social sustainability is a matter for further research and is not considered in the following sections.
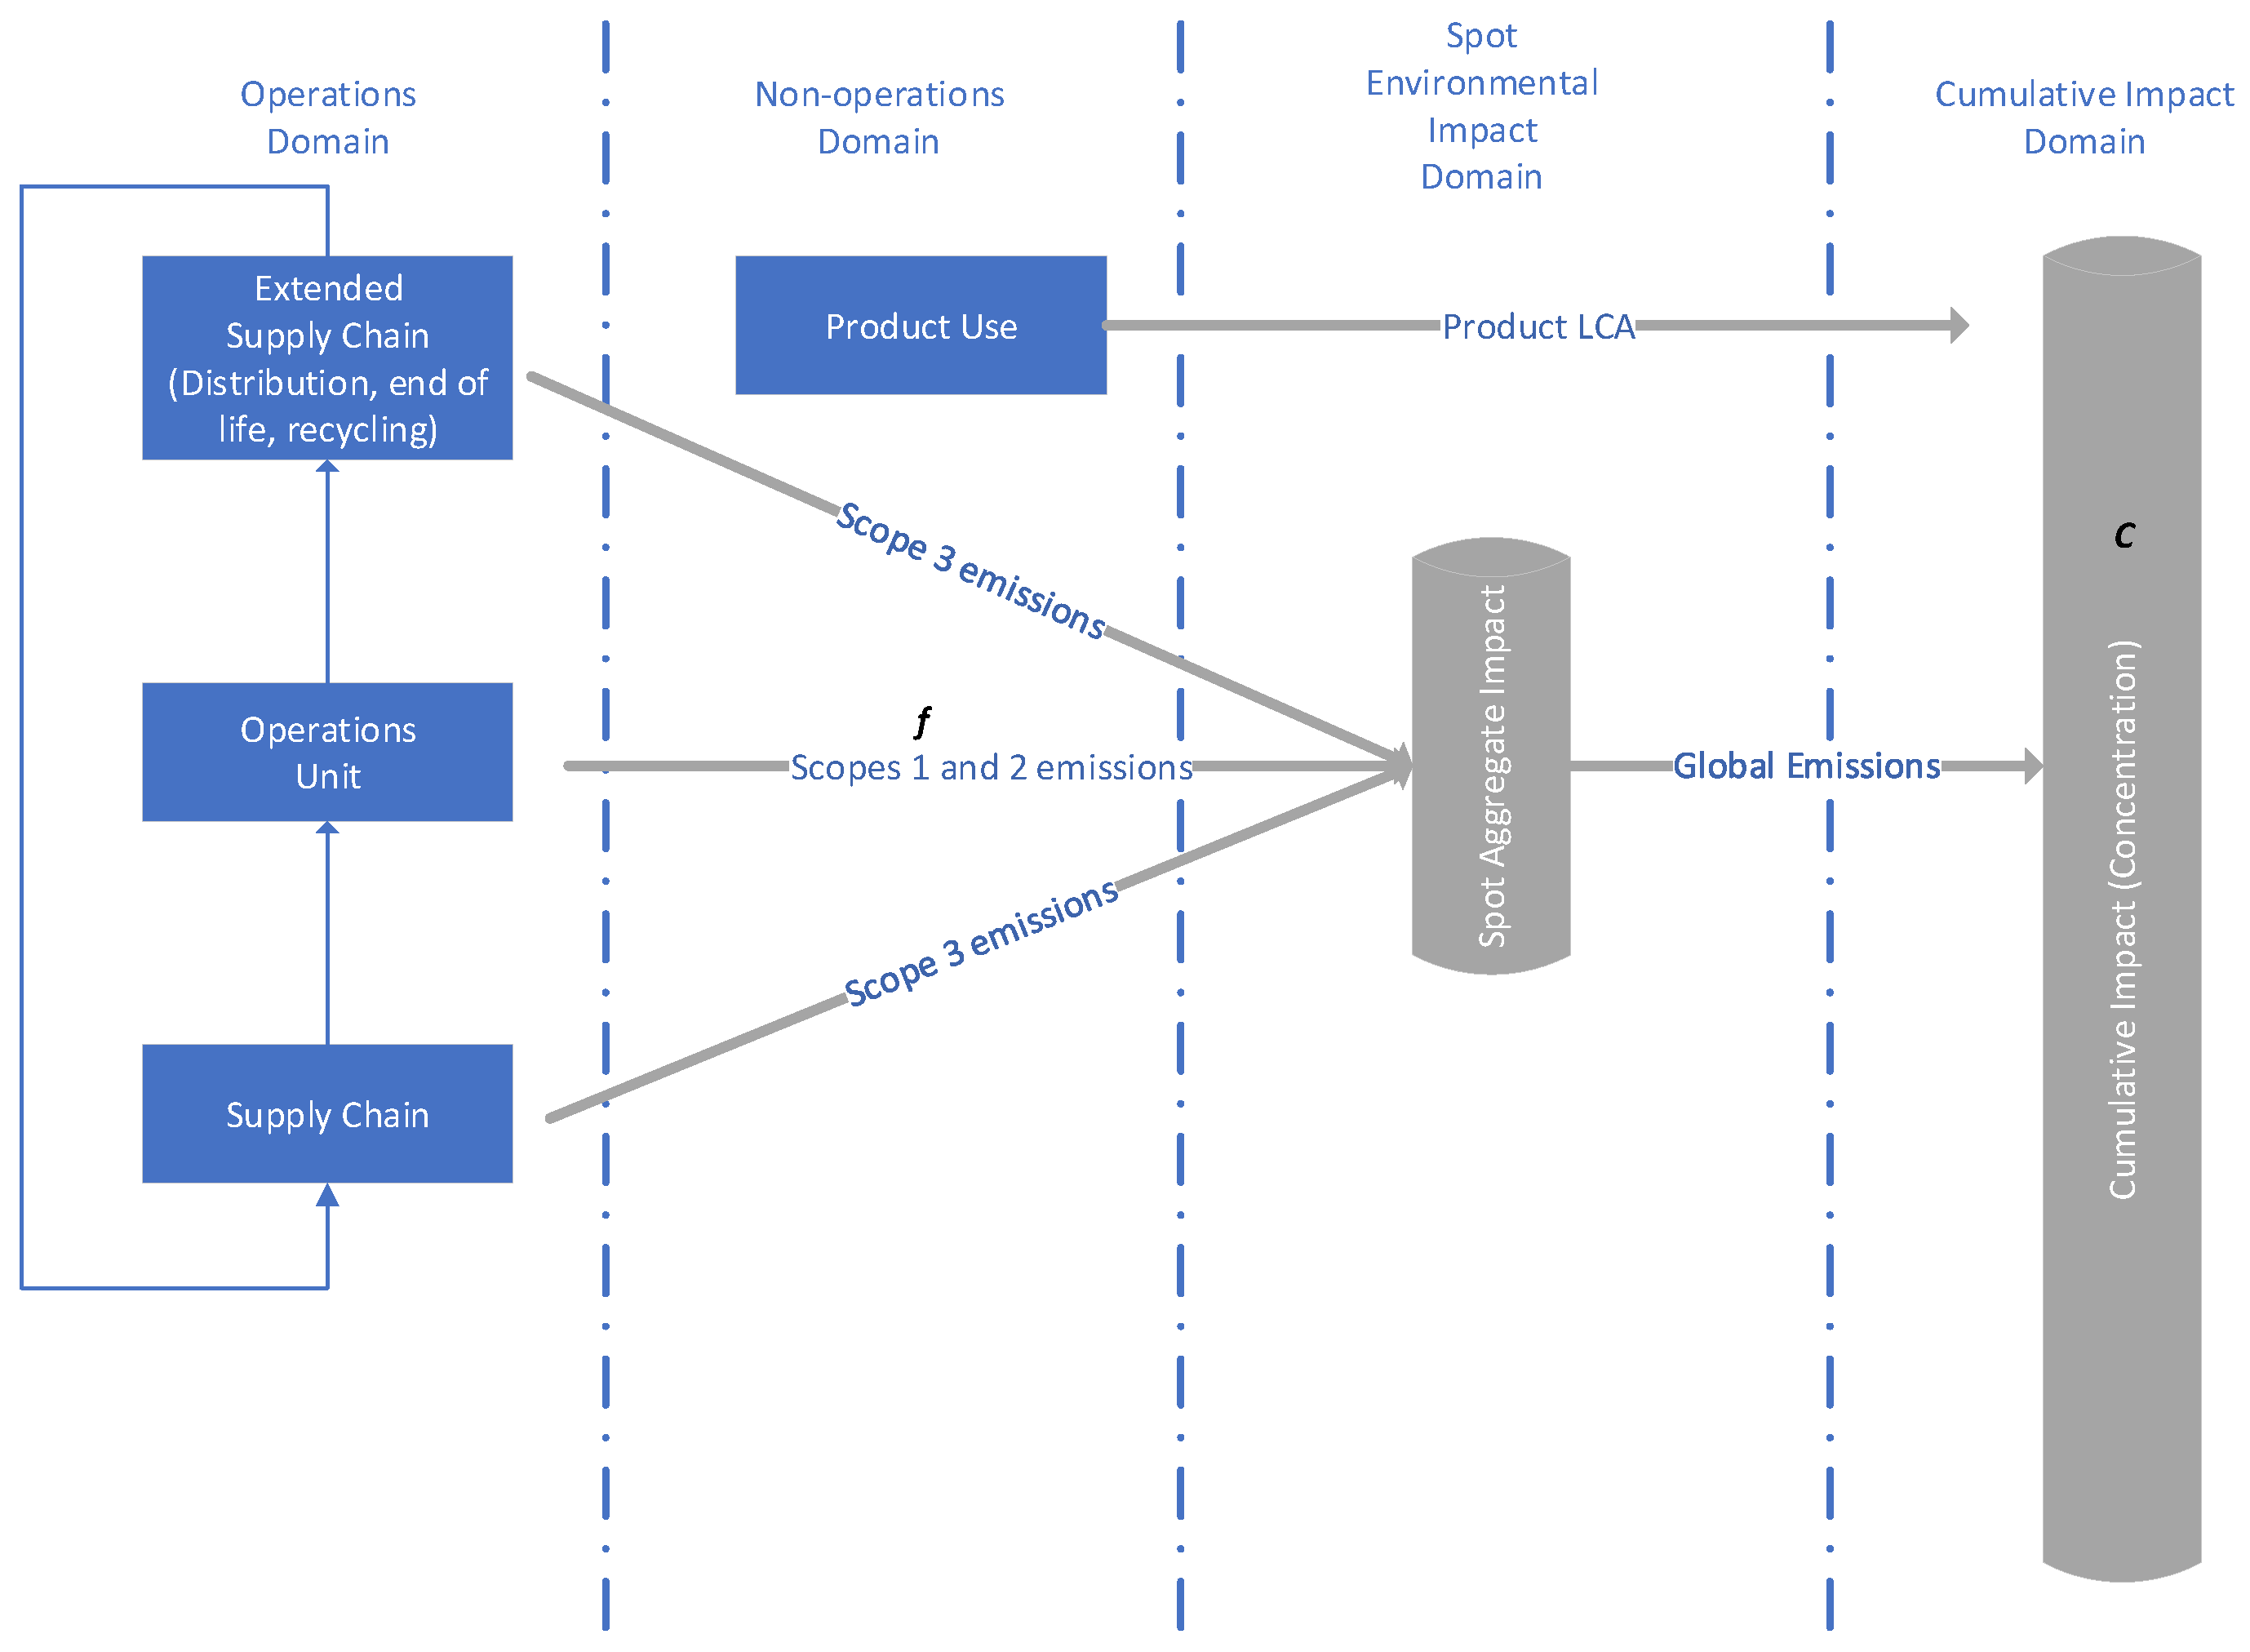
The planetary boundary framework defines the atmospheric CO2 concentration boundary as 350 ppm, with the current concentration being 417 ppm, well past the boundary [33]. Therein lays the first challenge for operations managers, who will be more accustomed to lifecycle assessment (LCA) impact analysis, with the impact being measured in kg CO2 equivalent. Figure 3 illustrates this issue in more detail.
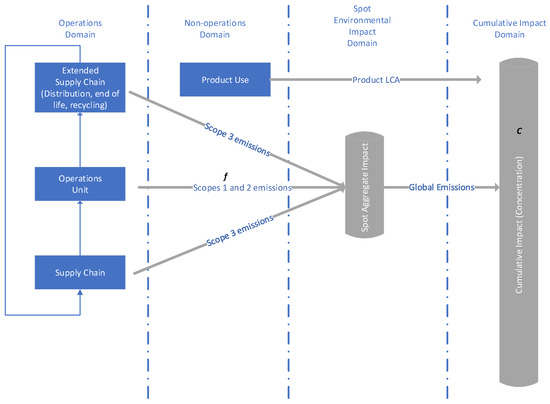
Figure 3.
Impact pathways.
Figure 3 shows a typical model of the operations domain as a supply chain, with an operations unit occupying the central focal position (this could be for example a factory). We purposefully do not use a “take-make-waste” supply chain, which cannot be sustainable by design, and instead use an extended supply chain, or closed-loop supply chain incorporating the circular economy concept [34]. The operations unit activities involve flows that hurt the environment, denoted by f. This flow is made up of direct emissions (scope 1) but also emissions linked to the energy that the unit uses (scope 2). Scope 3 emissions occur elsewhere in the supply chain and are not directly controlled by the operations unit. All the flows (scopes 1, 2, and 3) result in an aggregate global emissions flow, and the global flow results in a change in the concentration of molecules (e.g., CO2) at a planetary level, illustrated by C in Figure 3. Environmental science defines safe spaces and crises with C measures, but not with f measures, especially for small units of analysis.
The problem is that operations managers measure emissions in often very different ways. Factory emissions performance will often focus on flow reduction, or a product LCA analysis will measure emissions over the full lifecycle of a product or process (a lifecycle contribution to flow, rather than a spot flow measure). As the unit of analysis becomes smaller, the connection between flow and concentration becomes more and more complex. This is why it is challenging to translate the C boundary into an f threshold.
To overcome this problem, we define thresholds in a different way. We keep the principle that the impact of operations can only practically be linked to an emissions flow (f measure) and we propose to measure this flow in tons of CO2 per second. NASA has published a study of the evolution of carbon dioxide emissions over time [35]. To define the crisis threshold, we use the year 2000 value of 756 tons/second, as it is the year when the problem of climate change was fully recognized and an international climate change reduction plan was agreed. To define the materiality threshold, we use climate statistics published by the IPCC to identify when the first scientific evidence of global warming that could not be caused by natural causes can be observed. A rough estimate is that the point in time at which emissions flow started to unequivocally create global warming was in the 1950s. At that point in time, global emissions were 187 tons/second. It is important to note that setting the threshold at this value does not account for the damage already done, as accounting for the damage already done only makes sense at a planetary level. f can be attached to an operations unit of analysis, C cannot. Reducing C, for example, through new carbon capture technologies, is an equally important topic, but is not the focus of our framework.
The final step in defining our performance measure of impact is to scale our f thresholds to population. There are two reasons for this decision. The first is because population size is the main driver of sustainability problems. Although the literature is often reluctant to acknowledge this, the problem of environmental sustainability is essentially a problem of exceeding carrying capacity, as defined in ecology: an ecosystem can only carry a population equal to its equilibrium carrying capacity. The second reason is to avoid the issue of double accounting of impact. We will now illustrate this principle with a simple example, which we will use as a benchmark in the rest of the paper.
2.2. Benchmark
Let us consider the example of a single commuter driving 80 km per day to go to work, with a compact petrol-powered car with an emissions factor of 125 g/km. Assuming 185 working days in a calendar year, the total emissions from the commute is 1.85 tons of CO2 per year, or 0.06 g per second.
We now need to compare this f figure to our thresholds, which are scaled to the world population, as shown in Table 3:
Table 3.
Sustainability thresholds.
With emissions of 0.06 g/s, our benchmark commuter lands in our zone of concern in Figure 2. The commuting emissions are material enough to contribute to global warming but not above the crisis threshold. It is important to stress that the different properties of this benchmark:
- Our sustainability measure automatically adjusts with the population. If the population grows, the thresholds decrease. For example, a population of 9 billion takes the materiality threshold to 0.020 g/s.
- Any individual can typically be engaged in only one operation at a time, i.e., they are either commuting, at work, or at home, etc. When individuals are at work, they contribute to operations emissions, but they stop commuting emissions. This ignores “background emissions”, e.g., electricity consumption at home that could happen at the same time as commuting. It is not challenging to expand the example to include background emissions, but we omit these as our focus is on industry-scale operations systems in the case studies.
- Only direct emissions are considered, i.e., the lifecycle emissions of the car are not considered. This is because the mining emissions will be attached to miners at work, the fuel refining emissions to refinery workers, etc. Attaching flow emissions to what a person does at a specific point in time removes the risk of accounting for an impact twice, and it captures emissions intensity “as it happens”.
- In this example, we only use one dimension of the framework (dependence on natural resources). To use the second dimension, an estimate of the percentage of emissions compared to all planetary emissions is needed. At an individual level of analysis, doing so generates very small numbers, so it is more useful to look up at a higher level of analysis. For example, in the UK, only 20% of commuters use a car, which would confirm landing in the central band of Figure 2. The US figure of 50% raises more environmental concerns. The case studies in the following sections will further demonstrate the use of the second dimension.
2.3. Case Studies
Three case studies were selected to illustrate Figure 2 with different scenarios, i.e., a maximum variation sampling strategy. First, a UK domestic freight operator is used to illustrate strong Pareto effects (i.e., there is one area of key concern) that leads to the conclusion to “look up” sustainability at an upper level, illustrating the need to look at the second dimension of the framework. The second case study looks at low dependence/low share (a university organization) which reports on non-material sustainability issues. The third illustrates a high dependence/low share scenario (surfboard manufacturing).
3. Case Studies
3.1. Case Study A—UK Domestic Freight Provider
For this case, we consider a typical UK-based freight forwarder. The choice of the case company was one of convenience based on the availability of an annual sustainability report and of sufficient information to apply the framework, albeit some of the data is based on secondary data and estimates when needed. The company publishes a sustainability report annually where it confirms its concern with environmental protection. They disclose being the cleanest freight fleet in the UK with lorries all meeting the Euro 6 emission standard. They confirm their intention to continue monitoring technologies to improve their environmental performance. They report having reduced emissions through better planning and fleet utilization. Their report suggests that “all is in order” and that Company A is an exemplary company in its sector. Information provided in the annual report (number of HGV vehicles, size of warehouses, etc.) and secondary data are used to estimate GHG emissions in CO2 tons per year. The results are shown in Figure 4, where non-natural resources are omitted.
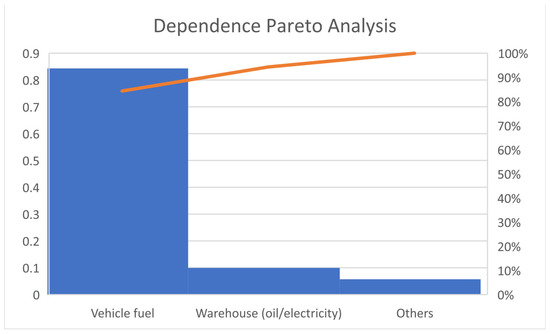
Figure 4.
Pareto analysis of dependence on natural resources for case company (estimated).
The Pareto analysis in Figure 4 displays a strong Pareto effect as the GHG emissions of vehicle fuel dwarf all other resources/activities. Even though the use of Euro6 trucks is exemplary, the 89% operations dependence on oil puts the company in the overly dependent area of Figure 2. When the number of employees is considered, an employee of company A emits 1.39 g/s. As a reminder, the material threshold is 0.023, the commuter benchmark is 0.06, and the crisis threshold is 0.093. This means that while at work an employee of company A typically contributes to emissions 23 times than when commuting and 15 times over the crisis threshold.
If company A total estimated GHG emissions are divided by the UK transport sector emissions and total UK emissions, the results are respectively a share of borrowing of 1% and 0.3%. This is low and thus, there are no concerns about over-exploitation. The fact that the company is overly dependent on vehicle fuel is a sustainability concern though and it makes sense, for a full assessment, to look at the next hierarchical level, i.e., the whole sector.
Estimates from [36,37] are used to compute the borrowing share of HGVs use when compared to total UK emissions: 27%, which is a substantial amount. This matches global statistics putting the transport sector between 20 to 30% of all emissions, i.e., a single sector of the economy contributes to one-third of the problem.
Coordinates of 89% and 27% position the freight forwarding sector as a serious and critical sustainability concern. The conclusion is that the company should consider initiatives to reduce, and possibly eliminate GHG emissions, as both itself and the sector it belongs to are overly dependent, i.e., they can never “repay” their loan with current operations. Any investment in sustainability initiatives in warehouses, offices, training centers, etc. will not have a material impact given the data shown in Figure 4. For the case company, the bottleneck to sustainability is its dependence on fossil fuel-powered vehicles. Although this may seem an obvious conclusion, the theory of constraints [38] can be invoked to challenge the practice of using precious funds to invest away from the bottleneck. To address their challenge, a number of operations management initiatives could be considered, including critical questions about the design of just-in-time customer supply chains that encourage the frequent shipments of parts [39], and the impact of next-day delivery practice. There are many technology-based solutions to overcome this dependence problem and it so happens that company A is leading the industry in this respect.
3.2. Case Study B—UK University
For this case, we consider a UK university, a typical organization in the service/governmental sector. Most European universities publish annual sustainability reports [40].
The university report’s headlines indicate that most of the sustainability performance statements are aspirational. Actual performance is measured against “targets” within a number of sustainability areas, i.e., biodiversity; energy and climate change (including emissions); construction; waste and recycling; water (including water discharge); travel and transport; procurement (including food); embedding sustainability in the curriculum.
Evidence shows that the largest source of carbon emissions is the construction of new buildings and facilities, although the main focus of measurement is energy. Here, total usage has not reduced a great deal over the years and it has been above the target. However, through decreasing floor area (by demolishing old buildings) while increasing staff and students there has been an improvement in energy use per square meter and per FTE (full-time equivalent). There is no indication of how energy use and emissions relate to the university’s qualitative outputs (impact of graduates and research, etc.). When the emissions of university B are divided by the number of staff and students, the f measure is 0.00000000046 g/s. In other words, by working or studying at the university B, one falls well into the non-material impact zone. If this individual commutes to the university, the impact of commuting is 132 million times higher than being on campus. The cumulative impact of all UK university emissions is 0.00005% of national emissions, so their impact is immaterial along the second dimension of the framework as well.
3.3. Case Study C—Green Surfboard Design
For this case, we consider the efforts of windsurf/surfboard manufacturers to decarbonize surfboards as an example of a product perceived to be a “carbon dense” product design, i.e., a suspected case of high dependence. This is because the product design relies primarily on raw materials derived from crude oil and because the production process is energy-intensive. Data are sourced from the sustainability report of a key manufacturer and from the sustainability reports of brands commercializing the final products. These reports are almost identical in structure to the reports used in case study B. CO2 emissions are not disclosed, although it is acknowledged that electricity usage is the main contributor to emissions, echoing the strong Pareto effect shown in Figure 3 for case study A. Electricity consumption is disclosed and emissions can be estimated to be 0.000000067 g/s per employee. This means that an employee working for this factory generates 14 times more emissions than a university staff member at work in case study B. Yearly emissions represent 2.4% of the emissions of the trucking company in case study A.
The company and its customers are very active in designing new ecodesigns that lower the carbon footprint of their products. Typically, a traditional composite design carbon footprint is 100 kg of CO2-eq over a cradle-to-gate lifecycle. The best practices are to include more recycled materials and to use biomaterials such as flax fibers and PLA resin to replace traditional composite materials. However, the larger product cannot be designed exclusively with these materials due to the loss of mechanical properties, such as Young’s modulus and rigidity. This means that a mix of traditional and biomaterial is used, resulting in a 20% reduction of impact, i.e., 80 kg of CO2-eq per unit. Given these figures, it is difficult to propose that the decarbonization of surfboards and related products will have a material impact on the environment apart from the possible knock-on effects of R&D discoveries that could be transferred to larger scale industrial applications. Additionally, it should be stated that the practice of embedding renewable resources (flax, PLA) into a non-renewable product structure effectively makes them non-renewable, i.e., incineration is the most likely disposal strategy.
4. Discussion
Our three case studies show that emissions from the operations systems show strong Pareto effects. This is confirmed by the popular press when it is reported that 20 firms are behind a third of all carbon emissions [41] and 100 firms are responsible for 71% of greenhouse gas emissions [42]. The world greenhouse gas emissions [43] also show a strong Pareto effect in terms of the contribution of greenhouse gases to climate change. CO2 accounts for 74.1% of the impact, methane for 17.3%, nitrous oxide for 6.2%, and F gases for 2.4%. The same chart also reveals strong Pareto effects when looking at the root causes of each emission category. The relevance of the Pareto 80/20 rule is perfectly illustrated in the field of sustainability.
Pareto effects direct managers towards priorities actions, i.e., they invite them to focus on the 20% of problems that generate 80% of the impact. Conversely, they should ignore the 80% of the problems that only generate 20% of the impact. Our framework incorporates this principle. There is no point in investing time and money below the materiality threshold that we have defined. It is “sustainability waste”, or muda in lean parlance, i.e., efforts spent on improvements that have no material impact on planetary environmental harm. Instead, we should concentrate our efforts on the priorities revealed by Pareto analysis of impact. In the sustainability reports that we have consulted, there is an implicit acceptance of this idea as energy and fuel use are recognized as key issues but this does not always correlate with improvement efforts. We argue that the application of our framework can help to redefine priorities, eliminate sustainability waste, and create substantial improvements in impact reduction. Figure 5 summarizes the distinctive aspect of our framework, paving the way to a “total sustainability management” approach, and compares this approach with current sustainable operations and the more radical views expressed in the literature [4,19,21].
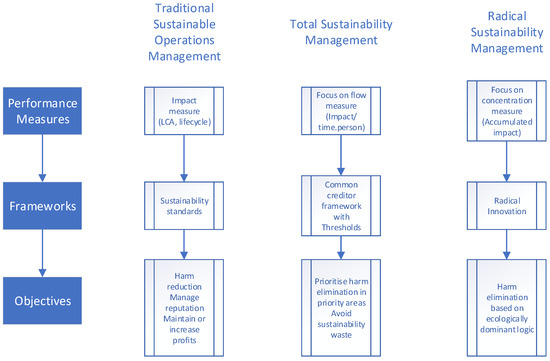
Figure 5.
Distinctive features of the proposed framework.
Figure 5 shows that traditional sustainable operations management has relied extensively on external performance measures, such as product LCA and sustainability standards to incorporate sustainability in business practices. It provides legitimacy as all firms use similar standards and it therefore allows a firm to manage its reputation in relation to criticisms of not being sustainable. As neither the performance measures used nor the framework used come with any thresholds, there is no way to quantify that performance as being good or bad. Instead, firms report on qualitative, relative (e.g., a 5% reduction) effects of their sustainability efforts.
The fact that it is currently impossible to quantify a poor or good sustainability performance also opens the door to critics. The popularity of outsourcing and offshoring in the last decades reinforces this, since by outsourcing, many scope 1 and 2 emissions become scope 3 emissions. This is why the sustainable operations literature has called for a more radical approach to sustainability management, i.e., to use radical innovation to eliminate harm altogether. However, this approach is extremely risky as it assumes that consumers, markets, investors, and government will all accept the underlying paradigm shift.
Our framework sits in the middle of these two approaches. As the framework is linked to the concepts of impact pathways through emissions flows and the concept of a safe zone and a crisis zone, operations managers can objectively report whether they are a sustainability concern. In other words, some operations managers can report on their emissions and conclude that their emissions are not material, a statement that currently cannot be made. The case of emissions having been passed down to the supply chain is covered by our framework with the principles of “looking up” or “looking down” for impact flow measures at higher or lower units of analysis. By discouraging operations managers from investing time and resources in non-material projects, it redirects efforts toward areas of priority.
As mentioned previously, it is important to note that the framework only addresses how operations managers can eliminate ongoing harm, i.e., design operations systems with low emissions in the future. The framework does not address how to deal with the historical and cumulative nature of sustainability problems. If we take the example of a carbon storage project, it is likely that the f measure that we recommend using will be negative, as it contributes to diminishing concentration in the atmosphere. Such a project would be beneficial but we need to make a distinction between designing environmentally friendly operations systems (the scope of this paper) and environmental repair operations systems (for which the radical sustainability management approach in Figure 5 is more relevant). This distinction is possible with the measures and thresholds from the framework shown in Figure 2. Without this framework, the distinction can only be made in qualitative terms.
5. Conclusions
We conclude our paper by stressing the need for a materiality principle for sustainable operations management as this important principle unlocks the door to developing a framework that guides managers toward identifying environmental priorities. This could enable sustainability improvements to be achieved by changing their operations systems or practices. If their operations systems do not create any major threats, it will, instead, be by searching, lobbying, or working with their supply chains and industries on more serious issues. Having a materiality principle also achieves the opposite, i.e., it calls for not investing resources in projects with no material environmental impact reduction. There is a lot of writing and interest within the industry around the concept of “net zero”. Net zero performance and operating in the safe (non-material) environmental impact is, we argue, the same concept. It is a good thing to do, as we are stopping the aggravation of environmental problems, but neither is enough to reverse the negative cumulative impact of emissions, resource depletion, and increased land use that has occurred since the Industrial Revolution. To address these legacy problems, we need next-generation operations systems. This distinction between “low-f” (or “0-f” for Net Zero) and “negative-f” operations systems is only possible by adopting the performance measures that we designed in this paper.
Finally, we would like to conclude this paper with a call for further research on the two topics directly emerging from our framework: sustainability waste and investment priorities.
The first reason why a materiality principle is needed is because otherwise, the current practice of investing without careful consideration in any form of harm reduction will continue. It is a problem because many of these initiatives will not have a material impact on the environment and will be akin to muda, i.e., a wasteful, unneeded expense of effort. The extent to which sustainability waste takes place in businesses is an interesting program of empirical research, for example by documenting the average cost per unit of emission reduction, or the resource displacement effects created by sustainability waste.
The second direction for future research is that of using the framework to direct efforts toward priority areas as a first step towards defining an integrated approach to sustainability management, such as in the tradition of similar frameworks in operations management (e.g., lean thinking, total quality management, the theory of constraints). All these integrated operations management best practices adopt a systemic approach to better understand challenges and formulate solutions, and include a system of values, frameworks, and toolsets. An interesting area for research is to take our framework as a starting point to develop a total sustainability management toolset for operations and supply chain management.
Author Contributions
Conceptualization, M.L.; Methodology, M.L.; Writing— original draft, M.L.; Writing—review & editing, D.B. All authors have read and agreed to the published version of the manuscript.
Funding
This research received no external funding.
Institutional Review Board Statement
Not applicable.
Informed Consent Statement
Not applicable.
Data Availability Statement
Data are contained within the article.
Conflicts of Interest
The authors declare no conflict of interest.
References
- Gray, R. Is accounting for sustainability actually accounting for sustainability...and how would we know? An exploration of narratives of organisations and the planet. Account. Organ. Soc. 2010, 35, 47–62. [Google Scholar] [CrossRef]
- Cho, C.H.; Laine, M.; Roberts, R.W.; Rodrigue, M. Organized hypocrisy, organisational facades, and sustainability reporting. Account. Organ. Soc. 2015, 40, 78–94. [Google Scholar] [CrossRef]
- Pagell, M.; Shevchenko, A. Why research in sustainable supply chain management should have no future. J. Supply Chain Manag. 2014, 50, 44–55. [Google Scholar] [CrossRef]
- Shevchenko, A.; Lévesque, M.; Pagell, M. Why firms delay reaching true sustainability. J. Manag. Stud. 2016, 53, 911–935. [Google Scholar] [CrossRef]
- Chewning, E.G.; Higgs, J.L. What Does “Materiality” Really Mean? J. Corp. Account. Financ. 2002, 13, 61–71. [Google Scholar] [CrossRef]
- Nunes, B.; Bennett, D. Green operations initiatives in the automotive industry. Benchmarking Int. J. 2010, 17, 396–420. [Google Scholar] [CrossRef]
- Fiandrino, S.; Tonelli, A.; Devalle, A. Sustainability materiality research: A systematic literature review of methods. theories and academic themes. Qual. Res. Account. Manag. 2022, 19, 665–695. [Google Scholar] [CrossRef]
- Baumuller, J.; Sopp, K. Double materiality and the shift from non-financial to European sustainability reporting: Review outlook, and implications. J. Appl. Account. Res. 2022, 23, 8–28. [Google Scholar] [CrossRef]
- Winroth, M.; Almstrom, P.; Andersson, C. Sustainable production indicators at factory level. J. Manuf. Technol. Manag. 2016, 27, 842–873. [Google Scholar] [CrossRef]
- Nunes, B.; Batista, L.; Masi, D.; Bennett, D. Sustainable Operations Management: Key Practices and Cases; Routledge/Taylor and Francis: Abingdon, Oxford, UK, 2023. [Google Scholar]
- Kleindorfer, P.R.; Singhal, K.; Van Wassenhove, L.N. Sustainable operations management. Prod. Oper. Manag. 2005, 14, 482–492. [Google Scholar] [CrossRef]
- Atasu, A.; Corbett, C.J.; Huang, X.; Toktay, L.B. Sustainable operations management through the perspective of Manufacturing and Service Operations Management. Manuf. Serv. Oper. Manag. 2020, 22, 146–157. [Google Scholar] [CrossRef]
- Felsberger, A.; Reiner, G. Sustainable industry 4.0 in production and operations management: A systematic literature review. Sustainability 2020, 12, 7982. [Google Scholar] [CrossRef]
- Jaehn, F. Sustainable operations. Eur. J. Oper. Res. 2016, 253, 243–264. [Google Scholar] [CrossRef]
- Sanders, N.R.; Boone, T.; Ganeshan, R.; Wood, J.D. Sustainable supply chains in the age of AI and digititalization: Research challenges and opportunities. J. Bus. Logist. 2019, 40, 229–240. [Google Scholar] [CrossRef]
- Seuring, S.; Muller, M. Core issues in sustainable supply chain management—A Delphi study. Bus. Strategy Environ. 2007, 17, 455–466. [Google Scholar] [CrossRef]
- Walker, H.; Seuring, S.; Sarkis, J.; Klassen, R. Sustainable operations management: Recent trends and future directions. Int. J. Oper. Prod. Manag. 2014, 34, 5. [Google Scholar] [CrossRef]
- ISO 14040:2006; Environmental Management—Lifecycle Assessment—Principles and Framework; Second Edition. International Organization for Standardization: Geneva, Switzerland, 2006.
- Montabon, F.; Pagell, M.; Wu, Z. Making sustainability sustainable. J. Supply Chain Manag. 2015, 52, 11–27. [Google Scholar] [CrossRef]
- Pagell, M.; Wu, Z. Building a more complete theory of sustainable supply chain management using case studies of 10 exemplars. J. Supply Chain Manag. 2009, 45, 37–56. [Google Scholar] [CrossRef]
- Van Wassenhove, L.N. Sustainable innovation: Pushing the boundaries of traditional operations management. Prod. Oper. Manag. 2019, 28, 2930–2945. [Google Scholar] [CrossRef]
- Sterner, E. Green procurement of buildings: A study of Swedish clients’ considerations. Constr. Manag. Econ. 2002, 20, 21–30. [Google Scholar] [CrossRef]
- Middle, G.; Middle, I. The inefficiency of environmental impact assessment: Reality or myth? Impact Assess. Proj. Apprais. 2010, 28, 159–168. [Google Scholar] [CrossRef]
- Levy, J.K.; Hipel, K.W.; Kilgour, D.M. Using environmental indicators to quantify the robustness of policy alternatives to uncertainty. Ecol. Model. 2000, 130, 79–86. [Google Scholar] [CrossRef]
- WCED. Report of the World Commission on Environment and Development: Our Common Future; Oxford University Press: New York, NY, USA, 1987. [Google Scholar]
- Elemure, I.; Dhakal, H.N.; Leseure, M.; Radulovic, J. Integration of lean green sustainability in manufacturing: A review of current state and future perspectives. Sustainability 2023, 15, 20261. [Google Scholar] [CrossRef]
- Hahn, T.; Figge, F.; Pinkse, J.; Preuss, L. Trade-offs in corporate sustainability: You can’t have your cake and eat it. Bus. Strategy Environ. 2010, 19, 217–229. [Google Scholar] [CrossRef]
- Leseure, M. Sustainability performance frontiers. Univers. J. Oper. Manag. 2023, 2, 16–30. [Google Scholar] [CrossRef]
- Wu, Y.; Zhang, K.; Xie, J. Bad greenwashing, good greenwashing: Corporate social responsibility and information transparency. Manag. Sci. 2020, 66, 7. [Google Scholar] [CrossRef]
- Thamo, T.; Pannell, D.J. Challenges in developing effective policy for soil carbon sequestration: Perspectives on additionality. leakage, and permanence. Clim. Policy 2016, 16, 973992. [Google Scholar] [CrossRef]
- Caramazza, F.; Ricci, L.; Salgado, R. International financial contagion in currency crises. J. Int. Money Financ. 2004, 23, 51–70. [Google Scholar] [CrossRef]
- Nunes, B.; Alamino, R.C.; Shaw, D.; Bennett, D. Modelling sustainability performance to achieve absolute reductions in socio-ecological systems. J. Clean. Prod. 2016, 132, 32–44. [Google Scholar] [CrossRef]
- Richardson, K.; Steffen, W.; Lucht, W.; Bendtsen, J.; Cornell, S.E.; Donges, J.F.; Druke, M.; Fetzer, I.; Bala, G.; von Bloh, W.; et al. Earth beyond six of nine planetary boundaries. Sci. Adv. 2023, 9, 1–16. [Google Scholar] [CrossRef]
- Corbett, C.J.; Klassen, R.D. Extending the Horizons: Environmental Excellence as Key to Improving Operations. Manuf. Serv. Oper. Manag. 2006, 8, 5–22. [Google Scholar] [CrossRef]
- Conlen, M. How Much Carbon Dioxide Are We Emitting; NASA Science Editorial Team: Washington, DC, USA, 2021. Available online: https://science.nasa.gov/science-research/earth-science/climate-science/how-much-carbon-dioxide-are-we-emitting/ (accessed on 22 July 2024).
- Hickman, R.; Banister, D. Looking over the horizon: Transport and reduced CO2 emissions in the UK by 2030. Transp. Policy 2007, 14, 377–387. [Google Scholar] [CrossRef]
- McKinnon, A.C. CO2 Emissions from Freight Transport in the UK; Logistics Research Centre, Heriot-Watt University: Edinburgh, UK, 2007. [Google Scholar]
- Goldratt, E.M. Theory of Constraints; North River Press: Great Barrington, MA, USA, 1999. [Google Scholar]
- Katayama, H.; Bennett, D. Lean production in a changing competitive world: A Japanese perspective. Int. J. Oper. Prod. Manag. 1996, 16, 8–23. [Google Scholar] [CrossRef]
- Mendoza, D.; Terpou, K. Sustainability Reporting in Universities; Blue Paper Report; Chalmers Innovations Kontor Väst: Göteborg, Sweden, 2014. [Google Scholar]
- Taylor, M.; Watts, J. Revealed: The 20 Firms Behind a Third of All Carbon Emissions; The Guardian: London, UK, 2019; Available online: https://www.theguardian.com/environment/2019/oct/09/revealed-20-firms-third-carbon-emissions (accessed on 22 July 2024).
- Riley, T. Just 100 Companies Responsible for 71% of Global Emissions, Study Says; The Guardian: London, UK, 2017; Available online: https://www.theguardian.com/sustainable-business/2017/jul/10/100-fossil-fuel-companies-investors-responsible-71-global-emissions-cdp-study-climate-change (accessed on 22 July 2024).
- World Resources Institute. World Greenhouse Gas Emissions in 2019. Available online: https://www.wri.org/data/world-greenhouse-gas-emissions-2019 (accessed on 22 July 2024).


Disclaimer/Publisher’s Note: The statements, opinions and data contained in all publications are solely those of the individual author(s) and contributor(s) and not of MDPI and/or the editor(s). MDPI and/or the editor(s) disclaim responsibility for any injury to people or property resulting from any ideas, methods, instructions or products referred to in the content. |
© 2024 by the authors. Licensee MDPI, Basel, Switzerland. This article is an open access article distributed under the terms and conditions of the Creative Commons Attribution (CC BY) license (https://creativecommons.org/licenses/by/4.0/).