Article

Sustainable Food Waste Management in Food Service Establishments in Relation to Unserved Dishes

by
Marzena Tomaszewska
1,
Beata Bilska
1,*,
Agnieszka Tul-Krzyszczuk
2 and
Danuta Kołożyn-Krajewska
1
1
Department of Food Gastronomy and Food Hygiene, Institute of Human Nutrition Sciences, Warsaw University of Life Sciences (SGGW-WULS), 02-776 Warsaw, Poland
2
Management Institute, Warsaw University of Life Sciences (SGGW-WULS), 02-776 Warsaw, Poland
*
Author to whom correspondence should be addressed.
Sustainability 2024, 16(15), 6631; https://doi.org/10.3390/su16156631 (registering DOI)
Submission received: 5 July 2024 / Revised: 29 July 2024 / Accepted: 31 July 2024 / Published: 2 August 2024

Abstract

:
The problem of food waste in food service is recognized in the scientific community. A reduction in this phenomenon is necessary for the sustainable development of the food service industry. However, the issue of the influence of various characteristics of food service establishments (FSEs) on food waste has still not been studied sufficiently. The aim of this research was to assess the impact of the type of FSE, type of customer service, time in business of the FSE, and average daily number of consumers served on measures taken in FSE in relation to ready meals in the context of food waste. Survey research was conducted in 131 FSEs. It was found that the different groups of dishes that were prepared in excess and not served to consumers are most often stored in refrigerated conditions until the following day. The management of unserved dishes was correlated with business time and the type of FSE. Dishes like cold and hot snacks, in particular, were more often made available to employees in establishments with shorter time in business. In restaurants and small food service outlets/cafés, discarding was more often indicated as the management method for these types of dishes. The majority of food service establishments were not able to sell half portions. In conclusion, there is great potential to reduce food waste in food service establishments, but education of both staff and customers is essential.

1. Introduction

Food service establishments, taking advantage of consumers’ interest in eating out, adjust what they offer to different social groups, taking into account their expectations and abilities to spend [1]. As indicated by data from a study conducted on a representative sample of adult consumers, a small part of Polish society uses food services regularly. The frequency of food services use depends mainly on age. Snack bars and small food service outlets are most often used by the youngest respondents (18–24 years old) on a weekly basis. The largest group eating out in restaurants at least 1–2 times a week were consumers aged 25–34 and 35–44 [2]. At the same time, it should be emphasized that the number of customers in food service establishments is successively increasing, and with it, the revenues, especially of restaurants and cafés, are growing [3].
The food service sector is an important area that, while providing for the nutritional needs of the population, also wastes significant amounts of food. According to data from the United Nations Environment Programme (UNEP), 1.05 billion tonnes of food was wasted globally in 2022. This means that 13% of the food produced globally was lost in the supply chain, post-harvest, and processing. Although the largest share of food waste is attributed to households (60%), the food service sector is in second place (27.5%), ahead of retail (12.5%) [4]. Given the increasing growth of the food service sector, it is expected that the mass of waste generated by food services, including food, will also increase [5]. The WRAP report [6] indicated that the U.K. food service sector alone increased food waste by an estimated 7.5% between 2015 and 2018, while other parts of the food chain reduced their levels of wasted food over the same period (e.g., households by 5.7%). Although the report clarifies that these figures are based on a changing number of food service establishments, taking into account the type of establishment and assuming that the mass of food wasted per establishment has been constant since 2011.
Wastage in the food service industry can be conditioned both by factors related to the adopted organization of the operation of the establishment as well as by the preferences and behavior of consumers using their services. Malefors et al. [7] highlighted that the food service sector generates food waste (i) in the kitchen and the serving process and (ii) as plate waste left by consumers. In particular, plate waste (leftovers) is the focus of much attention in the ongoing research on food waste in the food service sector. As reported by Çetin [8], the amount of plate waste varied according to countries, businesses, and different food service concepts. According to a study by Yahia and Mourad [9], American consumers leave 17% of the food they purchase in food service establishments. Tomaszewska et al. [10] found that every consumer in the hotel facilities wasted an average of 46 g from each ordered dish as a leftover. A very similar value, 40 g, concerning the weight of plate waste per consumer served in hotel food service is reported by Beretta and Hellweg [11]. A significant mass of plate waste is generated in educational institutions. In Vietnamese primary schools, students wasted, on average, 85 g per day. The authors of the study estimated that one student wastes more than 15.3 kg of food per school year [12]. In hospitals, plate waste can vary depending on the patient’s medical condition, dietary restrictions, and food preferences. Research has shown that hospital leftovers ranged from 6% to 65%, with a median plate waste of 30% by weight, depending on the hospital and patient population [13]. It should also be noted that the mass of plate waste generated correlates with the type and form of food service provided. Serving meals as a self-service buffet, when unlimited food is offered for a fixed price, stimulates consumers to take more than they can consume [14]. According to Dhir et al. [15], all staff working in the kitchen and serving customers should be trained on how to minimize food waste.
Undoubtedly, the problem of food waste in food services is recognized in the scientific community, as evidenced by a significant number of publications [16,17,18,19,20,21,22,23], as well as studies published by Polish authors [2,10,24,25,26,27]. However, the issue of the influence of various characteristics of food service establishments on food wastage has still not been sufficiently studied. A survey was planned to fill this gap. The aim of the research was to assess the impact of such features as type of food service establishment, type of customer service, time in business (years), and average daily number of consumers served on (1) methods of handling ready-made dishes/dish components that have not been served to consumers, (2) available options for selling ready-made dishes to consumers in food service establishments, (3) consumer behavior toward ordered dishes, and (4) meal components most often left as plate leftovers.

2. Materials and Methods

2.1. Study Design and Participants
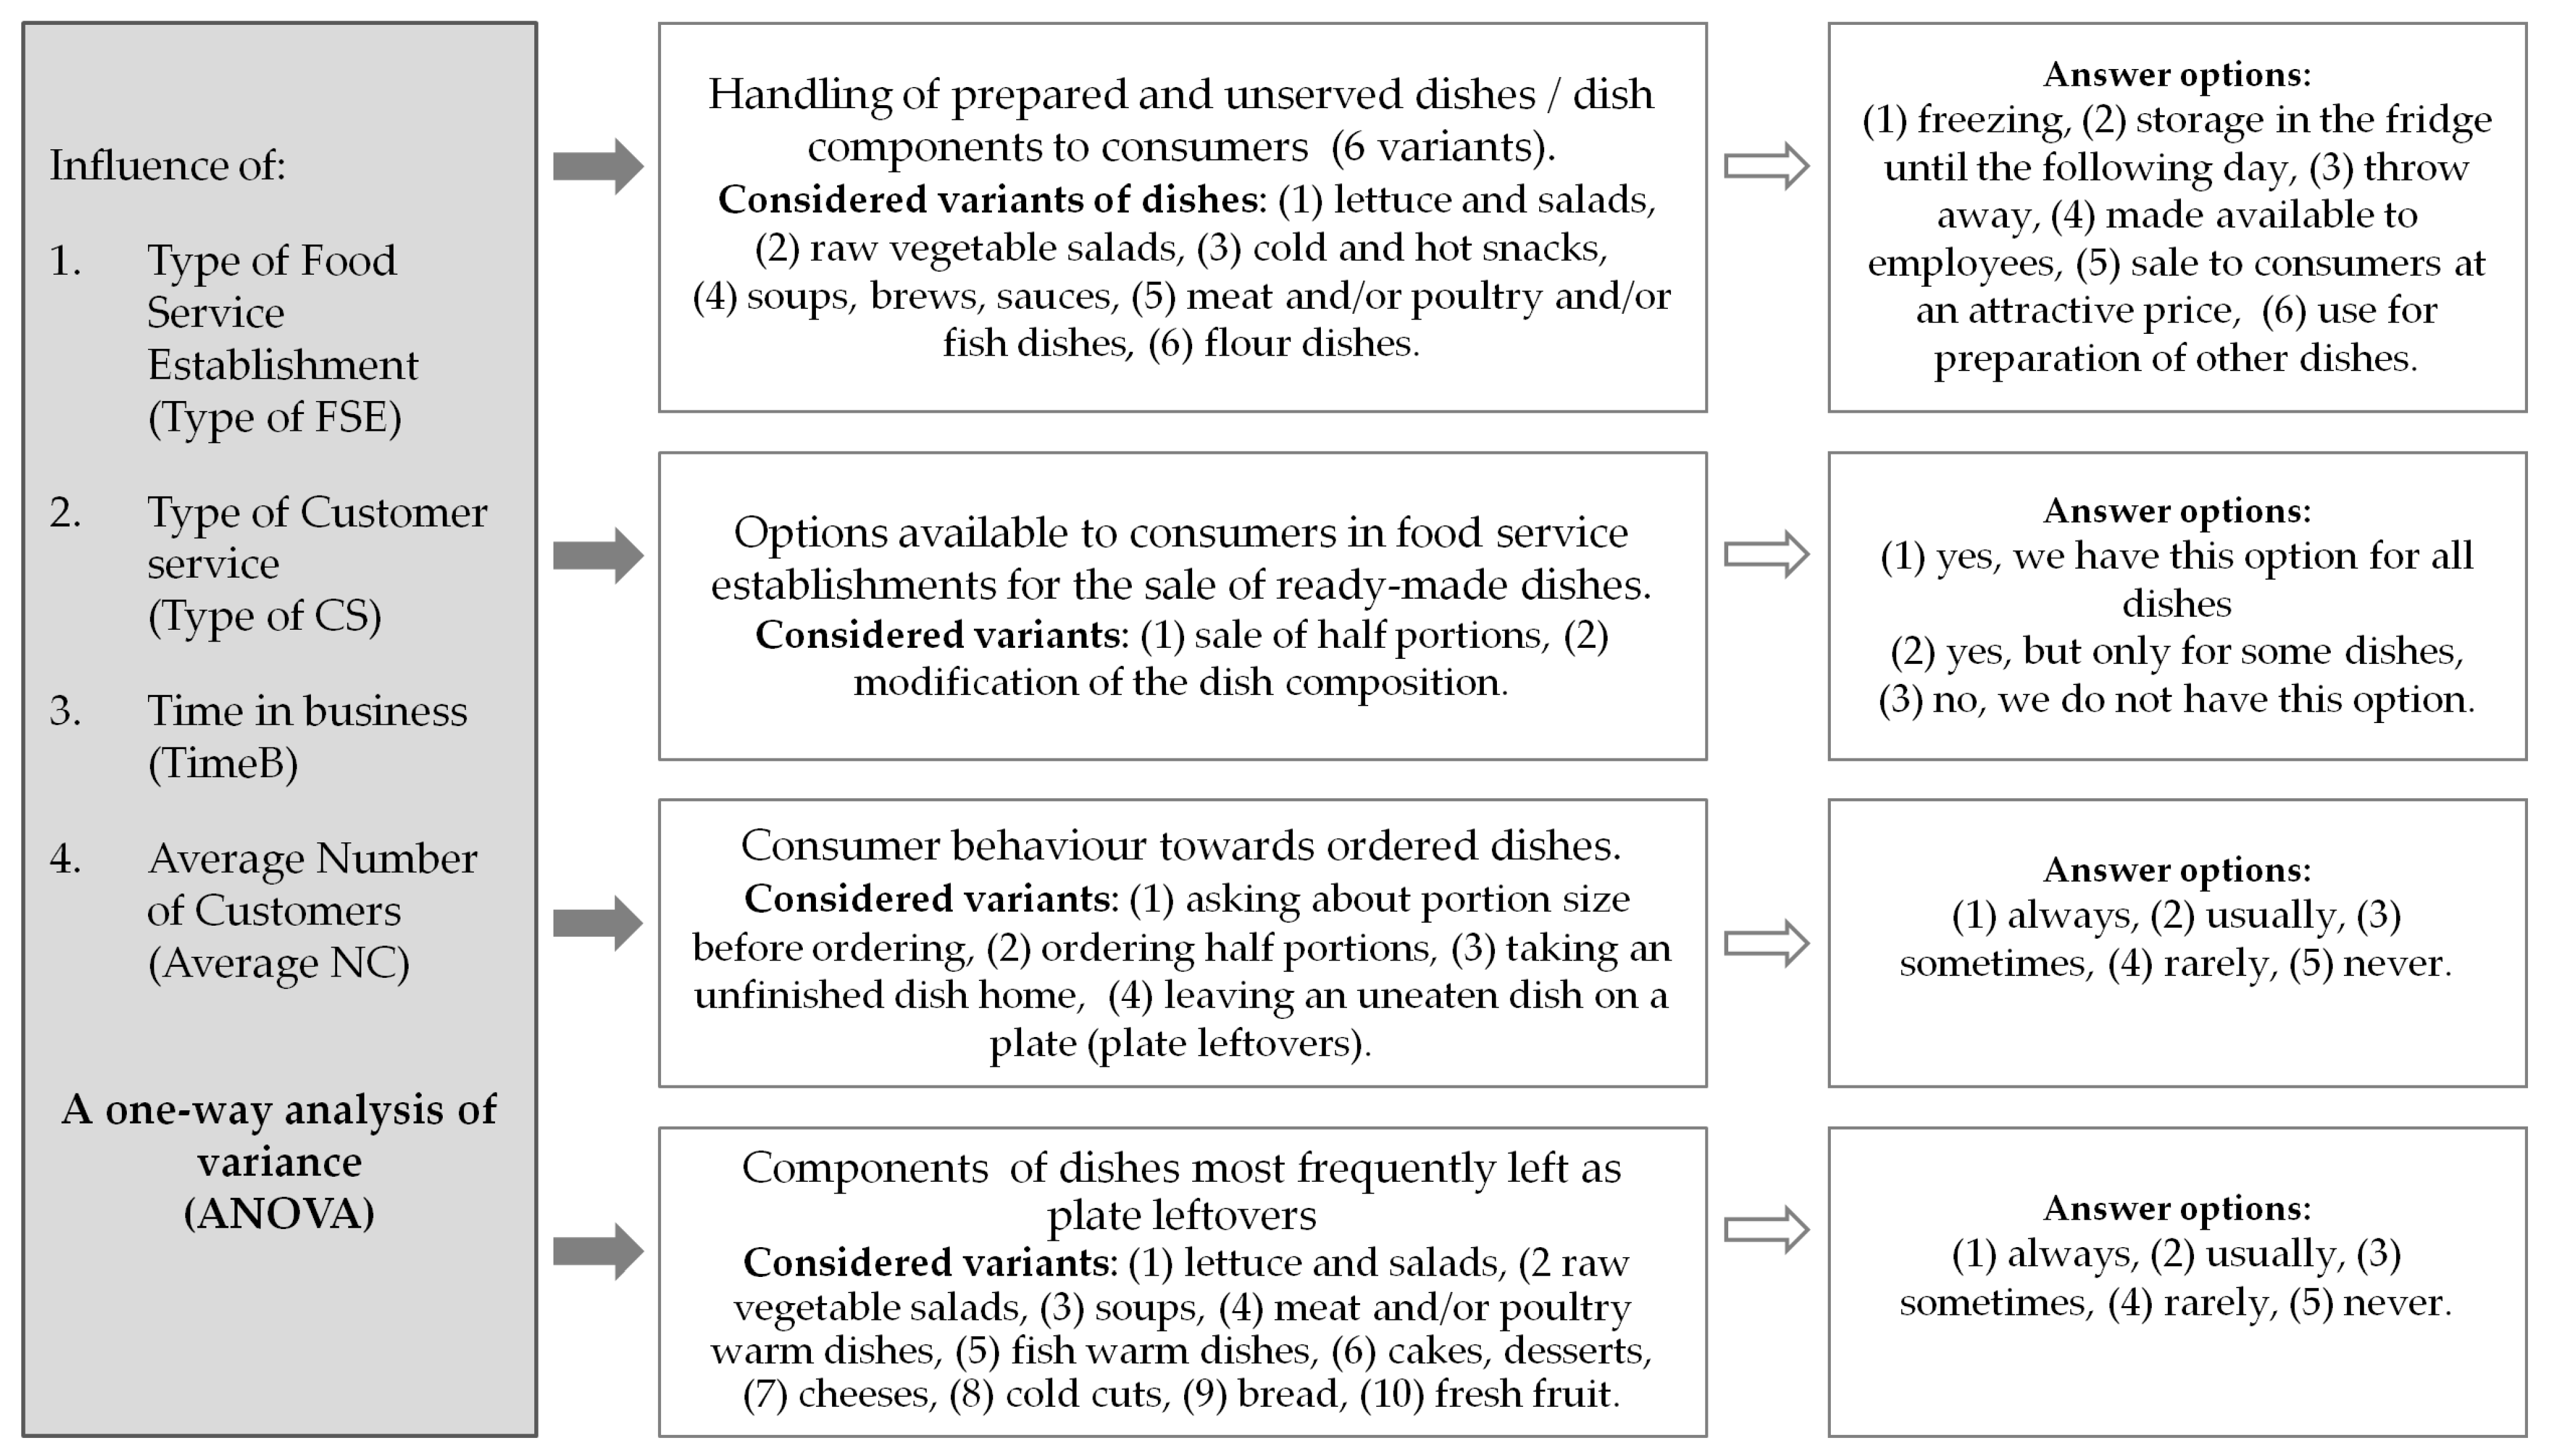
The baseline survey was conducted in 2019. The selection of facilities participating in the survey was deliberate. The questionnaires were (1) hand-delivered by the researchers to the food service establishments or (2) sent by email to the food service establishments. Regardless of the method of distribution of the questionnaire, the purpose of this study was always presented. In the case of questionnaires delivered to establishments, after obtaining permission from the owner or manager of the establishment to participate in the survey and after explaining how to complete the questionnaire, it was left at the establishment. Each owner/manager completed the questionnaire at their convenience. One week later, counting from the time the questionnaire was left, it was collected by the person who delivered it.
All participants were guaranteed anonymity. This study was preceded by a pilot study. It was conducted in one food service establishment located in Warsaw (the capital city of Poland). The establishment where the pilot study was carried out did not participate in this study. The actual survey yielded 131 completed questionnaires.
Table 1 presents the characteristics of the establishments in which the respondents taking part in the survey worked. Counting totals in all 131 food service establishments, an average of 474 consumers (between 30 and 5000 consumers) were served daily.

2.2. Questionnaire

The questionnaire consisted of four parts. The first part concerned the verification of the behavior of food service staff with regard to dishes/dish components that were prepared in excess and not served to consumers. The following categories of dishes were considered: (1) lettuce and salads; (2) raw vegetable salads; (3) cold and hot snacks; (4) soups, brews, and sauces; (5) meat and/or poultry and/or fish dishes; and (6) flour dishes. The responses to the question on the possible ways of disposing of unserved dishes are shown in Figure 1. In this part of the questionnaire, each respondent was allowed to indicate only one answer, i.e., the most common method of handling.
In the second part of the questionnaire, a total of six questions were included, two of which related to the options for selling prepared meals to consumers in food service establishments and four related to consumer behavior toward the dishes ordered. A cafeteria of answers was proposed for the questions related to sales options. On the other hand, the answers to the remaining questions were based on a five-point scale from ‘always’ to ‘never’ (Figure 1).
In the third section of the questionnaire, attention was focused on plate leftovers. Respondents were asked to indicate the frequency (on a five-point scale from ‘always’ to ‘never’) of uneaten food as plate leftovers, broken down into ten basic food categories (Figure 1).
The fourth section contained questions concerning the characteristics of respondents, i.e., position, education, experience in food service, as well as the characteristics of food service establishments.

2.3. Statistical Methods Applied

Descriptive statistical tools such as mean/minimum/maximum value, mode, % mode, and standard deviation (SD) were used to interpret some of the results, i.e., frequency of leaving individual dishes as plate leftovers or frequency of consumers’ behavior toward ready-made dishes ordered in food service establishments. A one-way analysis of variance (ANOVA) was used to determine the effect of the selected food service establishment characteristics, i.e., type of food service establishment, type of customer service, time in business, and average number of customers on behavior toward the selected dish categories. For questions on consumer behavior toward prepared dishes ordered in food service establishments, the analysis of variance was supplemented by testing the significance of differences between the mean level of the indicated responses.
When the F-ratio and p-value in the analysis of variance suggested rejection of the null hypothesis, that is, when the difference between the groups’ means was significant, the post hoc analysis was performed using the LSD (least significant difference) test.
This allowed the indication of homogeneous groups of arithmetic means. This verification was performed at the significance level α = 0.05. The analysis was performed using the Statistica 13 package (StatSoft, Krakow, Poland).

3. Results

3.1. Handling of Prepared and Unserved Dishes to Consumers in Food Service Establishments

This study analyzed the management of six categories of components of dishes/ready meals served in food service establishments. These were (1) lettuce and salads; (2) raw vegetable salads; (3) cold and hot snacks; (4) soups, brews, and sauces; (5) meat and/or poultry and/or fish dishes; and (6) flour dishes. Employees of the food service establishments participating in the survey indicated that the different groups of dishes that were prepared in excess and not served to consumers are most often stored in refrigerated conditions until the following day. On the next day, hot dishes were reheated, and cold snacks were served chilled. Only in the case of lettuce and salads was the most frequently indicated response ‘throw-away’ (Table 2). It was found that lettuce and salads in the facilities where they had been prepared were most often discarded (46.34% of responses) and then stored under refrigeration conditions until the following day (39.02% of responses). However, it should be noted that the other categories of dishes unserved to consumers, as declared by respondents, were discarded relatively frequently, i.e., from 8.39% of indications for soups/brews/sauces to 38.67% of indications for raw vegetable salads. It was observed that it is a rare practice to give such dishes to the employees of the establishment (from 8.60 to 16.47% of responses) or to freeze them (from 0.00 to 8.86% of responses).
One aspect considered in the analysis was the impact of selected characteristics of food service establishments on the handling of prepared dishes/dish components that were not served to consumers. The characteristics of the establishments, such as the type of establishment (type of FSE), the type of customer service (type of CS), the time in business (TimeB), and the average number of customers served per day (average NC) had no significant effect (p > 0.05) on the management of over-prepared lettuce and salads, raw vegetable salads, or flour dishes (Table 2).
The characteristics of food service establishments that were found to have a significant effect (p < 0.05) on the management of three categories of dishes out of six were the time in business (TimeB) and the type of food service establishment (type of FSE). These two characteristics of the establishments determined the management of over-prepared snacks served hot and cold (type of FSE and TimeB), meat and/or poultry and/or fish dishes (type of FSE and TimeB), and soups, brews, and sauces (TimeB). Regardless of the timing of the food service operation, soups/brews/sauces and meat and/or poultry and/or fish dishes were most often kept refrigerated until the following day (Table 3). It was observed that employees of establishments that had been in business longer, i.e., between five and nine years and more than nine years, were more likely to indicate this form of management of unserved dishes (responses for soups/brews/sauces, respectively: 76.92% and 70.73%; responses for meat and/or poultry and/or fish dishes, respectively: 66.67% and 53.33%) compared to establishments that had been in operation for a shorter period of time, i.e., less than two years or between two and five years (responses for soups/brews/sauces, respectively: 53.33% and 44.44%; responses for meat and/or poultry and/or fish dishes, respectively: 38.46% and 40.00%). It was also found that in establishments in operation on the market for a shorter period of time, i.e., up to five years, snacks, soups/brews/sauces, or meat and/or poultry and/or fish dishes that had not been served to consumers were far more likely to be made available to employees of these establishments (Table 3).
Analysis of the distribution of responses regarding the handling methods of the selected dishes (Figure 2a–c) according to the length of time in business indicated that cold and hot snacks, in particular, were more often made available to employees in establishments with a shorter time in business, especially in the range of two to five years. In contrast, in establishments with the longest business time, i.e., more than nine years, snacks were most often discarded (Figure 2a). The distribution of responses presented indicates that soups/ brews/sauces or meat and/or poultry and/or fish dishes were made available to food service staff to a lesser extent compared to snacks (Figure 2b,c).
The second characteristic of food service establishments that proved to be important in terms of the management of over-prepared cold/warm snacks and meat and/or poultry and/or fish dishes was the type of establishment (Table 2). From the data presented in Table 4 and Figure 3, it can be seen that in restaurants and small food service outlets /cafés, discarding was more often indicated as the management method for these types of dishes.

3.2. Options Available to Consumers in Food Service Establishments for the Sale of Ready-Made Dishes

The respondents were asked to indicate whether it was possible at their place of work to sell half portions to consumers and also to modify the composition of the dish according to guests’ preferences. The responses obtained are presented in Table 5. For the majority of caterers, there was no possibility to sell half portions. Only about 1/3 of the respondents indicated that in their workplace, for all dishes or part of the assortment offered, it was possible to offer the sale of half portions to consumers. The characteristics of food service establishments that differentiate the responses in this aspect were the type of food service establishment and the form of consumer service.
It was found that the establishments least likely to declare the sale of half portions were small food service outlets and cafés (14.7% of responses). In snack bars, canteens, and restaurants, the percentage of establishments offering portion size modification was very similar (41.18% and 41.17%, respectively) (Figure 4a).
More often than not, according to the statements of employees of food service establishments, consumers were offered the possibility to modify the composition of the dish (Table 5). About 3/4 of the respondents indicated that this possibility existed in their workplace for all or part of the dishes. In addition to the type of food service establishment and the form of consumer service, the business time proved to be an important feature. In hotel restaurants and other restaurants, consumers were more likely to be offered this sales option (100% and 89.71% of responses, respectively) compared to snack bars/canteens and small food service outlets/cafés (47.06% and 52.94% of responses, respectively) (Figure 5a). Considering the form of service provided to consumers, establishments with waitstaff service and hybrid service were more likely to offer the opportunity to modify the composition of the dish (80.0% and 82.98% of responses, respectively) compared to self-service establishments (61.54% of responses) (Figure 5b). On the other hand, when analyzing the length of business time, it was found that the facilities that were most flexible about modifying the composition of the dish were those in operation between two and five years (80.64% of responses), as well as over nine years (78.94% of responses) (Figure 5c).

3.3. Consumer Behavior toward Ordered Dishes with Particular Reference to Plate Leftovers

As presented in Section 3.2, a small percentage of food service establishments offered the sale of half portions to customers (Table 5); therefore, according to respondents’ statements, consumers rarely use this option for the sale of ready-made meals. The results of the descriptive statistics (Table 6) indicated that almost half of the respondents answered ‘never’ to the question about the frequency of ordering half portions (mode = 5.00; %mode = 46.56). In contrast, it is more common for consumers to ask the staff about the portion size before ordering (mean = 3.37). In this case, the predominant response was ‘sometimes’ (mode = 3.00; %mode = 43.51). When analyzing consumers’ behavior toward the food they ordered after consumption, it was found that they take an uneaten dish home at a similar frequency (mode = 3.00) as they leave it on the plate in the form of plate leftovers.
The type of food service establishment (type of FSE) was found to be the characteristic that most determined consumers’ behavior toward the meals they ordered (Table 7). The analysis proved that in restaurants, consumers more often (p < 0.05) asked service staff about portion size, compared to snack bars/canteen or small food service outlets and café customers. Restaurant customers, as declared by the staff of food service establishments, are also more likely to take home an uneaten dish compared to the other types of establishments (p < 0.05). Although consumers rarely ordered half portions (Table 6), it was found that they do so significantly more often in snack bars (mean = 3.53) compared to the other establishment categories included in the analysis (mean from 4.10 to 4.47).
More than 60% of respondents identified that consumers ‘sometimes’ leave an uneaten dish on their plates in the form of plate leftovers at their workplace (Table 6). The results of the one-way ANOVA indicated that the frequency of leaving them is not conditioned by the type of establishment, the form of service, the business time, or the average number of consumers served per day (Table 7).
Food service employees were asked about the ingredients of dishes/dishes most frequently left as plate leftovers. The responses obtained are shown in Table 8. Respondents declared that consumers most frequently left on their plate products such as (1) lettuce and salads, (2) raw vegetable salads, (3) bread, and (4) fresh fruit. For these products, the share of always/usually responses was 13.74%, 9.92%, 6.87%, and 6.87%, respectively. On the basis of the mod values (Table 8), it was found that while 1/3 of the respondents ‘sometimes’ left raw vegetable salads out (mode = 3.00, %mode = 33.68), for the other listed dish components, the dominant response regarding frequency was ‘rarely’ (mode = 4.00, %modelettuce and salads = 35.58; %modebread = 41.11; %modefresh fruit = 35.48). It should be noted that cured meats or cheeses turned out to be those products which, according to respondents’ statements, are not left as plate leftovers by more than 40% of consumers (mode = 5.0, %modecheeses = 42.19; %modecold cuts = 45.16).

4. Discussion

As our research showed, the dishes prepared and not served to consumers were most often kept refrigerated until the following day. Only lettuce and salads were most often discarded, which is understandable due to their microbiological qualities and other quality features that prevent them from being stored for more than six hours. The findings of Silvennoinen et al. [28] show that salads and side dishes, i.e., pasta, potatoes, and rice, were most often wasted in restaurants. Studies conducted in school canteens also confirm that the largest mass of wasted food comes from vegetables, fruits, and salads [12,29].
The characteristics of food service establishments that appeared to have a significant impact on the management of over-prepared hot and cold snacks, meat and/or poultry, and/or fish dishes were the time in business and the type of food service establishment. A longer presence on the market, i.e., greater experience, likely contributes to finding methods for using unused dishes. As stated by McAdams et al. [30], casual dining restaurants were characterized by a higher volume of plate leftovers per customer compared to fine dining restaurants.
A rare practice was giving unserved dishes to the employees of the establishment. In addition, it was found that in establishments with a shorter time in business, i.e., up to five years, unserved snacks, soups/brews/sauces, or meat and/or poultry and/or fish dishes were far more likely to be made available to the employees of these establishments. In contrast, in facilities with the longest time in business, i.e., more than nine years, snacks were most often discarded. In food service establishments that have been operating on the market for a shorter period, they are more willing to give these dishes to their own employees so as not to cause trouble. In a qualitative study by Bilska et al. [25], owners of food service establishments declared that unsold dishes could be eaten by employees and considered this a fairly common practice. Tomaszewska et al. [10], on the basis of a study conducted in four hotels, also found that dishes not consumed by hotel guests were managed in the staff buffet. Also, in Chinese restaurants, it is quite common practice to prepare meals for employees using unused ingredients [18]. It is important to emphasize that surpluses that constitute nonperishable food for human consumption should first be channeled for consumption, e.g., for people in need of support in this area, thus contributing to social sustainability and environmental quality [31]. As noted by Martin-Rios et al. [19] and Sakaguchi et al. [32], although food donations are an effective tool to facilitate food waste reduction, they are rarely used in restaurants because managers and chefs consider them unfeasible because of potential legal or reputational setbacks. Legal concerns are related to the safety of donated food and liability for possible health problems of people who consume it. Such problems could negatively impact the company’s image.
More than 60% of employees participating in the survey identified that consumers ‘sometimes’ leave uneaten food on their plates in the form of plate leftovers. Plate leftovers are foods that have not been fully consumed by the consumer and are, therefore, potentially bacteriologically contaminated and, consequently, cannot be reused for human nutrition [33]. Therefore, in every food service establishment, it is so important to plan appropriate measures to reduce the risk of plate leftovers. Above all, attention is paid to adapting portion sizes to consumer preferences [34]. However, as Carvalho et al. [35] pointed out, even if customers are satisfied with the meals served, the average food waste is considerable. Interesting observations were made by Malefors et al. [36] investigating plate waste in primary school canteens. The authors indicated that most leftovers (60%) came from a relatively small proportion of children (20%), while the majority of pupils wasted only a small amount or did not waste any food at all. In order to reduce plate leftovers, offering varied portions could be considered [37]. Vizzoto et al. [38] recommend reducing portion sizes if plate leftovers are left by consumers systematically. According to many researchers, the size of the plate on which the food is served also matters [39,40,41] or its shape [42].
Our research showed that in Polish food service establishments, the possibility for the consumer to choose the portion size is offered to a limited extent. Only 1/3 of the employees of food service establishments admitted that for all dishes or part of the assortment offered, it is possible to offer consumers the sale of half portions. Nguyen et al. [12], while investigating the problem of food waste in school canteens, also indicated that despite the waste, the food provider had no incentive to cut down the plate size as they followed a standard meal composition and prepared less, which would make the meals look ‘meagre’ in parents’ eyes.
We found that lettuce and salads, raw vegetable salads, bread, and fresh fruit, i.e., products of plant origin, were the most common in plate waste. This observation has environmental relevance. A study by Berardy et al. [43] attempted to link plate leftovers from vegetarian and meat meals to greenhouse gas emissions. Greenhouse gas emissions were significantly higher for meals containing meat (604.20 g CO2-equivalent) compared to vegetarian meals (356.66 g CO2-equivalent).
The vast majority (80%) of experts who participated in a Delphi technique survey rated offering different portion sizes in food service establishments as an effective solution to contribute to reducing food waste [44]. However, it should be emphasized that it requires a rethinking of menu creation and ordering processes, as well as coordination between the front and back of establishments [19]. We found that the establishments where the option to sell half portions was declared least often were caterers and cafés, while this option was most often available in snack bars, canteens, and restaurants. Our analysis found that in restaurants, consumers are more likely to ask staff about portion sizes, compared to snack bar/canteen or small food service outlet and café customers. According to Martin-Rios et al. [19], such a strategy is easy to implement in fast food and takeaway restaurants, while it is less suitable for traditional full-service restaurants, as it requires anticipation and control of inventory, creativity, and a well-thought-out pricing scale.
Considering the type of service, numerous studies indicate that customers tend to leave more food on their plates in the case of self-service compared to waiter service [5,45]. Our findings did not support this observation, as we did not show a statistically significant difference.
Almost three-quarters of Polish food service establishments offered consumers the possibility to modify the composition of the dish (about 3/4). Taking into account the form of customer service, establishments with waitstaff services and mixed services were more likely to offer this option compared to self-service establishments. In the case of à la carte services, it is easier to introduce flexibility in the menu by allowing customers to combine main courses with different side dishes [46], which can result in reduced wastage of, for example, rice, pasta, and potatoes. The results of a study by Okumus et al. [47] suggest that staff and managers of all-inclusive hotels play an important role in reducing food waste. Specifically, service staff can inform guests about portion sizes, flavors, and food allergens. They can also encourage customers to take unconsumed dishes home in takeaway boxes [48]. Restaurant customers are more likely to take an uneaten dish home compared to those at other types of establishments, according to the declarations of restaurant staff surveyed. Perhaps this is due to the potentially higher prices of dishes in restaurants compared to snack bars or canteens. The findings of Hamerman et al. [49] indicate that situational social factors influence customers’ intention to take leftovers home from restaurants. Concern for the environment positively influences the perceived likelihood of using leftovers taken home from a restaurant. However, as Filimonau and Sulyok [50] found, the proactive offer of takeaway boxes for plate leftovers was considered to be potentially harmful by the staff of food service establishments in Veszprem, as it could cause customer dissatisfaction and the consequent loss of loyal guests.
Respondents declared that consumers mostly leave products such as lettuce and salads, raw vegetable salads, bread, and fresh fruit on their plates. For these products, the proportion of always/usually responses was around 9.3%. According to the National Resources Defence Council (NRDC) and the Food and Agriculture Organisation, guests usually leave around 17% of their food unconsumed. Fruit and vegetables, seafood, cereal products, meat, and milk are regularly wasted in restaurants [51]. In contrast, Filimonau et al. [18] found that rice, noodles, vegetables, and seafood were the most commonly wasted components on consumers’ plates.

Limitations

As with any research, this study had limitations. The small sample size is one of the key drawbacks, given its restricted generalizability. The next limitation is the way of the selection of the sampling. The next survey should fulfill the condition of representativeness for the Polish food service sector. Given this limitation, as well as the fact that the survey was dominated by one type of food service establishment, i.e., restaurants, caution should be exercised when attempting to generalize the results to the entire food service sector. The next survey should be designed so that the above limitations do not occur.

5. Conclusions

Based on this study, the following was found:
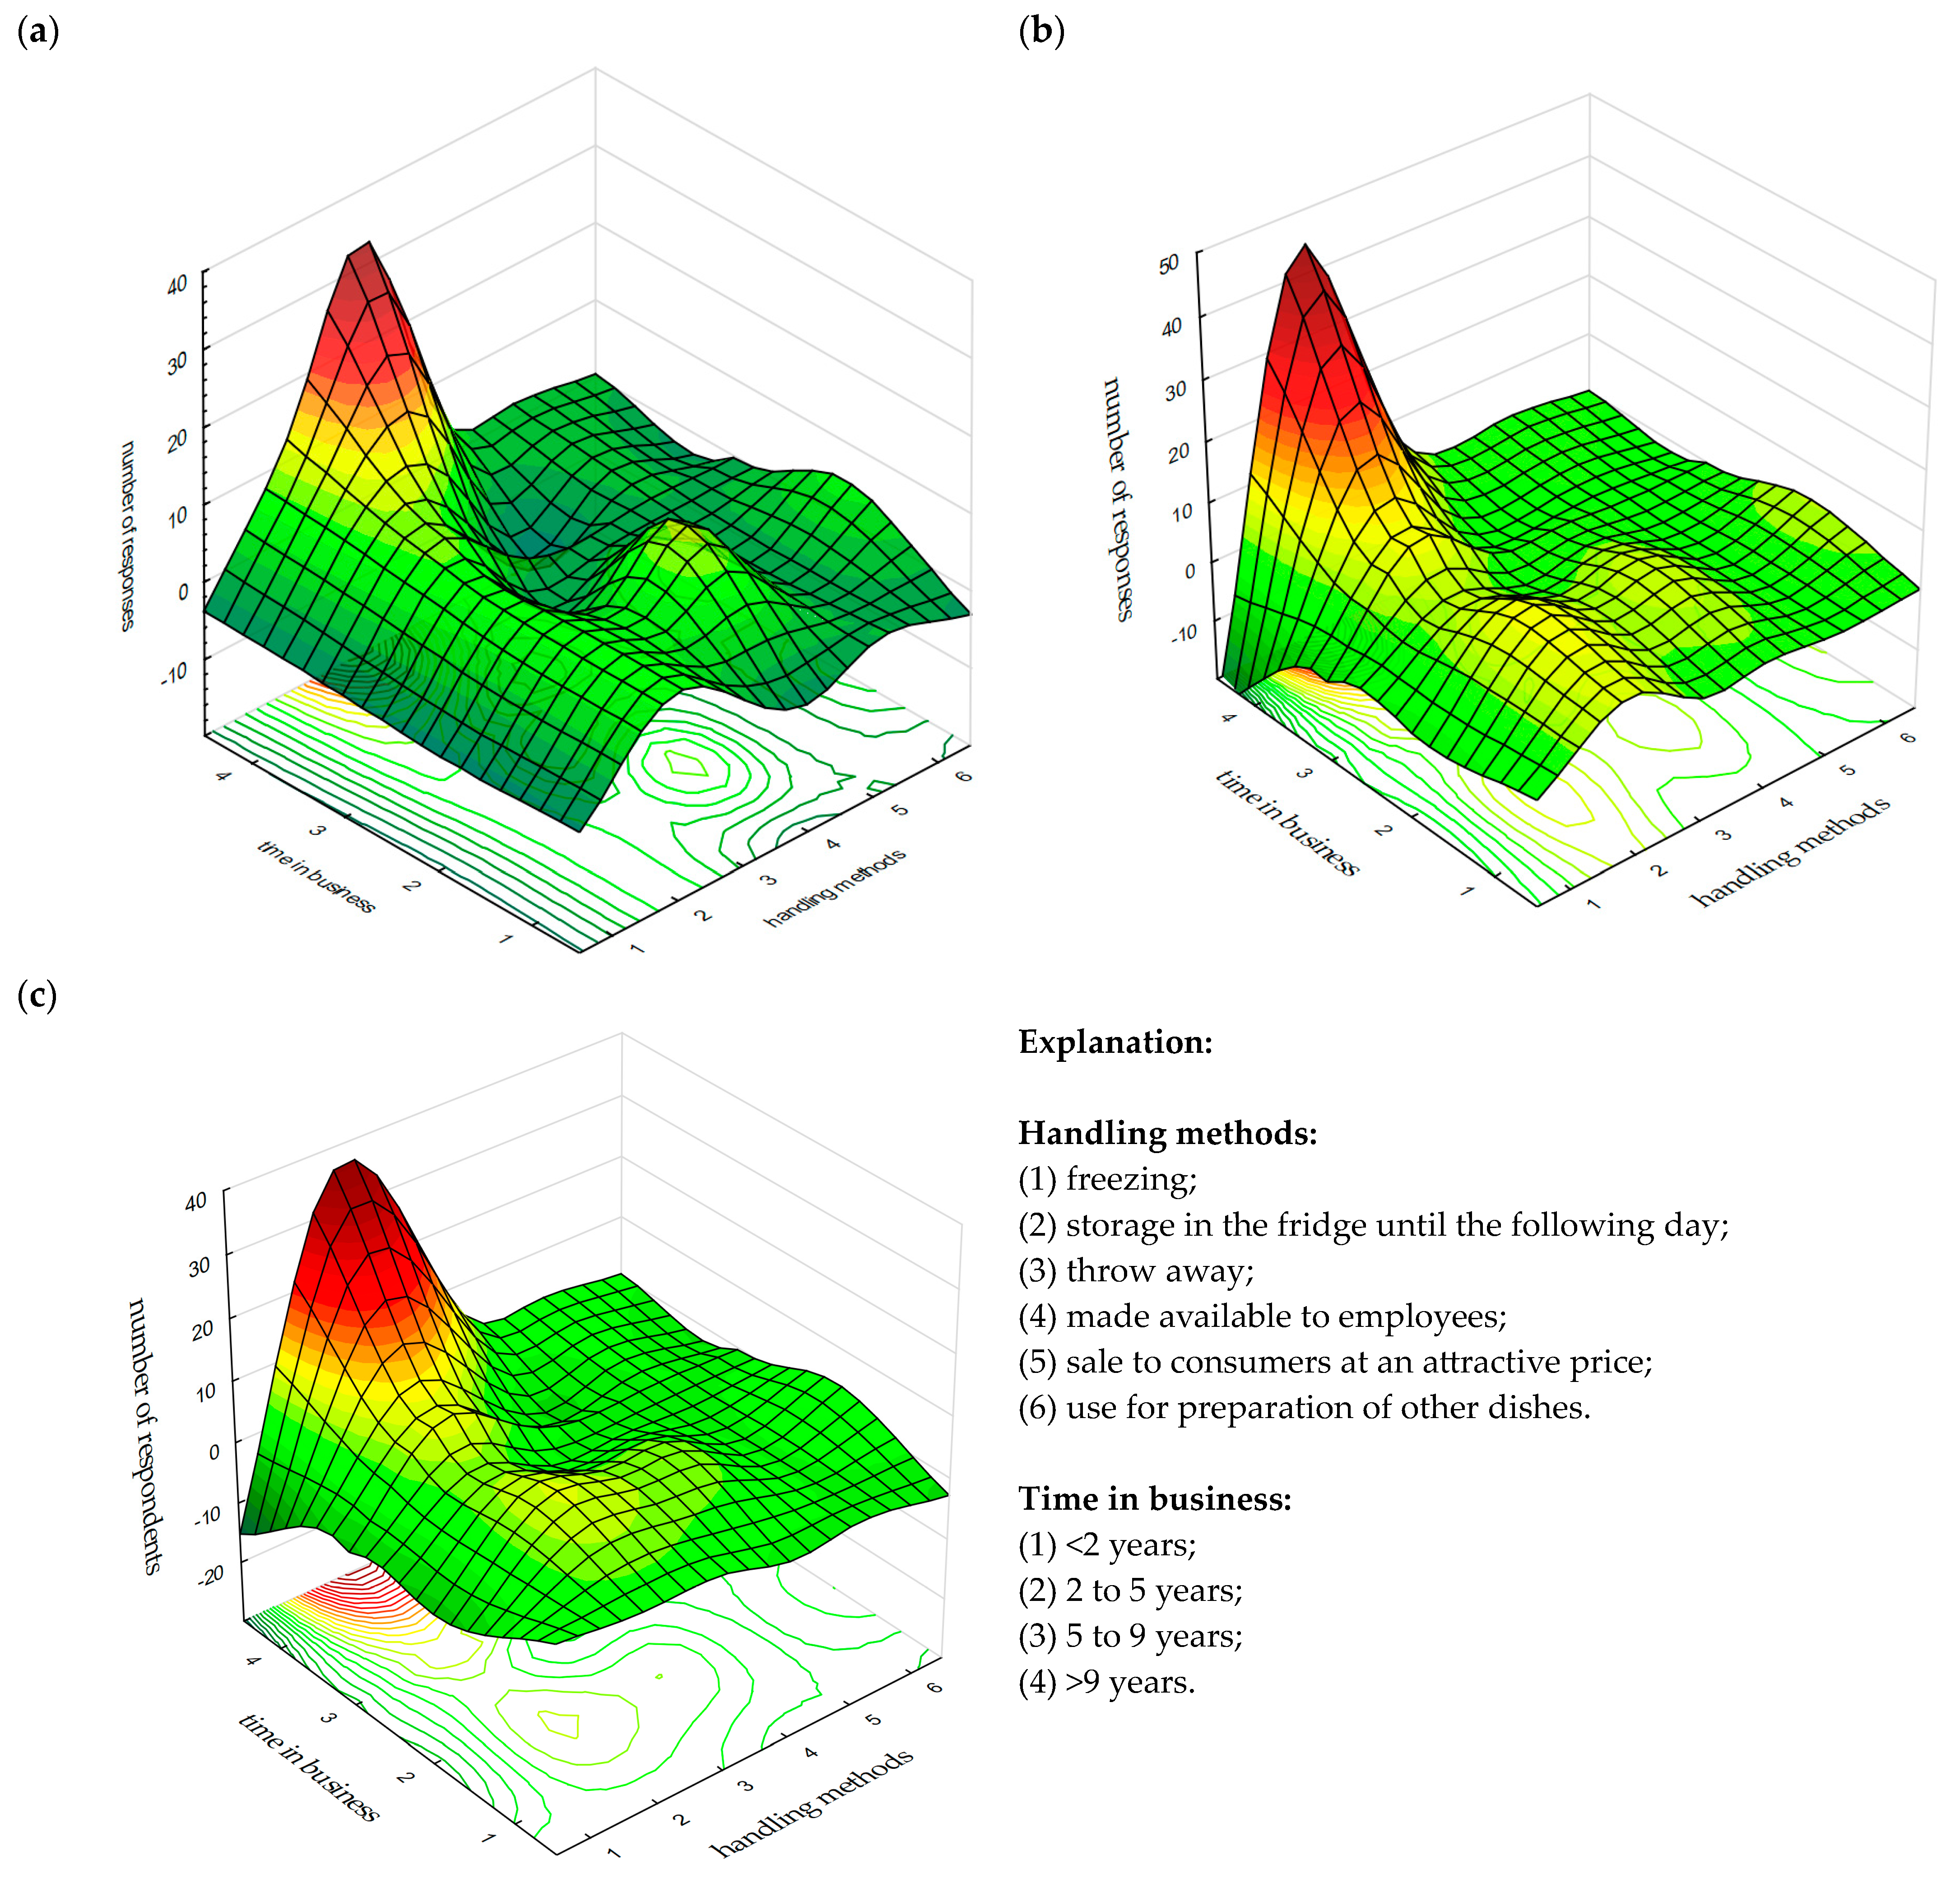
  • The dishes prepared and not served to consumers were most often kept refrigerated until the following day. Lettuces and salads were most often discarded. It was a rare practice to give such dishes to the employees of the establishment. It was found that in establishments in operation for a shorter period of time, i.e., up to five years, dishes that had not been served to customers were far more likely to be made available to the employees of these establishments;
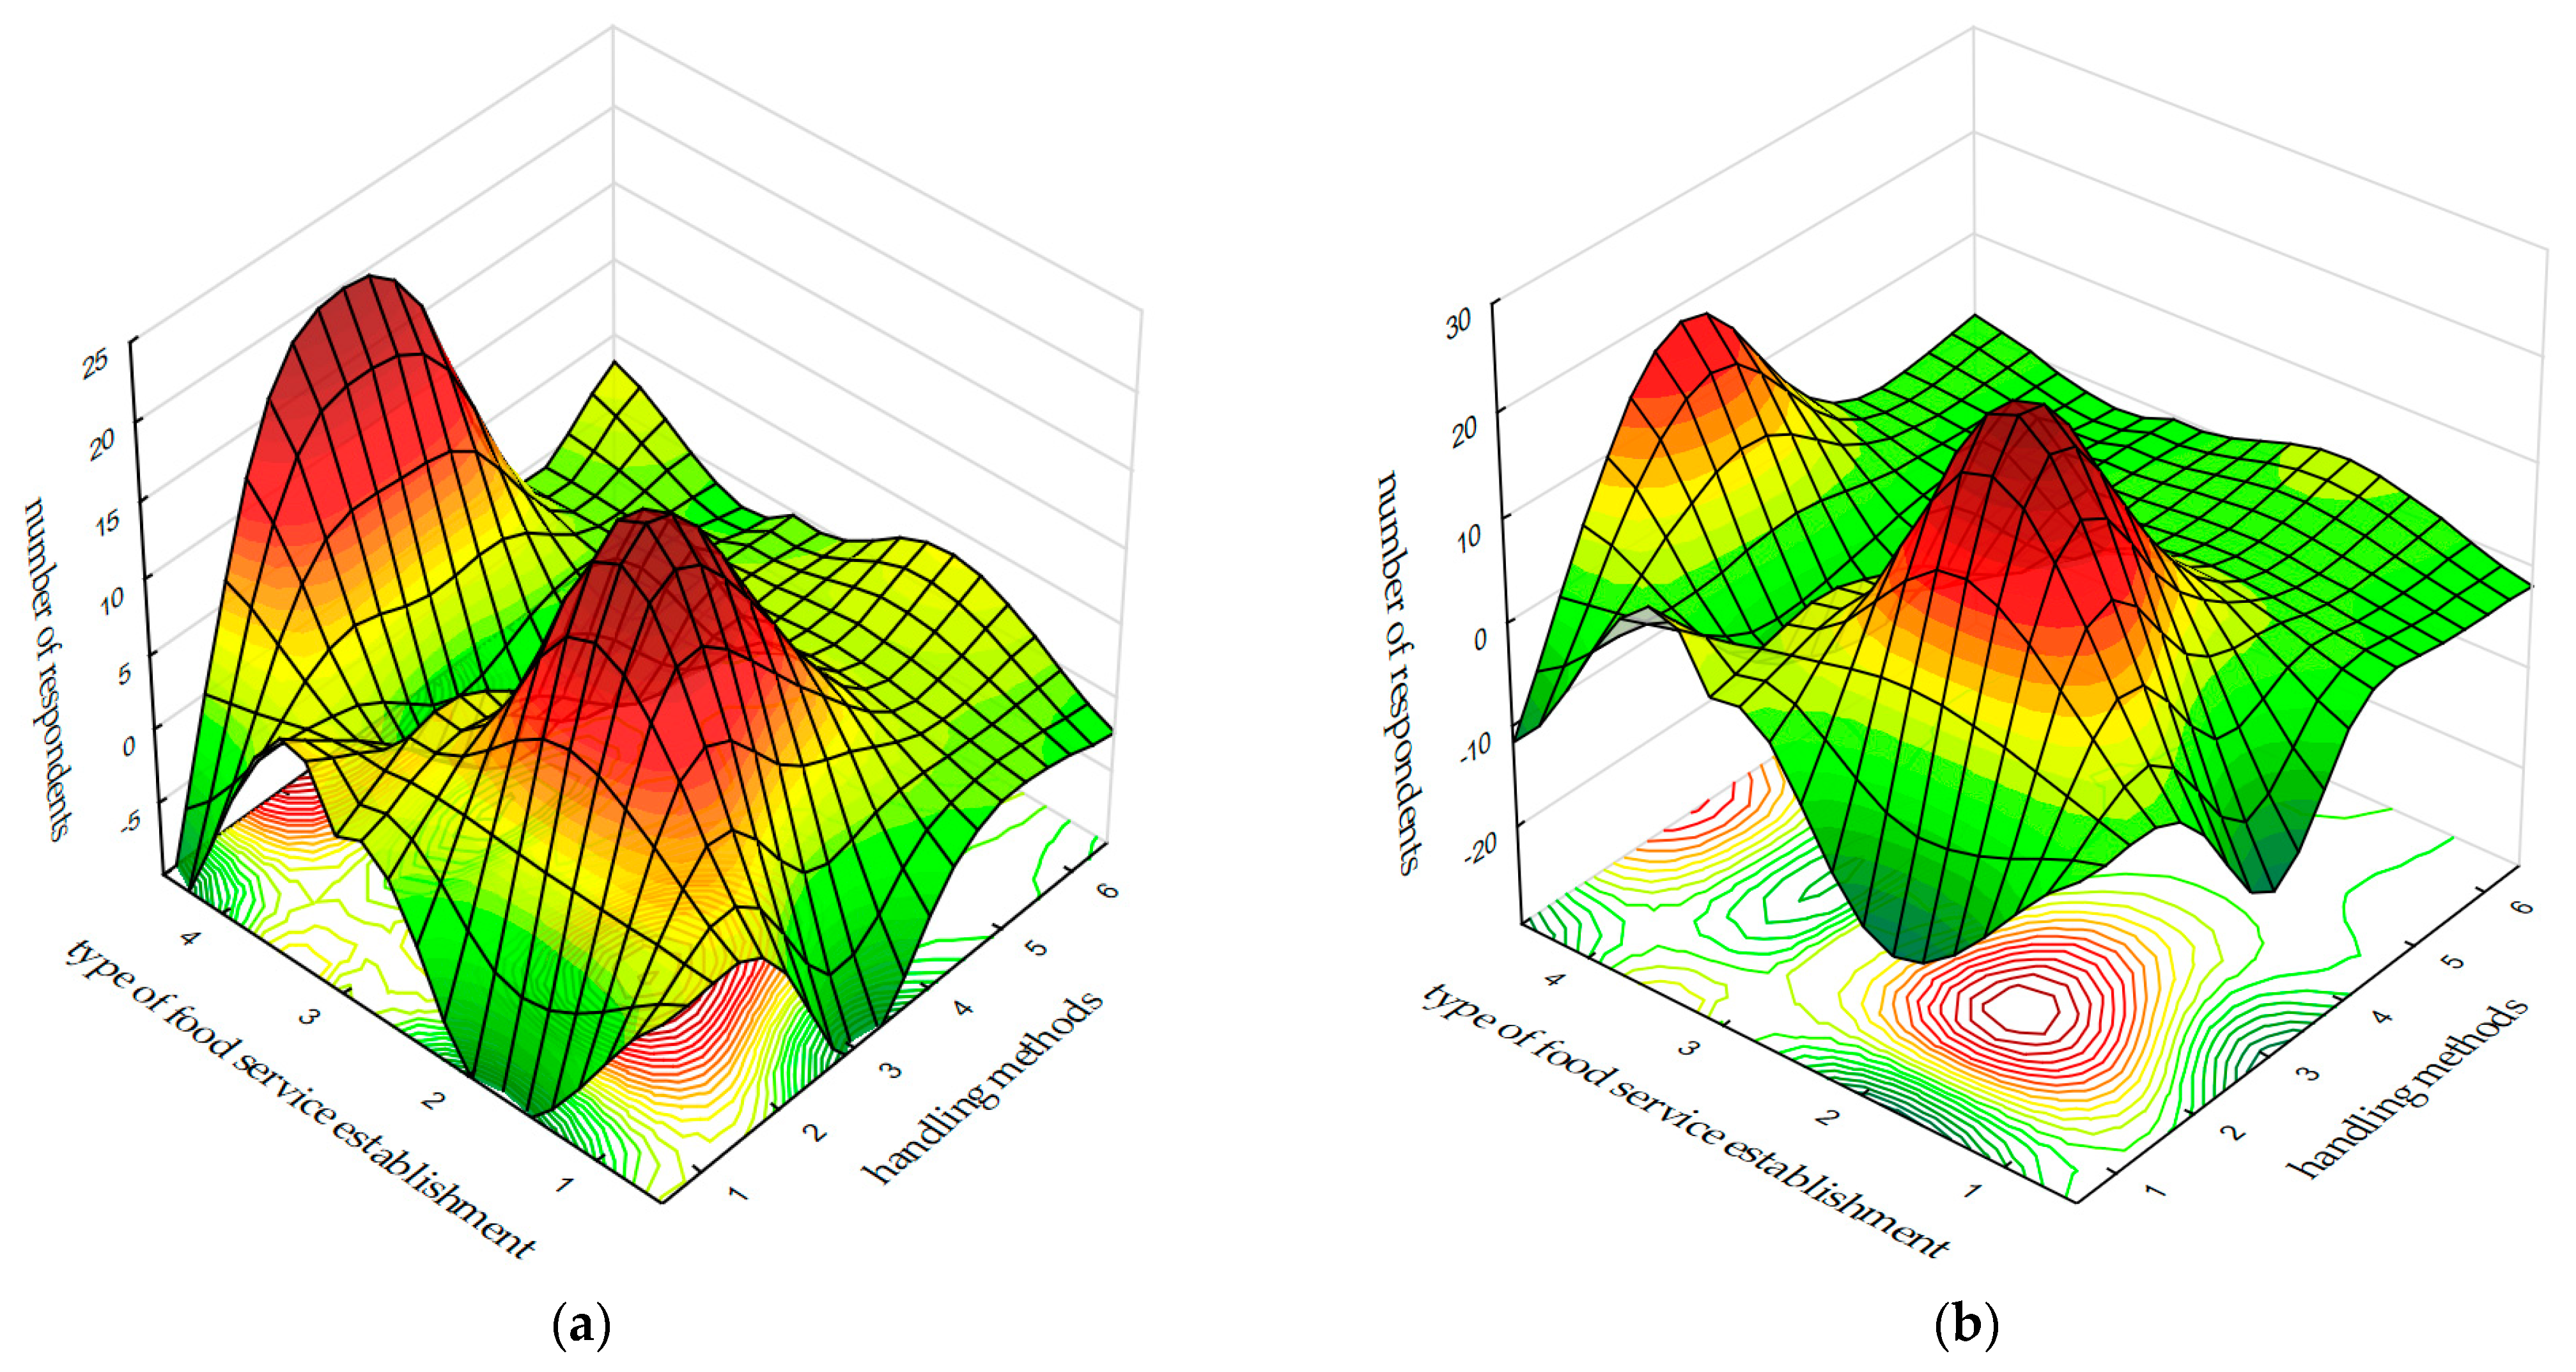
  • The second characteristic of food service establishments that was found to be important in terms of the management of over-prepared snacks and meat and/or poultry and/or fish dishes was the type of establishment. In restaurants and caterers/cafés, discarding was more often indicated as a management method for these types of dishes;
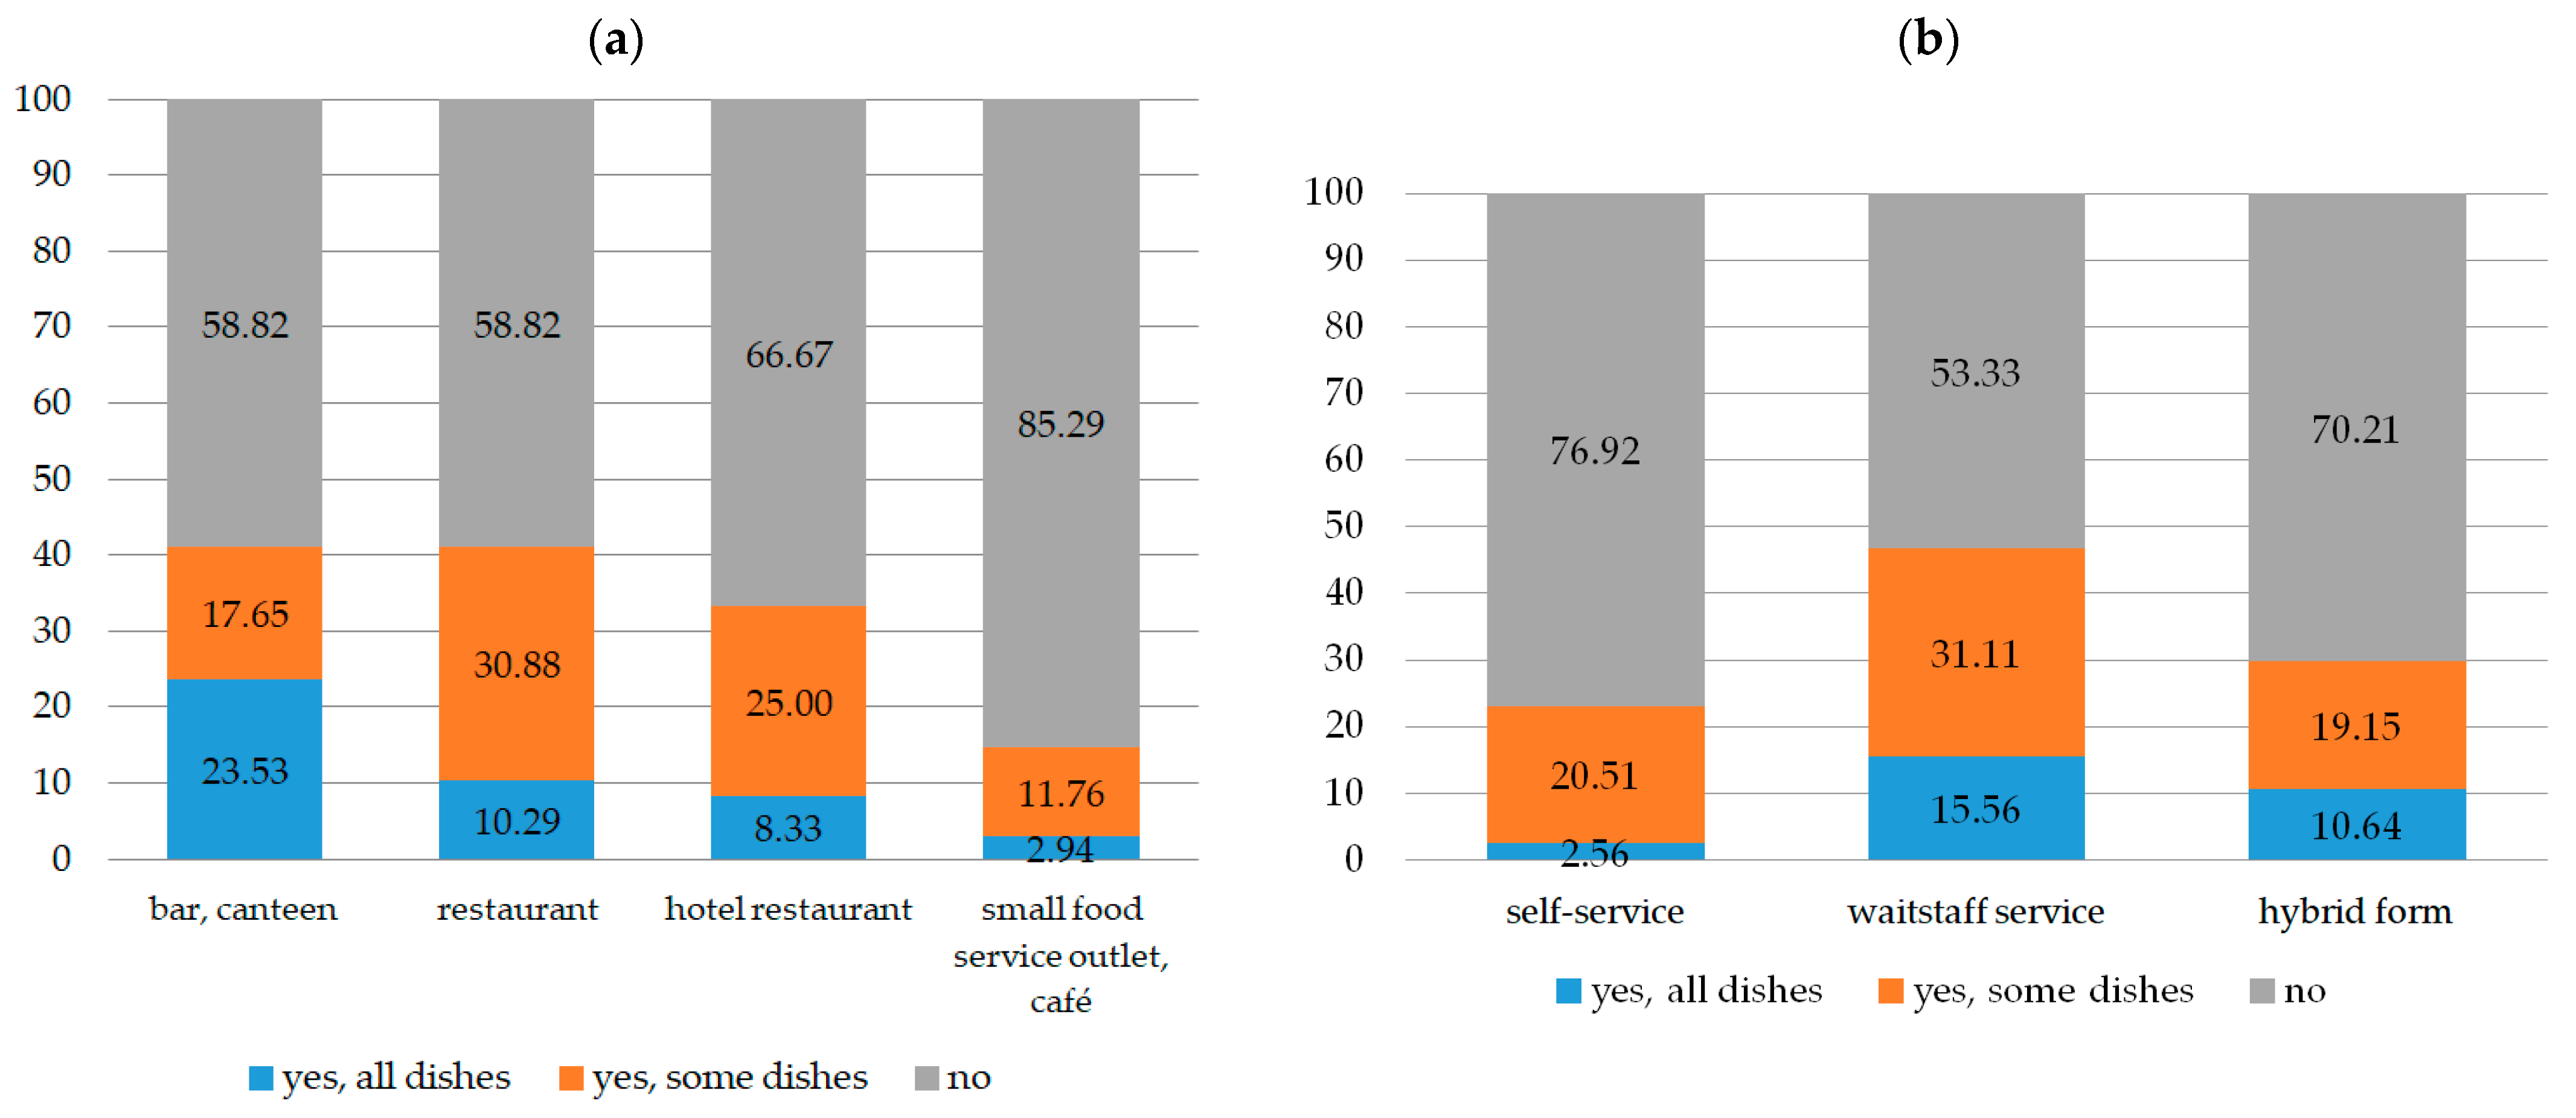
  • The majority of food service establishments were not able to sell half portions. The characteristics of food service establishments that differentiated the responses in this aspect turned out to be the type of food service establishment and the form of consumer service. It was found that the establishments where the sale of half portions was declared least frequently were small food service outlets and cafés (14.7% of responses). In snack bars, canteens, and restaurants, the percentage of establishments offering modified portion sizes was over 40%;
  • The analysis has shown that in restaurants, consumers are more likely to ask service staff about portion sizes compared to customers of snack bars/canteens or small food service outlets and cafés. Restaurant customers are also more likely to take home an uneaten dish compared to other types of establishments, according to the statements of food service staff.
In conclusion, there is great potential to reduce food waste in food service establishments, but education of both staff and customers is essential. The results of our research can be used to develop an educational campaign.

Author Contributions

Conceptualization, M.T. and B.B.; methodology, M.T. and B.B.; software, M.T.; validation, M.T. and B.B.; formal analysis, M.T. and B.B.; investigation, M.T., B.B. and A.T.-K.; data curation, M.T.; writing—original draft preparation, M.T., B.B. and A.T.-K.; writing—review and editing, B.B., M.T. and D.K.-K.; visualization, M.T.; supervision, D.K.-K. All authors have read and agreed to the published version of the manuscript.

Funding

This publication has been developed under the contract with the National Center for Research and Development (No Gospostrateg1/385753/1/NCBR/2018) for carrying out and funding a project implemented as part of the “The social and economic development of Poland in the conditions of globalizing markets—GOSPOSTRATEG” program called “Developing a system for monitoring wasted food and an effective program to rationalize losses and reduce food wastage” (acronym PROM).

Institutional Review Board Statement

Not applicable.

Informed Consent Statement

Not applicable.

Data Availability Statement

The data presented in this study are available on request from the corresponding author.

Conflicts of Interest

The authors declare no conflicts of interest.

References

  1. Wiatrowski, M.; Czarniecka-Skubina, E.; Trafiałek, J. Consumer Eating Behavior and Opinions about the Food Safety of Street Food in Poland. Nutrients 2021, 13, 594. [Google Scholar] [CrossRef] [PubMed]
  2. Tomaszewska, M.; Bilska, B.; Kołożyn-Krajewska, D. Behavior of Polish Consumers in Relation to Meals Ordered in Food Service Establishments in the Context of Plate Waste. Sustainability 2022, 14, 8153. [Google Scholar] [CrossRef]
  3. Rynek Gastronomiczny w Polsce—Raport 2023. Available online: https://issuu.com/brogmarketing/docs/rg_2023_calosc_5 (accessed on 25 April 2024).
  4. UNEP Food Waste Index Report 2024 Key Messages. Available online: https://wedocs.unep.org/bitstream/handle/20.500.11822/45275/Food-Waste-Index-2024-key-messages.pdf?sequence=1&isAllowed=y (accessed on 30 April 2024).
  5. Pirani, S.I.; Arafat, H.A. Reduction of food waste generation in the hospitality industry. J. Clean. Prod. 2016, 132, 129–145. [Google Scholar] [CrossRef]
  6. WRAP. UK Food Waste & Food Surplus—Key Facts. Banbury, UK. 2023. Available online: https://www.wrap.ngo/sites/default/files/2024-01/WRAP-Food-Surplus-and-Waste-in-the-UK-Key-Facts%20November-2023.pdf (accessed on 30 April 2024).
  7. Malefors, C.; Callewaert, P.; Hansson, P.-A.; Hartikainen, H.; Pietiläinen, O.; Strid, I.; Strotmann, C.; Eriksson, M. Towards a Baseline for Food-Waste Quantification in the Hospitality Sector—Quantities and Data Processing Criteria. Sustainability 2019, 11, 3541. [Google Scholar] [CrossRef]
  8. Çetin, M. Reducing plate waste in all-inclusive resorts: Strategy, precaution and barriers. J. Multidiscip. Acad. Tour. 2024, 9, 145–156. [Google Scholar]
  9. Yahia, E.M.; Mourad, M. Food waste at the consumer level. In Preventing Food Losses and Waste to Achieve Food Security and Sustainability; Yahia, E.M., Ed.; Burleigh Dodds Science Publishing: Cambridge, UK, 2019. [Google Scholar]
  10. Tomaszewska, M.; Bilska, B.; Kołożyn-Krajewska, D. Estimation of the scale of food waste in hotel foodservices—A case study. Sustainability 2021, 13, 421. [Google Scholar] [CrossRef]
  11. Beretta, C.; Hellweg, S. Potential environmental benefits from food waste prevention in the food service sector. Resour. Conserv. Recycl. 2019, 147, 169–178. [Google Scholar] [CrossRef]
  12. Nguyen, T.; van den Berg, M.; Nguyen, M. Food waste in primary schools: Evidence from peri-urban Viet Nam. Appetite 2023, 183, 106484. [Google Scholar] [CrossRef] [PubMed]
  13. Williams, P.; Walton, K. Plate waste in hospitals and strategies for change. e-SPEN Eur. E-J. Clin. Nutr. Metab. 2011, 6, 235–241. [Google Scholar] [CrossRef]
  14. Priefer, C.; Jörissen, J.; Bräutigam, K.R. Food waste prevention in Europe—A cause-driven approach to identify the most relevant leverage points for action. Resour. Conserv. Recycl. 2016, 109, 155–165. [Google Scholar] [CrossRef]
  15. Dhir, A.; Talwar, S.; Kaur, P.; Malibari, A. Food waste in hospitality and food services: A systematic literature review and framework development approach. J. Clean. Prod. 2020, 270, 122861. [Google Scholar] [CrossRef]
  16. Goh, E.; Jie, F. To waste or not to waste: Exploring motivational factors of Generation Z hospitality employees towards food wastage in the hospitality industry. Int. J. Hosp. Manag. 2019, 80, 126–135. [Google Scholar] [CrossRef]
  17. Filimonau, V.; Matute, J.; Kubal-Czerwinska, M.; Krzesiwo, K.; Mika, M. The determinants of consumer engagement in restaurant food waste mitigation in Poland: An exploratory study. J. Clean. Prod. 2020, 247, 20. [Google Scholar] [CrossRef]
  18. Filimonau, V.; Nghiem, V.N.; Wang, L. Food waste management in ethnic food restaurants. Int. J. Hosp. Manag. 2021, 92, 102731. [Google Scholar] [CrossRef]
  19. Martin-Rios, C.; Demen-Meier, C.; Gössling, S.; Cornuz, C. Food waste management innovations in the foodservice industry. Waste Manag. 2018, 79, 196–206. [Google Scholar] [CrossRef] [PubMed]
  20. Rodrigues, M.; Miguéis, V.; Freitas, S.; Machado, T. Machine learning models for short-term demand forecasting in food catering services: A solution to reduce food waste. J. Clean. Prod. 2024, 435, 140265. [Google Scholar] [CrossRef]
  21. Jayasekara, A.P.; McGrath, D.; Kravchuk, O.; Zhou, S.J.; Morris, H. Mapping pre-consumer food waste in quick service restaurants on a university campus: Two Australian case studies. J. Clean. Prod. 2024, 434, 139978. [Google Scholar] [CrossRef]
  22. Guimarães, N.S.; Reis, M.G.; Fontes, L.d.A.; Zandonadi, R.P.; Botelho, R.B.A.; Alturki, H.A.; Saraiva, A.; Raposo, A. Plate Food Waste in Food Services: A Systematic Review and Meta-Analysis. Nutrients 2024, 16, 1429. [Google Scholar] [CrossRef] [PubMed]
  23. Etuah, S.; Adams, F.; Mensah, J.O.; Osei, A.A.A.; Mensah, A.; Liu, Z.; Aidoo, R.; Effah, P.; Asamoah, K.; Kwakye, E.B.; et al. Waste generation and management in the food service sector: Evidence from Ghana. Clean. Circ. Bioecon. 2023, 6, 100067. [Google Scholar] [CrossRef]
  24. Gładysz, B.; Buczacki, A.; Haskins, C. Lean Management Approach to Reduce Waste in HoReCa Food Services. Resources 2020, 9, 144. [Google Scholar] [CrossRef]
  25. Bilska, B.; Tomaszewska, M.; Kołożyn-Krajewska, D. The Management of Meals in FoodService Establishments in the Context of FoodWaste—Results of Focus Group Interviews with Employees and Owners. Sustainability 2022, 14, 9258. [Google Scholar] [CrossRef]
  26. Zborowski, M.; Mikulec, A. Dietary Catering: The Perfect Solution for Rational Food Management in Households. Sustainability 2022, 14, 9174. [Google Scholar] [CrossRef]
  27. Markowska, J.; Polak, E.; Drabent, A.; Tyfa, A. Innovative Management of Vegetable Outgrades as a Means of Food Loss and Waste Reduction. Sustainability 2022, 14, 12363. [Google Scholar] [CrossRef]
  28. Silvennoinen, K.; Heikkil, L.; Katajajuuri, J.-M.; Reinikainen, A. Food waste volume and origin: Case studies in the Finnish food service sector. Waste Manag. 2015, 46, 140–145. [Google Scholar] [CrossRef]
  29. Smith, S.L.; Cunningham-Sabo, L. Food Choice, Plate Waste and Nutrient Intake of Elementary- and Middle-School Students Participating in the US National School Lunch Program; Cambridge University Press: Cambridge, UK, 2014; Volume 17, pp. 1255–1263. [Google Scholar]
  30. McAdams, B.; von Massow, M.; Gallant, M.; Hayhoe, M.-A. A cross industry evaluation of food waste in restaurants. J. Foodserv. Bus. Res. 2019, 22, 449–466. [Google Scholar] [CrossRef]
  31. Aires, C.; Saraiva, C.; Fontes, M.C.; Moreira, D.; Moura-Alves, M.; Gonçalves, C. Food Waste and Qualitative Evaluation of Menus in Public University Canteens—Challenges and Opportunities. Foods 2021, 10, 2325. [Google Scholar] [CrossRef] [PubMed]
  32. Sakaguchi, L.; Pak, N.; Potts, M.D. Tackling the issue of food waste in restaurants: Options for measurement method, reduction and behavioral change. J. Clean. Prod 2018, 180, 430–436. [Google Scholar] [CrossRef]
  33. Diekmann, L.; Germelmann, C.C. Leftover consumption as a means of food waste reduction in public space? Qualitative insights from online discussions. Sustainability 2021, 13, 13564. [Google Scholar] [CrossRef]
  34. Betz, A.; Buchli, J.; Göbel, C.; Müller, C. Food waste in the Swiss food service industry–Magnitude and potential for reduction. Waste Manag. 2015, 35, 218–226. [Google Scholar] [CrossRef]
  35. Carvalho, J.G.; Lima, J.P.M.; da Rocha, A.M.C.N. Food waste and consumer satisfaction with the food service of Hotel and Tourism School of Coimbra, Portugal. Demetra Food Nutr. Health 2015, 10, 405–419. [Google Scholar]
  36. Malefors, C.; Svensson, E.; Eriksson, M. Automated quantification tool to monitor plate waste in school canteens. Resour. Conserv. Recycl. 2024, 200, 107288. [Google Scholar] [CrossRef]
  37. Berkowitz, S.; Marquart, L.; Mykerezi, E.; Degeneffe, D.; Reicks, M. Reduced-portion entrées in a worksite and restaurant setting: Impact on food consumption and waste. Public Health Nutr. 2016, 19, 3048–3054. [Google Scholar] [CrossRef] [PubMed]
  38. Vizzoto, F.; Testa, F.; Iraldoc, F. Strategies to reduce food waste in the food services sector: A systematic review. Int. J. Hosp. Manag. 2021, 95, 102933. [Google Scholar] [CrossRef]
  39. Thiagarajah, K.; Getty, V.M. Impact on plate waste of switching from a tray to a trayless delivery system in a university dining hall and employee response to the switch. J. Acad. Nutr. Diet. 2013, 113, 141–145. [Google Scholar] [CrossRef] [PubMed]
  40. Obersteiner, G.; Gollnow, S.; Eriksson, M. Carbon footprint reduction potential of waste management strategies in tourism. Environ. Dev. 2021, 39, 100617. [Google Scholar] [CrossRef]
  41. Qi, D.; Li, R.; Penn, J.; Houghtaling, B.; Prinyawiwatkul, W.; Roe, B.E. Nudging greater vegetable intake and less food waste: A field experiment. Food Policy 2022, 112, 102369. [Google Scholar] [CrossRef]
  42. Richardson, R.; Prescott, M.P.; Ellison, B. Impact of plate shape and size on individual food waste in a university dining hall. Resour. Conserv. Recycl. 2021, 168, 105293. [Google Scholar] [CrossRef]
  43. Berardy, A.; Egan, B.; Birchfield, N.; Sabaté, J.; Lynch, H. Comparison of Plate Waste between Vegetarian and Meat-Containing Meals in a Hospital Setting: Environmental and Nutritional Considerations. Nutrients 2022, 11, 1174. [Google Scholar] [CrossRef]
  44. Martin-Rios, C.; Meier, C.D.; Pasamar, S. Sustainable waste management solutions for the foodservice industry: A Delphi study. Waste Manag. Res. 2022, 40, 1412–1423. [Google Scholar] [CrossRef]
  45. Ellison, B.; Savchenko, O.; Nikolaus, C.J.; Duff, B.R. Every plate counts: Evaluation of a food waste reduction campaign in a university dining hall. Resour. Conserv. Recycl. 2019, 144, 276–284. [Google Scholar] [CrossRef]
  46. Neff, R.A.; Spiker, M.L.; Truant, P.L. Wasted food: US consumers’ reported awareness, attitudes, and behaviors. PLoS ONE 2015, 10, e0127881. [Google Scholar] [CrossRef] [PubMed]
  47. Okumus, B.; Taheri, B.; Giritlioglu, I.; Gannon, M.J. Tackling food waste in all-inclusive resort hotels. Int. J. Hosp. Manag 2020, 88, 102543. [Google Scholar] [CrossRef]
  48. Sirieix, L.; Lala, J.; Kocmanova, K. Understanding the antecedents of consumers’ attitudes towards doggy bags in restaurants: Concern about food waste, culture, norms and emotions. J. Retail. Consum. Serv. 2017, 34, 153–158. [Google Scholar] [CrossRef]
  49. Hamerman, E.J.; Rudell, F.; Martins, C.M. Factors that predict taking restaurant leftovers: Strategies for reducing food waste. J Consumer Behav. 2018, 17, 94–104. [Google Scholar] [CrossRef]
  50. Filimonau, V.; Judit Sulyok, J. ‘Bin it and forget it!’: The challenges of food waste management in restaurants of a mid-sized Hungarian city. Tour. Manag. Perspect. 2021, 37, 100759. [Google Scholar] [CrossRef]
  51. Ferdman, R.A. Americans Throw Out More Food than Plastic, Paper, Metal, and Glass. The Washington Post. 2014. Available online: http://www.washingtonpost.com/blogs/wonkblog/wp/2014/09/23/americans-throw-out-more-food-than-plastic-paper-metal-or-glass/ (accessed on 30 April 2024).
Figure 1. The conceptual research model adopted in the work.
Sustainability 16 06631 g001
Figure 2. Distribution of respondents’ answers concerning the management of (a) cold and hot snacks, (b) soups/brews/sauces, and (c) meat and/or poultry and/or fish dishes according to the time in business [years] of the food service establishment.
Sustainability 16 06631 g002
Figure 3. Distribution of respondents’ answers concerning the management of (a) cold and hot snacks and (b) meat and/or poultry and/or fish dishes according to type of food service establishment. Explanation: Handling methods: 1—freezing; 2—storage in the fridge until the following day; 3—throw away; 4—made available to employees; 5—sale to consumers at an attractive price; 6—use for preparation of other dishes. Type of Food Service Establishment: 1—bar, canteen; 2—restaurant; 3—hotel restaurant; 4—small food service outlet, café.
Sustainability 16 06631 g003
Figure 4. Summary of responses [%] regarding the possibility of selling half portions, taking into account (a) type of food service establishment and (b) type of consumer service.
Sustainability 16 06631 g004
Figure 5. Summary of responses [%] regarding the possibility of modifying the composition of the dish, taking into account (a) type of food service establishment, (b) type of consumer service, and (c) time in business.
Sustainability 16 06631 g005
Table 1. The characteristics of food service establishments (n = 131).
CharacteristicDescriptionn%
Type of food service establishment
(type of FSE)
bar, canteen1712.98
restaurant6851.91
hotel restaurant129.16
small food service outlet, café3425.95
Type of customer service
(type of CS)
self-service3929.77
waitstaff service4534.35
hybrid form4735.88
Time in business [years]
(TimeB)
<22619.85
2–53123.66
5–91712.98
>95743.51
Average number of customers [per day]
(average NC)
up to 501914.50
51–1003627.48
101–2002922.14
201–4001813.74
401–10001612.21
more than 1000139.92
Table 2. One-way ANOVA regarding the influence of selected characteristics of food service establishments on the handling of ready-made dishes/dish components that were not served to consumers (n = 131).
Ready-Made Dishes/Dish ComponentsHandling MethodsNo., % of
Respondents
One-Way ANOVA Results
[F Ratio/p Value] **
N%Type of FSEType of CSTimeBAverage NC
Lettuce and salads
(n = 82)
  • freezing
00.002.57/0.061.65/0.201.41/0.251.08/0.40
  • storage in the fridge until the following day
3239.02
  • throw away
3846.34
  • made available to employees
89.76
  • sale to consumers at an attractive price
22.44
  • use for preparation of other dishes
22.44
Raw vegetable salads
(n = 75)
  • freezing
00.001.99/0.120.51/0.600.65/0.580.93/0.58
  • storage in the fridge until the following day
3648.00
  • throw away
2938.67
  • made available to employees
810.67
  • sale to consumers at an attractive price
22.67
  • use for preparation of other dishes
00.00
Cold and hot snacks
(n = 85)
  • freezing
33.534.11/0.01 *1.29/0.286.60/0.00 *0.67/0.89
  • storage in the fridge until the following day
3743.53
  • throw away
2832.94
  • made available to employees
1416.47
  • sale to consumers at an attractive price
11.18
  • use for preparation of other dishes
22.35
Soups, brews, sauces
(n = 87)
  • freezing
33.451.57/0.200.76/0.474.35/0.01 *0.59/0.95
  • storage in the fridge until the following day
5563.22
  • throw away
1618.39
  • made available to employees
910.34
  • sale to consumers at an attractive price
11.15
  • use for preparation of other dishes
33.45
Meat and/or poultry and/or fish dishes
(n = 93)
  • freezing
66.453.24/0.03 *0.10/0.914.24/0.01 *0.63/0.93
  • storage in the fridge until the following day
4750.54
  • throw away
2931.18
  • made available to employees
88.60
  • sale to consumers at an attractive price
11.08
  • use for preparation of other dishes
22.15
Flour dishes
(n = 79)
  • freezing
78.862.42/0.071.12/0.330.75/0.530.43/0.99
  • storage in the fridge until the following day
4050.63
  • throw away
2025.32
  • made available to employees
810.13
  • sale to consumers at an attractive price
11.27
  • use for preparation of other dishes
33.80
** Questionnaires with the answer ‘not applicable’ were excluded from the ANOVA analysis. * denotes a significant level of 5%.
Table 3. Share [%] of handling methods for prepared ready-made dishes/dish components that were not served to consumers depending on the time in business [years].
Ready-Made Dishes/Dish ComponentsHandling MethodsTime in Business [Years]
<2 Years2–5 Years5–9 Years>9 Years
Cold and hot snacks
  • freezing
0.000.007.695.41
  • storage in the fridge until the following day
53.8531.8269.2337.84
  • throw away
23.0813.6423.0851.35
  • made available to employees
23.0845.450.002.70
  • sale to consumers at an attractive price
0.000.000.002.70
  • use for preparation of other dishes
0.009.090.000.00
Soups, brews, sauces
  • freezing
6.670.000.004.88
  • storage in the fridge until the following day
53.3344.4476.9270.73
  • throw away
13.3316.6715.3821.95
  • made available to employees
20.0027.787.690.00
  • sale to consumers at an attractive price
0.000.000.002.44
  • use for preparation of other dishes
6.6711.110.000.00
Meat and/or poultry and/or fish dishes
  • freezing
15.380.006.676.67
  • storage in the fridge until the following day
38.4640.0066.6753.33
  • throw away
30.7725.0026.6735.56
  • made available to employees
15.3825.000.002.22
  • sale to consumers at an attractive price
0.000.000.002.22
  • use for preparation of other dishes
0.0010.000.000.00
Table 4. Share [%] of handling methods for prepared ready-made dishes/dish components that were not served to consumers depending on the type of food service establishment.
Dishes/Dish ComponentsHandling MethodsType of Food Service Establishments
Bar,
Canteen
RestaurantHotel RestaurantSmall Food Service Outlet, Café
Cold and hot snacks
  • freezing
8.330.0022.220.00
  • storage in the fridge until the following day
66.6738.6455.5635.00
  • throw away
16.6738.6422.2235.00
  • made available to employees
8.3315.910.0030.00
  • sale to consumers at an attractive price
0.002.270.000.00
  • use for preparation of other dishes
0.004.550.000.00
Meat and/or poultry and/or fish dishes
  • freezing
7.143.6425.000.00
  • storage in the fridge until the following day
78.5747.2750.0033.33
  • throw away
7.1434.5525.0050.00
  • made available to employees
7.149.090.0016.67
  • sale to consumers at an attractive price
0.001.820.000.00
  • use for preparation of other dishes
0.003.640.000.00
Table 5. One-way ANOVA regarding the influence of selected characteristics of food service establishments on the options offered for the sale of ready-made dishes (n = 131).
Sale OptionAnswer OptionsNo., % of
Respondents
One-Way ANOVA Results
[F Ratio/p Value] **
N%Type of FSEType of CSTimeBAverage NC
Sale of half portions
  • yes, we have this option for all dishes
139.922.69/0.05 *3.31/0.04 *1.83/0.140.55/0.98
  • yes, but only for some dishes
3123.66
  • no, we do not have this option
8766.41
Modification of the dish composition
  • yes, we have this option for all dishes
5541.988.14/0.00 *4.23/0.02 *2.73/0.05 *0.97/0.53
  • yes, but only for some dishes
4433.59
  • no, we do not have this option
3224.43
* denotes a significant level of 5%; ** Questionnaires with the answer ‘not applicable’ were excluded from the ANOVA analysis.
Table 6. Values of descriptive statistics on the frequency of consumers’ behavior toward ready-made dishes ordered in food service establishments (n = 131).
StageAnswer OptionsFrequency *Std. Dev.Mode% Mode
MeanMin.Max.
before consumption
  • asking about portion size before ordering
3.371.005.001.003.0043.51
  • ordering half portions
4.141.005.000.955.0046.56
after consumption
  • taking an unfinished dish home
3.111.005.000.973.0043.51
  • leaving an uneaten dish on a plate (plate leftovers)
3.191.005.000.683.0064.12
* Direction on the scale: 1—always; 2—usually; 3—sometimes; 4—rarely; 5—never.
Table 7. One-way ANOVA for mean values in frequency (freq.) of consumer behavior toward ready meals ordered in food service establishments. Significance level—0.05, post hoc analysis was performed using the least significant difference (LSD) test.
GroupClassificationConsumer Behavior toward Ready Meals Ordered in FSE
Asking about Portion Size before OrderingOrdering Half PortionsTaking an Unfinished Dish HomeLeaving an Uneaten Dish on a Plate (Plate Leftovers)
Freq. *F-RatioFreq.F-RatioFreq.F-RatioFreq.F-Ratio
Type of FSEbar, canteen3.50 a5.93 **3.53 a4.13 **3.35 a8.76 **3.240.35
restaurant3.05 b4.10 b2.74 b3.13
hotel restaurant3.26 ab4.27 b3.50 a3.25
small food service outlet, café3.83 a4.47 b3.62 a3.26
Type of CSself-service3.380.014.130.013.101.263.180.48
waitstaff service3.364.162.963.27
hybrid form3.384.133.283.13
TimeB<23.041.384.161.503.000.483.350.64
2–53.484.423.293.19
5–93.593.883.063.18
>93.404.053.093.12
Average NCup to 503.470.974.00 ab2.78 **3.531.443.321.00
51–1003.643.86 a3.223.31
101–2003.214.36 b2.963.21
201–4003.324.56 b3.053.16
401–10003.254.44 b3.063.00
more than 10003.083.69 a2.692.92
a,b—an identical letter at the arithmetic mean value means that there are no significant differences (homogeneous arithmetic mean groups). * direction on the scale: 1—always, 2—usually, 3—sometimes; 4—rarely, 5—never; ** denotes a significant level of 5%.
Table 8. Descriptive statistics values for the frequency of leaving individual dishes as plate leftovers.
Ready-Made Dishes/Dish ComponentsAnswer OptionsShare of Responses [%]Frequency *Std. Dev.Mode% Mode
MeanMin.Max.
lettuce and salads (n = 104)always/usually13.743.511.005.001.064.0035.58
sometimes22.90
occasionally/never42.74
not applicable20.61------
raw vegetable salads (n = 95)always/usually9.923.601.005.001.073.0033.68
sometimes24.43
occasionally/never38.17
not applicable27.48------
soups, brews, sauces (n = 93)always/usually4.583.911.005.000.924.0040.86
sometimes16.79
occasionally/never49.62
not applicable29.01------
meat and/or poultry warm dishes
(n = 101)
always/usually5.353.661.005.000.874.0043.56
sometimes25.95
occasionally/never45.80
not applicable22.90------
fish warm dishes
(n = 87)
always/usually3.813.951.005.000.914.0040.23
sometimes15.27
occasionally/never47.33
not applicable33.59------
cakes, desserts
(n = 107)
always/usually7.643.741.005.000.954.0040.19
sometimes22.90
occasionally/never51.14
not applicable18.32------
cheeses (rennet/blue)
(n = 64)
always/usually3.054.161.005.000.935.0042.19
sometimes6.11
occasionally/never39.69
not applicable51.15------
cold cuts
(n = 62)
always/usually3.054.181.005.000.955.0045.16
sometimes6.11
occasionally/never38.16
not applicable52.67------
bread
(n = 90)
always/usually6.873.741.005.000.944.0041.11
sometimes18.32
occasionally/never43.51
not applicable31.30------
fresh fruit
(n = 93)
always/usually6.873.921.005.001.024.0035.48
sometimes14.50
occasionally/never49.62
not applicable29.01------
* direction on the scale: 1—always, 2—usually, 3—sometimes; 4—rarely, 5—never.
Disclaimer/Publisher’s Note: The statements, opinions and data contained in all publications are solely those of the individual author(s) and contributor(s) and not of MDPI and/or the editor(s). MDPI and/or the editor(s) disclaim responsibility for any injury to people or property resulting from any ideas, methods, instructions or products referred to in the content.

