
Using DPF to Control Particulate Matter Emissions from Ships to Ensure the Sustainable Development of the Shipping Industry


Abstract
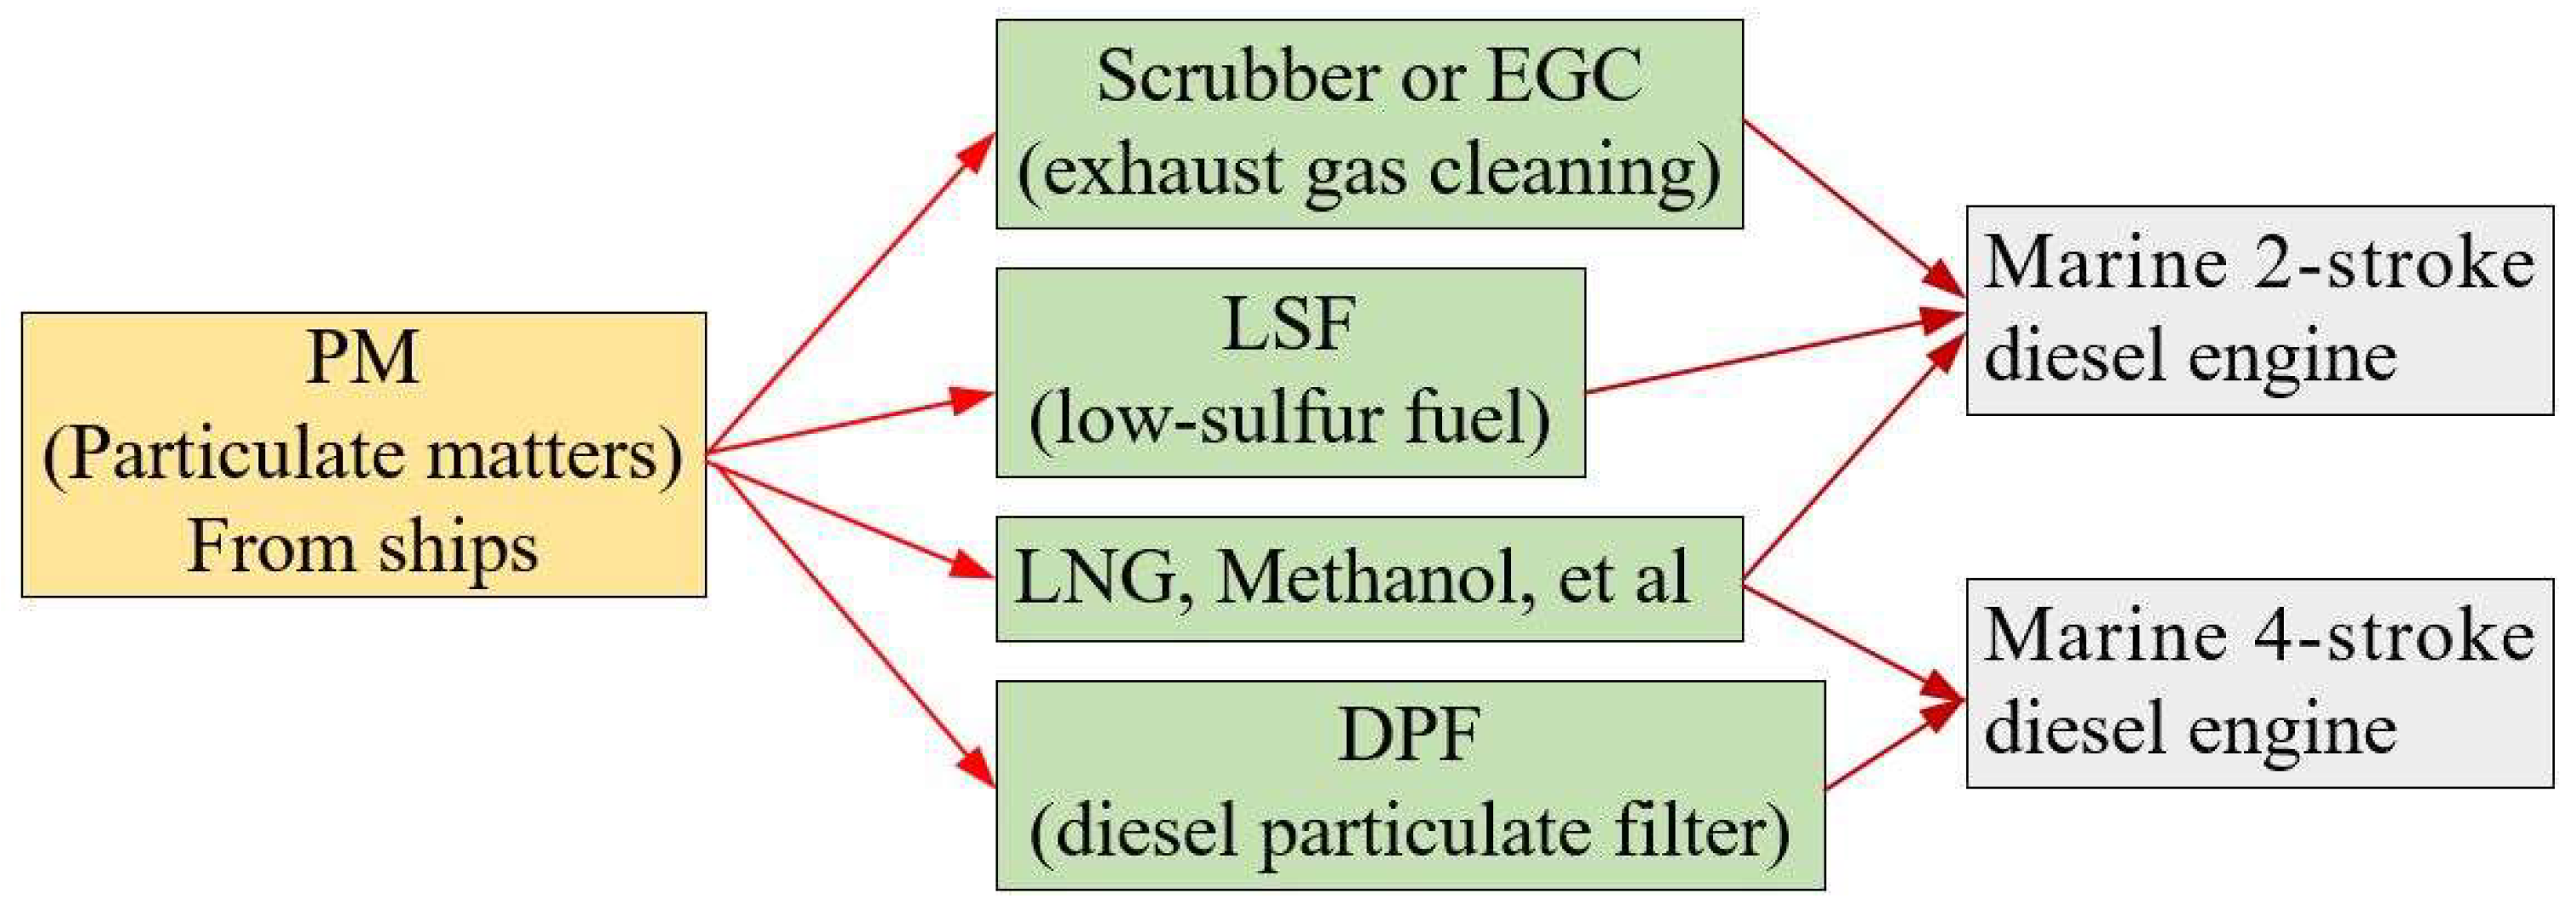
1. Introduction
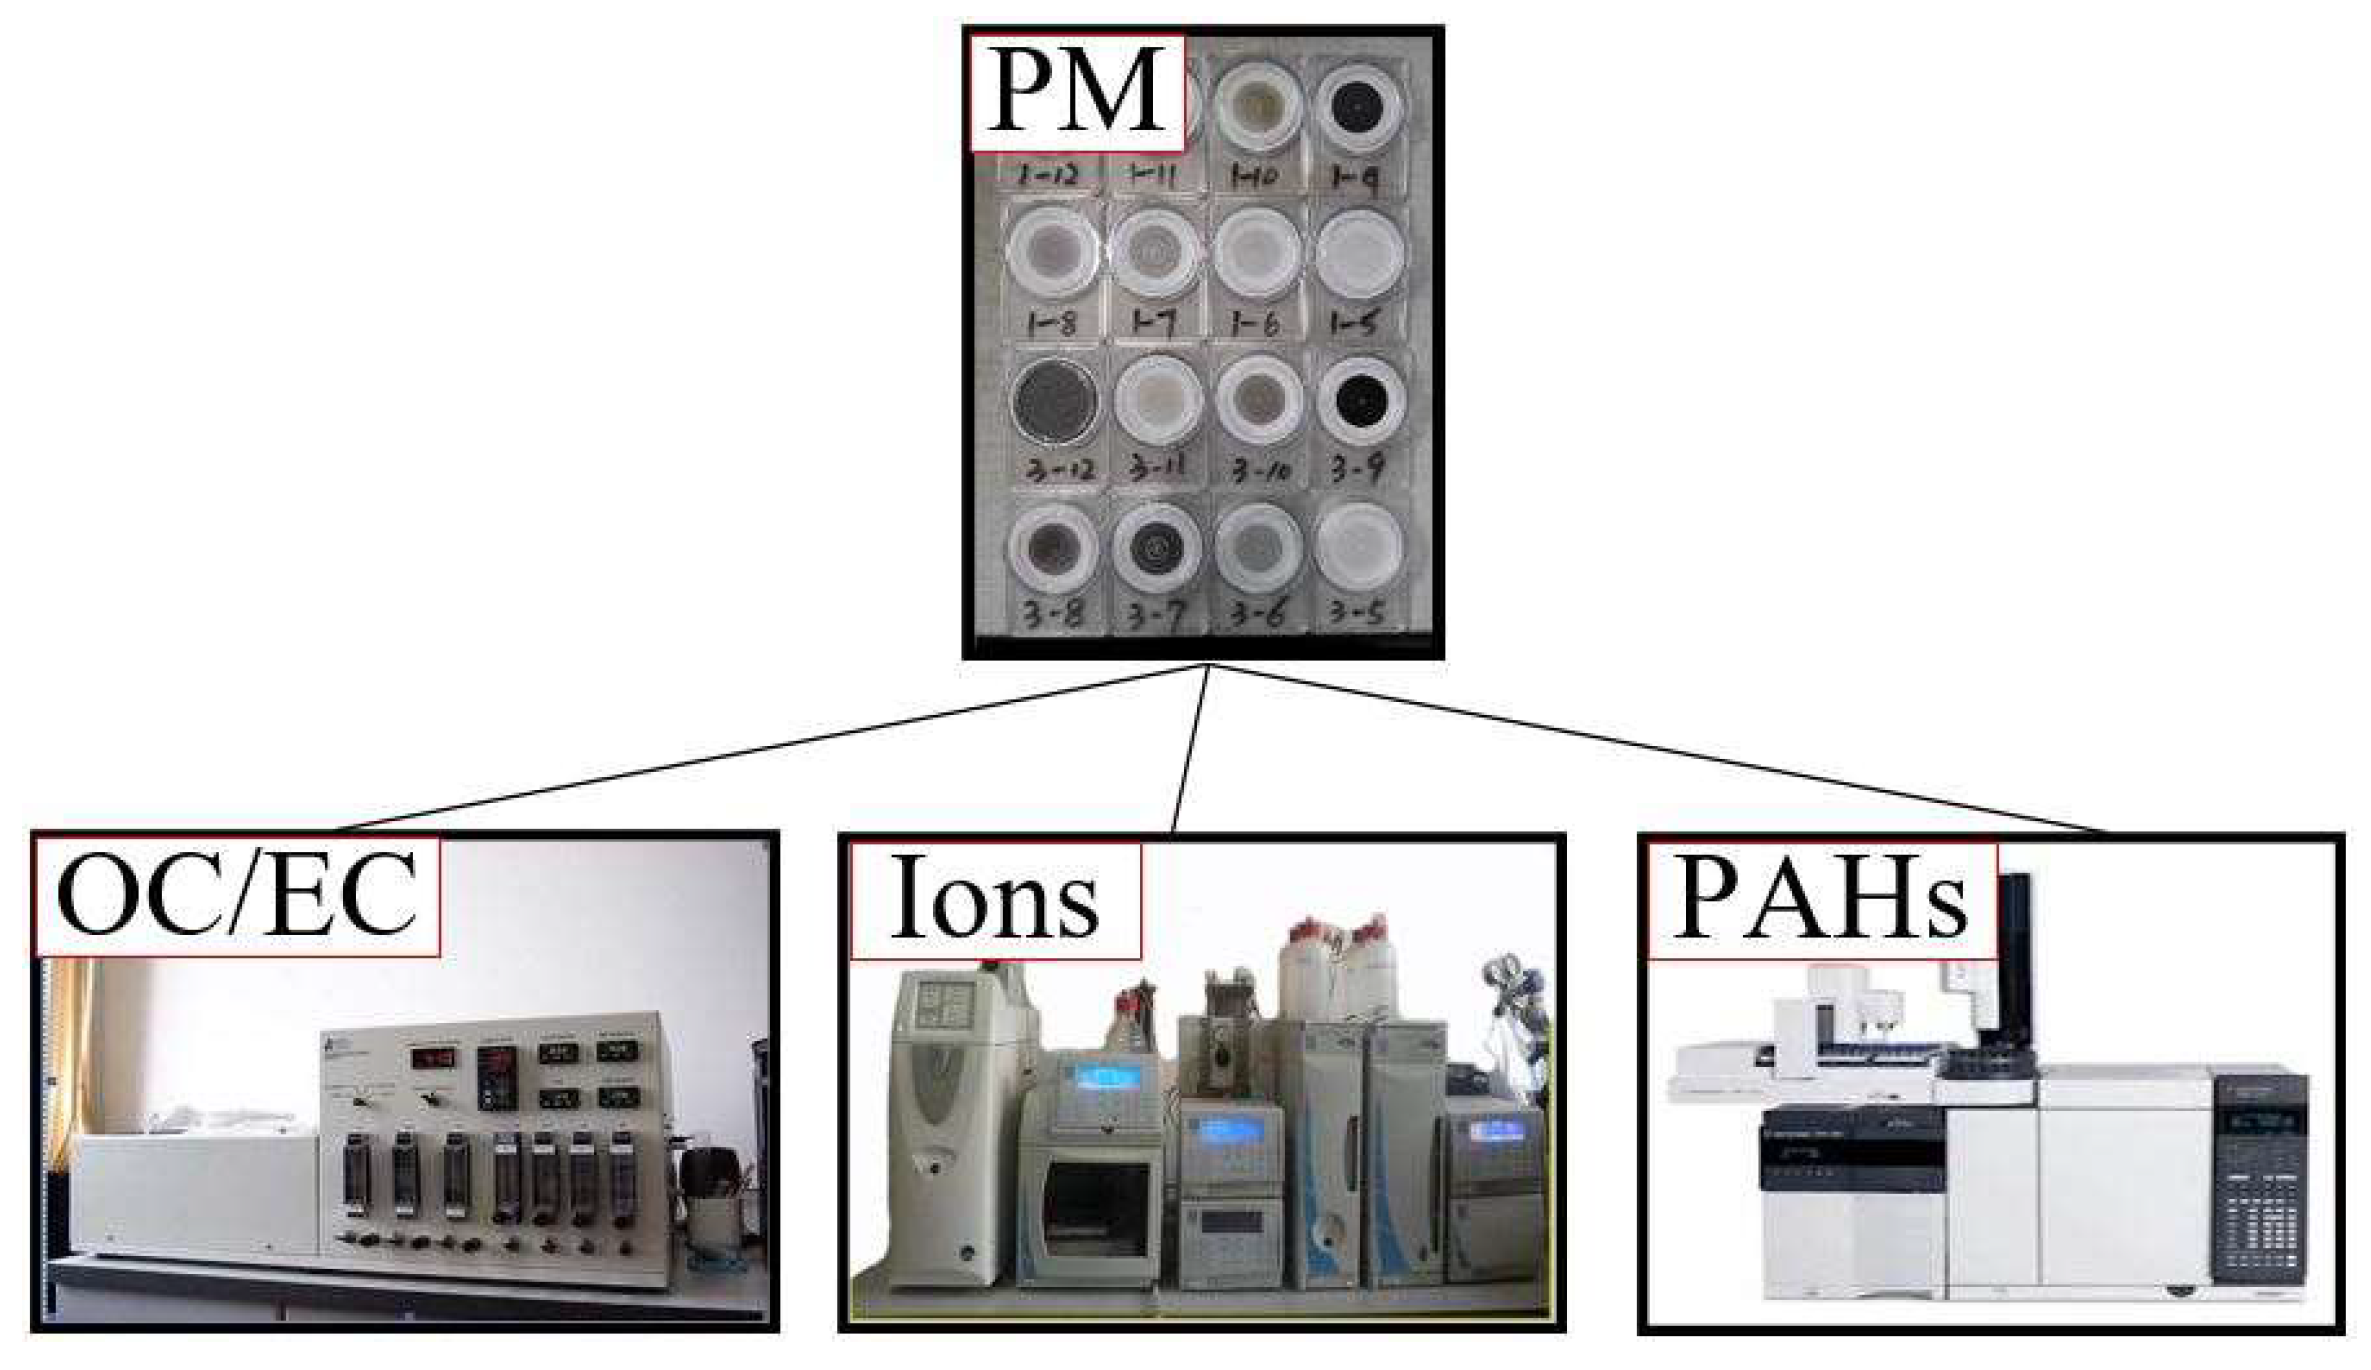
2. Materials and Methods
2.1. Tested Engine and Fuel Parameters
2.2. Data Calculation and Analysis
2.3. DPF Design and Parameters
3. Results
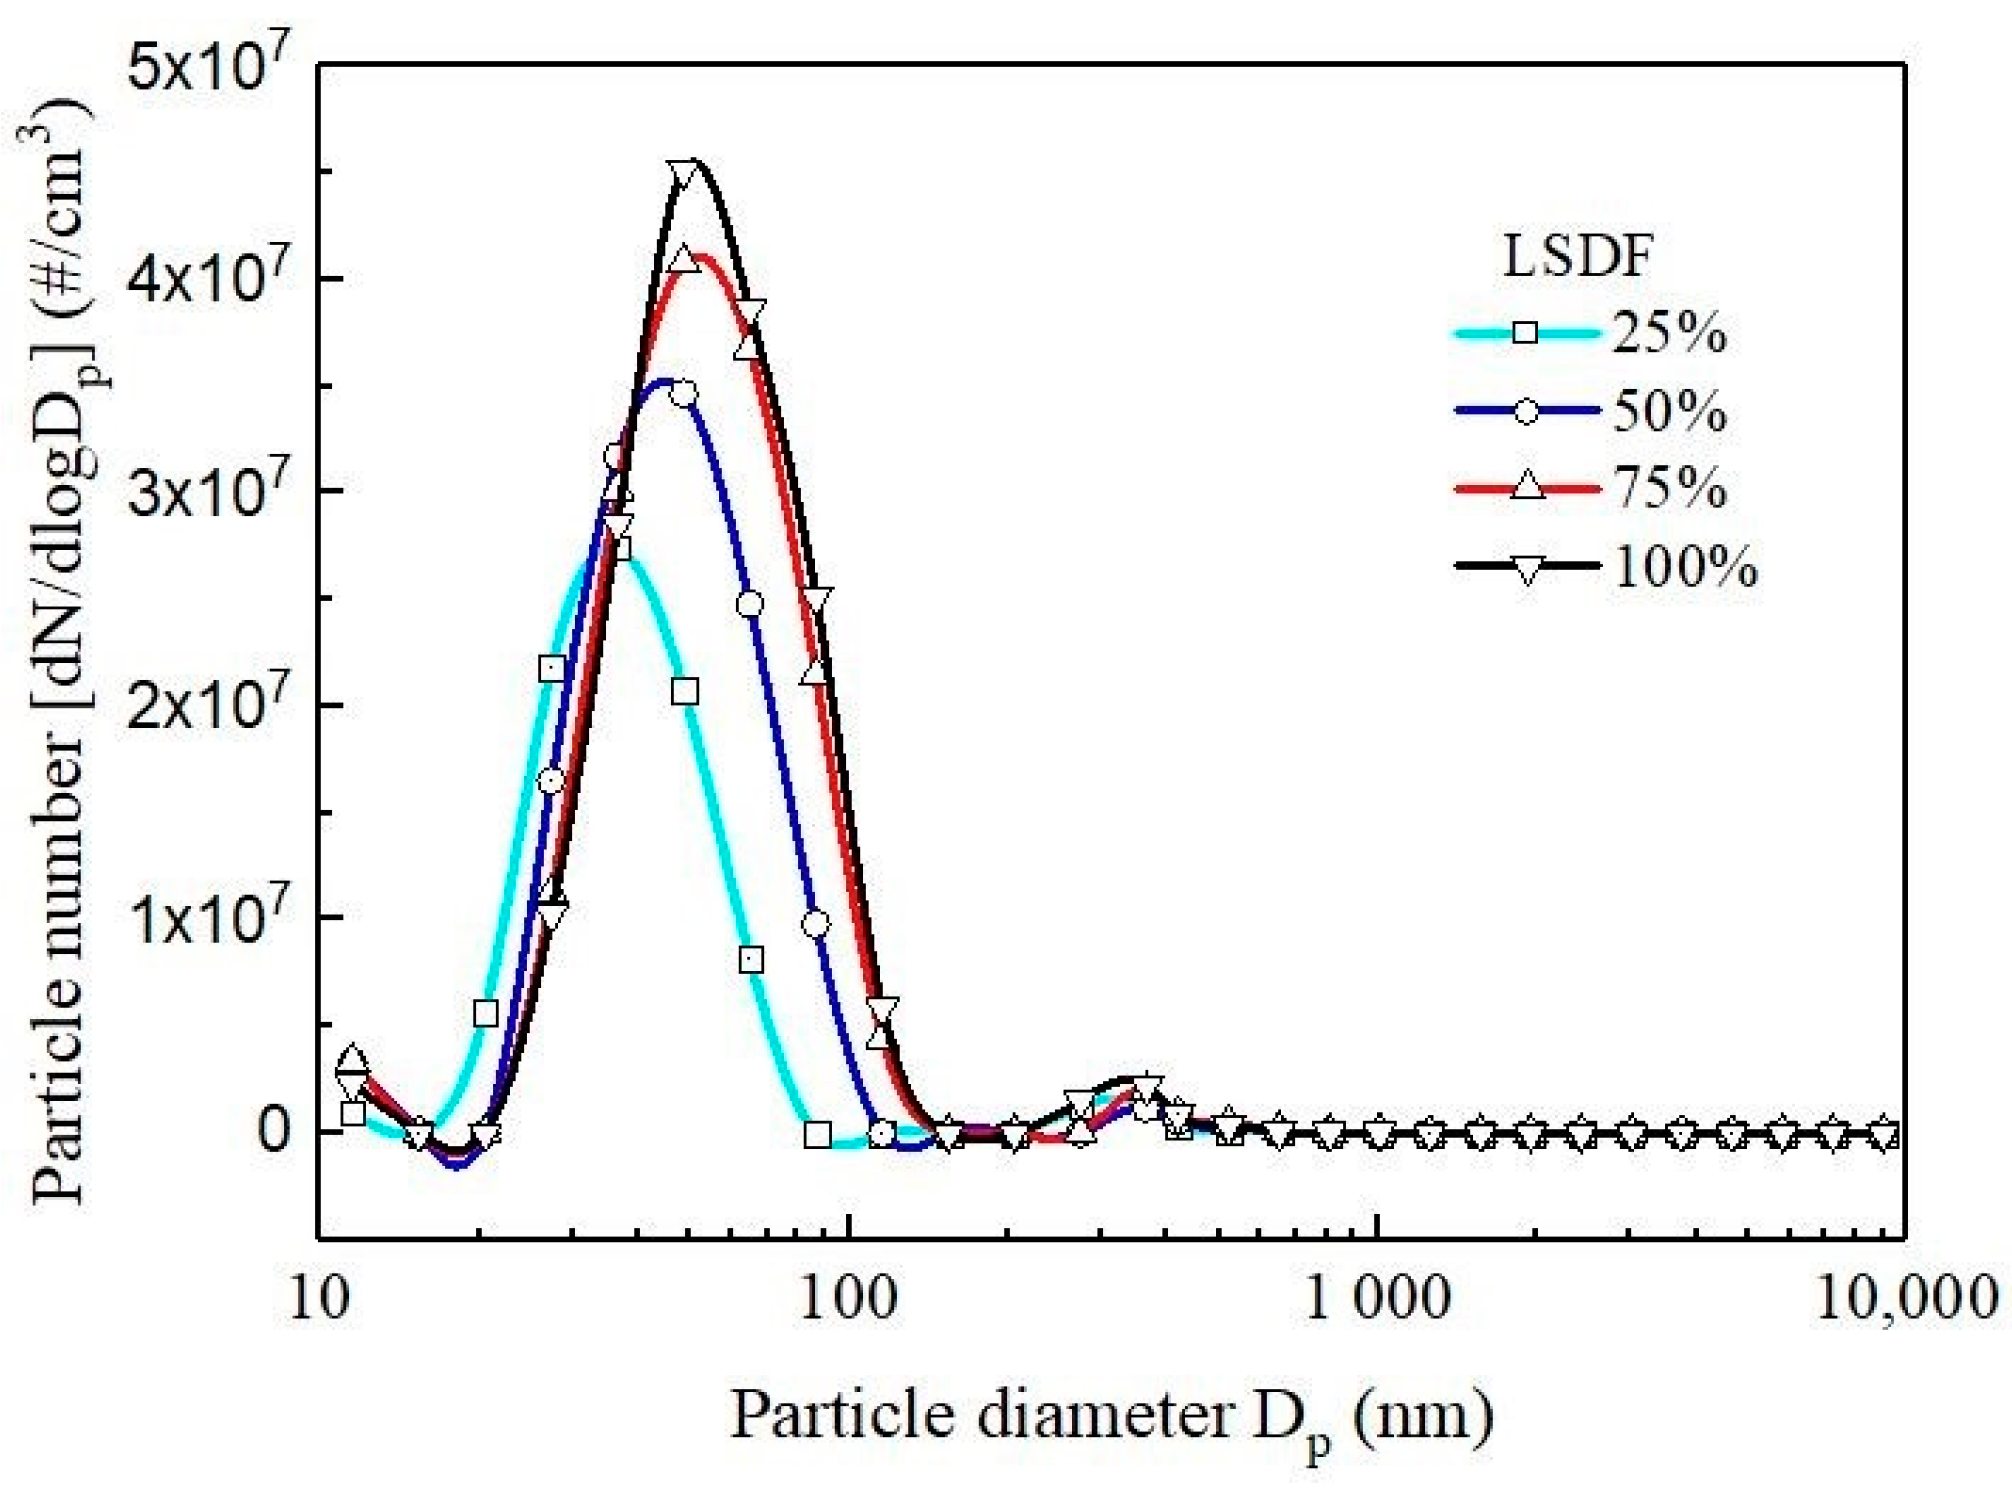
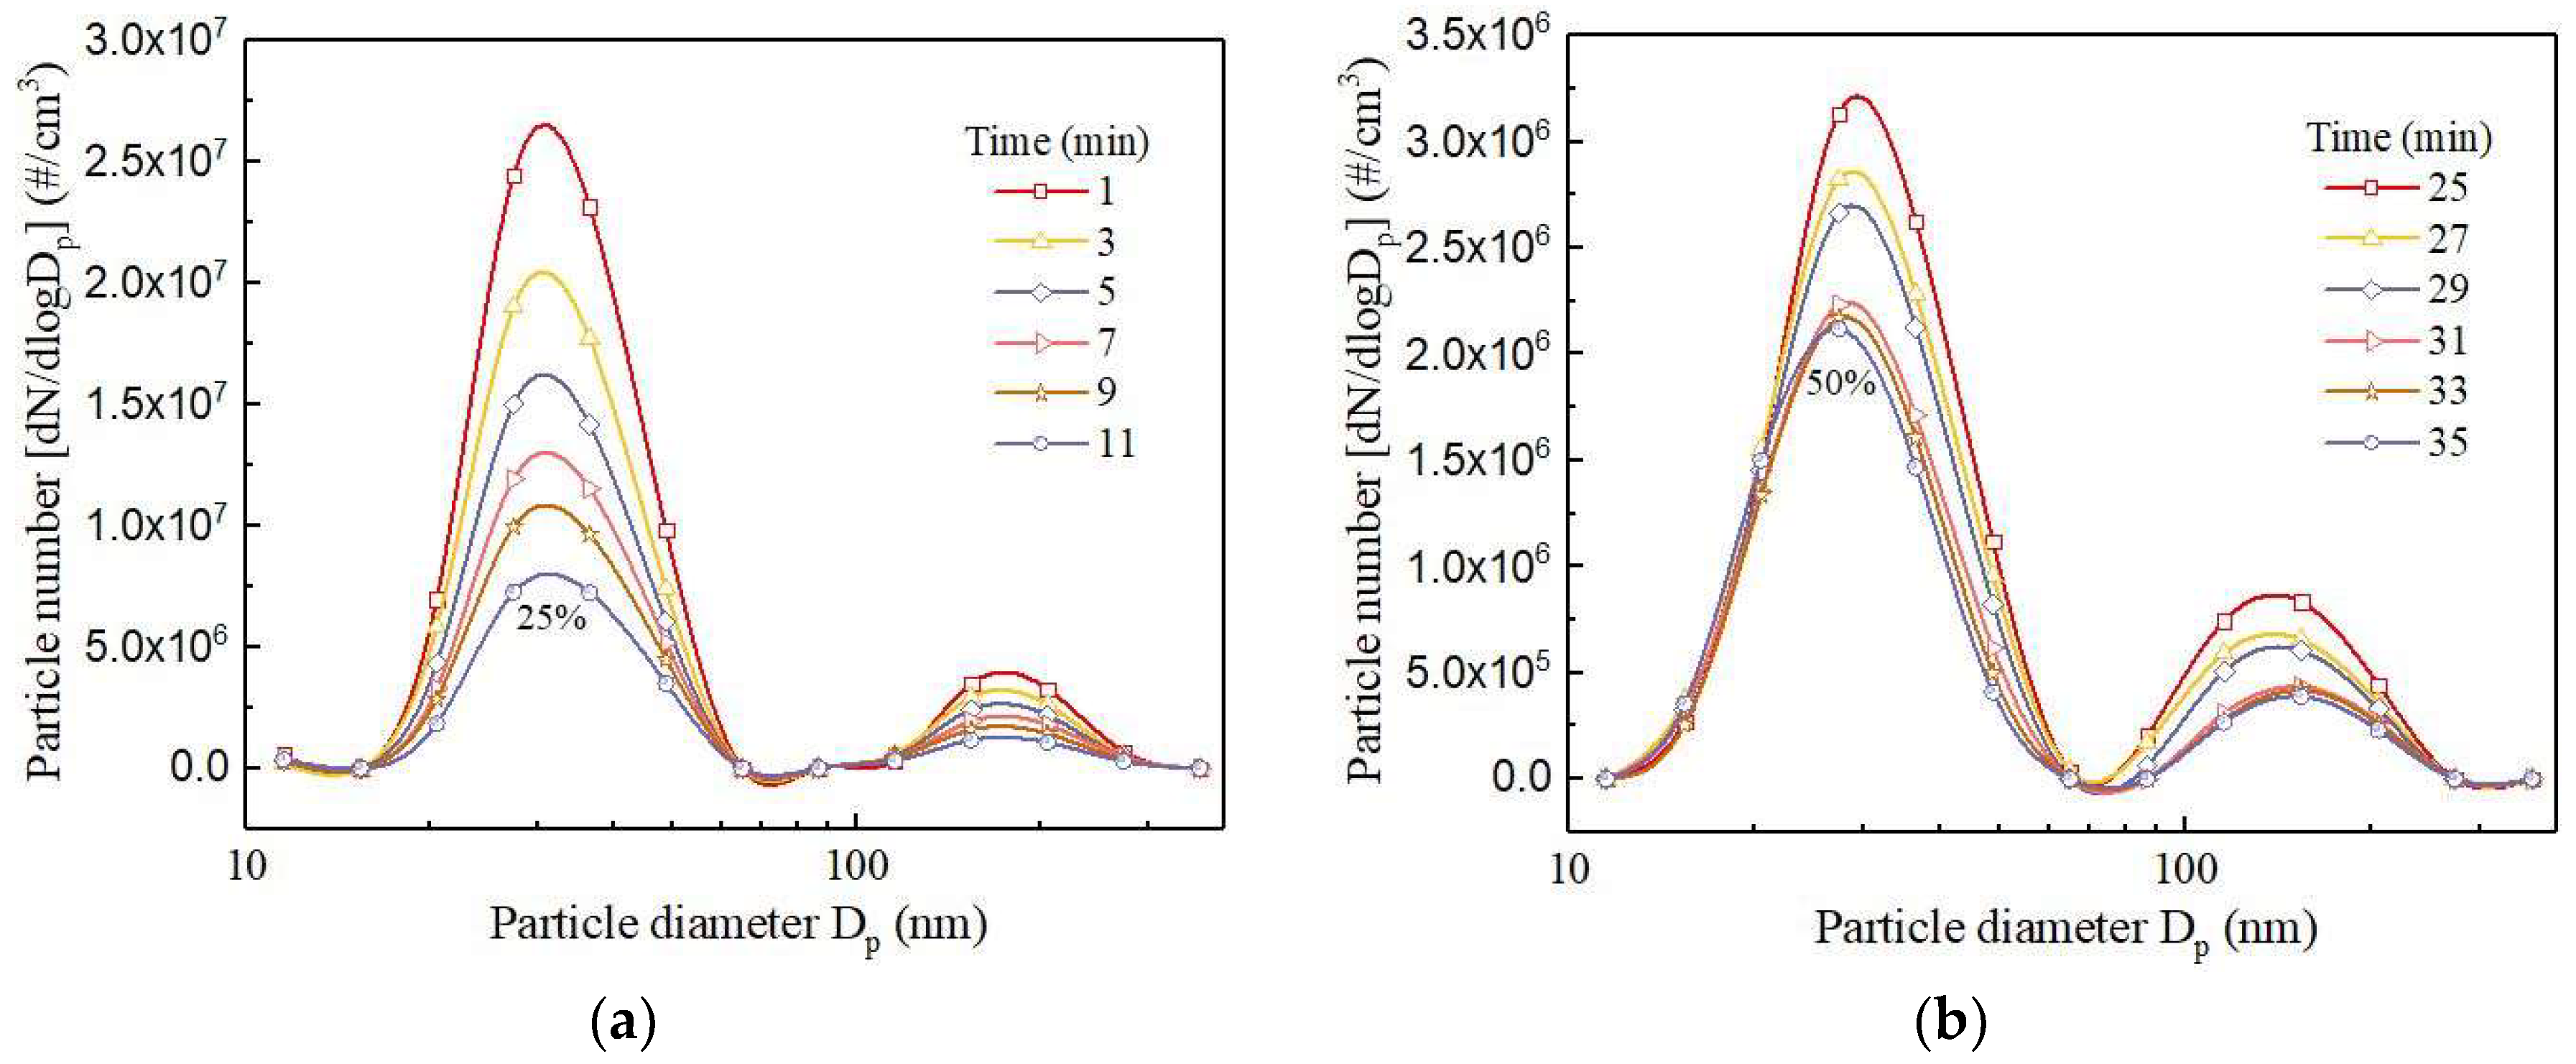
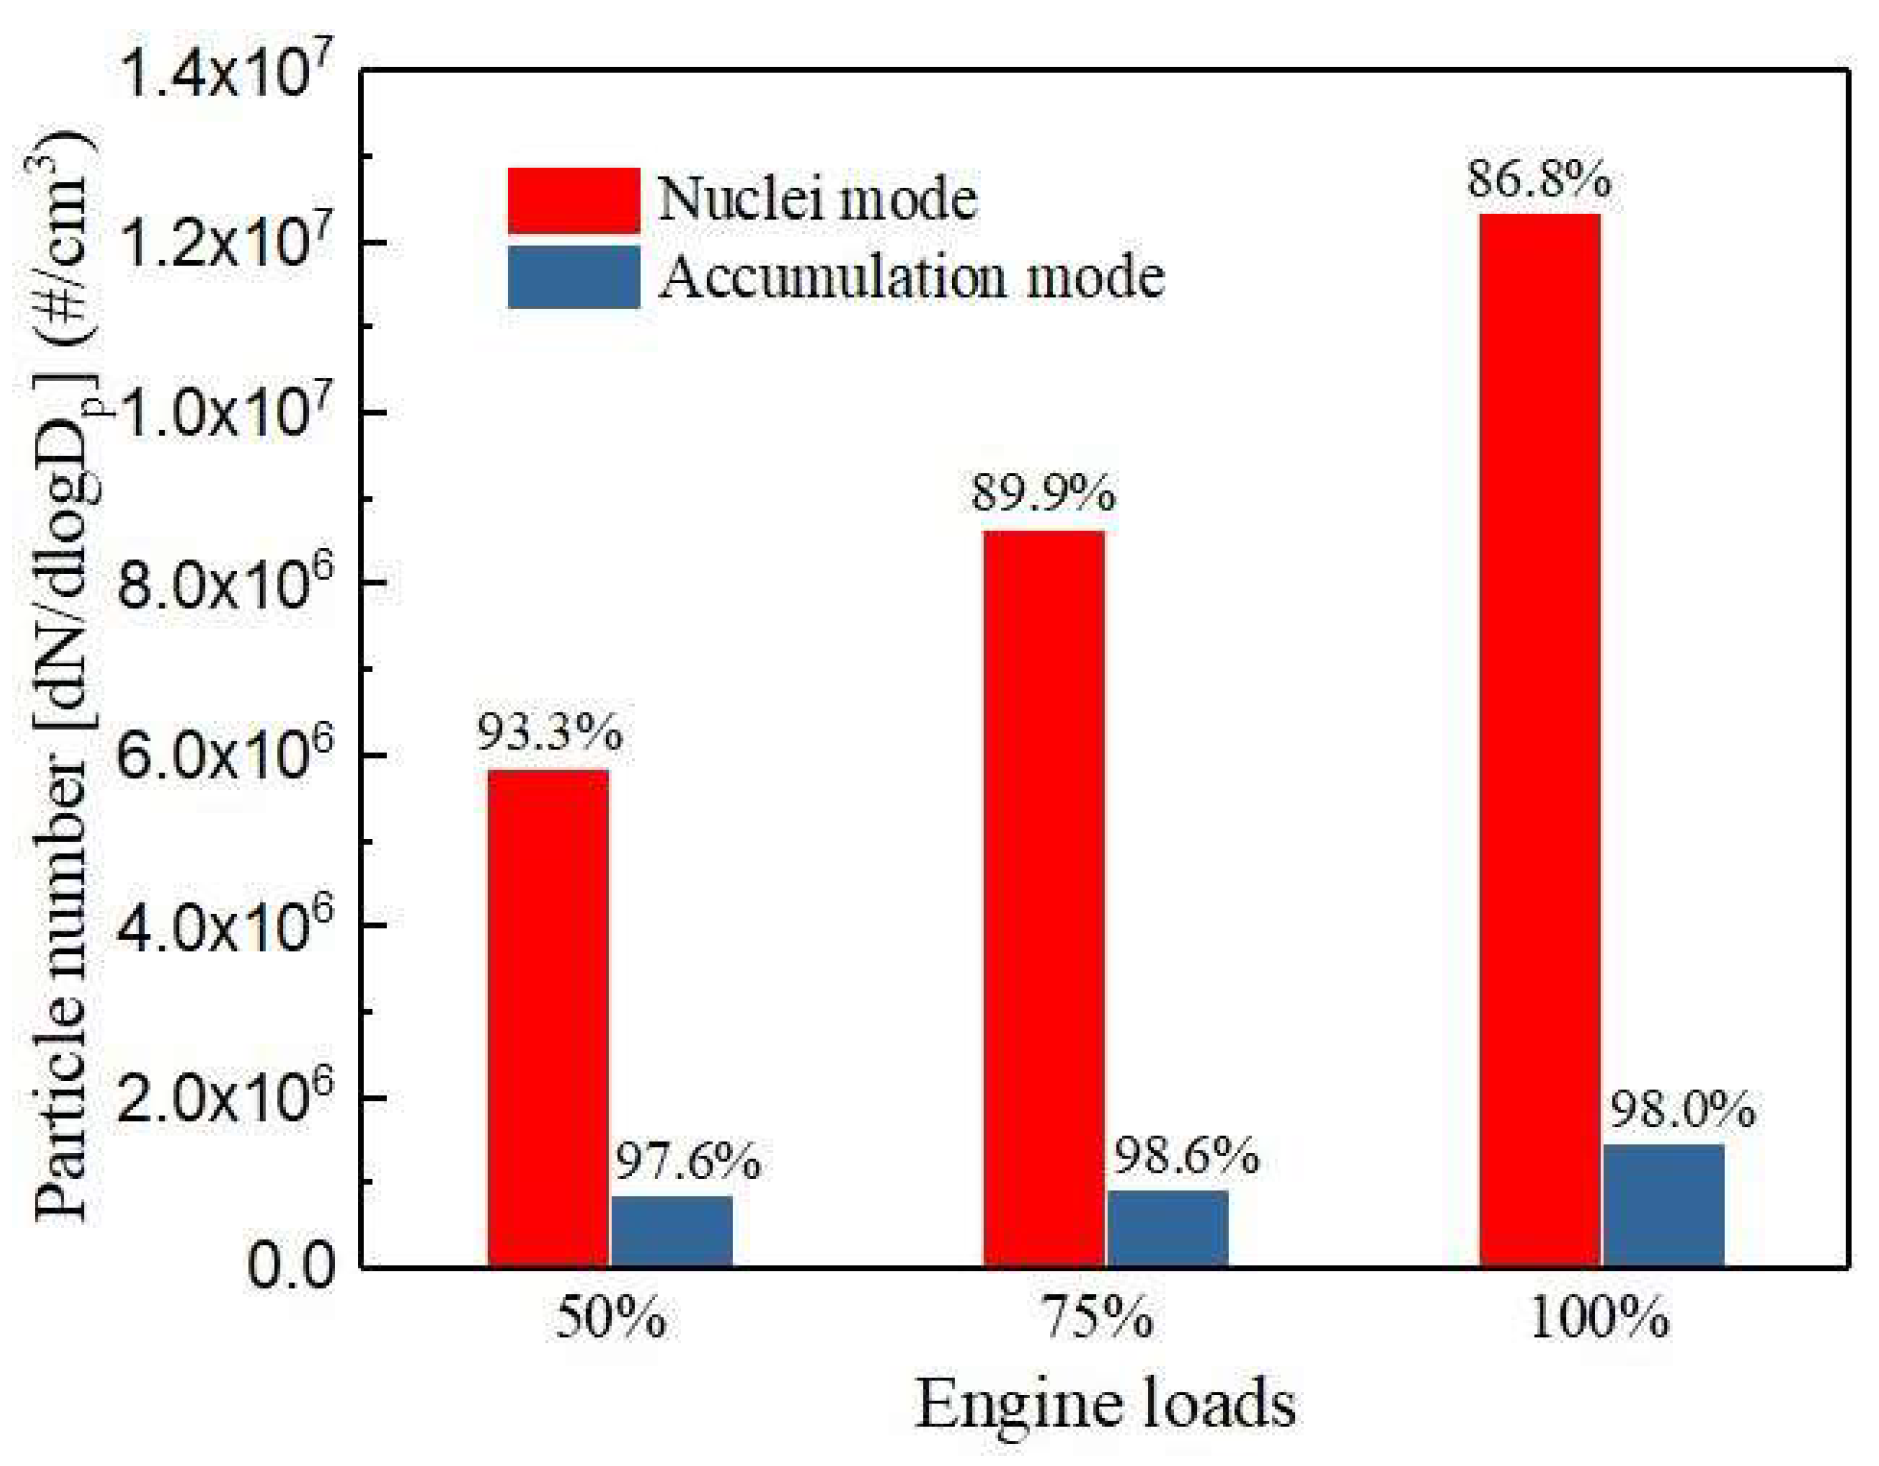
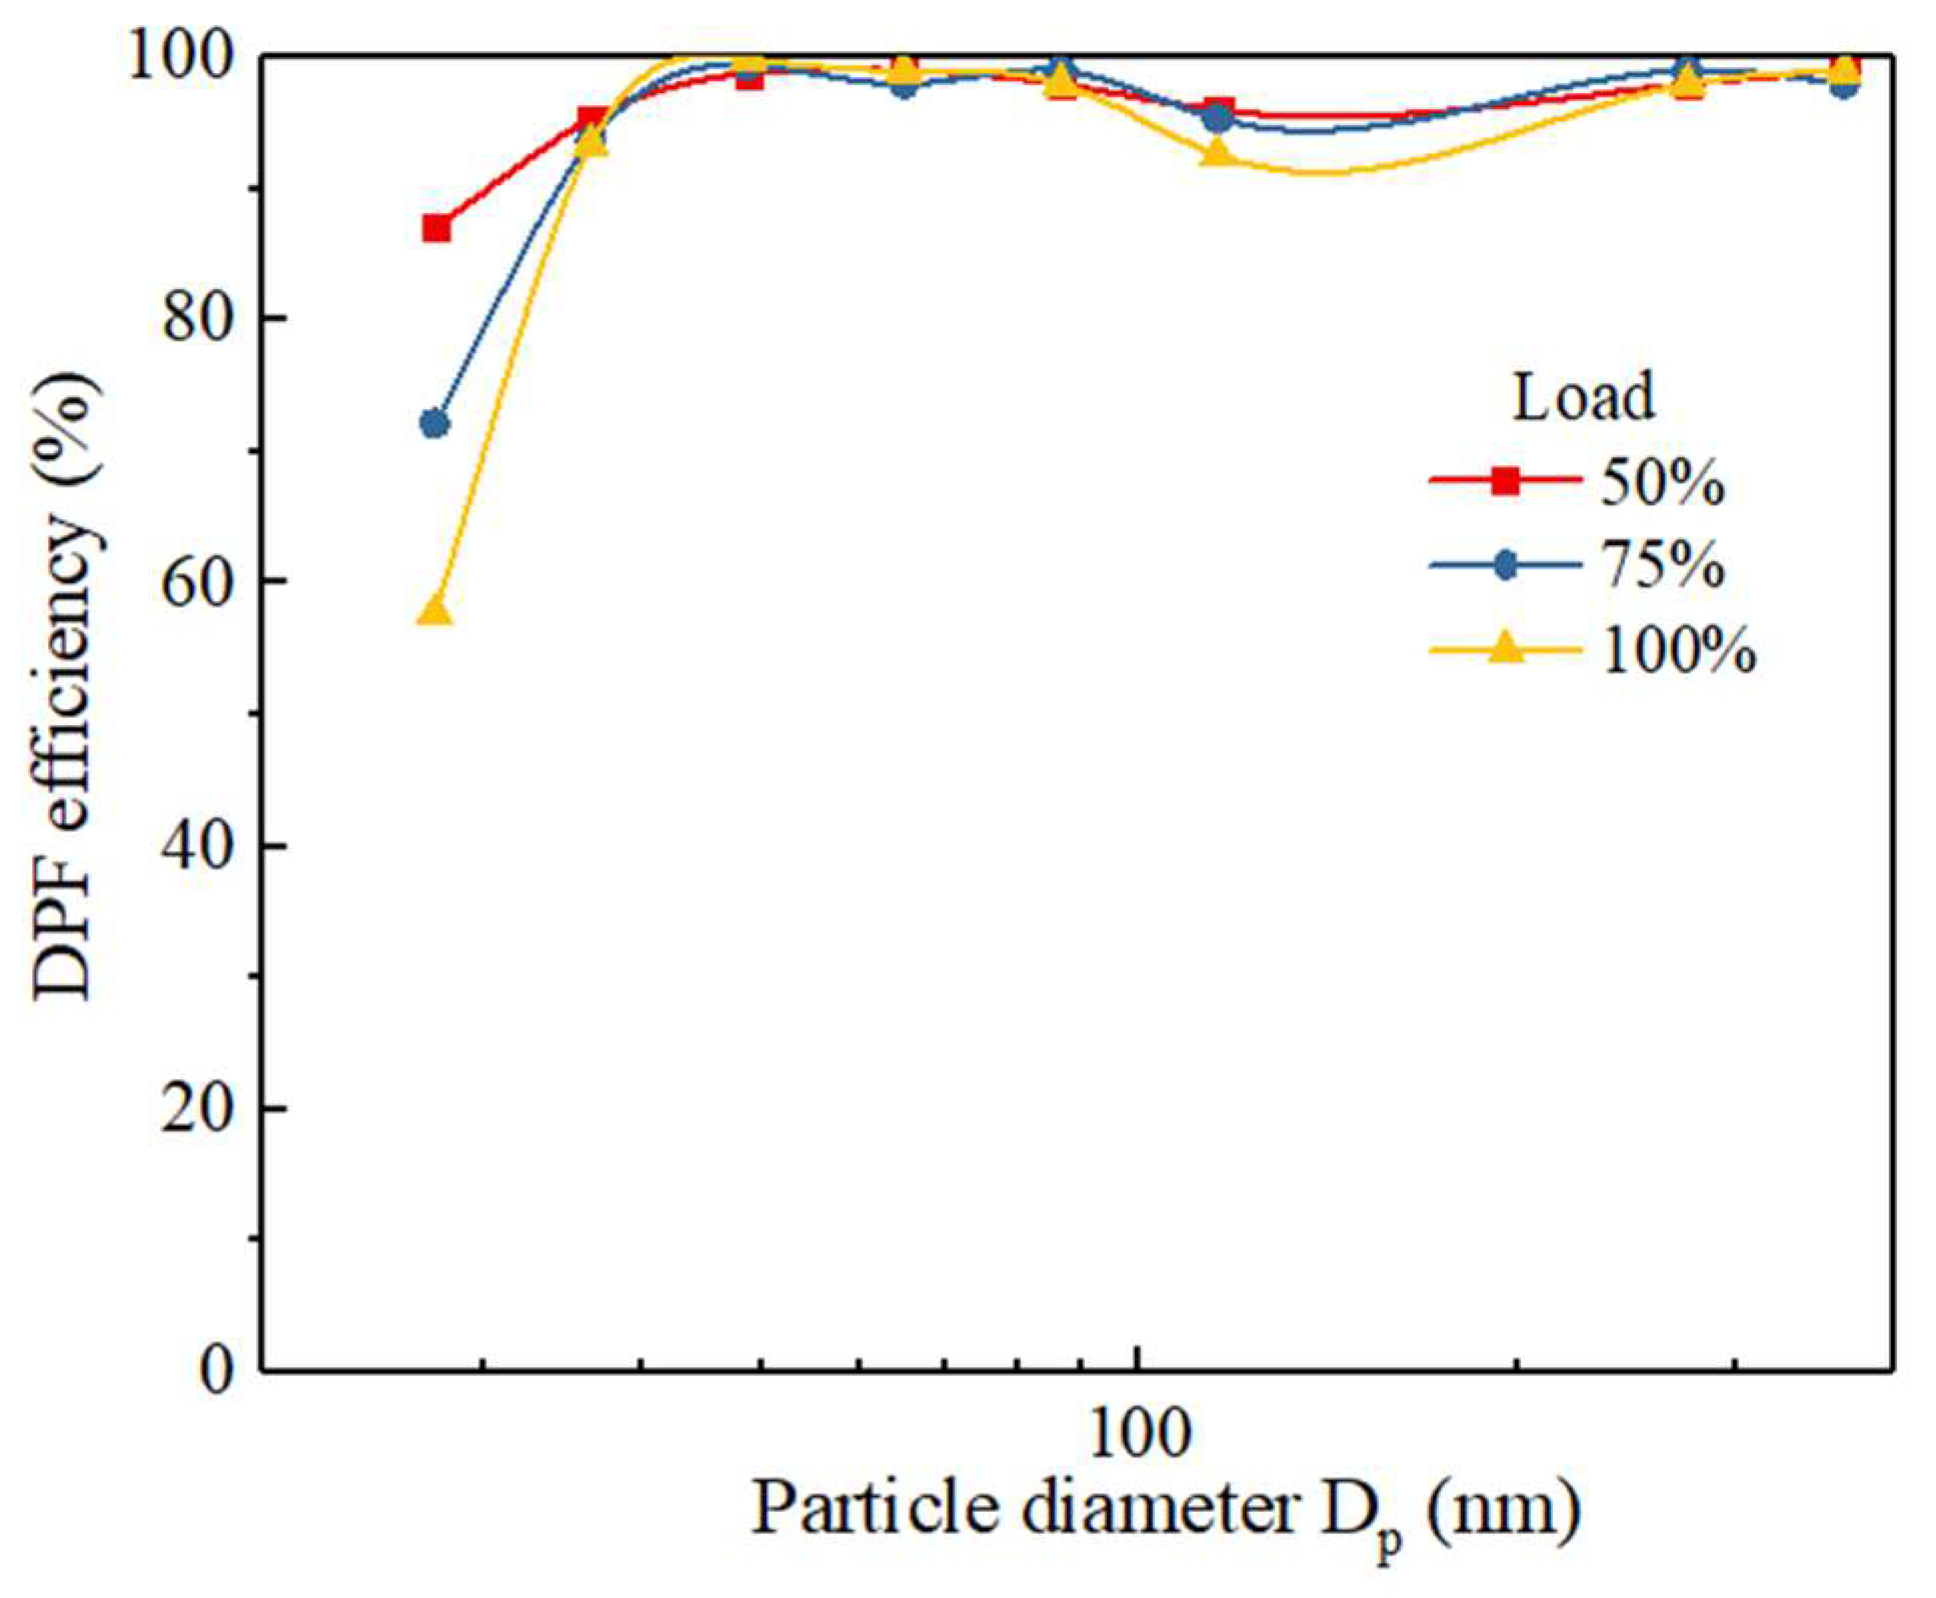
3.1. Emission Characteristics of Particle Number Parameters
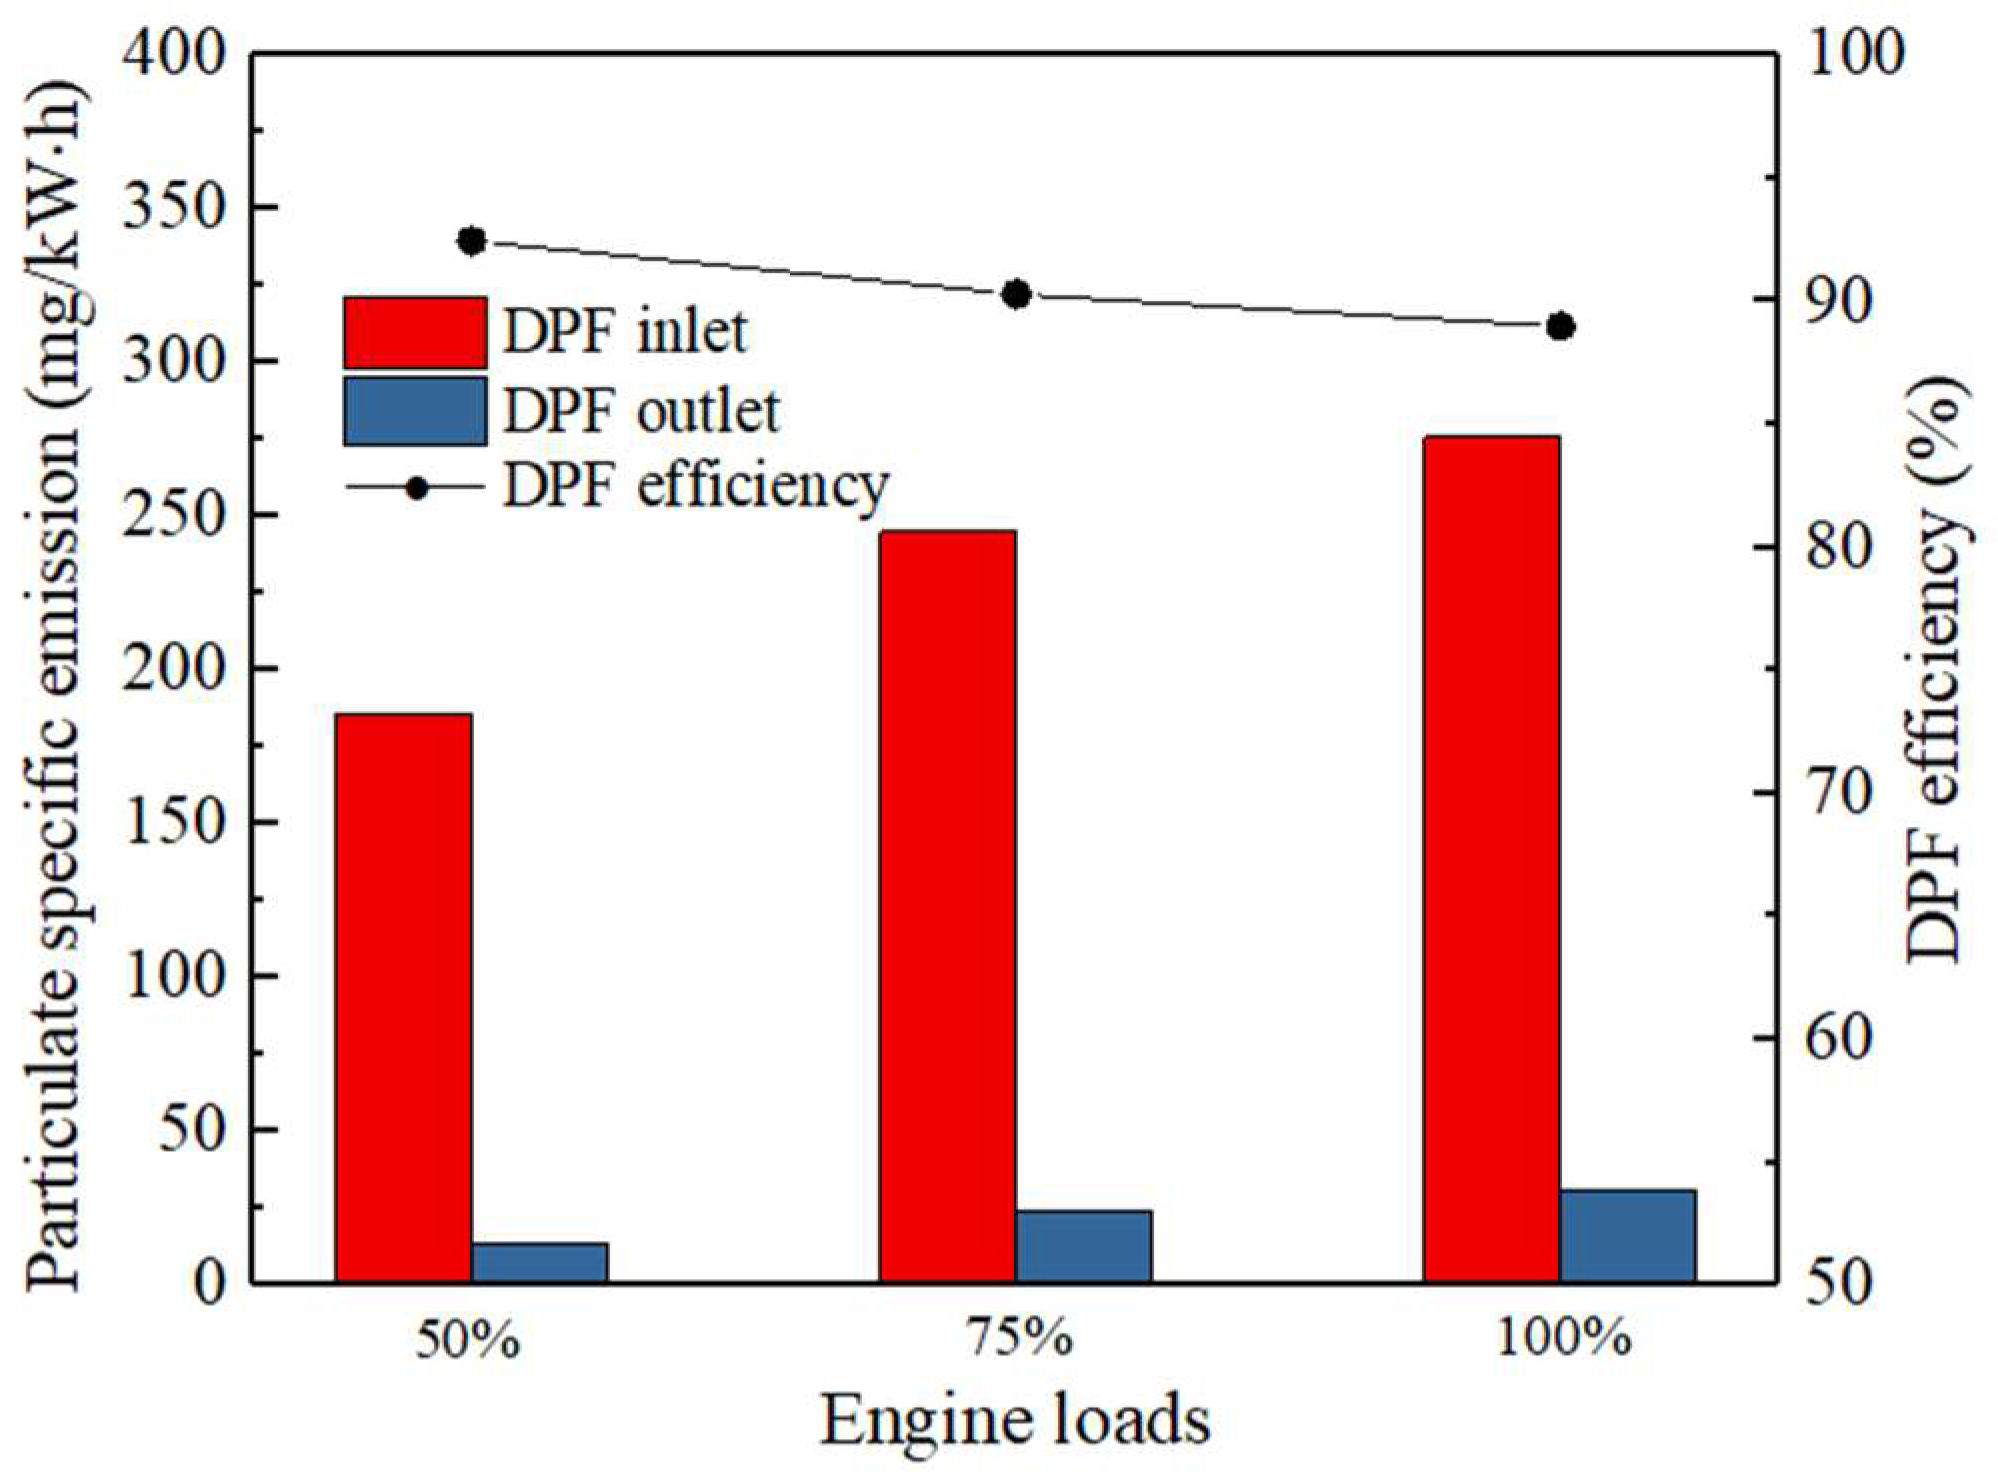
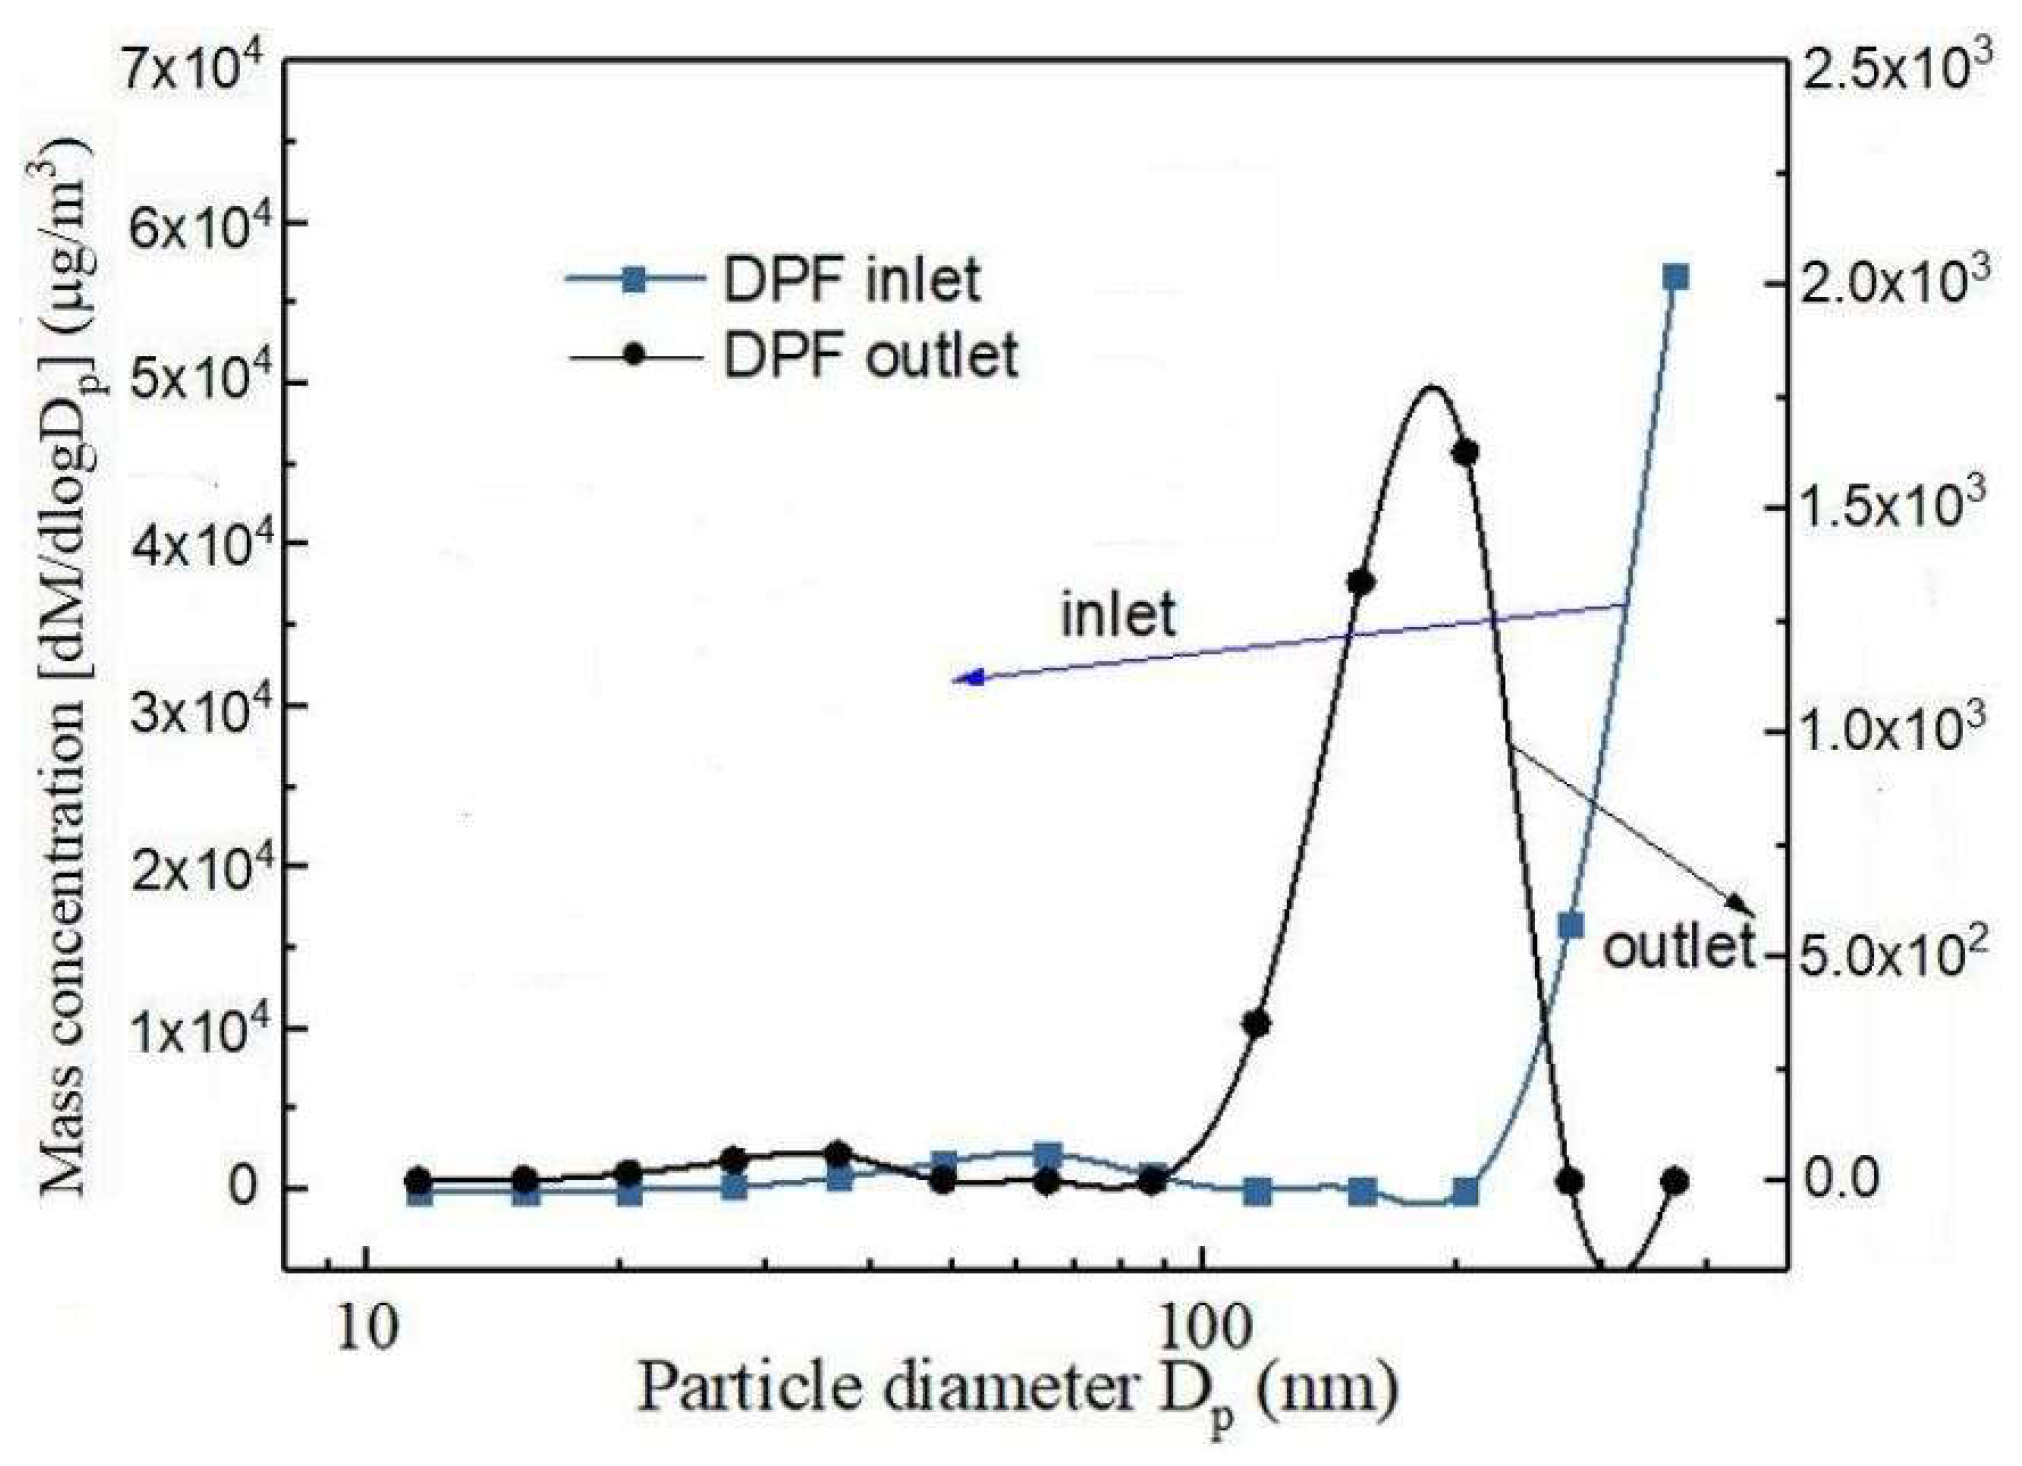
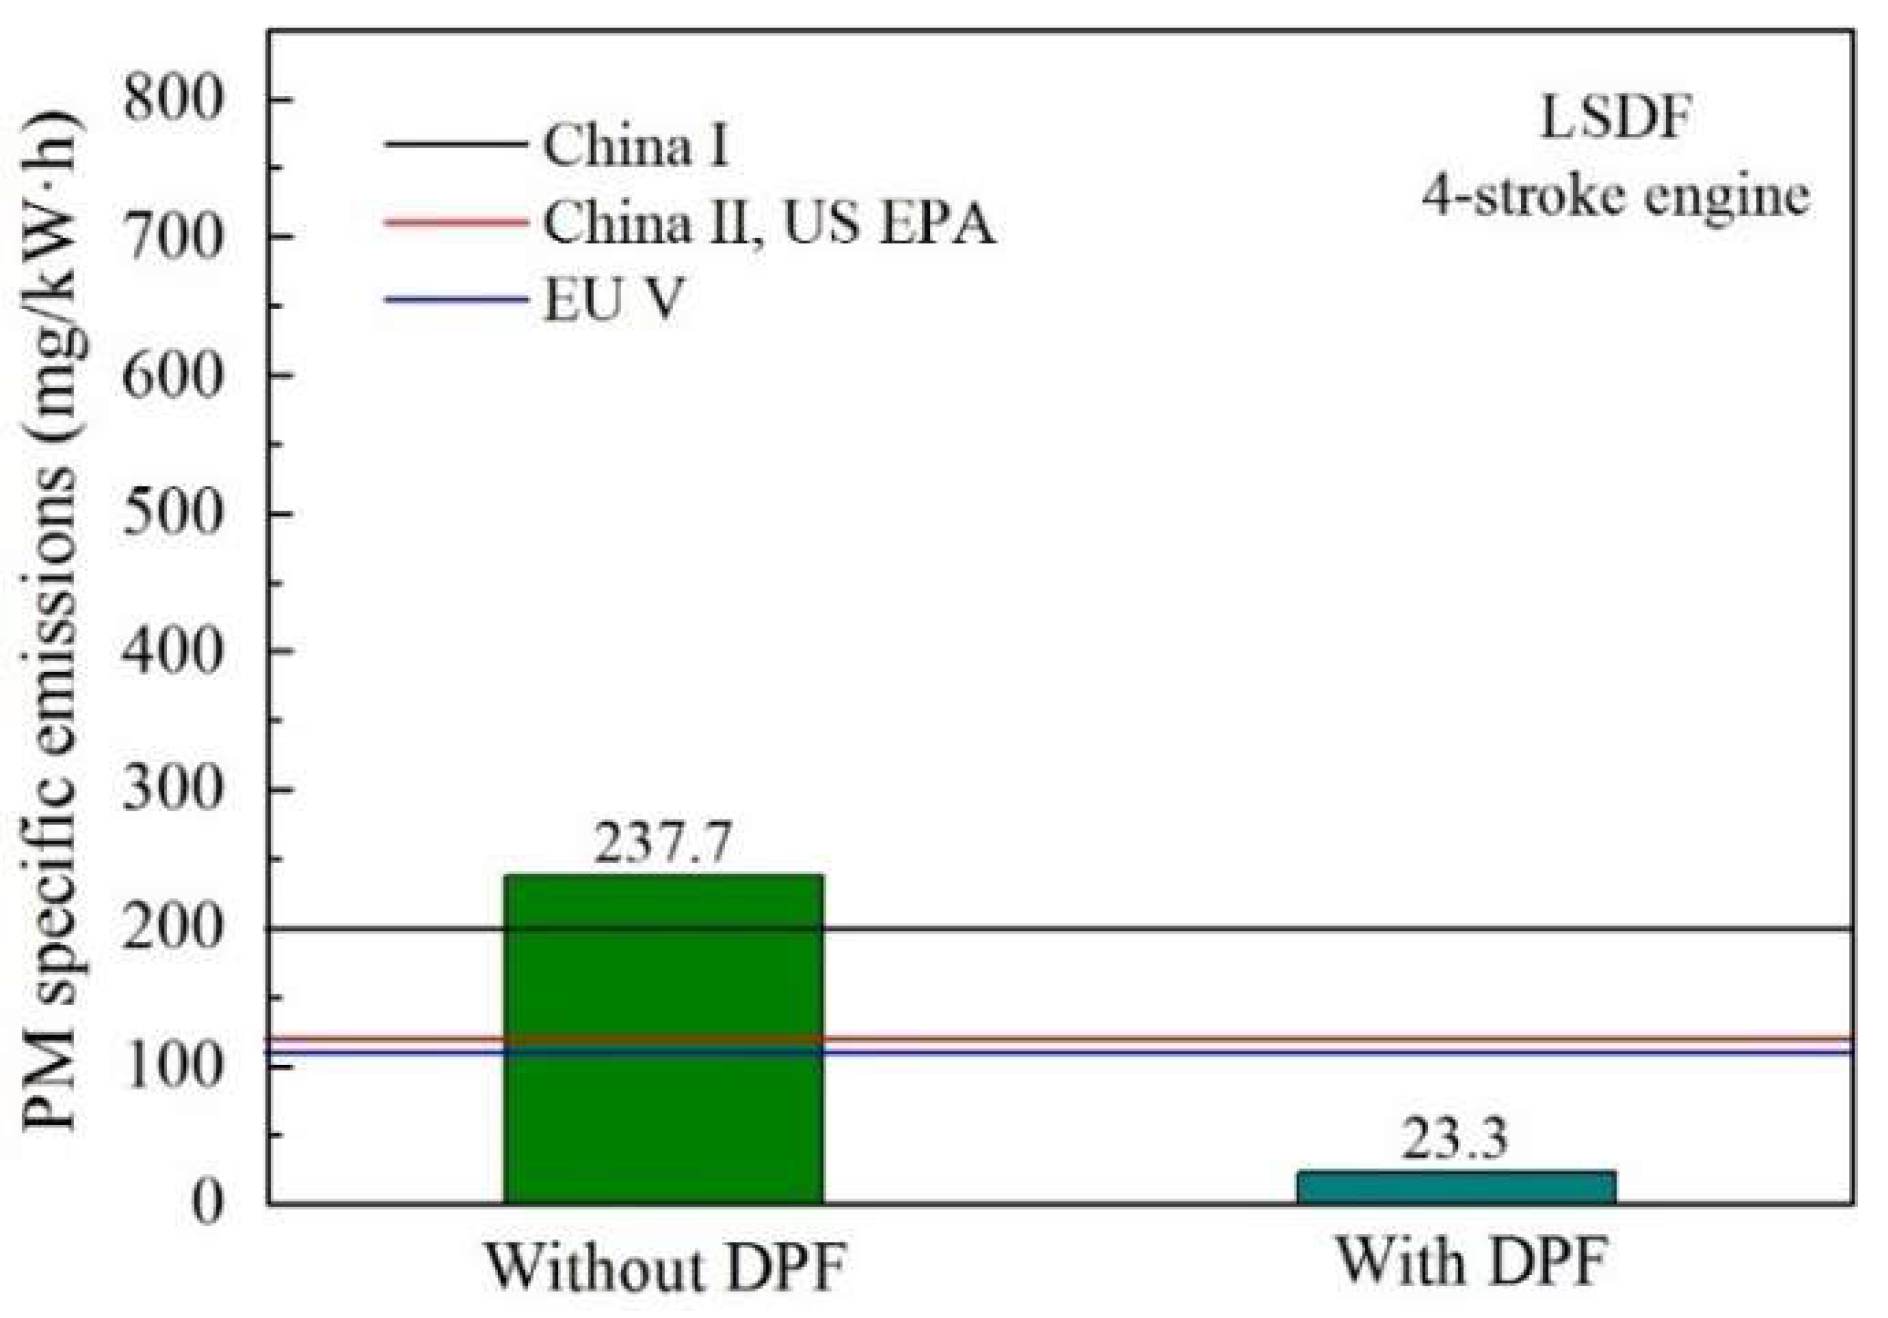
3.2. Emission Characteristics of Particle Mass Parameters
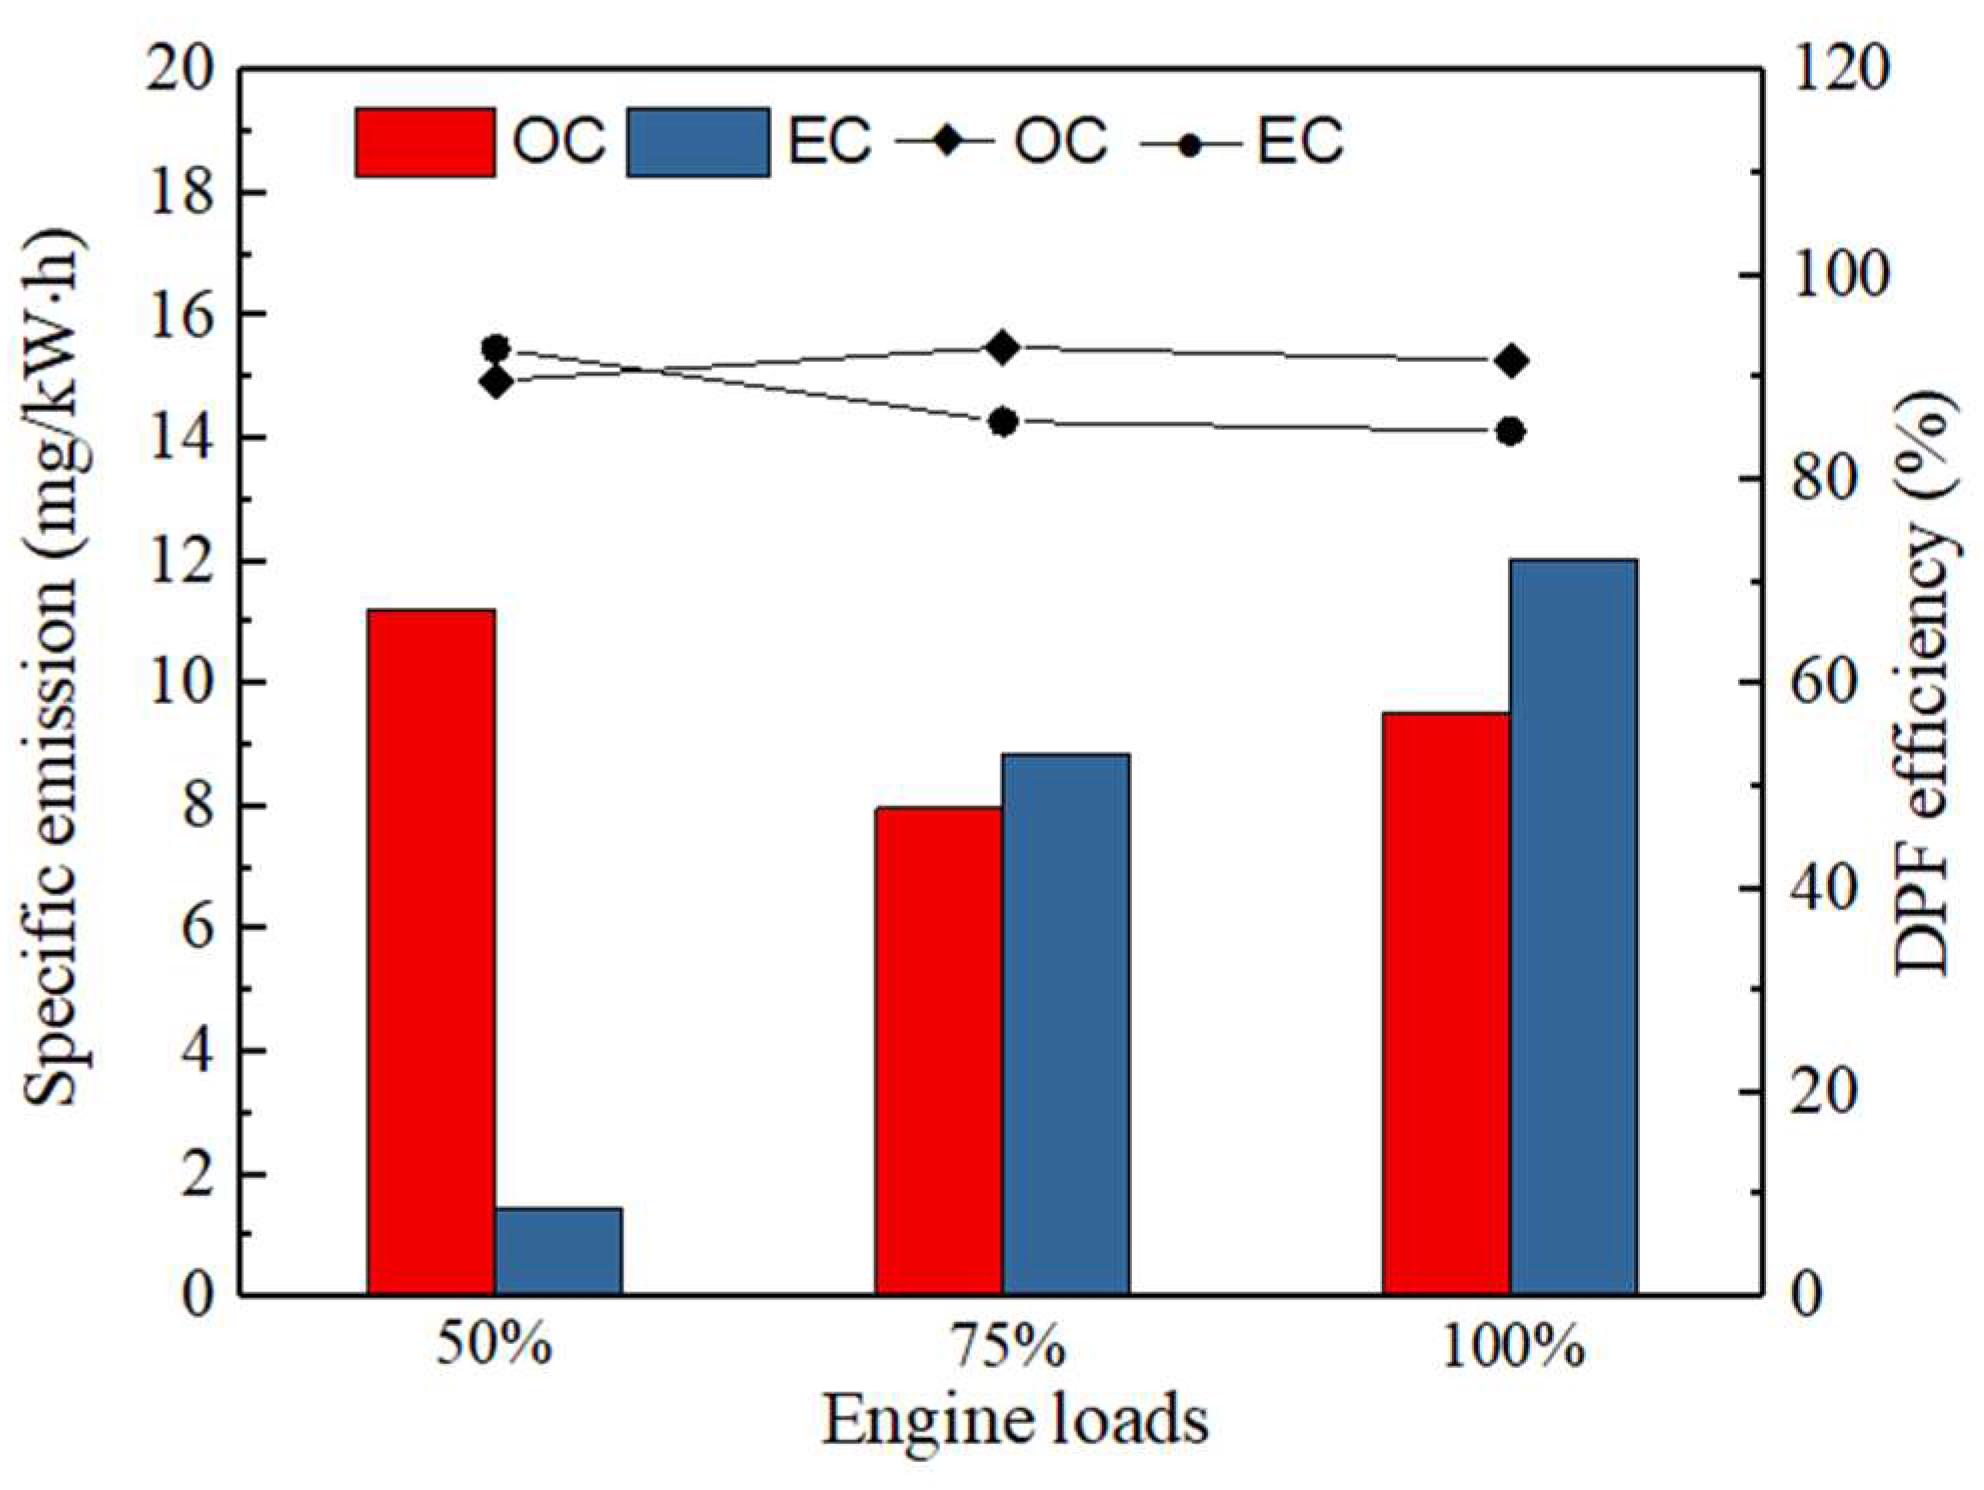
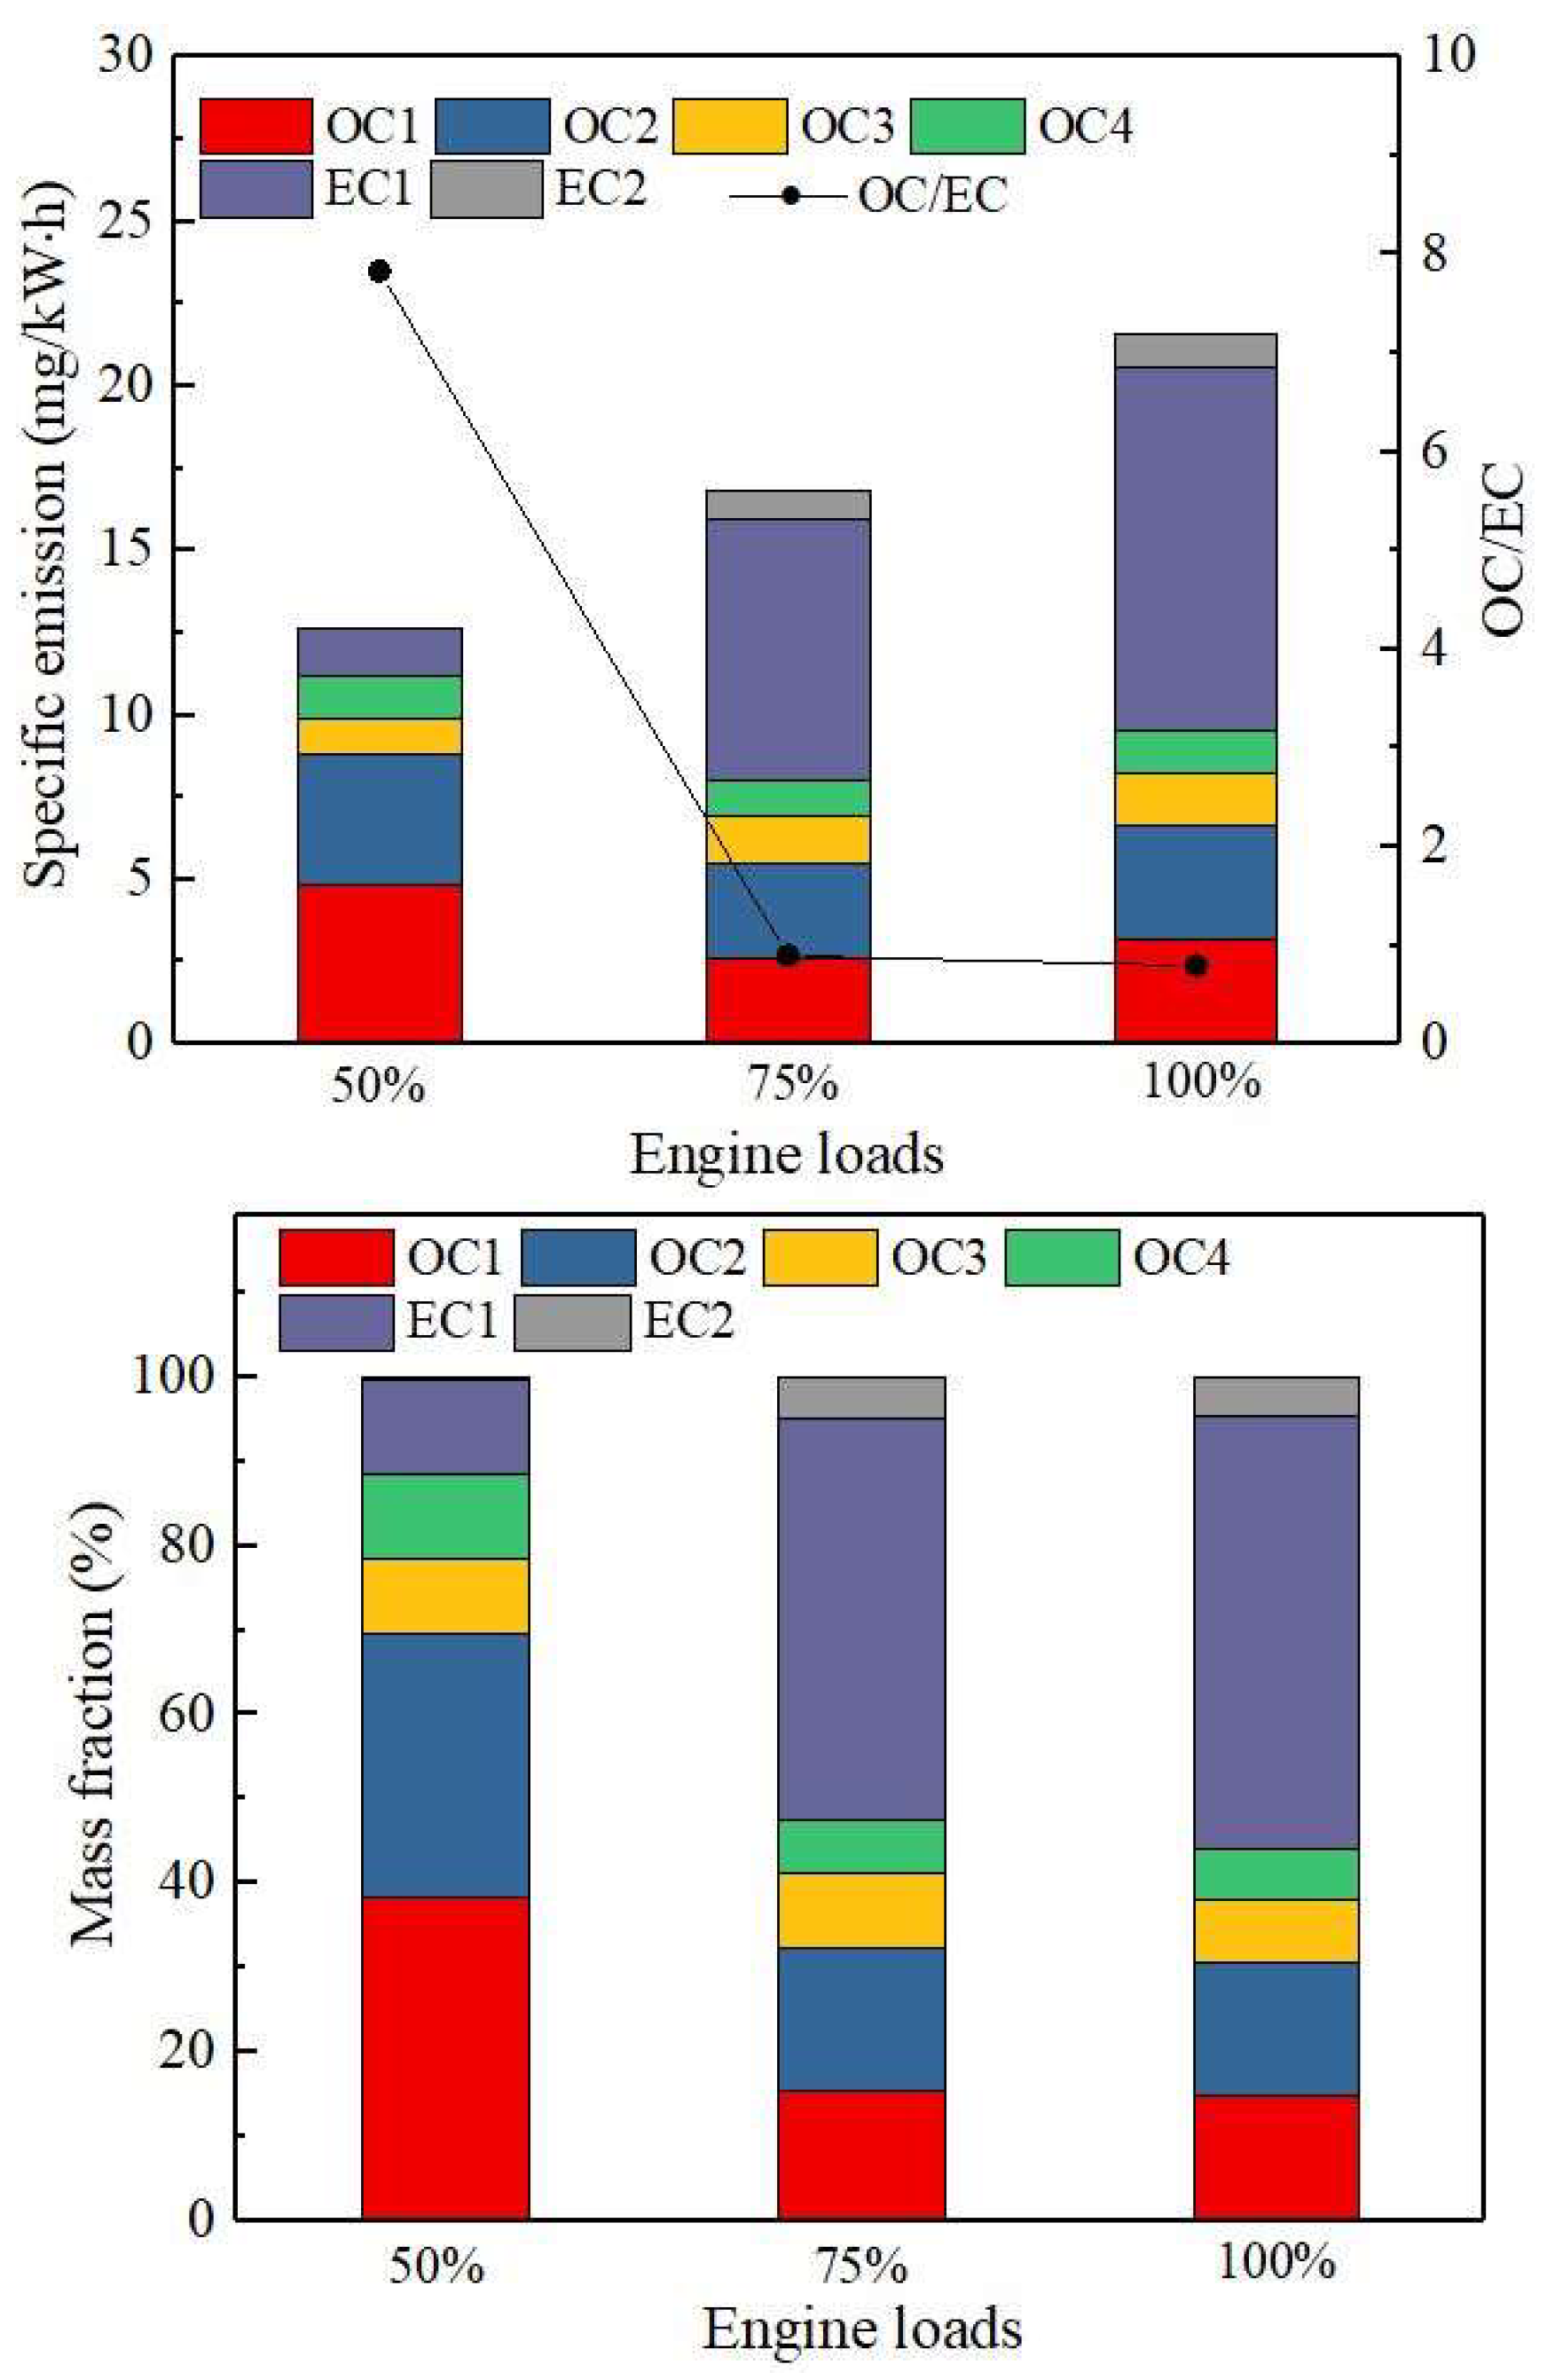
3.3. Emission Characteristics of OC and EC
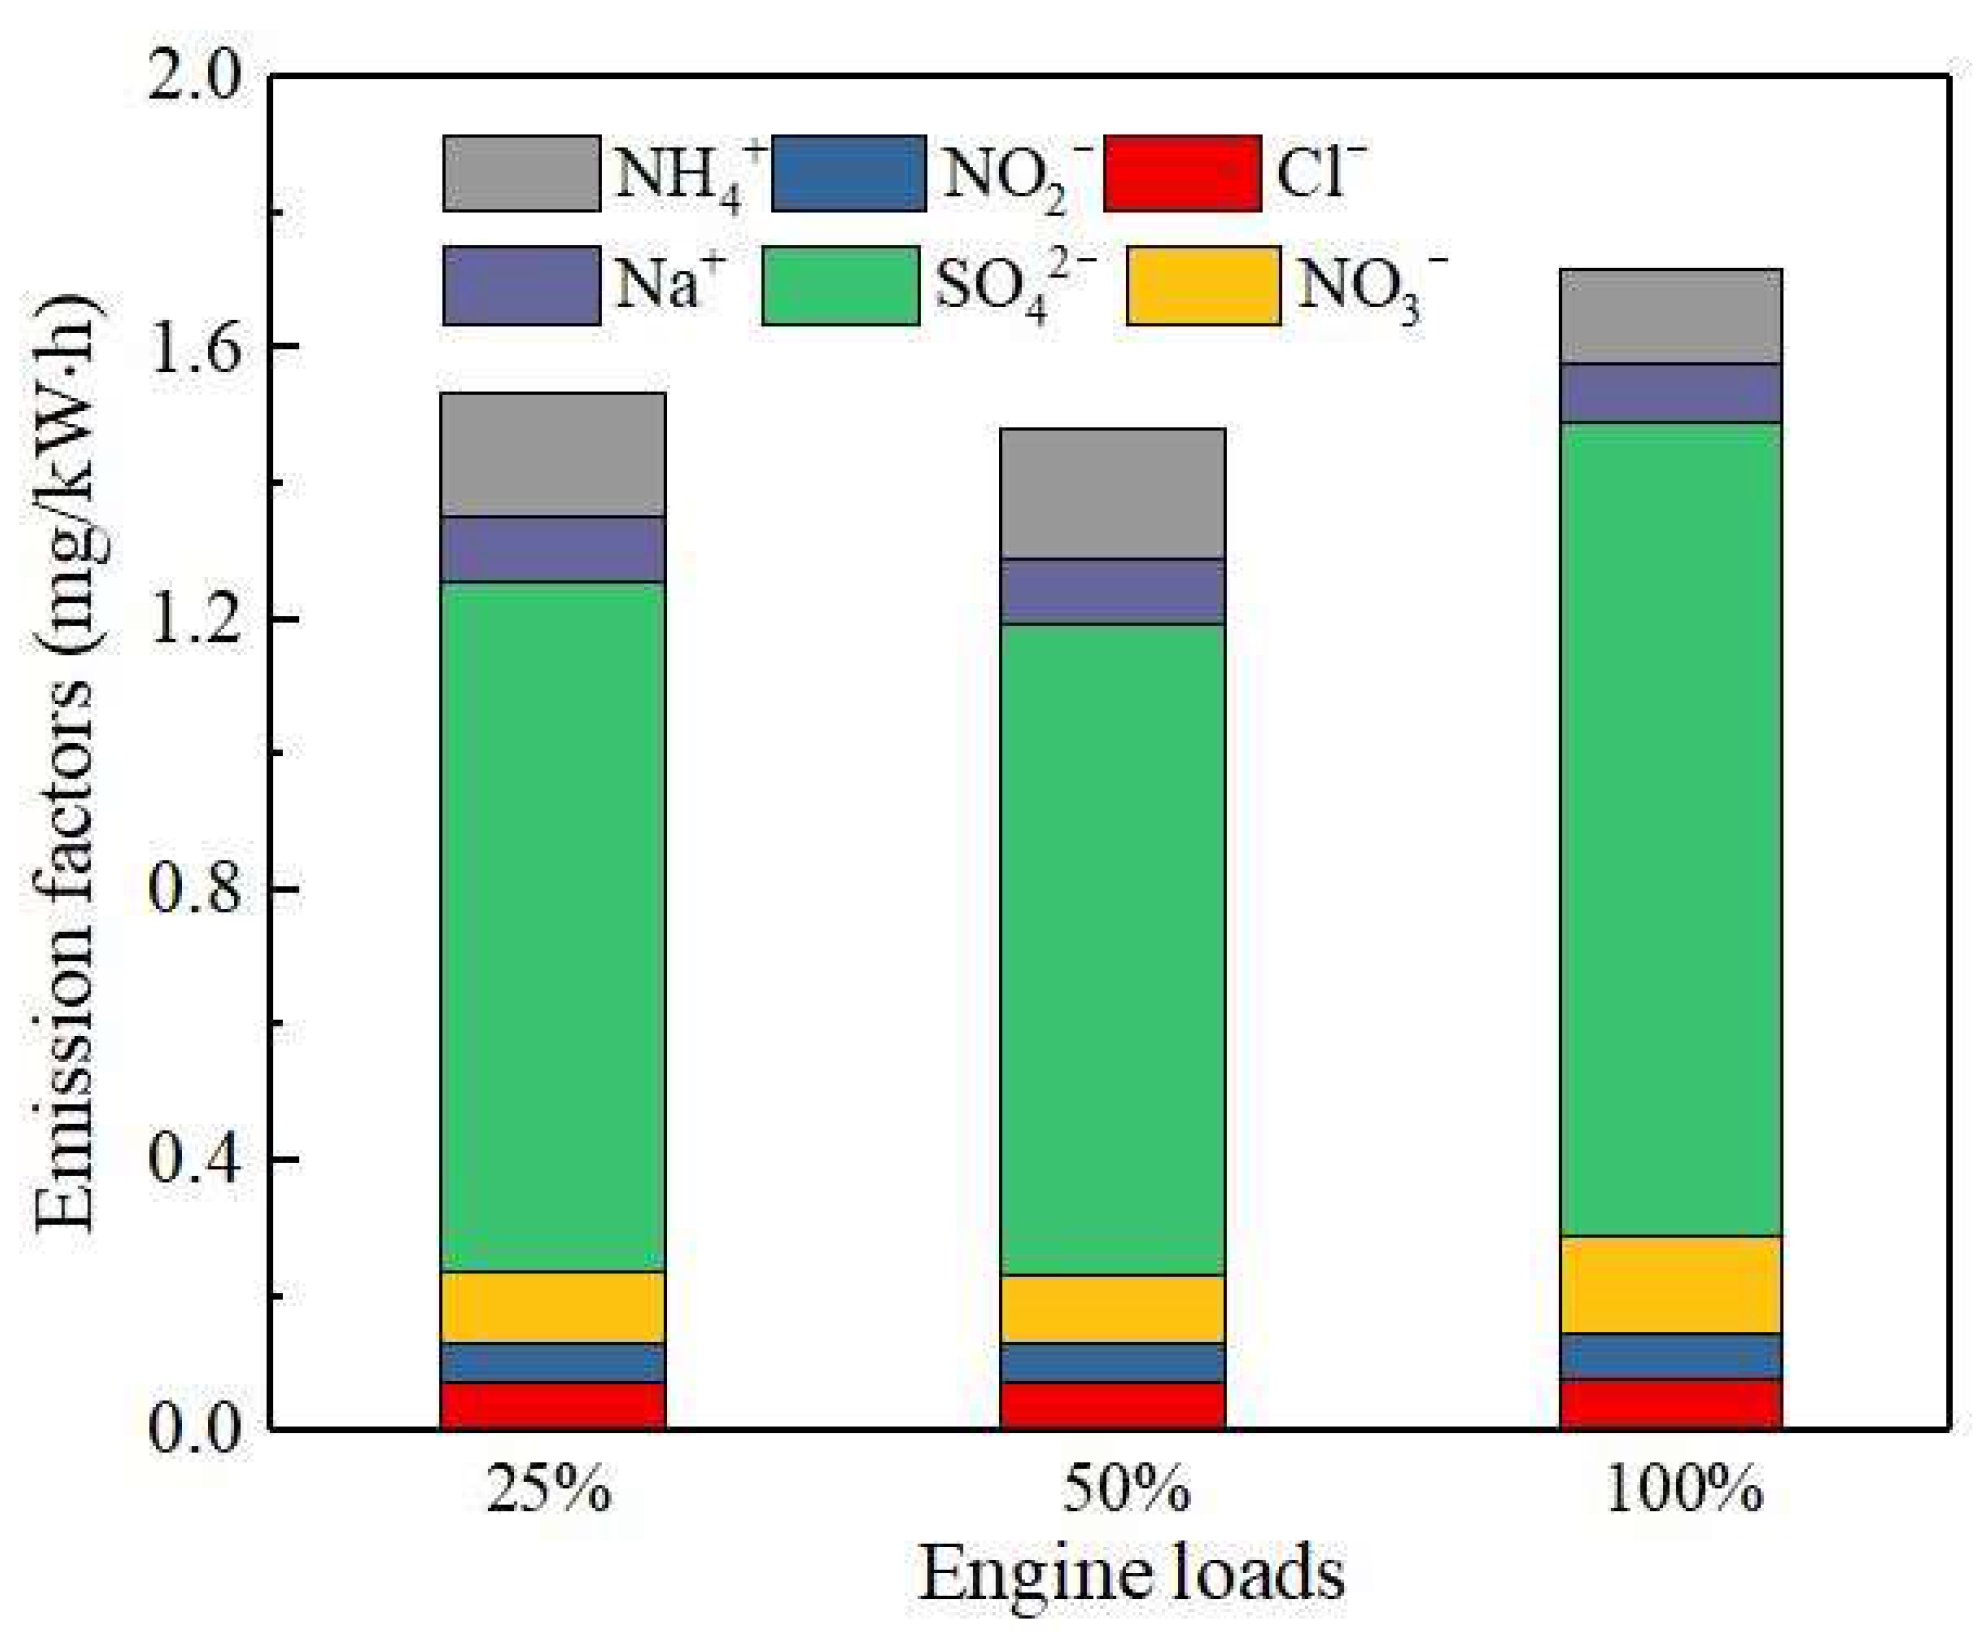
3.4. Emission Characteristics of Ions in PM
3.5. Emission Characteristics and Toxicity of PAHs in PM
4. Conclusions
- DPF demonstrated high removal efficiency for the total PM number and mass emissions.
- Compared to the accumulation mode, the particle capturing efficiency of the nuclei mode was lower, mainly due to the particle size and the desorption process.
- DPF demonstrated a high removal effect on different chemical components, such as OC, EC, and PAHs.
- DPF can effectively reduce particulate matter toxicity.
- In the design of marine DPF, the pore size of the DPF filter body should be slightly larger.
Author Contributions
Funding
Institutional Review Board Statement
Informed Consent Statement
Data Availability Statement
Conflicts of Interest
Abbreviations
| DPF | diesel particulate filter |
| PM | particulate matter |
| OC | organic carbon |
| EC | elemental carbon |
| PAHs | polycyclic aromatic hydrocarbons |
| LNG | liquefied natural gas |
| NTP | non-thermal plasma |
| SCR | selective catalytic reduction |
References
- Gunnarsson, B. Recent ship traffic and developing shipping trends on the Northern Sea Route-Policy implications for future arctic shipping. Mar. Policy 2021, 124, 104369. [Google Scholar] [CrossRef]
- Herdzik, J. Decarbonization of Marine Fuels-The Future of Shipping. Energies 2021, 14, 4311. [Google Scholar] [CrossRef]
- Yoo, B.Y. Economic assessment of liquefied natural gas (LNG) as a marine fuel for CO2 carriers compared to marine gas oil (MGO). Energy 2017, 121, 772–780. [Google Scholar] [CrossRef]
- Fan, C.Y.; Wei, J.J.; Huang, H.Z. Chemical feature of the soot emissions from a diesel engine fueled with methanol–diesel blends. Fuel 2021, 297, 120739–120747. [Google Scholar] [CrossRef]
- IMO MEPC. circ. 723. Information on North American Emission Control Area (ECA) Under Marpol Annex VI. 2010. Available online: https://www.imo.org/en/OurWork/Environment/Pages/Index-of-MEPC-Resolutions-and-Guidelines-related-to-MARPOL-Annex-VI.aspx (accessed on 13 May 2010).
- Breitling, U. Sustainable shipping and port development. ASEAN-Ger. Tech. Coop. 2010, 1, 2–4. [Google Scholar]
- Wilailak, S.; Yoo, B.H.; Kim, Y.; Lee, C.J. Parametric analysis and design optimization of wet SOx scrubber system in marine industry. Fuel 2021, 304, 121369. [Google Scholar] [CrossRef]
- Fridell, E.; Kent, S. Measurements of abatement of particles and exhaust gases in a marine gas scrubber. J. Eng. Marit. Environ. 2016, 1, 154–162. [Google Scholar] [CrossRef]
- Byeong, L.; Raj, M.B. Evaluating the performance of a turbulent wet scrubber for scrubbing particulate matter. J. Aire Manag. Assoc. 2013, 5, 499–506. [Google Scholar]
- Tu, S.E.; Shen, T.; Guo, M.S. Experiment on PM Capture and Regeneration for marine diesel engine. Nav. Archit. Ocean. Eng. 2023, 39, 24–28. [Google Scholar]
- Zhang, Z.Q.; Tian, J.; Li, J.T.; Cao, C.; Tan, D.L. The development of diesel oxidation catalysts and the effect of sulfur dioxide on catalysts of metal-based diesel oxidation catalysts: A review. Fuel Process. Technol. 2022, 233, 107317. [Google Scholar] [CrossRef]
- Luo, J.B.; Tie, Y.H.; Tang, L.F. Effect of regeneration method and ash deposition on diesel particulate filter performance: A review. Environ. Sci. Pollut. Res. 2023, 30, 45607–45642. [Google Scholar] [CrossRef] [PubMed]
- Takuya, K.; Keiichiro, Y. Pilot-scale experiments of continuous regeneration of ceramic diesel particulate filter in marine diesel engine using nonthermal plasma-induced radicals. IEEE Trans. Ind. Appl. 2012, 5, 1649–1656. [Google Scholar]
- Nicholas, R.; Gysel, R.L.; Russell, W.A. Impact of aftertreatment technologies on the in-use gaseous and particulate matter emissions from a tugboat. Energy Fuels 2015, 8, 546–551. [Google Scholar]
- Yang, Z.Y.; Chen, H.W.; Li, C.X.; Guo, H.; Tan, Q.M. Performance Test and Structure Optimization of a Marine Diesel Particulate Filter. Energies 2023, 16, 4336. [Google Scholar] [CrossRef]
- Tan, D.L.; Dong, R.; Zhang, Z.Q. Multi-objective impact mechanism on the performance characteristic for a diesel particulate filter by RF-NSGA III-TOPSIS during soot loading. Energy 2024, 286, 129582. [Google Scholar] [CrossRef]
- Duan, L.S.; Tan, P.Q.; Yin, Y.F. Effect of ash on temperature and particulate emission characteristics of diesel particulate filter during active regeneration. J. Clean. Prod. 2023, 426, 138980. [Google Scholar] [CrossRef]
- Jang, J.; Lee, Y.; Kwon, O. Comparison of fuel efficiency and exhaust emissions between the aged and new DPF systems of Euro 5 diesel passenger car. Int. J. Automot. Technol. 2017, 18, 751–758. [Google Scholar] [CrossRef]
- Shi, Y.X.; Cai, Y.X.; Wang, J.; Pu, X.Y.; Gu, L.B. Influence of PM Size Distribution and Ingredients on DPF Regeneration by Non-thermal Plasma Technology. Plasma Chem. Plasma Process. 2017, 37, 451–464. [Google Scholar] [CrossRef]
- Qi, B.Y.; Li, Z.G.; Lou, D.M.; Zhang, Y.H. Experimental investigation on the effects of DPF Cs-V-based non-precious metal catalysts and their coating forms on non-road diesel engine emission characteristics. Environ. Sci. Pollut. Res. 2022, 30, 9401–9415. [Google Scholar] [CrossRef]
- Manh, D.N.; Quang, V.T.; Luong, N.T. A simulation and experiment study on the emission reduction potential of light-duty diesel engine retrofitted with an after-treatment system: A case study. Energy Sources Part A Recovery Util. Environ. Eff. 2024, 46, 674–688. [Google Scholar]
- Mustaqiman, A.N.; Santos, J.P. Evaluating the performance of particle oxidation catalyst for construction equipment. Atmos. Pollut. Res. 2023, 14, 101947. [Google Scholar] [CrossRef]
- Wu, D.; Cheng, A.Y.; Shao, Y.K. More Than Concentration Reduction: Contributions of Oxidation Technologies to Alleviating Aerosol Toxicity from Diesel Engines. Environ. Sci. Technol. Lett. 2022, 9, 280–285. [Google Scholar] [CrossRef]
- Smith, J.D.; Ruehl, C. Real-time particulate emissions rates from active and passive heavy-duty diesel particulate filter regeneration. Sci. Total Environ. 2019, 680, 132–139. [Google Scholar] [CrossRef] [PubMed]
- Zhang, Y.H.; Lou, D.M.; Tan, P.Q.; Hu, Z.Y.; Fang, L. Effect of catalyzed diesel particulate filter and its catalyst loading on emission characteristics of a non-road diesel engine. J. Environ. Sci. 2023, 126, 794–805. [Google Scholar] [CrossRef]
- GB 15097-2016:1-81; MEE. Limits and Measurement Methods for Exhaust Pollutants from Marine Engines (CHINA I, II). Standards Press of China: Beijing, China, 2016.
- EPA. RESOLUTION MEPC.328(76). USA. 2021. Available online: https://www.epa.gov/system/files/documents/2024-05/mepc-328-76.pdf (accessed on 1 July 2022).
- Shim, B.J.; Park, K.S.; Koo, J.M.; Nguyen, M.S.; Jin, S.H. Estimation of Soot Oxidation Rate in DPF under Carbon and Non-carbon Based Particulate Matter Accumulated Condition. Int. J. Automot. Technol. 2013, 14, 207–212. [Google Scholar] [CrossRef]


| Type | WD10C190-15 | Parameters | LSDF |
|---|---|---|---|
| Stroke | 4 | Density (20 °C, kg/m3) | 845 |
| Cylinders | 6 | S (%wt) | <0.1 |
| Intake | Inter-cooling | C (%wt) | 85.6 |
| Rate power (kW) | 140 | H (%wt) | 13.4 |
| Rate speed (r/min) | 1500 | N (%wt) | 0.06 |
| Bore × stroke (mm × mm) | 126 × 130 | O (%wt) | 0.1 |
| Emission standard | Tier II | Low calorific value (MJ/kg) | 42.52 |
| Diameter (mm) | Length (mm) | Cell Density (cpsi) | Wall Thickness (mm) | Porosity (%) |
|---|---|---|---|---|
| 270 | 310 | 100 | 0.4 | 50 |
| PAHs | Nap | Acy | Ace | Flu | Phe | Ant | Flua | Pyr |
| TEF | 0.001 | 0.001 | 0.001 | 0.001 | 0.001 | 0.01 | 0.001 | 0.001 |
| PAHs | BaA | Chr | BbF | BkF | BaP | DahA | BghiP | IcdP |
| TEF | 0.1 | 0.01 | 0.1 | 0.1 | 1 | 1 | 0.01 | 0.1 |
| PAHs | without DPF | with DPF | PAHs | without DPF | with DPF |
|---|---|---|---|---|---|
| Nap | - | - | BaA | 21.687 | 3.0762 |
| Acy | - | - | Chr | 13.121 | 1.692 |
| Ace | - | - | BbF | 92.347 | 19.995 |
| Flu | 0.173 | 0.051 | BkF | 67.945 | 34.145 |
| Phe | 1.651 | 0.578 | BaP | 470.5 | 50.757 |
| Ant | 0.723 | 0.308 | DahA | 439.815 | 189.185 |
| Flua | 2.455 | 0.815 | BghiP | 5.801 | 1.507 |
| Pyr | 2.491 | 0.646 | IcdP | 52.018 | 6.614 |
Disclaimer/Publisher’s Note: The statements, opinions and data contained in all publications are solely those of the individual author(s) and contributor(s) and not of MDPI and/or the editor(s). MDPI and/or the editor(s) disclaim responsibility for any injury to people or property resulting from any ideas, methods, instructions or products referred to in the content. |
© 2024 by the authors. Licensee MDPI, Basel, Switzerland. This article is an open access article distributed under the terms and conditions of the Creative Commons Attribution (CC BY) license (https://creativecommons.org/licenses/by/4.0/).
Share and Cite
Zhou, J.; Zhang, J.; Jiang, G.; Xie, K. Using DPF to Control Particulate Matter Emissions from Ships to Ensure the Sustainable Development of the Shipping Industry. Sustainability 2024, 16, 6642. https://doi.org/10.3390/su16156642
Zhou J, Zhang J, Jiang G, Xie K. Using DPF to Control Particulate Matter Emissions from Ships to Ensure the Sustainable Development of the Shipping Industry. Sustainability. 2024; 16(15):6642. https://doi.org/10.3390/su16156642
Chicago/Turabian StyleZhou, Jinxi, Junling Zhang, Guoxian Jiang, and Kai Xie. 2024. "Using DPF to Control Particulate Matter Emissions from Ships to Ensure the Sustainable Development of the Shipping Industry" Sustainability 16, no. 15: 6642. https://doi.org/10.3390/su16156642
APA StyleZhou, J., Zhang, J., Jiang, G., & Xie, K. (2024). Using DPF to Control Particulate Matter Emissions from Ships to Ensure the Sustainable Development of the Shipping Industry. Sustainability, 16(15), 6642. https://doi.org/10.3390/su16156642