Article

Scale Differences and Gradient Effects of Local Climate Zone Spatial Pattern on Urban Heat Island Impact—A Case in Guangzhou’s Core Area

1
Faculty of Geography, Yunnan Normal University, Kunming 650500, China
2
The Engineering Research Centre of GIS Technology in Western China, Ministry of Education, Yunnan Normal University, Kunming 650500, China
3
College of Resources, Hunan Agricultural University, Changsha 410127, China
*
Authors to whom correspondence should be addressed.
Sustainability 2024, 16(15), 6656; https://doi.org/10.3390/su16156656 (registering DOI)
Submission received: 7 July 2024 / Revised: 31 July 2024 / Accepted: 1 August 2024 / Published: 3 August 2024

Abstract

:
With the continuous development of cities, the surface urban heat island intensity (SUHII) is increasing, leading to the deterioration of the urban thermal environment, increasing energy consumption, and endangering the health of urban residents. Understanding the spatio-temporal scale difference and gradient effect of urban spatial patterns on the impact of SUHII is crucial for improving the climate resilience of cities and promoting sustainable urban development. This paper investigated the characteristics of SUHII changes at different time periods based on local climate zones (LCZs) and downscaled land surface temperature (LST) data. Meanwhile, landscape pattern indicators and the multiscale geographically weighted regression (MGWR) model were utilized to analyze the impacts of urban spatial patterns on SUHII at multiple spatial–temporal scales. The results indicated that the SUHII of each LCZ type exhibited diverse patterns in different time periods. High SUHII occurred in summer daytime and autumn nighttime. Compact and high-rise buildings (LCZ1/2/4) showed markedly higher SUHII during the daytime or nighttime, except for heavy industry. The extent of influence and the dominant factors of LCZ spatial patterns on SUHII exhibit obvious scale differences and gradient effects. At the regional scale, highly regular and compacted built-up areas tended to increase SUHII, while single and continuously distributed built-up areas had a greater impact on increasing SUHII. At the local scale, the impact of the PLAND (1/2/4/5/10) on SUHII exhibited a trend of diminishing from urban to suburban areas. In urban areas, the PLAND of LCZ 1, LCZ 2, and LCZ4 was the major factor affecting the increase in SUHII, whereas, in suburban areas, the PLAND of LCZ 2 and LCZ 10 was the major influencing factor on SUHII. The results can provide a scientific reference for mitigating urban heat island effects and constructing an ecologically ‘designed’ city.

1. Introduction

By 2050, 68% of the world population are likely to be living in urban areas, according to the 2018 Revision of World Urbanization Prospects. The urban heat island (UHI) effect will become more severe as urbanization accelerates [1,2]. The UHI effect referred to a phenomenon in which urban temperatures are significantly higher than in the surrounding suburbs [3]. The effects not only cause the frequency of high-temperature heatwave events in cities, but also increase the morbidity and mortality of various heat-related cardiovascular disorders, respiratory infections, and so on [4,5,6]. Therefore, it is significant to deeply study the influence of urbanization on the UHI effect, so as to improve the comfort of the urban heat environment and promote sustainable urban development.
Many studies have analyzed the effect of urbanization on the UHI effect from various perspectives [7,8,9,10,11,12]. Undoubtedly, the expansion of impervious surface area (ISA) has become the most direct driver of urban warming [13,14], especially in metropolises with high spatial heterogeneity [15]. Moreover, urban spatial form has received extensive attention as an important factor influencing the UHI effect [16,17]. Yang et al. [18] studied 332 cities and urban agglomerations in various climate zones in China. They found significant discrepancies in associations between SUHII and landscape indicators under the impact of land use alteration and climatic factors. Liu et al. [19] investigated 1,288 cities in China and demonstrated a significant scale-dependent association between urban form and UHI. Li et al. [20] emphasized that SUHII was also directly related to the amplification effect between urban density and urban sites, except urban size. Some researchers have focused on the exploration of UHI effects in terms of multiple cities, diurnal discrepancies, seasonal variations, and spatio-temporal dynamics [21,22,23]. For instance, Li et al. [24] studied 419 major cities across the globe and emphasized the spatial heterogeneity of the connection between diurnal/seasonal SUHII and influencing factors, further pointing to the spatially non-stationary effects that should be explored in future research. Furthermore, central urban areas with high urbanization and building density are typical areas for the study of UHI phenomena, which usually have stronger UHI effects. Chen et al. [25] used the XGBoost model to evaluate the effect of urban spatial form (USF) indicators on land surface temperature (LST) from three dimensions—landscape pattern, building form, and social development—in their study of the main urban area of Xi’an, and found that building form had the most significant effect on LST. Yuan et al. [26] further explored the impact of 2D and 3D urban form on LST, and the results highlighted the key role of 3D building metrics. Yin et al. [27], in their study of the association between urban form and LST in Nanjing using a multiscale geographically weighted regression (MGWR) model, revealed the interesting phenomenon that the LST in high-rise and super-high-rise building areas was lower than that in medium-rise building areas. Although these studies have enriched our understanding of the relationship between urban spatial patterns and LST/SUHII, most of them have focused on a single scale or a specific region to analyze the effects of urban spatial patterns on UHI. An in-depth understanding of the combined effects of urban spatial patterns on SUHII at different scales, especially the spatial and temporal scale differences and gradient effects, is still insufficient.
The importance of scale difference and gradient effect in the study of the UHI effect should not be neglected, as they can effectively reveal the temperature discrepancy between various regions within urban areas [28] and its formation mechanism. The city is a complex system with multiple scales and centers, and its internal thermal environment is jointly influenced by a variety of factors. For instance, urban center areas tend to form a strong UHI phenomenon due to dense buildings and population concentration, while suburban areas have a relatively weak UHI effect due to high green coverage [29]. This center-edge thermal gradient not only reflects the characteristics of the urban spatial structure, but also indicates the inhomogeneity of the urban heat environment [30]. Moreover, the disparity of the urban thermal environment at different scales within cities is also closely related to factors such as urban form, land use, and population density [31]. For example, high-density building clusters may lead to lower wind speeds and poor heat dispersion in localized areas, thus exacerbating the UHI effect. Reasonable urban planning, such as increasing green space and water bodies [32] and installing ventilation corridors [33], can effectively mitigate the localized UHI effect and improve the urban heat environment. Hence, spatial non-stationarity and scale effects must be considered when analyzing the impact of urban spatial form on SUHII [34]. Geographically weighted regression (GWR) and multiscale geographically weighted regression (MGWR) models can capture the spatial heterogeneity of geographic data [35]. In particular, the MGWR model may show more potential and superiority for the study of urban heat environments due to its multiscale analysis capability. Specifically, the MGWR model can be employed to quantify the impacts of various urban spatial pattern indicators, such as the percentage of landscape (PLAND), contagion index (CONTAG), largest patch index (LPI), and patch density (PD), on SUHII, and identify the relative contributions and mechanisms of these factors’ formation at different scales. This multiscale quantitative analysis method provides a valuable perspective for exploring the relationship between urban spatial patterns and SUHII, and provides an important scientific basis for enhancing urban ecological sustainability.
To better reveal the correlation between spatial morphology and SUHII within the city, it is necessary to obtain more accessible and high-precision data. However, fine LST data with high spatial and temporal resolution and high-resolution spatial morphology parameters within cities are still difficult to obtain. To fill this research gap, Stewart and Oke [36] proposed the Local Climate Zone (LCZ) classification scheme in 2012, which provides a powerful research framework for exploring the relationship between urban spatial patterns and LST. The LCZ scheme effectively quantifies the association between urban climate and spatial morphology. It can finely assess the characteristics of thermal environmental differentiation within cities. Bechtel et al. [37] investigated SUHII in 50 cities globally, demonstrating the overall applicability of LCZ schemes in SUHII studies. Yuan et al. [38] explored SUHII changes at the global scale, revealing a decrease in SUHII with reduced building heights and increased openness in building layouts. Several studies have noted that the SUHII of LCZs within cities changes by background climate, season, and time of day [39,40,41]. Jian et al. [42] used a case study in Chengdu and found that the spatio-temporal dynamics of the relationship between urban spatial pattern alteration and surface temperature varied with different time periods and building environment types. Zhang et al. [43] noted that different LCZ spatial patterns have diurnal/seasonal disparities on the effects of SUHII and emphasized the importance of LCZ spatial configurations in assessing and mitigating the UHI effect. Furthermore, a few studies have utilized downscaling methods to improve the spatial and temporal resolution of LST data to further investigate UHI effects [44,45,46]. For instance, Peng et al. [47] evaluated the UHI in Fukuoka, Japan, using downscaled surface temperature data based on the random forest (RF) algorithm. In their study of the Guangdong–Hong Kong–Macao Greater Bay Area, Wang and Wang [48] discovered that downscaled LST data combined with LCZ classification can effectively reveal the surface thermal environmental characteristics and urban morphological features of urban agglomerations. The above studies reveal that LCZ classification and LST downscaling techniques provide new perspectives and tools for the study of the relationship between urban spatial morphology and SUHII, but there are still fewer studies in this field.
To fill the research gap, this paper selected Guangzhou as the study area and investigated the spatio-temporal scale differences and gradient effects of urban spatial morphology on SUHII. Compared with previous studies, we not only focused on diurnal/seasonal SUHII characteristics, but also explored the scale differences and gradient effects of SUHII within different LCZ types using the landscape pattern index. The results of the study help to comprehensively understand the spatial and temporal characteristics of the urban heat environment, and provide scientific references for the creation of eco-designed cities and the refinement of urban heat environment management. The following four aspects are specifically studied: (1) realizing the mapping of the LCZ of Guangzhou in 2021; (2) downscaling the initial MODIS LST product (MOD11A1) to 240 m spatial resolution; (3) analyzing the characteristics of the changes of SUHII within the LCZ of Guangzhou at different time scales; (4) quantitatively analyzing the impact mechanism and gradient effect of the urban morphological pattern on SUHII at the regional and local scales, employing the MGWR model.

2. Materials and Methods
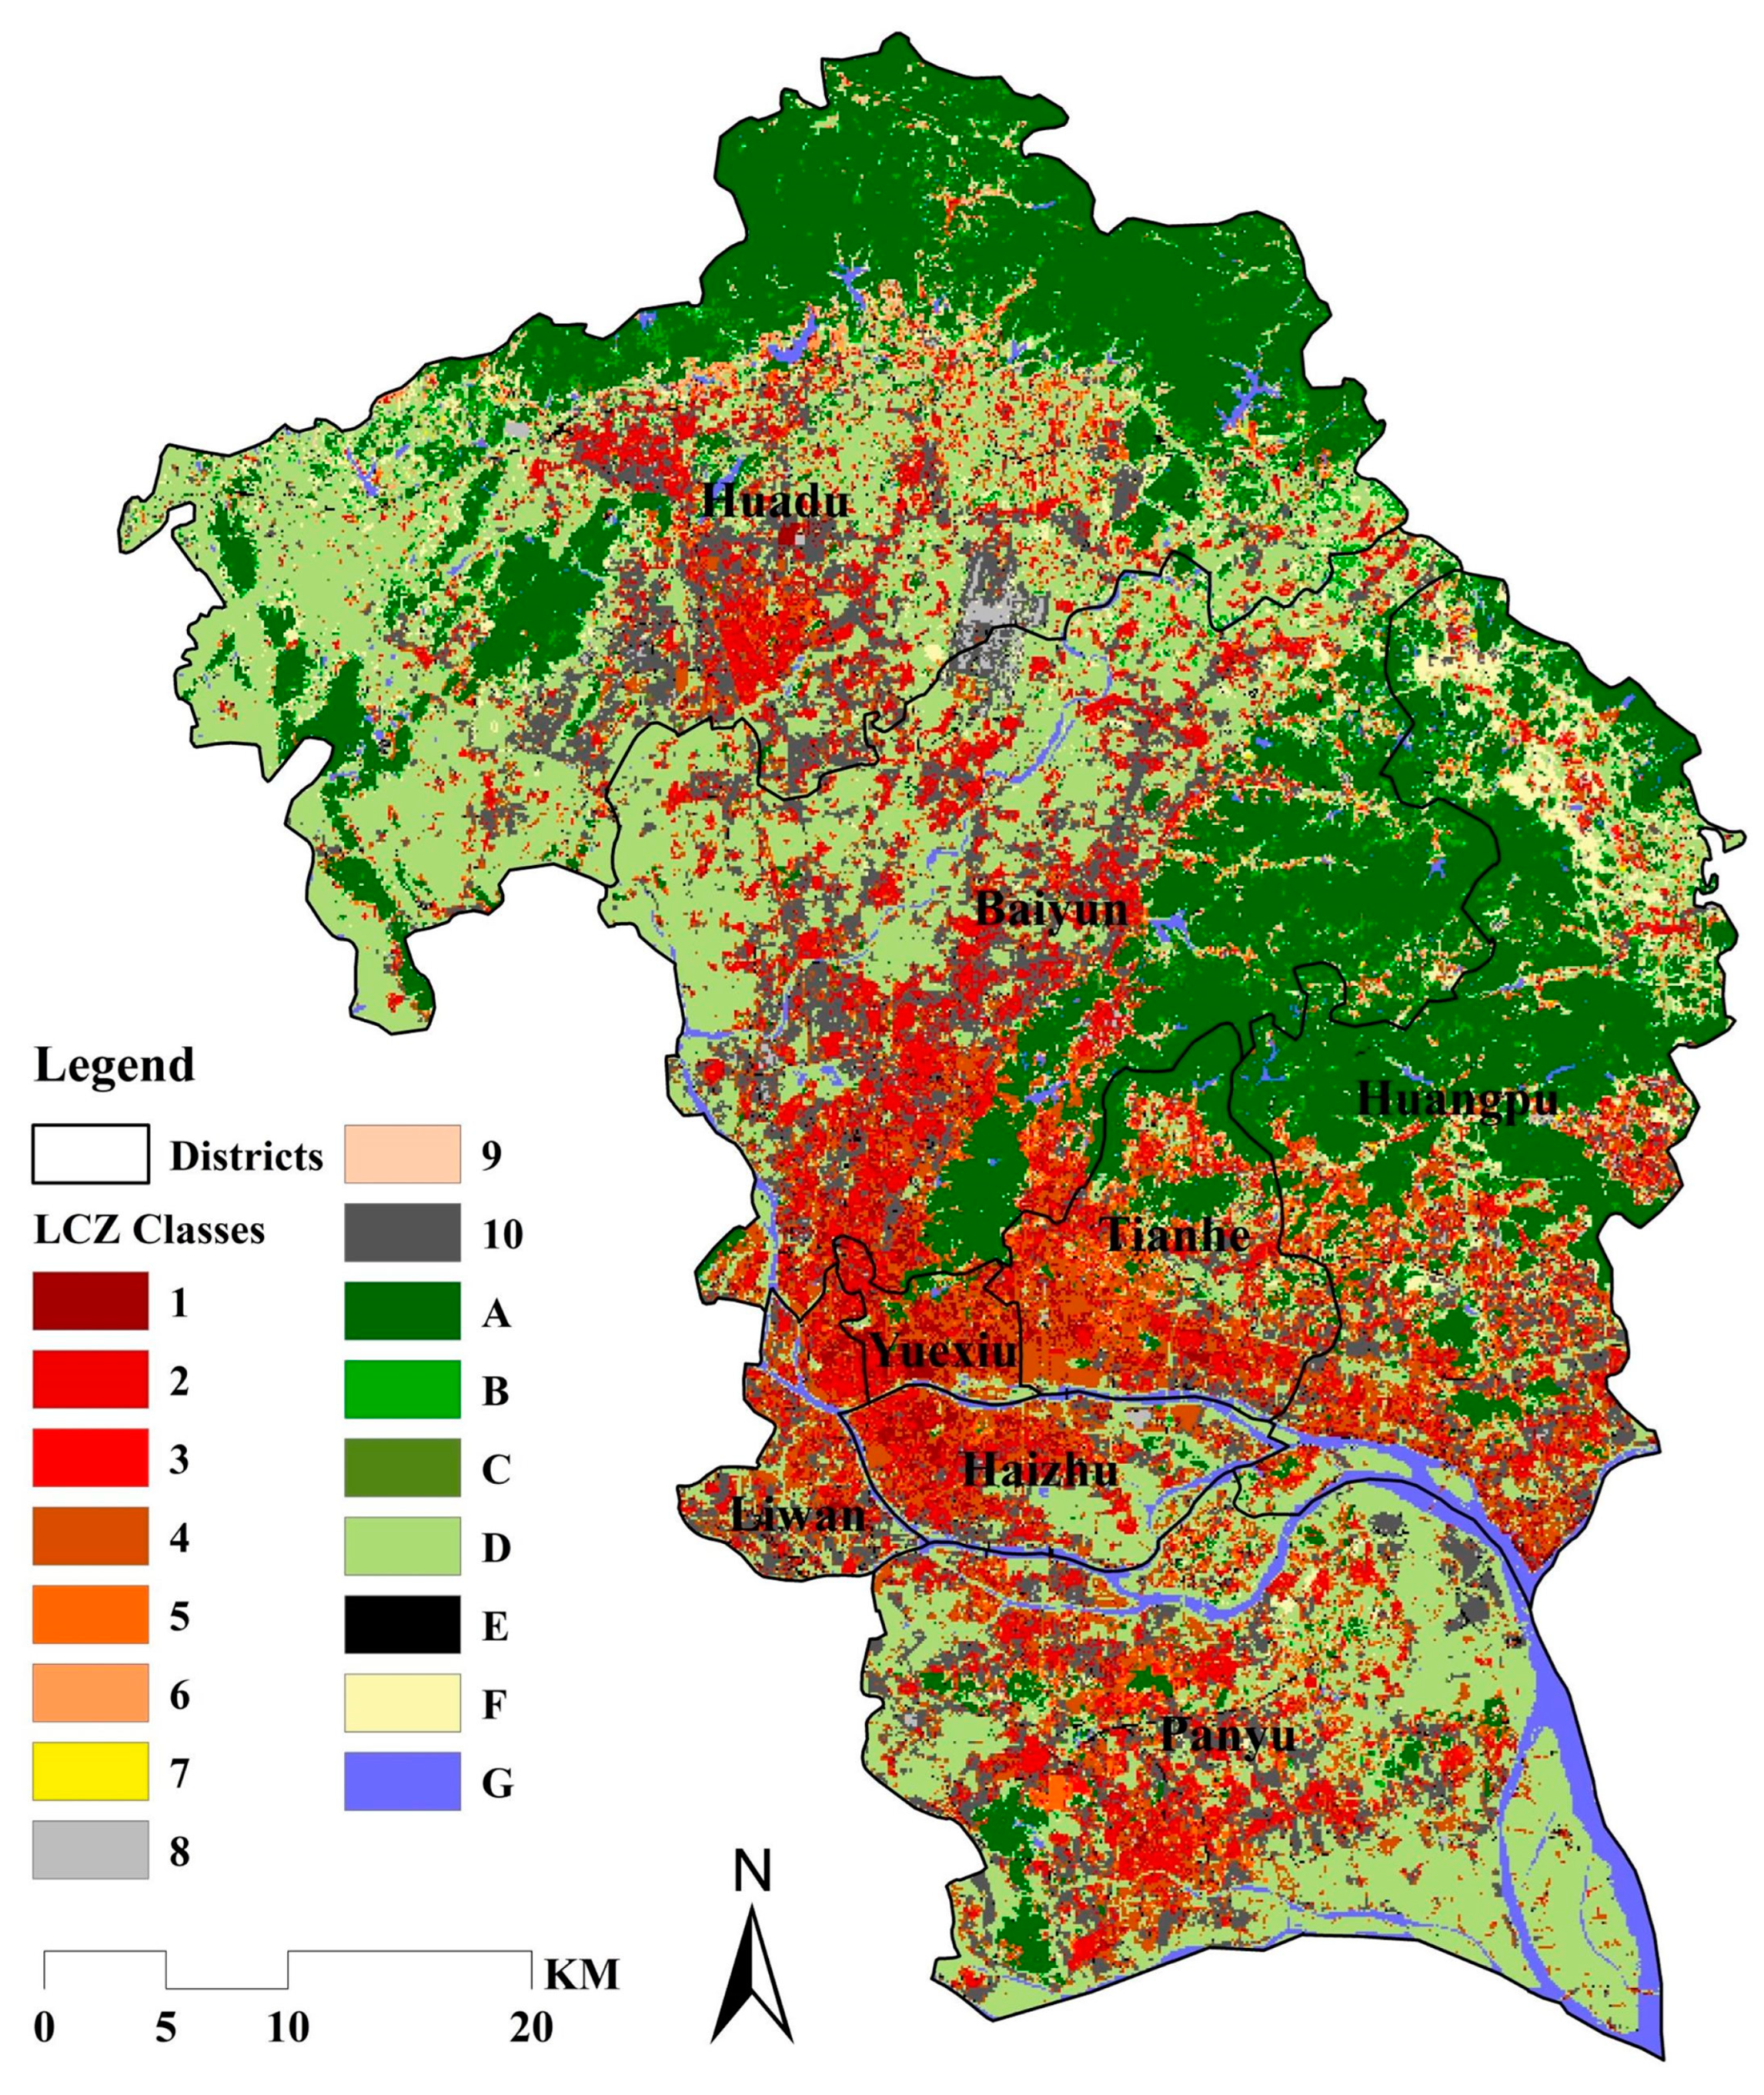
2.1. Study Area

Guangzhou is a national central city and one of China’s megacities, located in the south of mainland China (22°26′–23°56′ N, 112°57′–114°3′ E). At the end of 2021, the resident population of Guangzhou was 18.8106 million, with an urbanization rate of 86.46%. Since the reform and opening up of China, Guangzhou has experienced rapid urbanization expansion, population surge, and economic prosperity, while at the same time exacerbating the pressure on the urban ecological environment. Specifically, the frequent occurrence of extreme weather events, such as high temperatures and heat waves, has posed a serious threat to the daily life, health, and safety of Guangzhou citizens. Notably, according to the World Bank (ESMAP) 2020 report, Guangzhou has been selected as the first pilot city of the ‘China Sustainable Urban Cooling Project’, which signifies Guangzhou’s active exploration and practice in urban climate adaptation and mitigation. In this paper, regions of high urban population concentration and frequent land development activities were selected as the study area (Figure 1). Specifically, these regions include Liwan, Yuexiu, Haizhu, Tianhe, Baiyun, Huangpu, Panyu, and Huadu districts. Furthermore, five representative sample areas (Figure 1) were selected for the fine spatio-temporal scale study, including old urban areas (Haizhu, Liwan, and Yuexiu districts), new urban areas (Tianhe district), urban–rural areas (Panyu district), rural areas (Huadu district), and industrial parks (Baiyun district).

2.2. Data Collection and Preprocessing

The MODIS Daily Surface Temperature product (MOD11A1), the MODIS Daily Surface Albedo product (MOD09GA), the MODIS Annual Land Cover product (MCD12Q1), the Shuttle Radar Topography Mission (SRTM), and Google Earth imagery were utilized in this research. Table 1 shows the sources of the data.
Data preprocessing consisted of selecting downscaled predictor variables and collecting LCZ training samples. According to previous studies [49,50,51], eight predictor variables were finally selected, namely, the Normalized Difference Vegetation Index (NDVI), Normalized Difference Built-up Index (NDBI), Normalized Difference Water Index (NDWI), Modified Normalized Difference Water Index (MNDWI), Enhanced Vegetation Index (EVI), Soil-Adjusted Vegetation Index (SAVI), land cover, and elevation. All of the MODIS series products can be retrieved from the Google Earth Engine (GEE) cloud platform and do not require atmospheric or radiometric correction [52]. The LCZ training samples were plotted directly in Google Earth Pro as vectorized KML files [53].
The MOD11A1 dataset includes diurnal surface temperature data. Seasonal/annual mean surface temperatures were synthesized using the median method to eliminate the effects of seasonal/annual weather extremes. Seasonal variations were defined by standard climatic patterns: spring (March to May), summer (June to August), autumn (September to November), and winter (December to February). The LST units were converted from Kelvin to Celsius using the conversion function. The expression is as follows:
L S T = 0.02 * D N 273.15
where D N expresses the pixel value of MOD11A1.

2.3. Methods

Multi-source remote sensing data were employed to acquire high spatio-temporal resolution LST data by the downscaling method and LCZ classification results. Then, the multiscale impacts of urban spatial patterns on SUHII were revealed using landscape pattern indices and the MGWR model. The detailed framework is shown in Figure 2.

2.3.1. LCZ Mapping

This paper created the LCZ maps utilizing the World Urban Database and Access Portal Tool (WUDAPT) [54] based on the classification scheme shown in Figure 3. The detailed process was carried out according to the LCZ Generator online platform constructed by Demuzere et al. [55]. Please note that the LCZ data acquired by the platform have a spatial resolution of 100 m.

2.3.2. LST Downscaling

In this paper, the spatial resolution of MODIS LST data was downscaled from 1 km to 240 m employing the RF model. The obtained LST data have higher spatio-temporal resolution, which can capture and explore the detailed changes of the urban surface thermal environment at a finer scale. The downscaling process is roughly divided into four stages (Figure 2B). First, all predictor variables are resampled to 960 m and 240 m pixel sizes, respectively, for model fitting and LST downscaling. Second, the association between LST (960 m) and predictor variables was determined using the RF method. Third, the established RF model was implemented to the predictor variables of the 240 m dataset for LST downscaling. Finally, the results of the LST downscaling at a 240 m resolution were obtained through the residual correction. The fitting accuracy was assessed using the root mean square error (RMSE) and the coefficient of determination (R2). The lower the RMSE and the higher the R2, the more accurate the downscaled results and the better the model fit. This paper also provides the relevant LST downscaling code, which can be found in the Supplementary Materials.

2.3.3. SUHII Calculation

The mean value of the vegetation zones (LCZ A~D) was utilized to express the surface temperature in the suburban district according to the previous investigations [56,57,58]. The SUHII is the difference between the LCZ type and the average LST value of LCZ A~D. The calculation of SUHII is shown in Equation (2):
S U H I I L C Z x = L S T L C Z x L S T r u r a l
where L C Z x represents the type of LCZ, S U H I I L C Z x is the SUHII of L C Z x type, L S T L C Z x is the average LST of L C Z x type, and L S T r u r a l is the average LST of the LCZ A~D.

2.3.4. Metrics Selected for LCZ Spatial Patterns

Nine landscape indices were selected according to previous studies [59,60,61]. The details are shown in Table 2. We applied the moving window approach in Fragstats4.2 to obtain these landscape indices and determined the grid scale size of the moving window scientifically. Firstly, the nine landscape indices were calculated for different window radii (300 m as a tolerance) in the range of 300~2400 m based on the raw LCZ data (100 m resolution). Secondly, a grid the same as the scale radius was built in ArcGIS, and the landscape indices were superimposed with the corresponding SUHII to obtain the LCZs and SUHII according to the grid cells. Finally, Spearman’s correlation analyses of the nine indices and the SUHII on different window radii were performed in SPSS. According to tests and previous studies [43,62,63], the PLAND index was the main factor influencing LST/SUHII. This study prioritizes the correlation between PLAND and SUHII. The optimal window radius was determined by comparing the absolute correlation coefficients. As shown in Figure A1, the correlation coefficients of most PLAND (1–10) metrics with daytime/nighttime SUHII were larger at 1200 m. Therefore, 1200 × 1200 m was eventually determined as the moving window radius and grid scale at the regional scale.
Moreover, a multicollinearity test was conducted and indicators with a variance inflation factor (VIF) higher than 7.5 were excluded. Four landscape indicators were eventually selected, namely, PLAND, PD, LPI, and SHAPE_AM. The landscape pattern indices at different spatial scales in 2021 were obtained using the moving window approach according to the four indicators, with window radii of 1200 × 1200 m and 240 × 240 m, respectively.

2.3.5. Multiscale Geographically Weighted Regression (MGWR)

In the complex urban context, the indicators characterizing urban spatial form exhibit different degrees of spatial non-stationarity relationships at different spatial scales. This paper employed the MGWR to analysis the effect of urban spatial form on SUHII, which can effectively reveal the spatial heterogeneity and scale dependence of the UHI effect within the urbanization process. Moreover, OLS and GWR were applied to compare with MGWR to assess the performance of the model. The quadratic kernel function with adaptive bandwidth was used to estimate all of the spatial weights, the optimal bandwidths were identified employing the modified Akaike’s information criterion (AICc), and the three model performances were assessed utilizing the Adj-R2 metrics. The smaller the AICc value and the larger the Adj-R2, the better the performance of the model and the more dependable the regression estimation. The MGWR is calculated as in Equation (3).
y i = β 0 u i , v i + k = 1 n β b w k u i , v i x i k + ε i
where y i is the SUHII at location I, ( u i , v i ) expresses the coordinates of the sample points, β b w k expresses the explanatory variable kth of the regression coefficient, n is the number of sample points, b w k is the bandwidth, and ε i is the error term of the model.

3. Results

3.1. Mapping Results for LCZ

The accuracy of the LCZ classification is shown in Table 3. The overall accuracy and the Kappa coefficient were 0.81 and 0.83, respectively, which are higher than the accuracy criteria for LCZ maps proposed by Bechtel (>0.5 for each accuracy metric) [53]. This indicated that LCZ mapping was reliable and satisfied the needs of the study.
The results of the LCZ classification are shown in Figure 4 and Table 4. The results revealed that LCZ built types accounted for 36.22% of the total area and showed a radial distribution around the city center towards the outer fringe zones. Specifically, the proportion of area occupied by LCZ 1, LCZ 2, LCZ 4, LCZ 5, and LCZ 10 was large among the built-up zones. Among them, the heavy industrial zone (LCZ 10) occupied the highest proportion of area with 11.13%, and was mainly distributed in the peripheral areas of the city. This was followed by LCZ 2 and LCZ 4, with area proportions of 8.86% and 8.72%, respectively, which were mostly focused on in the old and new urban areas. Notably, the LCZ 4 was the dominant building type in the new urban area. LCZ 1 was concentrated in Yuexiu district with an area percentage of 2.11%. LCZ 5 was located in Tianhe and Huangpu districts with an area proportion of 2.44%. On the contrary, the area proportion of land cover type was 63.78%. Among them, LCZ D had the largest proportion of area (30.4%) and was mainly located in Huadu, Baiyun, and Panyu districts. This was followed by LCZ A, which was mainly distributed in the east and north, with an area proportion of 23.49%.

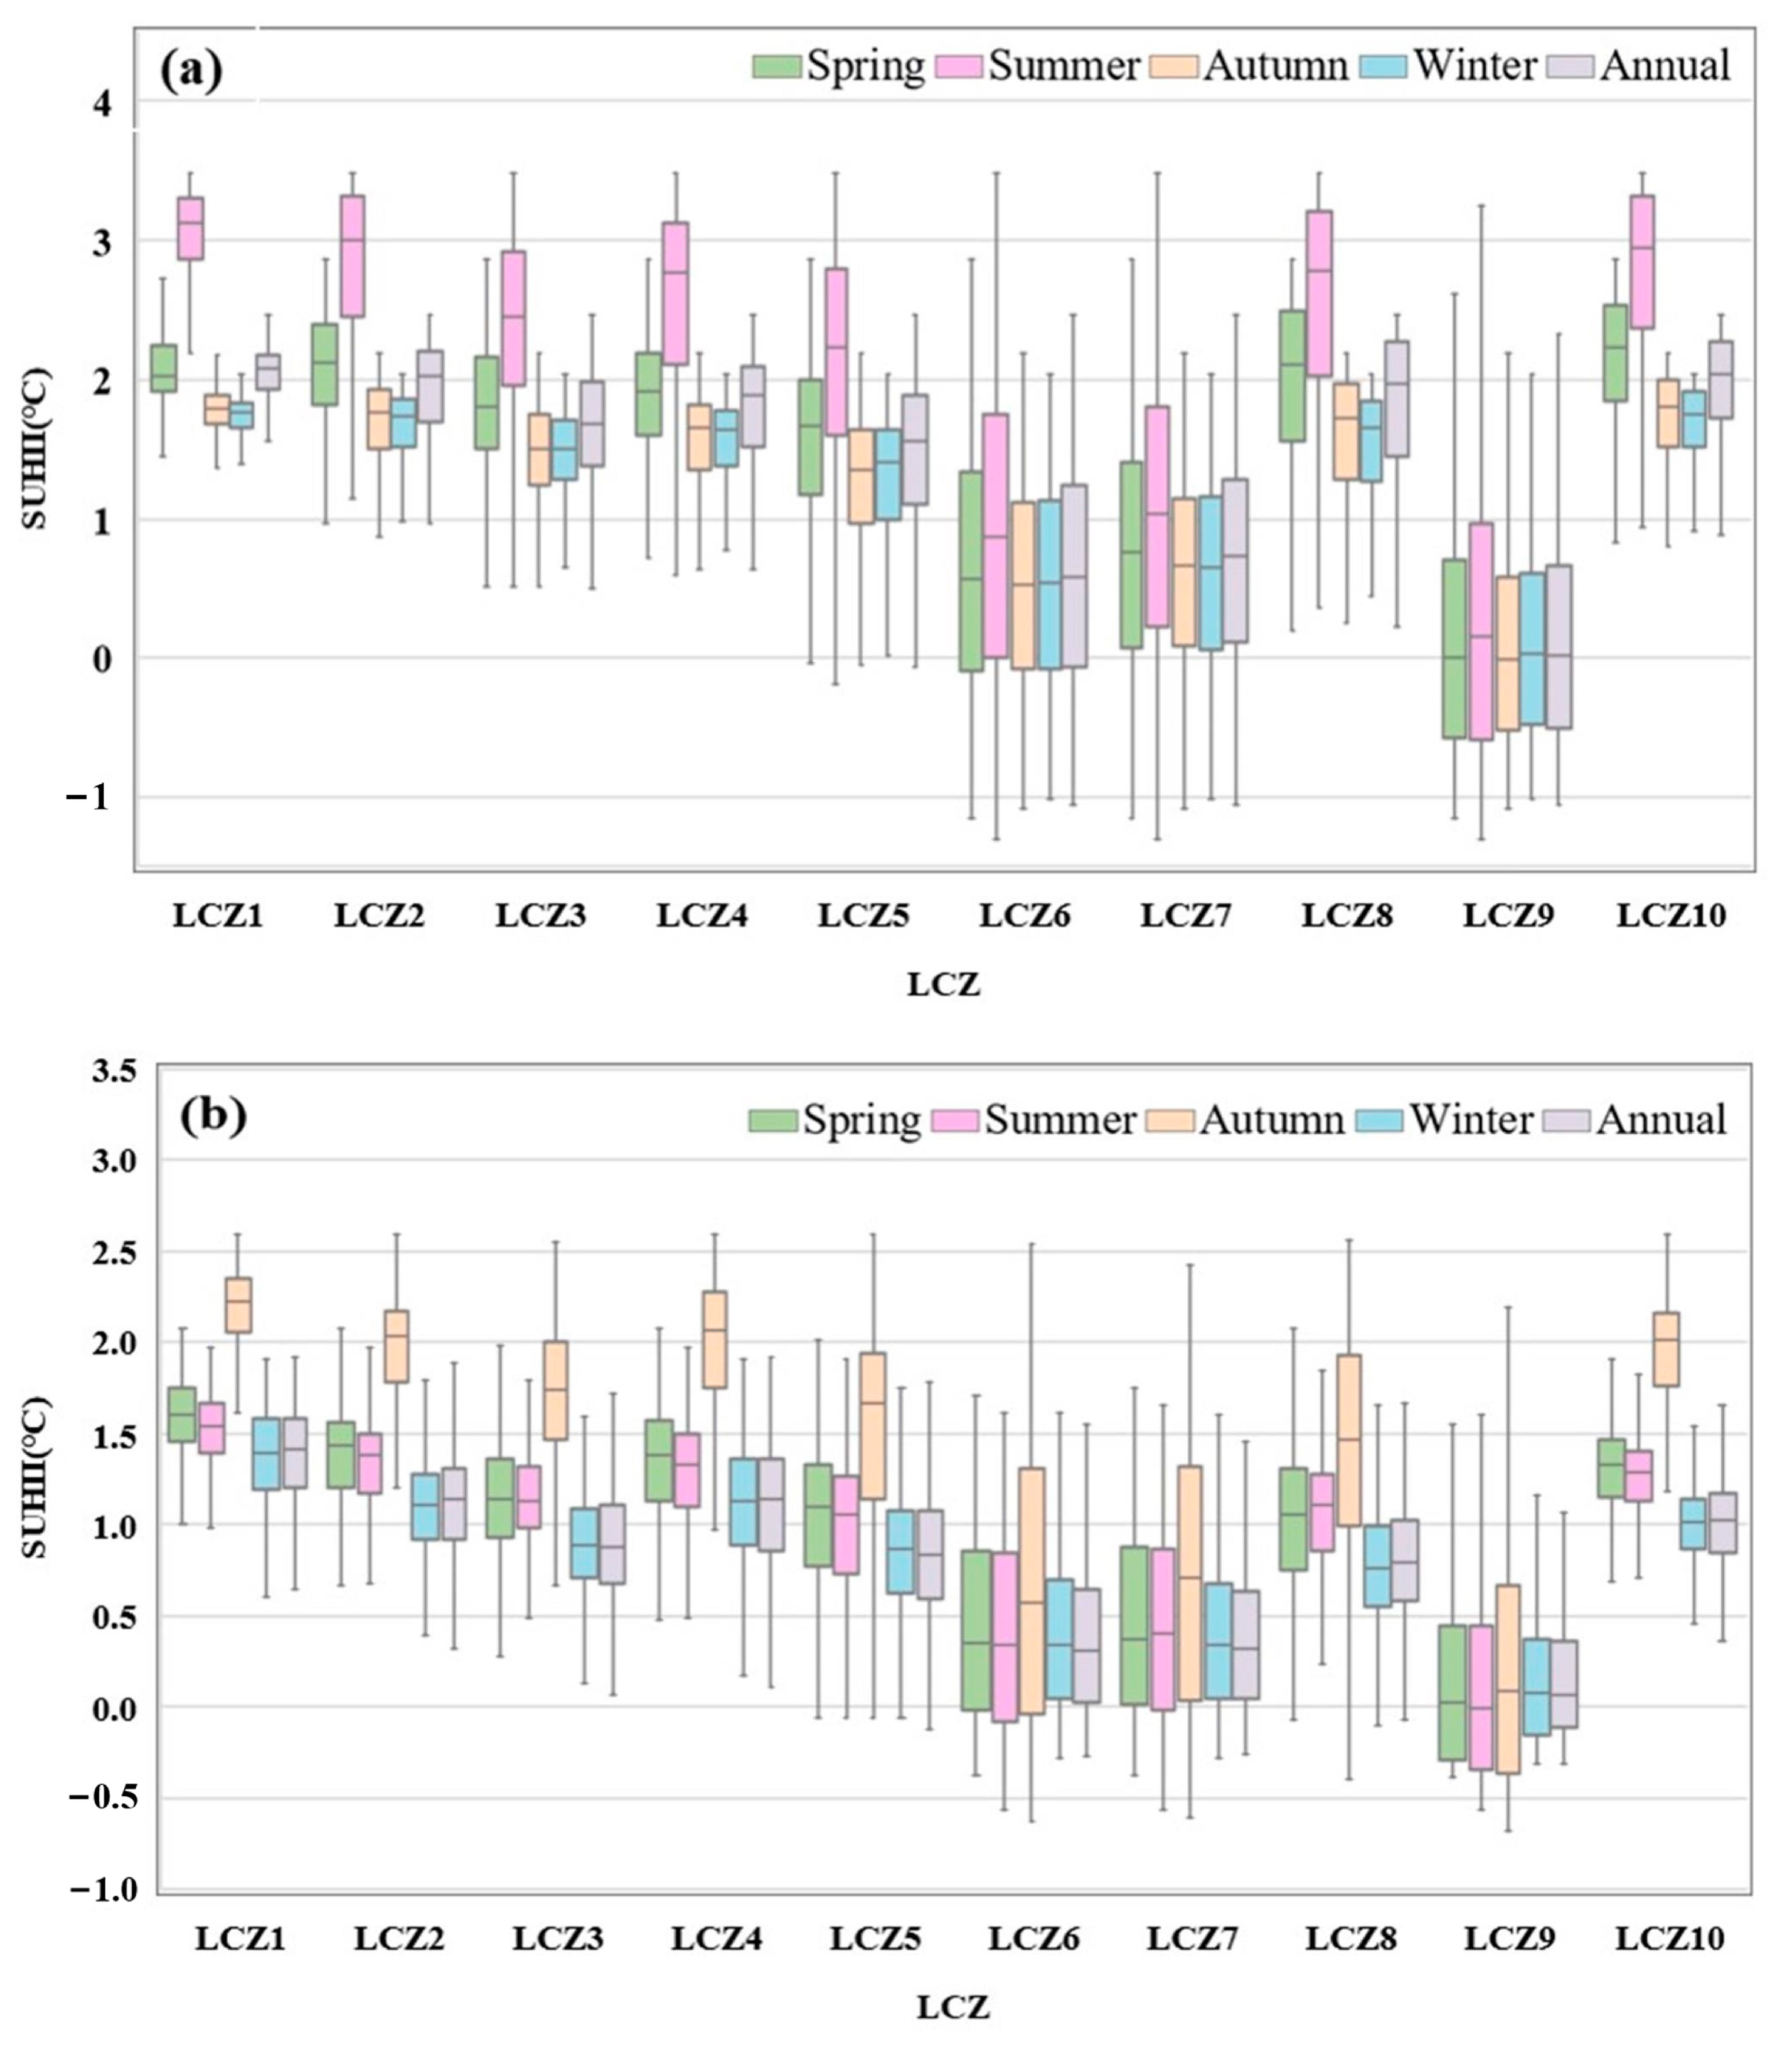
3.2. SUHII Differences within the LCZ on Multi-Time Scales

Figure 5 indicates that the downscaled LST data not only effectively retained the spatial distribution properties of the surface heat environment of the original LST, but also better captured the local details. The precision of the downscaled LST data was assessed by the RMSE and the R2 (Table 5). The RMSE values ranged from 0.38 to 0.92 K and the R2 values ranged from 0.83 to 0.93. This indicates that the performance of the RF model was satisfactory and the downscaled LST results were reliable. Therefore, we further characterized the urban surface heat environment by applying the quantified SUHII indicators in Section 2.3.3. Moreover, to better reflect the thermal features of the city, this study mainly explores the SUHII within the built-up types (LCZ 1 to 10).
The results exhibited that there were significant spatio-temporal differences in SUHII (Figure 6). Seasonal/annual SUHII was stronger during the daytime than nighttime. Both daytime/nighttime winter SUHII exhibited the weakest performance, and high SUHII mainly occurred in summer daytime and autumn nighttime. In addition, the daytime/nighttime SUHII was lower in the northeast and higher in the southwest. High SUHII was mainly concentrated in urban centers (e.g., old and new areas). Figure 7 further revealed the relationship between daytime/nighttime seasonal and annual SUHII with LCZs. The results demonstrated that during the daytime, heavy industry (LCZ 10) had the strongest SUHII, followed by high-rise buildings (i.e., LCZ 1 and LCZ 4), while the reverse was true during the nighttime. The diurnal SUHII of LCZ 6, LCZ 7, and LCZ 9 was significantly lower than that of the other built types, especially the lowest in LCZ 9. Compact buildings (LCZ 1 to 3) exhibited significantly stronger SUHII than open buildings (LCZ 4 to 6). In particular, when the building density was the same, the higher the building height, the stronger the SUHII. Moreover, there were significant seasonal and annual discrepancies in the daytime/nighttime SUHII of the different LCZs. Generally, daytime SUHII was noticeably greater in summer for each LCZ class, while nighttime autumn SUHII was the greatest. Specifically, during the daytime, the SUHII of LCZs showed large differences both seasonally and annually (Figure 7a). In spring, LCZ 2 (2.12 °C) and LCZ 10 (2.23 °C) had the highest SUHII, followed by LCZs 1 to 4 (1.80 °C–2.11 °C). In summer, the highest SUHII was observed in LCZ 1 (3.13 °C) and LCZ 2 (3.00 °C), followed by LCZ 8 (2.79 °C) and LCZ 10 (2.95 °C). The autumn/winter and annual trends were consistent with the highest SUHII in LCZ 1 and LCZ 10. During the nighttime, the seasonal and annual trends of SUHII within the LCZs were consistent (Figure 7b). Notably, the SUHII was the strongest for LCZ 1 and LCZ 4, followed by LCZ 2 and LCZ 10.

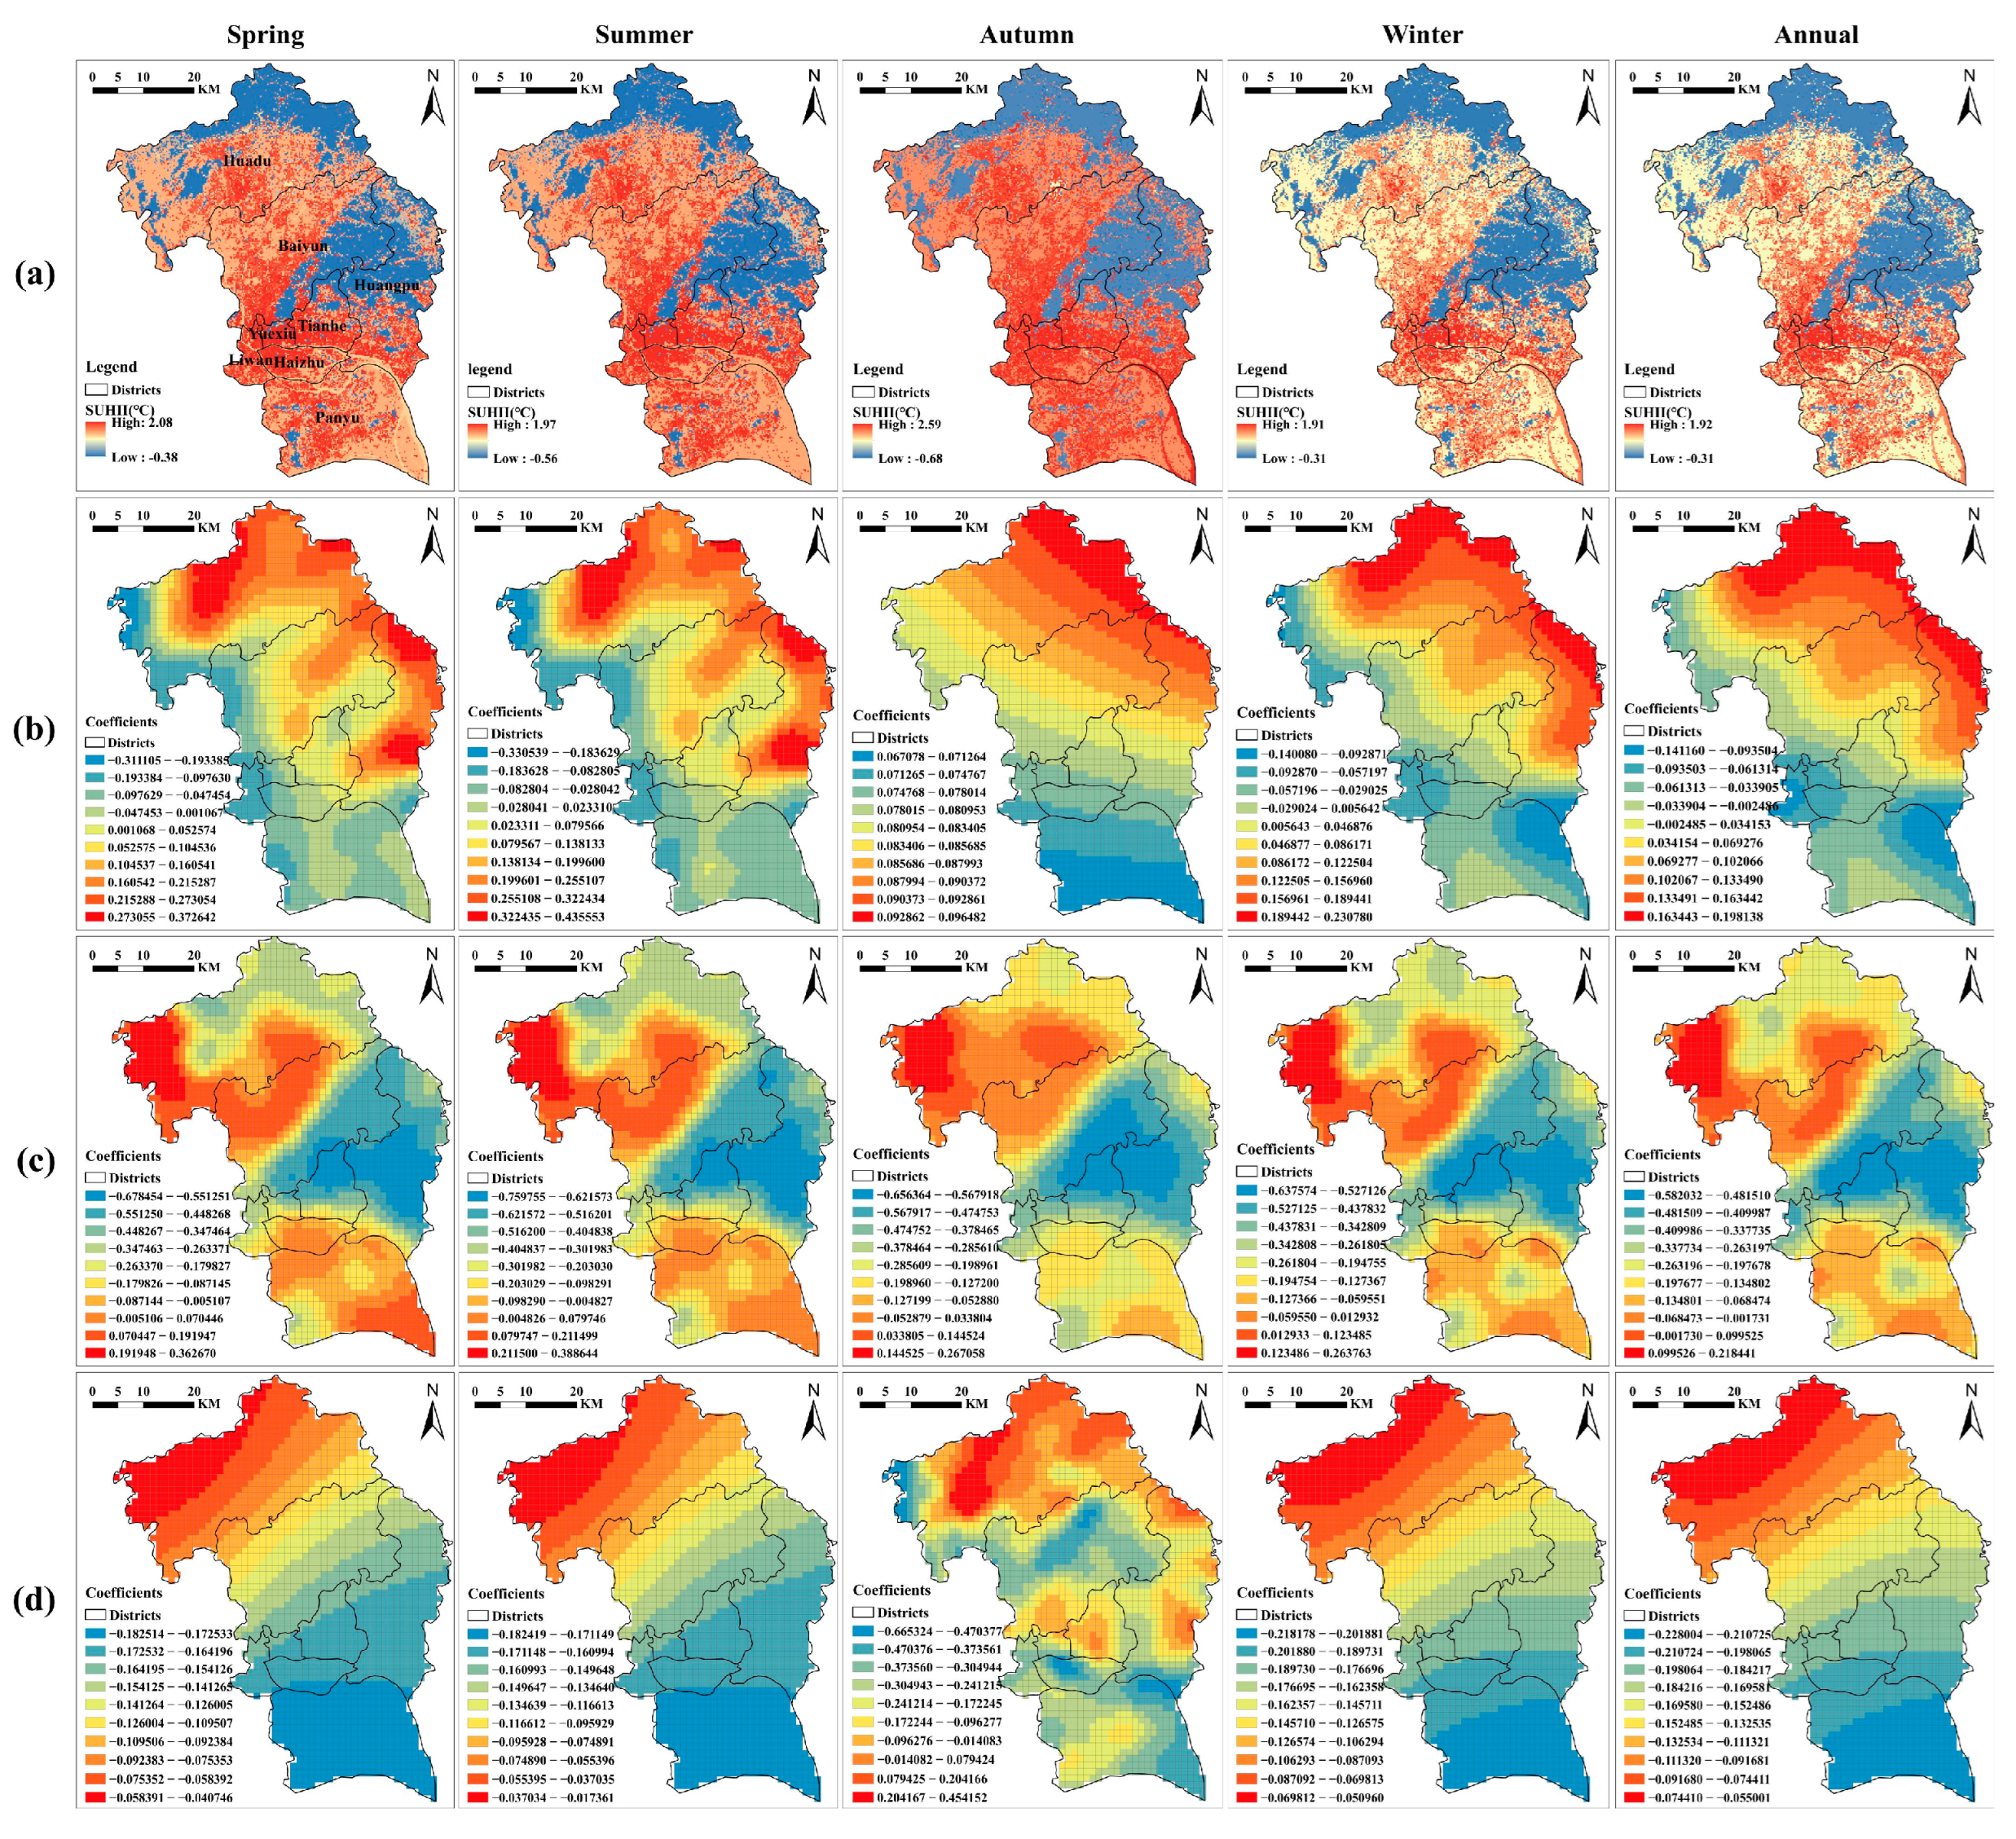
3.3. Multiscale Effects of Urban Spatial Pattern on SUHII

3.3.1. Relationship between Urban Spatial Configuration and SUHII at the Regional Scale

Before building the regression model, a spatial autocorrelation analysis of SUHII was employed utilizing Global Moran’s I in ArcGIS. As shown in Table 6, the Moran’s I values were all greater than 0, the z-score values were positive, and the p-values were less than 0.001, suggesting that SUHII had significant positive spatial autocorrelation. The results of the OLS, GWR, and MGWR models are presented in Table 7. Whether diurnal or seasonal, the Adj-R2 of GWR and MGWR were obviously higher than that of OLS, while AICc was obviously lower than that of OLS. The results demonstrated that the spatial non-stationarity of the association between urban form and SUHII could not be disregarded. Moreover, the MGWR has better performance than the GWR.
The regression coefficients calculated using MGWR revealed the relationship between daytime/nighttime SUHII and urban landscape configuration indicators (SHAPE_AM, LPI and PD) (Figure 8 and Figure 9). The results showed that the correlation of PD, LPI, and SHAPE_AM with SUHII exhibited significant spatial heterogeneity during the daytime and nighttime. Generally, the coefficients of LPI were marginally larger than those of SHAPE_AM and PD. Among them, the coefficients of SHAPE_AM and LPI were slightly larger during the daytime than the nighttime, whereas the coefficients of PD were significantly larger during the nighttime than the daytime. Notably, during the daytime, the coefficients of SHAPE_AM and LPI were slightly larger in winter than in other seasons. During the nighttime, the coefficients of SHAPE_AM and LPI were slightly larger in summer than in other seasons. In the center of urban regions with high SUHII concentration, LPI, SHAPE_AM and PD were negatively associated with SUHII. In low-SUHII areas, SHAPE_AM was significantly positively associated with SUHII, LPI was significantly negatively associated with SUHII, and PD was negatively associated with SUHII. It was interesting that LPI was remarkably positively associated with daytime SUHII towards the high SUHII zones in the northwest and south (Figure 8c), and the correlation coefficient was larger than that of SHAPE_AM. A similar phenomenon was observed at night (Figure 9c).

3.3.2. Relationship between LCZ Urban Spatial Composition and SUHII at the Local Scale

The PLAND metric has a strong degree of interpretation of LST [64]. It can effectively quantify the thermal contribution of different LCZ types to the impact of SUHII at each gradient. In this paper, the PLAND (1/2/4/5/10) of each LCZ (1/2/4/5/10) built types was utilized to study the influence of urban spatial morphology on SUHII at local scale. The MGWR results are depicted in Figure 10. The results revealed that the effect of PLAND (1/2/4/5/10) on daytime/nighttime SUHII for the same LCZ (1/2/4/5/10) had significant spatial heterogeneity in the urban–suburban gradient. Overall, the effect of PLAND (1/2/4/5/10) on SUHII showed a decreasing trend from urban to suburban areas. During the daytime, the highest mean coefficients of PLAND (1/2/4/5/10) with SUHII were observed in old urban areas followed by new urban areas, and were the lowest in industrial parks. Nevertheless, during the nighttime, the mean coefficient of PLAND (1/2/4/5/10) with SUHII was notably larger in the new urban areas. Specifically, PLAND_1, PLAND_2, and PLAND_4 have significant positive associations with daytime SUHII in the old urban areas (Figure 10a). At nighttime, PLAND_1 shown a significant positive association with SUHII, while PLAND_5 showed a negative association with SUHII (Figure 10f). In the new urban areas, PLAND_2 and PLAND_4 had a significant positive association with SUHII during the daytime and nighttime (Figure 10b,g). In suburban areas (i.e., urban-rural areas, rural areas, and industrial parks), PLAND_2 and PLAND_10 were the main heat stress factors influencing the exacerbation of daytime SUHII. At nighttime, PLAND_1, PLAND_2, PLAND_4, and PLAND_10 were the important thermal stress factors affecting the exacerbation of SUHII (Figure 10h,i,j). Notably, PLAND_5 had the least impact on daytime/nighttime SUHII in all sample districts, with negative correlations especially observed in old urban areas and rural areas.

4. Discussion

4.1. Differences in SUHII within LCZs at Different Time Scales

The results suggested that the SUHII exhibited obvious diurnal and seasonal discrepancies in the core area of Guangzhou. The SUHII in each LCZ was stronger during the daytime than the nighttime, mainly because the city was not affected by solar radiation at night, and its heat source was closely related to the ability of buildings to store and dissipate heat [65]. High SUHII occurred mainly during the daytime in summer and nighttime in autumn, with the weakest SUHII during the daytime/nighttime in winter. This finding was similar to those in studies of several Chinese cities [66]. They discovered that the diurnal seasonal variations in the diurnal SUHI were closely correlated with the climatic regions. Guangzhou had significant subtropical monsoon climate characteristics, which led to hot summers and lower temperatures in winter during the daytime in urban areas. During the daytime, the SUHII was significantly stronger in compact medium- and high-rise buildings (LCZ1 to 2), except for heavy industry (LCZ 10), for each seasonal and annual period. During the nighttime, the SUHII of high-rise buildings (LCZ 1 and LCZ 4) was higher than that of other built-up classes. Guangzhou has many skyscrapers that shade each other to form urban canyons [67]. The urban canyon effect makes the compact medium- and high-rise building areas absorb and conserve more heat during the daytime, while these areas release more heat during the night [68]. In contrast, the daytime and nighttime SUHII of low- and medium-rise sparse buildings (e.g., LCZ 6, LCZ 7, and LCZ 9) were weaker. The reason was that these built types were distributed at intervals with vegetation. Trees or ‘green roofs’ can shade the building surfaces, transfer solar radiation, and liberate moisture into the atmosphere, which can contribute towards alleviating the UHI effect [69,70,71,72].

4.2. Impact of Urban Spatial Pattern on SUHII at Different Spatial Scales

This paper employed the MGWR to explore the effect of selected urban spatial pattern metrics on SUHII from various spatial scales. The results revealed that the effect of urban landscape configuration on SUHII had obvious spatial non-stationarity. In the central urban area, the correlation coefficient of SHAPE_AM was larger than that of LPI and PD, and exhibited a significant negative association, suggesting that the higher regularly shaped and concentrated built-up areas dramatically exacerbate the SUHII. This finding was in agreement with the study in Wuhan, which investigated the influence of LCZ spatial pattern on UHI [43]. Furthermore, LPI and SUHII were negatively correlated in the central urban region, the reason for which may be related to the complexity and diversity of building types in the central urban area. This indirectly reflects the potential benefits of building type diversity in mitigating UHI effects. Conversely, when the LCZ built class in a certain area showed a single type and concentrated distribution (high LPI), this significantly increased the SUHII. For example, the impact of LPI on SUHII was significantly larger than that of SHAPE_AM in northwest Baiyun district, where heavy industry (LCZ 10) was concentrated. The reason is that a single and continuous building area may contain a large number of man-made heat sources, such as industrial production, transport, and air conditioning, which increase the heat load of the area. This indicated that the effect mechanism of the heat environment in the central city of Guangzhou was more complex. Among them, the interaction of building forms and distribution patterns on SUHII should not be neglected. The use of diverse building types and designs in urban planning should be encouraged in order to increase the landscape heterogeneity of the city, which can help mitigate the UHI effect. The effect of PD on SUHII was smaller, and was negatively correlated in the whole region. This suggests that urban landscape fragmentation was beneficial to alleviate SUHII, but this alleviation effect was relatively limited for a metropolis such as Guangzhou. We suggest increasing green space within the city and designing urban ventilation corridors to improve urban air circulation and help heat dissipation.
Moreover, this study analyzed the effect of PLAND (1/2/4/5/10) on SHUII at the local scale in terms of landscape composition. The results further clarify the dominant factors of the thermal environment in each sample area, which provides a targeted reference for alleviating the local UHI effect. To better analyze and compare urban and suburban areas in terms of thermal gradient differences, we divided old and new urban areas into urban areas, and defined urban–rural areas, rural areas and industrial parks uniformly as suburban areas. The results indicated that PLAND (1/2/4/5/10) has a stronger effect on SUHII in urban areas. Among them, PLAND_1, PLAND_2, and PLAND_4 are the primary factors influencing the aggravation of daytime/nighttime SUHII in urban areas. The reason is that the urban areas had higher building densities, narrower streets, and poor ventilation [73], which, in turn, made heat dissipation difficult. Moreover, high-rise dense building clusters received more solar radiation during the daytime and retained a large amount of heat [74,75]. In suburban areas, PLAND_2 and PLAND_10 became the main factors influencing the increase in SUHII during the daytime, likely because heavy industry or industrial parks are dominant in those areas. Wang and Wang [48] pointed out that utilizing green building materials such as photovoltaic panels on industrial building rooftops may be a profitable strategy to reduce the localized thermal environment in cities. Notably, high-rise buildings were important thermal stressors contributing to the exacerbation of the heat environment at night. The underlying reason was that materials such as asphalt and concrete had significant heat absorption and thermal stagnation properties, which hindered effective heat dissipation [76]. Hence, controlling the increase in compact high-rise and mid-rise building regions in future urban development may be effective to mitigate the exacerbation of SUHII. For example, Zheng et al. [77] indicated that, except for increasing the vegetation cover, the transition from compact mid-rise buildings to open high-rise buildings had a noticeable cooling effect. This study discovered that PLAND_5 had the smallest impact on SUHII of all types in the sampled areas. This open mid-rise building type with large green areas and good ventilation contributed positively to the alleviation of the local heat environment. This provided a new insight into mitigating metropolitan SUHII from the perspective of building type transition. However, in terms of realism and enforceability, the cooling efficiency of green roofs was more effective than surface vegetation in high-density metropolitan cities [78]. Thus, as for Guangzhou, the UHI effect can be mitigated through green roofs, improved ventilation design, and the use of better insulation materials.

4.3. Uncertainties and Limitations

Our study obtained the downscaled LST and LCZ data using multisource remote sensing data. We solved some methodological limitations, but some problems need to be noted. First, the building types in Guangzhou are complicated, especially when there is a mixture of high-rise, mid-rise, and low-rise buildings. Therefore, there is still some difficulty in accurately recognizing the low-rise LCZ building classes. To solve this problem, high-resolution images from Baidu Street View map were employed to obtain more detailed and accurate building height information [79]. Then, the training samples were repeatedly modified by the results of each iteration of LCZ classification to reduce the misclassification. The above strategy did improve the classification accuracy, which resulted in an overall LCZ accuracy of over 80%. However, the class imbalance problem of LCZ training data should not be neglected, especially in the LCZ classes of smaller areas, and the overall mapping accuracy was low [80]. In the future, we will further improve the recognition methods of building forms to increase the accuracy of multi-year LCZ mapping. For instance, the convolutional neural network (CNN) approach was effective in classifying specific LCZ categories with mixed buildings and trees or sparse distribution of buildings and trees [81]. In particular, the CNN combined with high-resolution remote sensing images was more effective in LCZ categorization [82,83].
The LST downscaling accuracy results demonstrated that the data quality meets the research needs. However, considering the spatial non-stationarity of urban landscapes, a higher spatial resolution of LST may provide more conclusions. This study identified that the accuracy of downscaled LST data was related to the high-resolution surface information parameters. The parameters extracted from MOD09GA are better than those extracted from MOD09GQ, because MOD09GA includes more important information about the quality and observation geometry. Future research should consider the potential impact of data information quality on parametric modeling to ensure that models are better able to adapt to the complexity of urban landscapes [84,85].

5. Conclusions

This paper analyzed the daytime/nighttime seasonal and annual variation characteristics of SUHII within different LCZs in the core area of Guangzhou utilizing the LCZ scheme and downscaled LST data. Moreover, the heterogeneous effects of urban spatial patterns on SUHII were explored at different spatial scales utilizing the MGWR model. The main conclusions are as follows: (1) Combining the LCZ scheme and downscaled LST data can effectively detect the multiple spatio-temporal scale characteristics of SUHII within cities. (2) The SUHII of each LCZ type exhibited diverse patterns in different time periods. Specifically, the SUHII was strongest in summer daytime and autumn nighttime, while it was weakest in winter. During the daytime, SUHII was generally higher in compact medium- and high-rise buildings (LCZs 1 to 2), except for heavy industry (LCZ 10). During the nighttime, SUHII was stronger for high-rise buildings (LCZ1 and LCZ4). High-rise buildings absorb a large amount of solar radiation during the daytime and store heat, which is released during the night. Meanwhile, the ‘urban canyon’ they form restricts air flow and hinders the natural diffusion of heat. (3) There were obvious scale differences and gradient effects on the extent of the LCZ build type’s influence on SUHII and the main influencing factors. At the regional scale, highly regular and compacted built-up areas tended to increase SUHII compared to irregular and low-density areas. The reason was that regular and dense building layouts may lead to less air circulation and more heat accumulation, whereas dense areas with a single and continuous distribution of buildings contribute more significantly to increased SUHII compared to diverse, dispersed, and regular-shaped building layouts. The reason was that concentrated areas of a single building type may not only lead to heat concentration, but also have less vegetation cover and natural surfaces. Considering these findings, future urban planning and design should emphasize the diversity and dispersion of building layouts and the incorporation of green spaces. At the local scale, the PLAND index effectively quantifies the contribution of each LCZ type to the influence of SUHII. The impact of PLAND (1/2/4/5/10) on SUHII exhibited a decreasing trend from urban to suburban areas. In the old urban areas, the PLAND of compact medium- and high-rise buildings (LCZs 1 to 2) had the greatest impact on SUHII, followed by the PLAND of open high-rise buildings (LCZ 4). In the new urban areas, the PLAND of compact mid-rise buildings (LCZ 2) and open high-rise buildings (LCZ 4) showed the greatest impact on SUHII. As for suburban areas, the PLAND of compact mid-rise buildings (LCZ 2) and heavy industries (LCZ 10) were the main impact factors on SUHII. This study improves the understanding of the complexity of the urban thermal environment and is expected to provide a scientific reference for future eco-city planning and sustainable development in Guangzhou.

Supplementary Materials

Supplementary code to this article can be found online at https://github.com/0707-my/code.2023.6.25.git (accessed on 31 July 2024).

Author Contributions

Conceptualization, Y.R., S.Z., and K.Y.; Methodology, Y.R., S.Z., and K.Y.; Software, Y.R. and S.Z.; Validation, Y.M., W.W., and L.N.; Formal Analysis, Y.R.; Resources, S.Z., K.Y., W.W., and L.N.; Data Curation, Y.R. and Y.M.; Writing—Original Draft Preparation, Y.R.; Writing—Review and Editing, S.Z. and K.Y.; Visualization, Y.R., S.Z., and K.Y.; Supervision, S.Z. and K.Y.; Project Administration, S.Z.; Funding Acquisition, S.Z. All authors have read and agreed to the published version of the manuscript.

Funding

This research was funded by the National Natural Science Foundation of China (grant number 42361064, grant number 42261037, grant number 42201470) and the Yunnan Basic Research Project (grant number 202101AU070037).

Institutional Review Board Statement

Not applicable.

Informed Consent Statement

Not applicable.

Data Availability Statement

Data are contained within the article and supplementary materials.

Acknowledgments

We sincerely thank the anonymous reviewers and editor for their constructive comments and suggestions.

Conflicts of Interest

The authors declare no conflicts of interest.

Appendix A

Figure A1. Mean absolute values of correlation between PLAND (1–10) and summer daytime/nighttime SUHII: (a) correlation of PLAND1_10 with summer daytime SUHII; (b) correlation of PLAND (1–10) with summer daytime SUHII.
Sustainability 16 06656 g0a1

References

  1. Yang, J.; Wang, Z.-H.; Kaloush, K.E. Environmental impacts of reflective materials: Is high albedo a ‘silver bullet’ for mitigating urban heat island? Renew. Sustain. Energ Rev. 2015, 47, 830–843. [Google Scholar] [CrossRef]
  2. Roshan, G.; Sarli, R.; Fitchett, J.M. Urban heat island and thermal comfort of Esfahan City (Iran) during COVID-19 lockdown. J. Clean. Prod. 2022, 352, 131498. [Google Scholar] [CrossRef]
  3. Oke, T.R. The energetic basis of the urban heat island. Q. J. R. Meteorol. Soc. 1982, 108, 1–24. [Google Scholar] [CrossRef]
  4. Ebi, K.L.; Capon, A.; Berry, P.; Broderick, C.; de Dear, R.; Havenith, G.; Honda, Y.; Kovats, R.S.; Ma, W.; Malik, A.; et al. Hot weather and heat extremes: Health risks. Lancet 2021, 398, 698–708. [Google Scholar] [CrossRef] [PubMed]
  5. Petitti, D.B.; Hondula, D.M.; Yang, S.; Harlan, S.L.; Chowell, G. Multiple Trigger Points for Quantifying Heat-Health Impacts: New Evidence from a Hot Climate. Environ. Health Perspect. 2016, 124, 176–183. [Google Scholar] [CrossRef]
  6. Yuan, L.; Madaniyazi, L.; Vicedo-Cabrera, A.M.; Honda, Y.; Ng, C.F.S.; Ueda, K.; Oka, K.; Tobias, A.; Hashizume, M. A Nationwide Comparative Analysis of Temperature-Related Mortality and Morbidity in Japan. Environ. Health Perspect. 2023, 131, 127008. [Google Scholar] [CrossRef] [PubMed]
  7. Feng, Z.; Wang, X.; Yuan, J.; Zhang, Y.; Yu, M. Changes in air pollution, land surface temperature, and urban heat islands during the COVID-19 lockdown in three Chinese urban agglomerations. Sci. Total Environ. 2023, 892, 164496. [Google Scholar] [CrossRef] [PubMed]
  8. Kurniati, A.C.; Nitivattananon, V. Factors influencing urban heat island in Surabaya, Indonesia. Sustain. Cities Soc. 2016, 27, 99–105. [Google Scholar] [CrossRef]
  9. Li, X.; Zhou, W. Optimizing urban greenspace spatial pattern to mitigate urban heat island effects: Extending understanding from local to the city scale. Urban. For. Urban. Green. 2019, 41, 255–263. [Google Scholar] [CrossRef]
  10. Wu, X.; Wang, G.; Yao, R.; Wang, L.; Yu, D.; Gui, X. Investigating Surface Urban Heat Islands in South America Based on MODIS Data from 2003-2016. Remote Sens. 2019, 11, 1212. [Google Scholar] [CrossRef]
  11. Wang, J.; Chen, Y.; Liao, W.; He, G.; Tett, S.F.B.; Yan, Z.; Zhai, P.; Feng, J.; Ma, W.; Huang, C.; et al. Anthropogenic emissions and urbanization increase risk of compound hot extremes in cities. Nat. Clim. Chang. 2021, 11, 1084. [Google Scholar] [CrossRef]
  12. Zhou, X.; Chen, H. Impact of urbanization-related land use land cover changes and urban morphology changes on the urban heat island phenomenon. Sci. Total Environ. 2018, 635, 1467–1476. [Google Scholar] [CrossRef] [PubMed]
  13. Saha, M.; Al Kafy, A.; Bakshi, A.; Al-Faisal, A.; Almulhim, A.I.; Rahaman, Z.A.; Al Rakib, A.; Fattah, M.A.; Akter, K.S.; Rahman, M.T.; et al. Modelling microscale impacts assessment of urban expansion on seasonal surface urban heat island intensity using neural network algorithms. Energy Build. 2022, 275, 0378–7788. [Google Scholar] [CrossRef]
  14. Zhao, M.; Cai, H.; Qiao, Z.; Xu, X. Influence of urban expansion on the urban heat island effect in Shanghai. Int. J. Geogr. Inf. Sci. 2016, 30, 2421–2441. [Google Scholar] [CrossRef]
  15. Liu, B.; Guo, X.; Jiang, J. How Urban Morphology Relates to the Urban Heat Island Effect: A Multi-Indicator Study. Sustainability 2023, 15, 10787. [Google Scholar] [CrossRef]
  16. Estoque, R.C.; Murayama, Y.; Myint, S.W. Effects of landscape composition and pattern on land surface temperature: An urban heat island study in the megacities of Southeast Asia. Sci. Total Environ. 2017, 577, 349–359. [Google Scholar] [CrossRef]
  17. Yin, C.; Yuan, M.; Lu, Y.; Huang, Y.; Liu, Y. Effects of urban form on the urban heat island effect based on spatial regression model. Sci. Total Environ. 2018, 634, 696–704. [Google Scholar] [CrossRef] [PubMed]
  18. Yang, Q.; Huang, X.; Li, J. Assessing the relationship between surface urban heat islands and landscape patterns across climatic zones in China. Sci. Rep. 2017, 7, 9337. [Google Scholar] [CrossRef] [PubMed]
  19. Liu, H.; Huang, B.; Zhan, Q.; Gao, S.; Li, R.; Fan, Z. The influence of urban form on surface urban heat island and its planning implications: Evidence from 1288 urban clusters in China. Sustain. Cities Soc. 2021, 71, 102987. [Google Scholar] [CrossRef]
  20. Li, Y.; Schubert, S.; Kropp, J.P.; Rybski, D. On the influence of density and morphology on the Urban Heat Island intensity. Nat. Commun. 2020, 11, 2647. [Google Scholar] [CrossRef]
  21. Li, K.; Chen, Y.; Wang, M.; Gong, A. Spatial-temporal variations of surface urban heat island intensity induced by different definitions of rural extents in China. Sci. Total Environ. 2019, 669, 229–247. [Google Scholar] [CrossRef] [PubMed]
  22. Peng, S.; Piao, S.; Ciais, P.; Friedlingstein, P.; Ottle, C.; Breon, F.-M.; Nan, H.; Zhou, L.; Myneni, R.B. Surface Urban Heat Island Across 419 Global Big Cities. Environ. Sci. Technol. 2012, 46, 696–703. [Google Scholar] [CrossRef] [PubMed]
  23. Siddiqui, A.; Kushwaha, G.; Nikam, B.; Srivastav, S.K.; Shelar, A.; Kumar, P. Analysing the day/night seasonal and annual changes and trends in land surface temperature and surface urban heat island intensity (SUHII) for Indian cities. Sustain. Cities Soc. 2021, 75, 103374. [Google Scholar] [CrossRef]
  24. Li, L.; Zha, Y.; Zhang, J. Spatially non-stationary effect of underlying driving factors on surface urban heat islands in global major cities. Int. J. Appl. Earth Obs. Geoinf. 2020, 90, 102131. [Google Scholar] [CrossRef]
  25. Chen, Y.; Yang, J.; Yu, W.; Ren, J.; Xiao, X.; Xia, J.C. Relationship between urban spatial form and seasonal land surface temperature under different grid scales. Sustain. Cities Soc. 2023, 89. [Google Scholar] [CrossRef]
  26. Yuan, B.; Zhou, L.; Hu, F.; Wei, C. Effects of 2D/3D urban morphology on land surface temperature: Contribution, response, and interaction. Urban Clim. 2024, 53. [Google Scholar] [CrossRef]
  27. Yin, S.; Liu, J.; Han, Z. Relationship between urban morphology and land surface temperature-A case study of Nanjing City. PLoS ONE 2022, 17. [Google Scholar] [CrossRef] [PubMed]
  28. Li, X.; Zhou, Y.; Yu, S.; Jia, G.; Li, H.; Li, W. Urban heat island impacts on building energy consumption: A review of approaches and findings. Energy 2019, 174, 407–419. [Google Scholar] [CrossRef]
  29. Alahmad, B.; Tomasso, L.P.; Al-Hemoud, A.; James, P.; Koutrakis, P. Spatial Distribution of Land Surface Temperatures in Kuwait: Urban Heat and Cool Islands. Int. J. Environ. Res. Public. Health 2020, 17, 2993. [Google Scholar] [CrossRef]
  30. Yang, H.; Wu, Z.; Dawson, R.J.; Barr, S.; Ford, A.; Li, Y. Quantifying surface urban heat island variations and patterns: Comparison of two cities in three-stage dynamic rural-urban transition. Sustain. Cities Soc. 2024, 109. [Google Scholar] [CrossRef]
  31. Manoli, G.; Fatichi, S.; Schlapfer, M.; Yu, K.; Crowther, T.W.; Meili, N.; Burlando, P.; Katul, G.G.; Bou-Zeid, E. Magnitude of urban heat islands largely explained by climate and population. Nature 2019, 573, 55–+. [Google Scholar] [CrossRef] [PubMed]
  32. Huang, R.; Yang, M.; Lin, G.; Ma, X.; Wang, X.; Huang, Q.; Zhang, T. Cooling Effect of Green Space and Water on Urban Heat Island and the Perception of Residents: A Case Study of Xi’an City. Int. J. Env. Res. Public. Health 2022, 19, 4880. [Google Scholar] [CrossRef] [PubMed]
  33. Liu, Y.; Xuan, C.; Xu, Y.; Fu, N.; Xiong, F.; Gan, L. Local climate effects of urban wind corridors in Beijing. Urban Clim. 2022, 43. [Google Scholar] [CrossRef]
  34. Zhao, H.; Ren, Z.; Tan, J. The Spatial Patterns of Land Surface Temperature and Its Impact Factors: Spatial Non-Stationarity and Scale Effects Based on a Geographically-Weighted Regression Model. Sustainability 2018, 10, 2242. [Google Scholar] [CrossRef]
  35. Fotheringham, A.S.; Yang, W.; Kang, W. Multiscale Geographically Weighted Regression (MGWR). Ann. Am. Assoc. Geogr. 2017, 107, 1247–1265. [Google Scholar] [CrossRef]
  36. Stewart, I.D.; Oke, T.R. LOCAL climate zones for urban temperature studies. Bull. Amer. Meteorol. Soc. 2012, 93, 1879–1900. [Google Scholar] [CrossRef]
  37. Bechtel, B.; Demuzere, M.; Mills, G.; Zhan, W.; Sismanidis, P.; Small, C.; Voogt, J. SUHI analysis using Local Climate Zones-A comparison of 50 cities. Urban Clim. 2019, 28, 100451. [Google Scholar] [CrossRef]
  38. Yuan, B.; Li, X.; Zhou, L.; Bai, T.; Hu, T.; Huang, J.; Liu, D.; Li, Y.; Guo, J. Global distinct variations of surface urban heat islands in inter- and intra-cities revealed by local climate zones and seamless daily land surface temperature data. ISPRS-J. Photogramm. Remote Sens. 2023, 204, 1–14. [Google Scholar] [CrossRef]
  39. Geletic, J.; Lehnert, M.; Savic, S.; Milosevic, D. Inter-/intra-zonal seasonal variability of the surface urban heat island based on local climate zones in three central European cities. Build. Environ. 2019, 156, 21–32. [Google Scholar] [CrossRef]
  40. Shi, Z.; Yang, J.; Wang, L.-E.; Lv, F.; Wang, G.; Xiao, X.; Xia, J. Exploring seasonal diurnal surface temperature variation in cities based on ECOSTRESS data: A local climate zone perspective. Front. Public. Health 2022, 10, 1001344. [Google Scholar] [CrossRef]
  41. Wang, R.; Voogt, J.; Ren, C.; Ng, E. Spatial-temporal variations of surface urban heat island: An application of local climate zone into large Chinese cities. Build. Environ. 2022, 222, 109378. [Google Scholar] [CrossRef]
  42. Jian, L.; Xia, X.; Wang, Y.; Liu, X.; Zhang, Y.; Yang, Q. Spatiotemporal dynamic relationships and simulation of urban spatial form changes and land surface temperature: A case study in Chengdu, China. Front. Public. Health 2024, 12. [Google Scholar] [CrossRef] [PubMed]
  43. Zhang, L.; Nikolopoulou, M.; Guo, S.; Song, D. Impact of LCZs spatial pattern on urban heat island: A case study in Wuhan, China. Build. Environ. 2022, 226, 109785. [Google Scholar] [CrossRef]
  44. Yoo, C.; Im, J.; Cho, D.; Lee, Y.; Bae, D.; Sismanidis, P. Downscaling MODIS nighttime land surface temperatures in urban areas using ASTER thermal data through local linear forest. Int. J. Appl. Earth Obs. Geoinf. 2022, 110. [Google Scholar] [CrossRef]
  45. Zaksek, K.; Ostir, K. Downscaling land surface temperature for urban heat island diurnal cycle analysis. Remote Sens. Environ. 2012, 117, 114–124. [Google Scholar] [CrossRef]
  46. Liu, X.; Zhou, Y.; Yue, W.; Li, X.; Liu, Y.; Lu, D. Spatiotemporal patterns of summer urban heat island in Beijing, China using an improved land surface temperature. J. Clean. Prod. 2020, 257. [Google Scholar] [CrossRef]
  47. Peng, W.; Yuan, X.; Gao, W.; Wang, R.; Chen, W. Assessment of urban cooling effect based on downscaled land surface temperature: A case study for Fukuoka, Japan. Urban Clim. 2021, 36, 100790. [Google Scholar] [CrossRef]
  48. Wang, R.; Wang, M. Multi-scale analysis of surface thermal environment in relation to urban form: A case study of the Guangdong-Hong Kong-Macao Greater Bay Area. Sustain. Cities Soc. 2023, 99, 104953. [Google Scholar] [CrossRef]
  49. Du, Y.; Zhang, Y.; Ling, F.; Wang, Q.; Li, W.; Li, X. Water Bodies’ Mapping from Sentinel-2 Imagery with Modified Normalized Difference Water Index at 10-m Spatial Resolution Produced by Sharpening the SWIR Band. Remote Sens. 2016, 8, 354. [Google Scholar] [CrossRef]
  50. Elnashar, A.; Zeng, H.; Wu, B.; Zhang, N.; Tian, F.; Zhang, M.; Zhu, W.; Yan, N.; Chen, Z.; Sun, Z.; et al. Downscaling TRMM Monthly Precipitation Using Google Earth Engine and Google Cloud Computing. Remote Sens. 2020, 12, 3860. [Google Scholar] [CrossRef]
  51. Ebrahimy, H.; Aghighi, H.; Azadbakht, M.; Amani, M.; Mahdavi, S.; Matkan, A.A. Downscaling MODIS Land Surface Temperature Product Using an Adaptive Random Forest Regression Method and Google Earth Engine for a 19-Years Spatiotemporal Trend Analysis Over Iran. IEEE J. Sel. Top. Appl. Earth Observ. Remote Sens. 2021, 14, 2103–2112. [Google Scholar] [CrossRef]
  52. Yang, H.; Yu, J.; Xu, W.; Wu, Y.; Lei, X.; Ye, J.; Geng, J.; Ding, Z. Long-time series ecological environment quality monitoring and cause analysis in the Dianchi Lake Basin, China. Ecol. Indicators 2023, 148, 110084. [Google Scholar] [CrossRef]
  53. Bechtel, B.; Alexander, P.J.; Beck, C.; Boehner, J.; Brousse, O.; Ching, J.; Demuzere, M.; Fonte, C.; Gal, T.; Hidalgo, J.; et al. Generating WUDAPT Level 0 data—Current status of production and evaluation. Urban. CLim. 2019, 27, 24–45. [Google Scholar] [CrossRef]
  54. Bechtel, B.; Alexander, P.J.; Boehner, J.; Ching, J.; Conrad, O.; Feddema, J.; Mills, G.; See, L.; Stewart, I. Mapping Local Climate Zones for a Worldwide Database of the Form and Function of Cities. ISPRS Int. J. Geo-Inf. 2015, 4, 199–219. [Google Scholar] [CrossRef]
  55. Demuzere, M.; Kittner, J.; Bechtel, B. LCZ Generator: A Web Application to Create Local Climate Zone Maps. Front. Environ. Sci. 2021, 9, 637455. [Google Scholar] [CrossRef]
  56. Hsu, A.; Sheriff, G.; Chakraborty, T.; Manya, D. Disproportionate exposure to urban heat island intensity across major US cities. Nat. Commun. 2021, 12, 2721. [Google Scholar] [CrossRef] [PubMed]
  57. Wu, Y.; Hou, H.; Wang, R.; Murayama, Y.; Wang, L.; Hu, T. Effects of landscape patterns on the morphological evolution of surface urban heat island in Hangzhou during 2000–2020. Sustain. Cities Soc. 2022, 79, 103717. [Google Scholar] [CrossRef]
  58. Xia, H.; Chen, Y.; Song, C.; Li, J.; Quan, J.; Zhou, G. Analysis of surface urban heat islands based on local climate zones via spatiotemporally enhanced land surface temperature. Remote Sens. Environ. 2022, 273, 112972. [Google Scholar] [CrossRef]
  59. Masoudi, M.; Tan, P.Y. Multi-year comparison of the effects of spatial pattern of urban green spaces on urban land surface temperature. Landsc. Urban. Plan. 2019, 184, 44–58. [Google Scholar] [CrossRef]
  60. Simanjuntak, R.M.; Kuffer, M.; Reckien, D. Object-based image analysis to map local climate zones: The case of Bandung, Indonesia. Appl. Geogr. 2019, 106, 108–121. [Google Scholar] [CrossRef]
  61. Wang, Z.; Sun, D.; Hu, C.; Wang, Y.; Zhang, J. Seasonal Contrast and Interactive Effects of Potential Drivers on Land Surface Temperature in the Sichuan Basin, China. Remote Sens. 2022, 14, 1292. [Google Scholar] [CrossRef]
  62. Du, C.; Song, P.; Wang, K.; Li, A.; Hu, Y.; Zhang, K.; Jia, X.; Feng, Y.; Wu, M.; Qu, K.; et al. Investigating the Trends and Drivers between Urbanization and the Land Surface Temperature: A Case Study of Zhengzhou, China. Sustainability 2022, 14, 13845. [Google Scholar] [CrossRef]
  63. Chen, W.; Hu, C.; Liu, L.; Zhang, J.; Wang, K.; Liu, S. Characteristics of built-up land change in resource-based cities and their impact on land surface temperature-Taking Wu’an as an example. Ecol. Inform. 2022, 68. [Google Scholar] [CrossRef]
  64. Chen, A.; Yao, L.; Sun, R.; Chen, L. How many metrics are required to identify the effects of the landscape pattern on land surface temperature? Ecol. Indic. 2014, 45, 424–433. [Google Scholar] [CrossRef]
  65. Anand, J.; Sailor, D.J. How can we combine urban cooling strategies to effectively cool cities over the entire diurnal cycle? Build. Environ. 2023, 242, 0360–1323. [Google Scholar] [CrossRef]
  66. Zhou, D.; Zhao, S.; Liu, S.; Zhang, L.; Zhu, C. Surface urban heat island in China’s 32 major cities: Spatial patterns and drivers. Remote Sens. Environ. 2014, 152, 51–61. [Google Scholar] [CrossRef]
  67. Qin, Y. Urban canyon albedo and its implication on the use of reflective cool pavements. Energy Build. 2015, 96, 86–94. [Google Scholar] [CrossRef]
  68. Yang, X.; Li, Y. The impact of building density and building height heterogeneity on average urban albedo and street surface temperature. Build. Environ. 2015, 90, 146–156. [Google Scholar] [CrossRef]
  69. Chen, J.; Jin, S.; Du, P. Roles of horizontal and vertical tree canopy structure in mitigating daytime and nighttime urban heat island effects. Int. J. Appl. Earth Obs. Geoinf. 2020, 89, 102060. [Google Scholar] [CrossRef]
  70. Fang, Y.; Du, X.; Zhao, H.; Hu, M.; Xu, X. Assessment of green roofs’ potential to improve the urban thermal environment: The case of Beijing. Environ. Res. 2023, 237, 116857. [Google Scholar] [CrossRef]
  71. Liu, A.; Ma, X.; Du, M.; Su, M.; Hong, B. The cooling intensity of green infrastructure in local climate zones: A comparative study in China’s cold region. Urban. Clim. 2023, 51. [Google Scholar] [CrossRef]
  72. Razzaghmanesh, M.; Beecham, S.; Salemi, T. The role of green roofs in mitigating Urban Heat Island effects in the metropolitan area of Adelaide, South Australia. Urban For. Urban Green. 2016, 15, 89–102. [Google Scholar] [CrossRef]
  73. Yang, J.; Jin, S.; Xiao, X.; Jin, C.; Xia, J.; Li, X.; Wang, S. Local climate zone ventilation and urban land surface temperatures: Towards a performance-based and wind-sensitive planning proposal in megacities. Sustain. Cities Soc. 2019, 47, 2210–6707. [Google Scholar] [CrossRef]
  74. Alobaydi, D.; Bakarman, M.A.; Obeidat, B.J.P.E. The Impact of Urban Form Configuration on the Urban Heat Island: The Case Study of Baghdad, Iraq. Procedia Eng. 2016, 145, 820–827. [Google Scholar] [CrossRef]
  75. Takebayashi, H.; Ishii, E.; Moriyama, M.; Sakaki, A.; Nakajima, S.; Ueda, H. Study to examine the potential for solar energy utilization based on the relationship between urban morphology and solar radiation gain on building rooftops and wall surfaces. Solar Energy 2015, 119, 362–369. [Google Scholar] [CrossRef]
  76. Shamsaei, M.; Carter, A.; Vaillancourt, M. A review on the heat transfer in asphalt pavements and urban heat island mitigation methods. Constr. Build. Mater. 2022, 359, 129350. [Google Scholar] [CrossRef]
  77. Zheng, S.; Chen, X.; Liu, Y. Impact of urban renewal on urban heat island: Study of renewal processes and thermal effects. Sustain. Cities Soc. 2023, 99, 2210–6707. [Google Scholar] [CrossRef]
  78. Arghavani, S.; Malakooti, H.; Bidokhti, A.-A.A.A. Numerical assessment of the urban green space scenarios on urban heat island and thermal comfort level in Tehran Metropolis. J. Clean. Prod. 2020, 261, 0959–6526. [Google Scholar] [CrossRef]
  79. Yan, Y.; Huang, B. Estimation of building height using a single street view image via deep neural networks. ISPRS-J. Photogramm. Remote Sens. 2022, 192, 83–98. [Google Scholar] [CrossRef]
  80. Xu, Y.; Ma, F.; Meng, D.; Ren, C.; Leung, Y. A co-training approach to the classification of local climate zones with multi-source data. In Proceedings of the 2017 IEEE International Geoscience and Remote Sensing Symposium (IGARSS), Fort Worth, TX, USA, 23–28 July 2017; pp. 1209–1212. [Google Scholar] [CrossRef]
  81. Yoo, C.; Han, D.; Im, J.; Bechtel, B. Comparison between convolutional neural networks and random forest for local climate zone classification in mega urban areas using Landsat images. ISPRS-J. Photogramm. Remote Sens. 2019, 157, 155–170. [Google Scholar] [CrossRef]
  82. Cui, S.; Wang, X.; Yang, X.; Hu, L.; Jiang, Z.; Feng, Z. Mapping Local Climate Zones in the Urban Environment: The Optimal Combination of Data Source and Classifier. Sensors 2022, 22, 6407. [Google Scholar] [CrossRef] [PubMed]
  83. Liu, S.; Qi, Z.; Li, X.; Yeh, A.G.-O. Integration of Convolutional Neural Networks and Object-Based Post-Classification Refinement for Land Use and Land Cover Mapping with Optical and SAR Data. Remote Sens. 2019, 11, 690. [Google Scholar] [CrossRef]
  84. Yao, Y.; Chang, C.; Ndayisaba, F.; Wang, S. A New Approach for Surface Urban Heat Island Monitoring Based on Machine Learning Algorithm and Spatiotemporal Fusion Model. IEEE Access 2020, 8, 164268–164281. [Google Scholar] [CrossRef]
  85. Firozjaei, M.K.; Kiavarz, M.; Alavipanah, S.K. Quantification of landscape metrics effects on downscaled urban land surface temperature accuracy of satellite imagery. Adv. Space Res. 2022, 70, 35–47. [Google Scholar] [CrossRef]
Figure 1. (a) People’s Republic of China; (b) Guangzhou; (c) study area (Liwan, Yuexiu, Haizhu, Tianhe, Baiyun, Huangpu, Panyu, and Huadu districts) used for regional scale analysis; (d) five sample areas (S1–5) selected for local-scale analysis.
Sustainability 16 06656 g001
Figure 2. The main framework. (A) LCZ mapping; (B) LST data downscaling; (C) methods and the multiple spatio-temporal scale analysis of SUHII within LCZs.
Sustainability 16 06656 g002
Figure 3. LCZ classification scheme. (a) LCZ types; (b) partial sampling points.
Sustainability 16 06656 g003
Figure 4. The spatial distribution of the LCZ classes in Guangzhou main urban area.
Sustainability 16 06656 g004
Figure 5. Comparison of downscaling results from the summer daytime LST data in 2021. (a) Raw MODIS LST (1000 m) data; (b) downscaled 240 m LST data.
Sustainability 16 06656 g005
Figure 6. Spatial distribution of daytime/nighttime SUHII. (a) SUHII of the seasonal and annual trends in the daytime; (b) SUHII of the seasonal and annual trends in the nighttime.
Sustainability 16 06656 g006
Figure 7. Diurnal seasonal/annual differences in SUHII within LCZs. (a) SUHII of the seasonal and annual trends in the daytime; (b) SUHII of the seasonal and annual trends in the nighttime.
Sustainability 16 06656 g007
Figure 8. Spatial variations of the MGWR regression coefficients in the daytime. (a) Seasonal and annual SUHII; (b) MGWR coefficients of SHAPE_AM; (c) MGWR coefficients of LPI; (d) MGWR coefficients of PD.
Sustainability 16 06656 g008
Figure 9. Spatial variations of the MGWR regression coefficients in the nighttime. (a) Seasonal and annual SUHII; (b) MGWR coefficients of SHAPE_AM; (c) MGWR coefficients of LPI; (d) MGWR coefficients of PD.
Sustainability 16 06656 g009
Figure 10. Mean regression coefficients of MGWR for different periods in the five sample regions. Seasonal/annual mean coefficient of PLAND index with SUHII in five districts during nighttime: (a) old urban areas, (b) new urban areas, (c) urban–rural areas, (d) rural areas, and (e) industrial parks. Seasonal/annual mean coefficient of PLAND index with SUHII in five districts during nighttime: (f) old urban areas, (g) new urban areas, (h) urban–rural areas, (i) rural areas, (j) industrial parks.
Sustainability 16 06656 g010
Table 1. Data sources and descriptions.
Data ProductsResolution (m)TimeSurface ParameterSource
MOD11A110002001–2021LSTGEE
MOD09GA5002001–2021NDVI, NDBI, NDWI, MNDWI, EVI, SAVIGEE
MCD12Q15002001–2021Land coverGEE
SRTM902001–2021ElevationGEE
Google Earth image/2001–2021Select training samplesGoogle Earth Pro
Table 2. Description of spatial metrics.
Spatial MetricsAbbreviationDescription
Composition
Percentage of landscapePLANDRepresents the area proportion of each landscape type.
Configuration
Patch densityPDReflects landscape heterogeneity and fragmentation, the higher the value, the higher the fragmentation.
Largest patch indexLPIDescribes the degree of dominance of landscape types and helps determine landscape scale or dominant types.
Area-weighted mean shape indexSHAPE_AMRepresents the mean shape index of the corresponding patch type, the higher its value, the more irregular the patch’s shape.
Contagion indexCONTAGDescribe the extent of clustering of different patch types in the landscape.
Shannon’s Diversity IndexSHDIReflects landscape heterogeneity, the greater its value, the larger the value, the higher the landscape fragmentation.
Aggregation IndexAICharacterizes the degree of aggregation of a landscape type or an entire region’s landscape.
Shannon’s Evenness IndexSHEIReflects the uniformity of the plaque, the more the value tends to 1, the higher the uniformity.
Splitting IndexSPLITDirectly reflecting the degree of fragmentation of the landscape space after being divided up.
Table 3. Results of LCZ accuracy evaluation.
LCZ Class 12345678910ABCDEFGTotalUA (%)
15025054100103000400013836.2
220142229200004000900020868.3
3030113000020000000372.7
4261451886001080001511026570.9
5422514822001000160007410.8
6010174002001000101723.5
70002200000010101070
8010300010470000000521.9
9000210007010030201643.8
101823221601601260002610023054.8
A00010000001743701000175299.5
B00000000003719060006230.6
C001420000526651400817.4
D00030000010101611110161899.6
E2709100012111031430725.6
F0001000810911561220010918.3
G0000000000000100303196.8
Total1202651633339631711199179347718312329304769OA: 0.81
PA (%)41.753.66.256.520.566.705.963.663.397.240.485.78817.469100 Kappa:
0.83
Table 4. The area proportion of each LCZ type.
Built TypesArea Proportion (%)Land Cover TypesArea Proportion (%)
LCZ_12.11LCZ_A23.49
LCZ_28.86LCZ_B2.1
LCZ_30.42LCZ_C0.84
LCZ_48.72LCZ_D30.4
LCZ_52.44LCZ_E0.98
LCZ_60.78LCZ_F2.76
LCZ_70.12LCZ_G3.21
LCZ_80.67
LCZ_90.97
LCZ_1011.13
Table 5. Downscaling accuracy of LST.
Day/NightIndexSpringSummerAutumnWinterAnnual
DayRMSE0.800.920.650.560.56
R20.830.880.860.910.89
NightRMSE0.540.430.910.50.38
R20.850.930.850.870.91
Table 6. Spatial autocorrelation results for SUHII.
Day/NightTimeMoran’s IZ-Scorep-Value
DaytimeSpring0.64252.7940.000
Summer0.63754.4110.000
Autumn0.65455.8380.000
Winter0.66456.7370.000
Annual0.65555.9380.000
NighttimeSpring0.68158.1830.000
Summer0.68558.5390.000
Autumn0.68958.8510.000
Winter0.66056.3480.000
Annual0.64455.0500.000
Table 7. Comparative statistics of OLS, GWR, and MGWR model performance.
Day/NightModel SpringSummerAutumnWinterAnnual
Adj_R2AICcAdj_R2AICcAdj_R2AICcAdj_R2AICcAdj_R2AICc
DayOLS0.57 4032.51 0.61 3854.95 0.56 4073.83 0.54 4144.71 0.57 4007.22
GWR0.79 2941.44 0.80 2853.03 0.80 2867.49 0.80 2848.30 0.80 2835.05
MGWR0.80 2769.98 0.81 2696.27 0.81 2686.35 0.81 2664.88 0.81 2664.14
NightOLS0.58 3999.82 0.56 4094.56 0.52 4242.42 0.59 3947.23 0.61 3813.39
GWR0.80 2816.74 0.81 2789.94 0.78 2973.88 0.77 3005.87 0.76 3030.61
MGWR0.81 2692.75 0.81 2644.32 0.79 2846.37 0.78 2927.13 0.77 2968.85
Disclaimer/Publisher’s Note: The statements, opinions and data contained in all publications are solely those of the individual author(s) and contributor(s) and not of MDPI and/or the editor(s). MDPI and/or the editor(s) disclaim responsibility for any injury to people or property resulting from any ideas, methods, instructions or products referred to in the content.

