
A Data Analytics and Machine Learning Approach to Develop a Technology Roadmap for Next-Generation Logistics Utilizing Underground Systems


 ,
, 
Abstract
:1. Introduction
2. Literature Review
3. Methodology
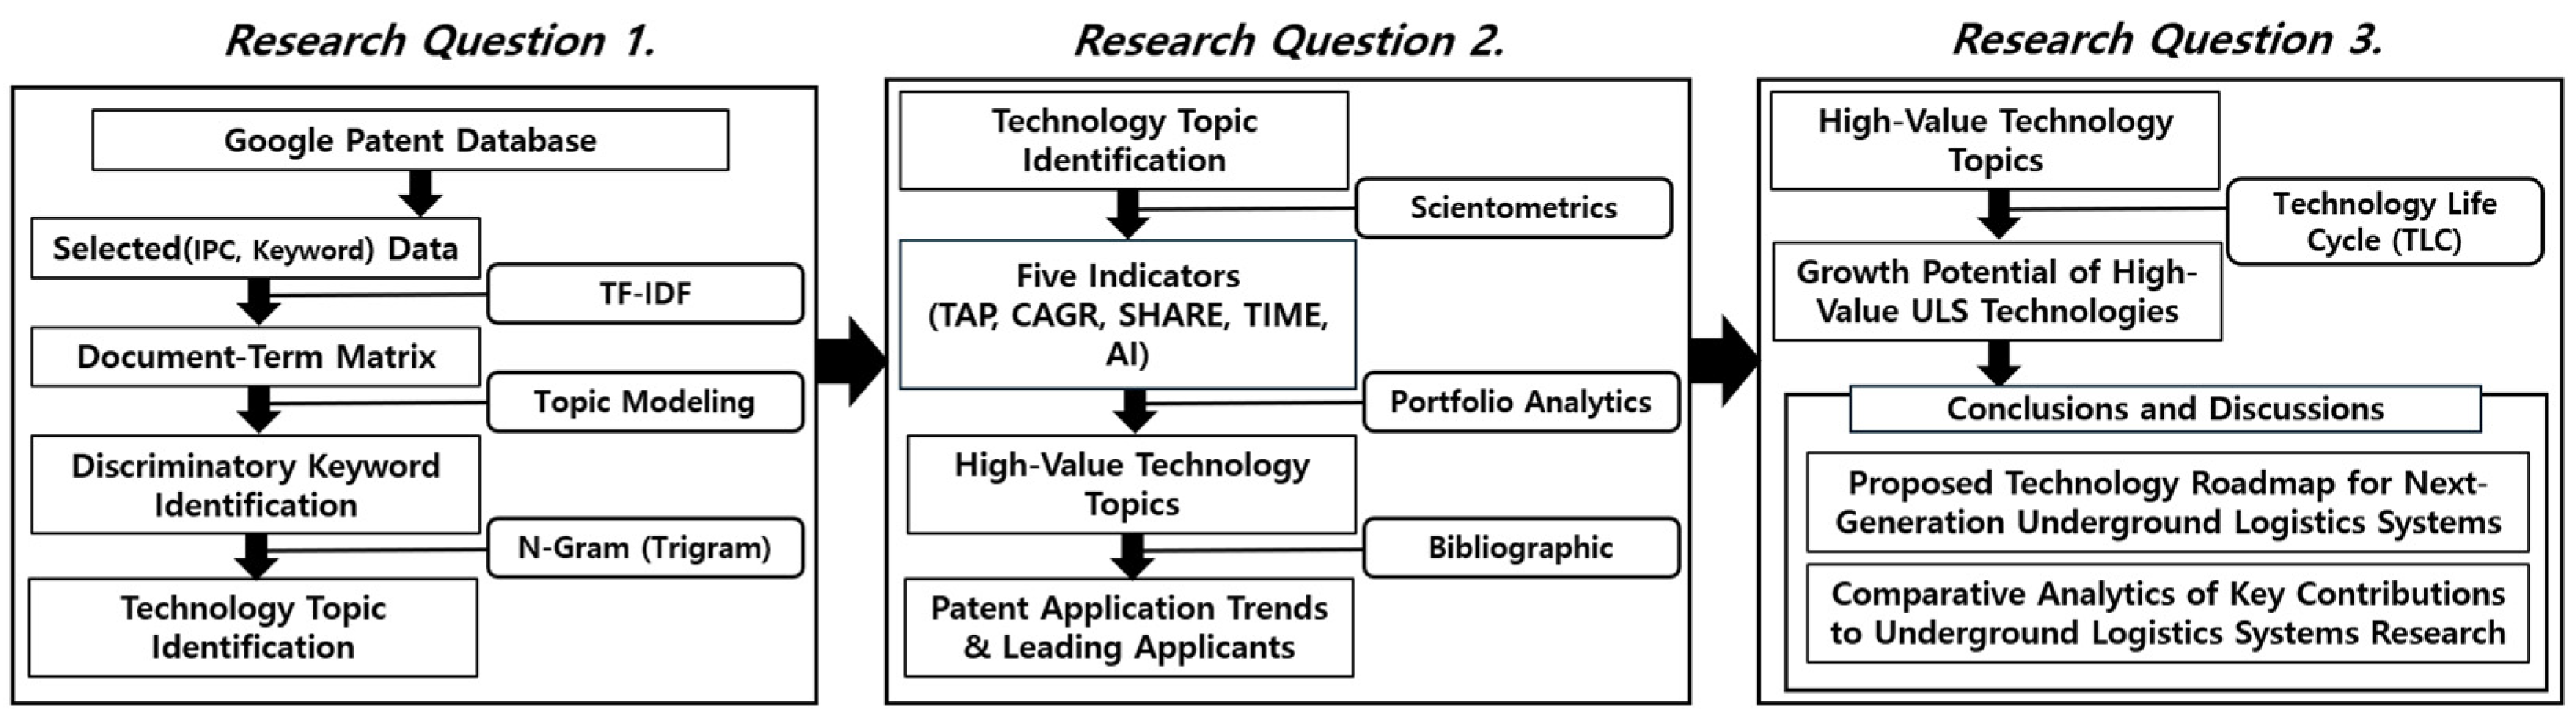
3.1. Research Questions and Data Extraction
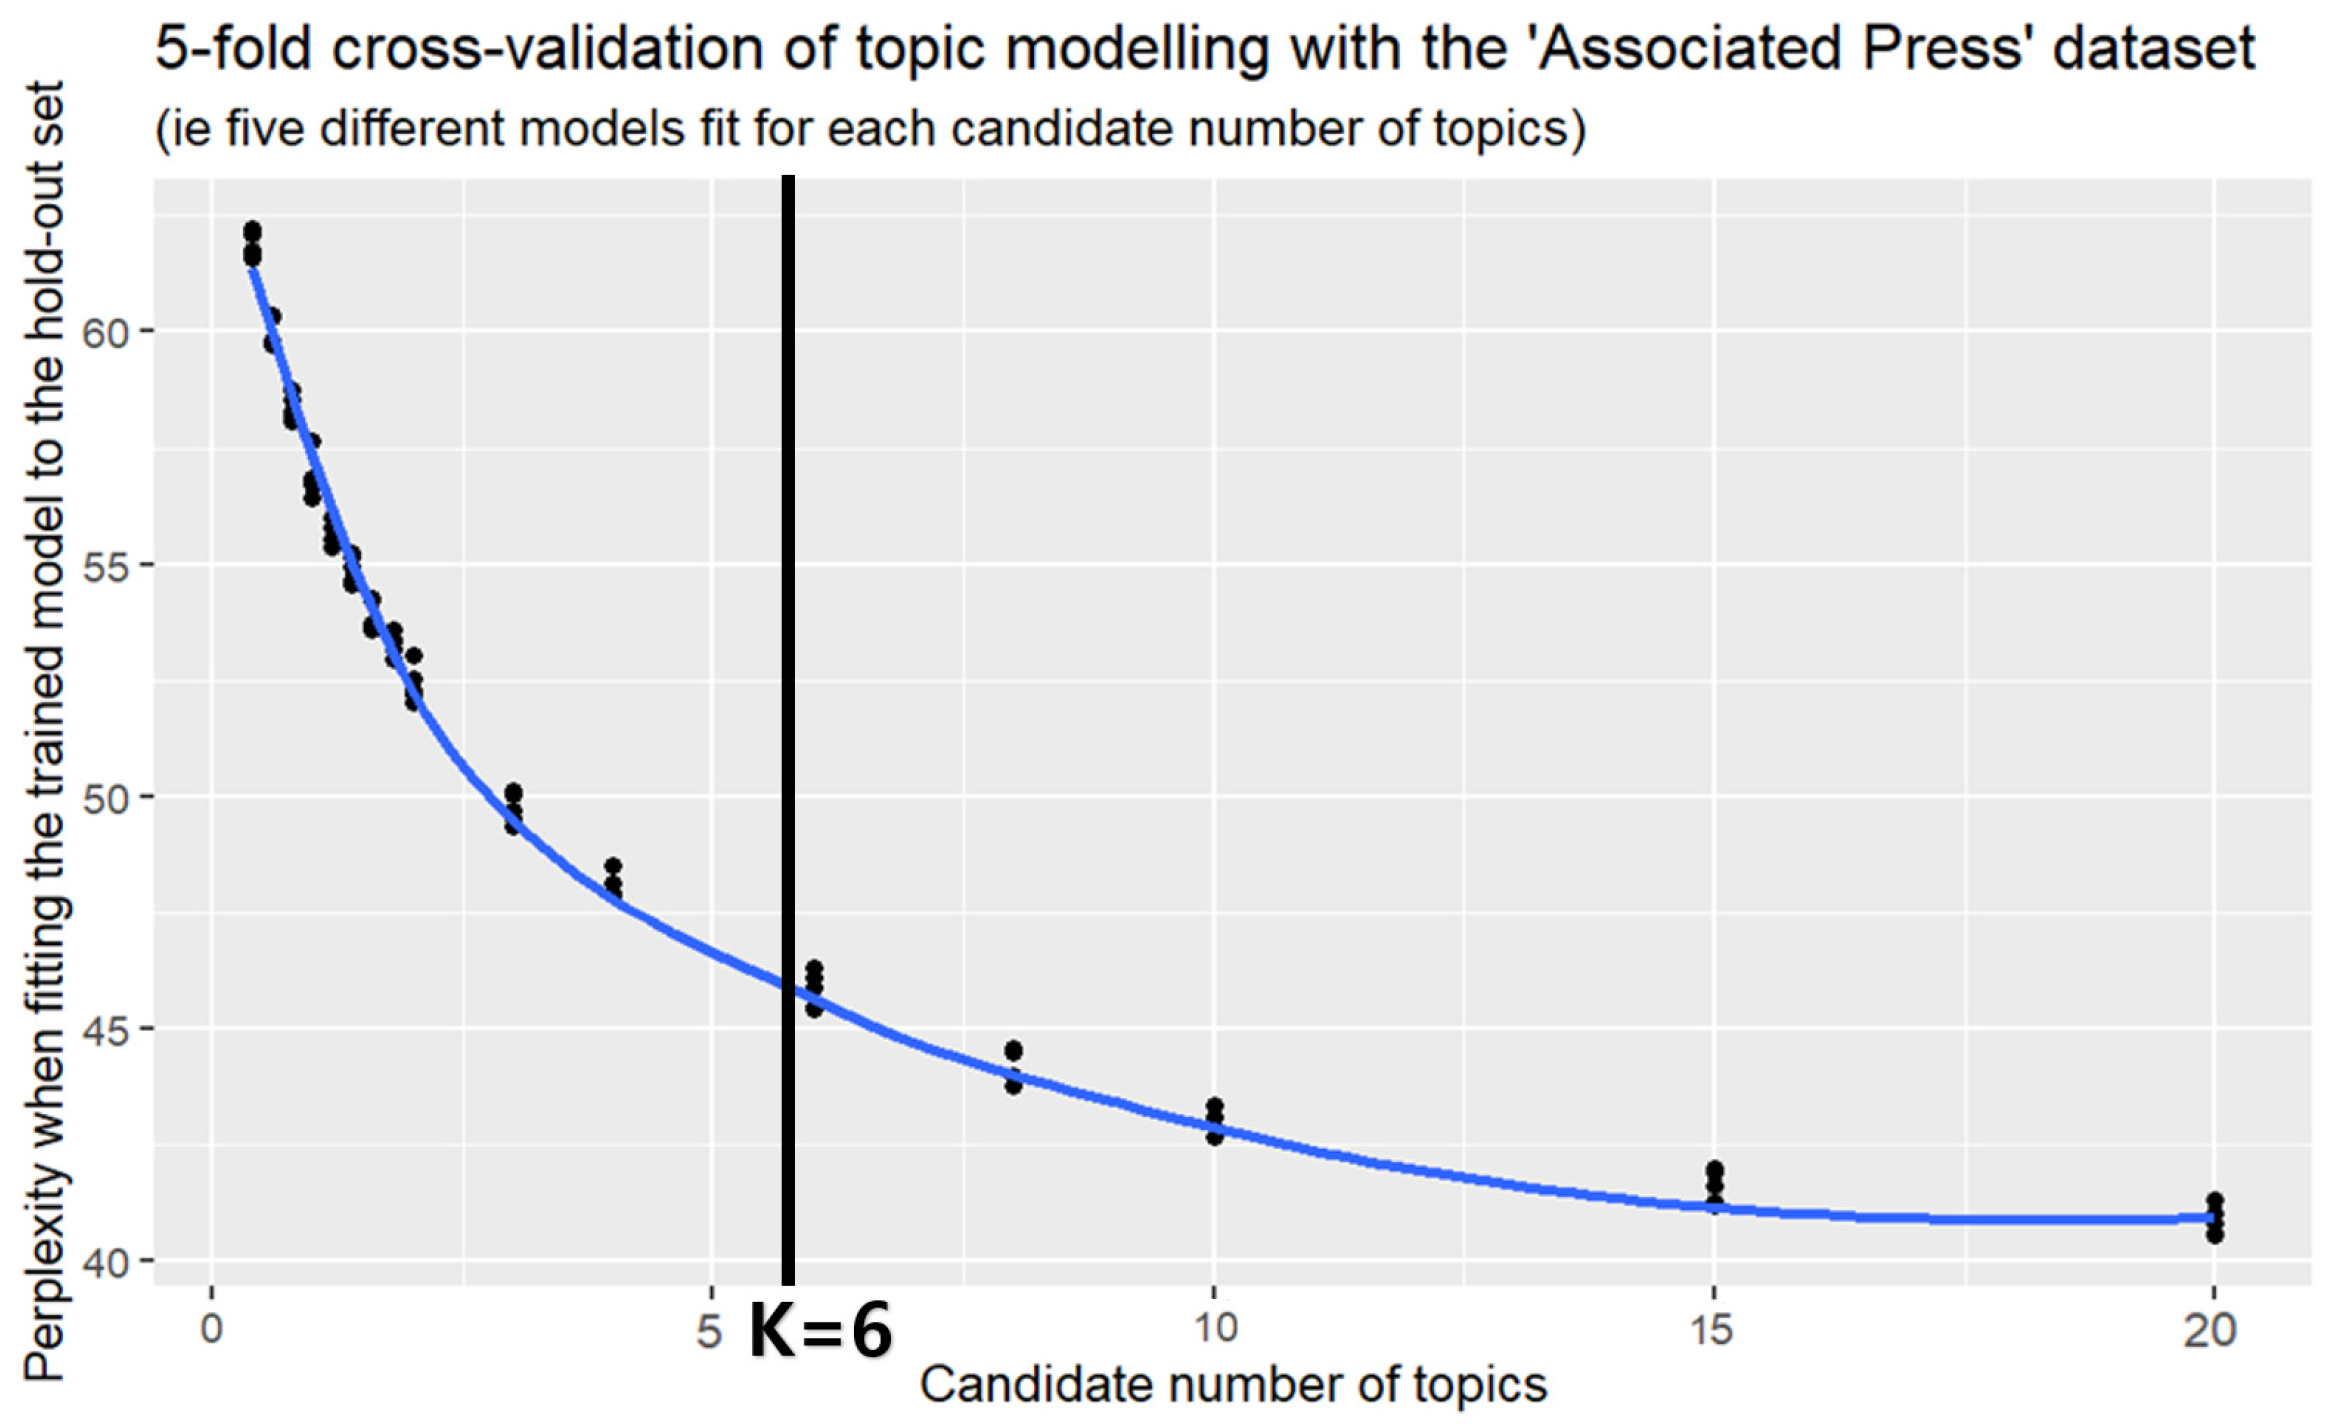
3.2. Detailed Technology Classification of the Underground Logistics System Field through Topic Modeling
3.3. Portfolio Analytics Identifies Applicants Leading Patent Applications in Areas of High Technology Value
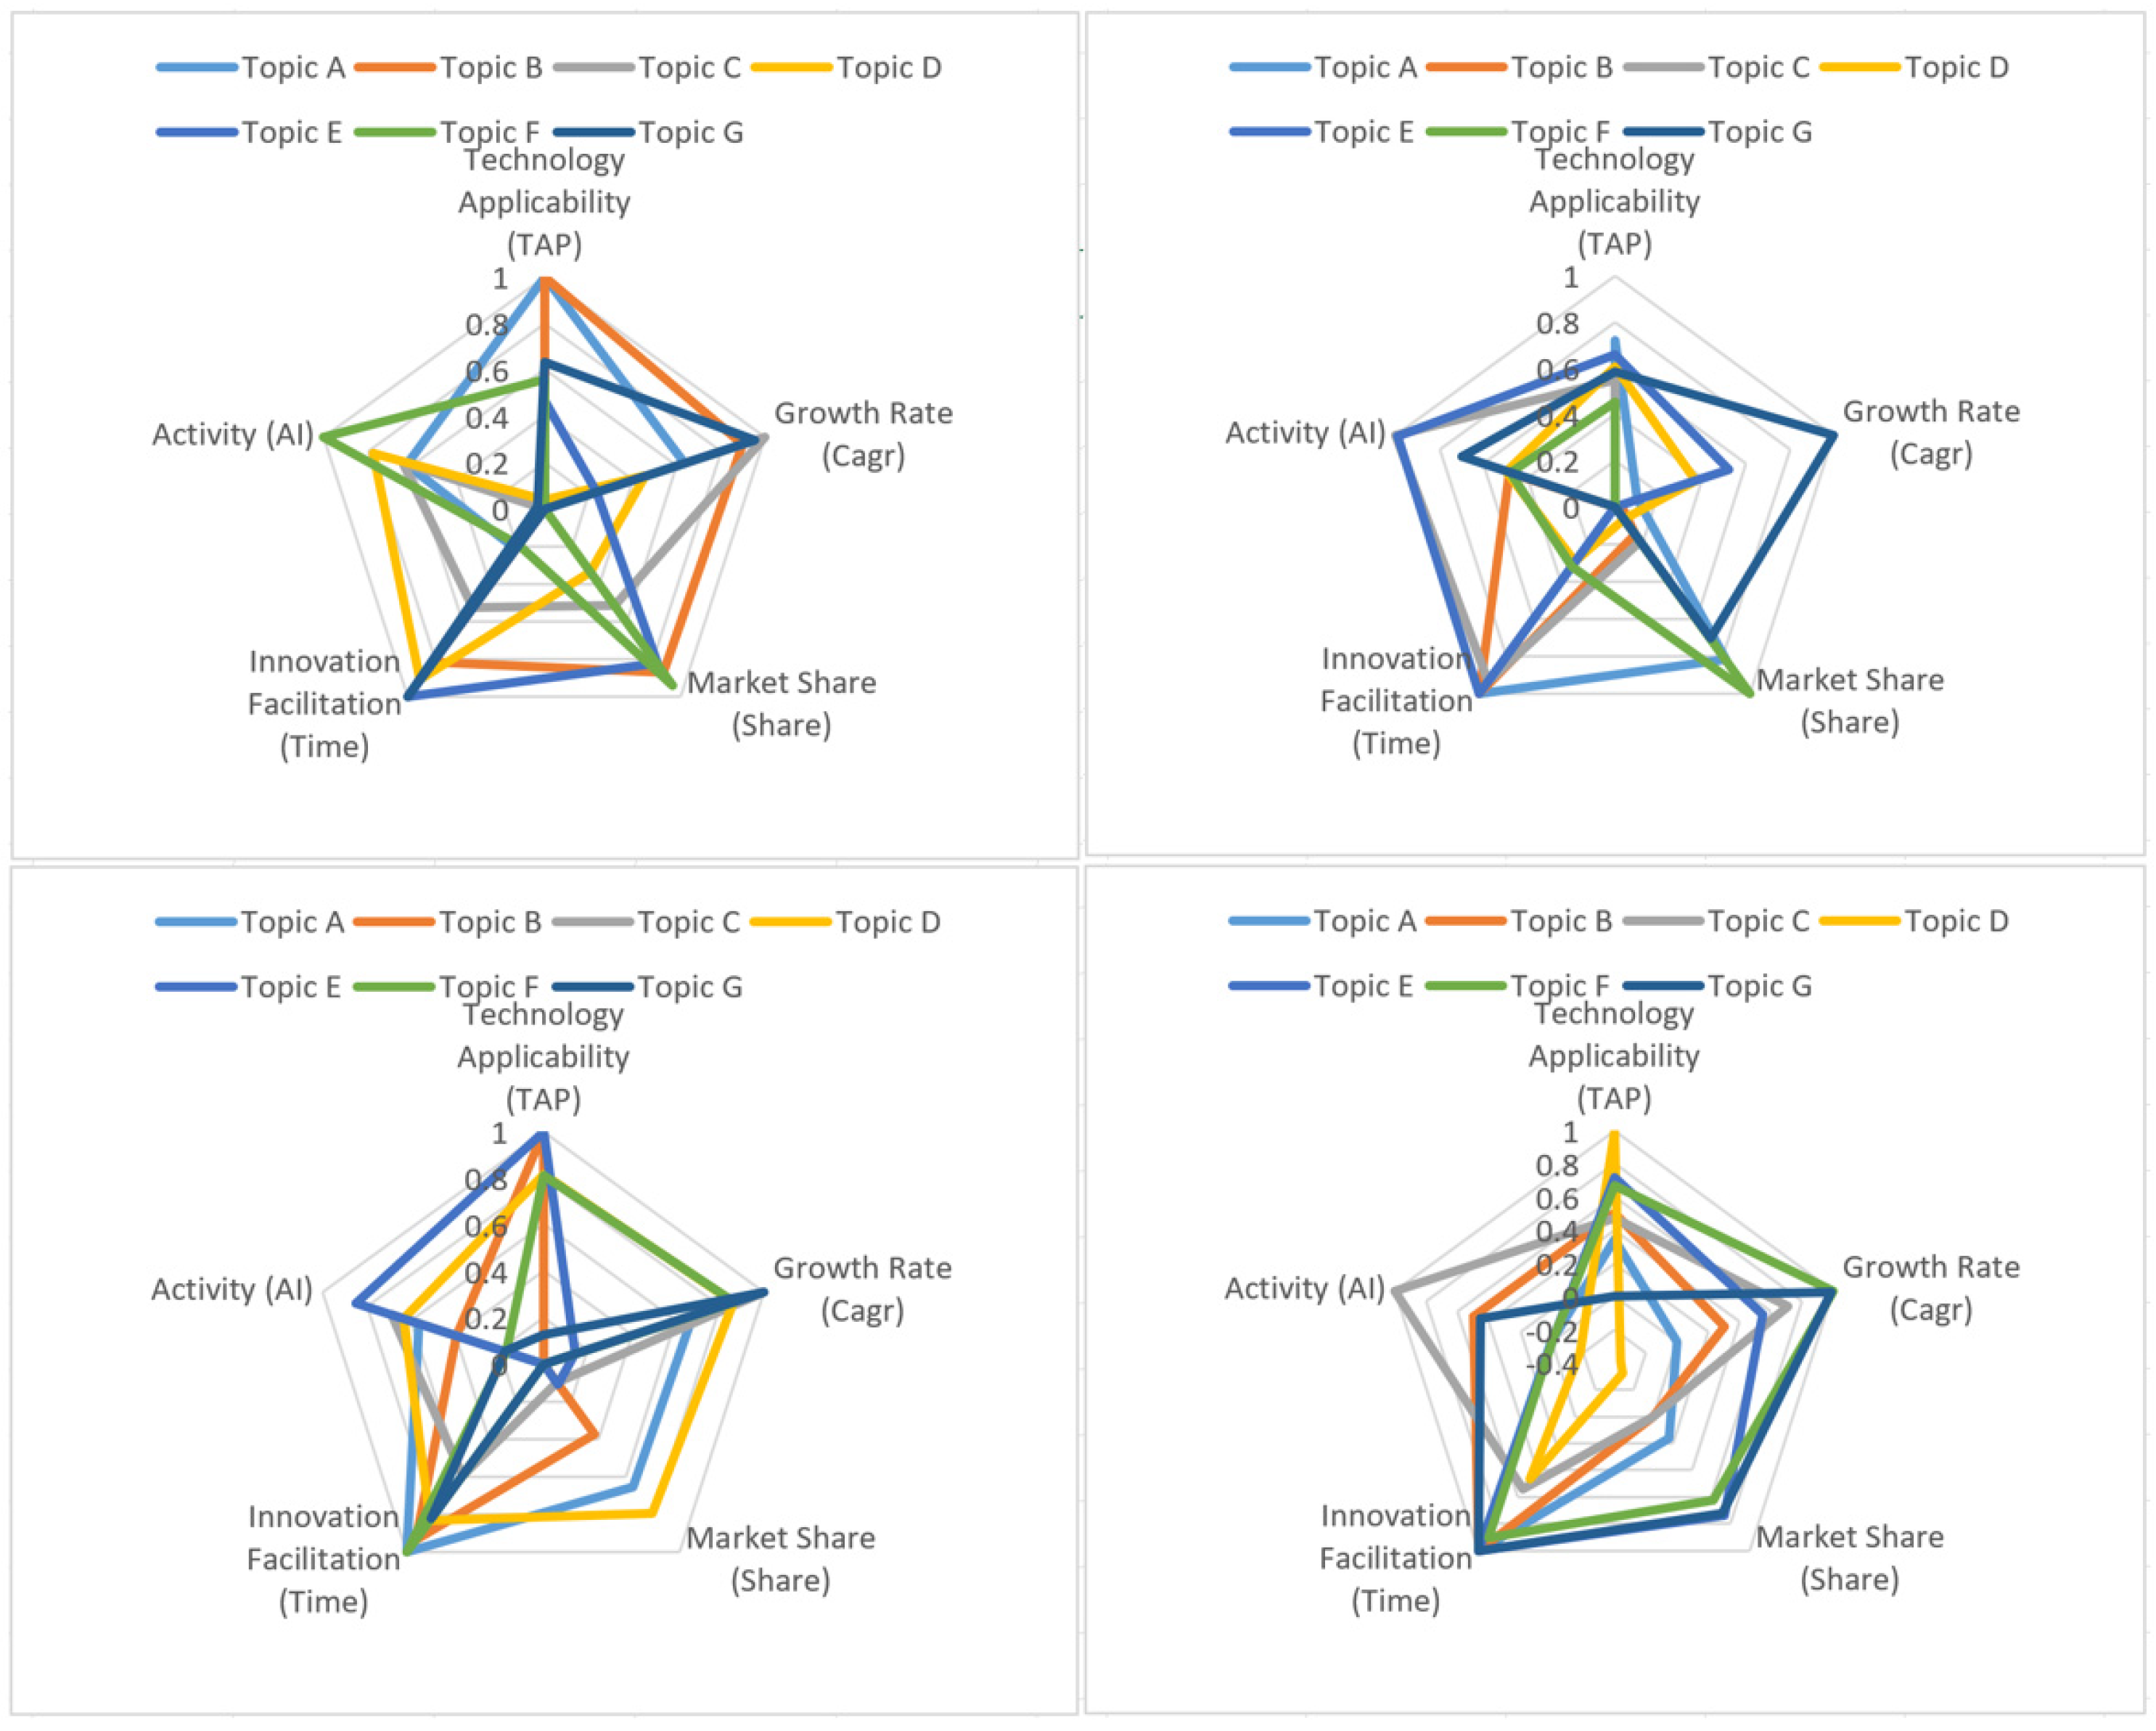
3.3.1. Technology Applicability (TAP)
3.3.2. Growth Rate (CAGR)
3.3.3. Market Share (SHARE)
3.3.4. Innovation Facilitation (TIME)
3.3.5. Activity (AI)
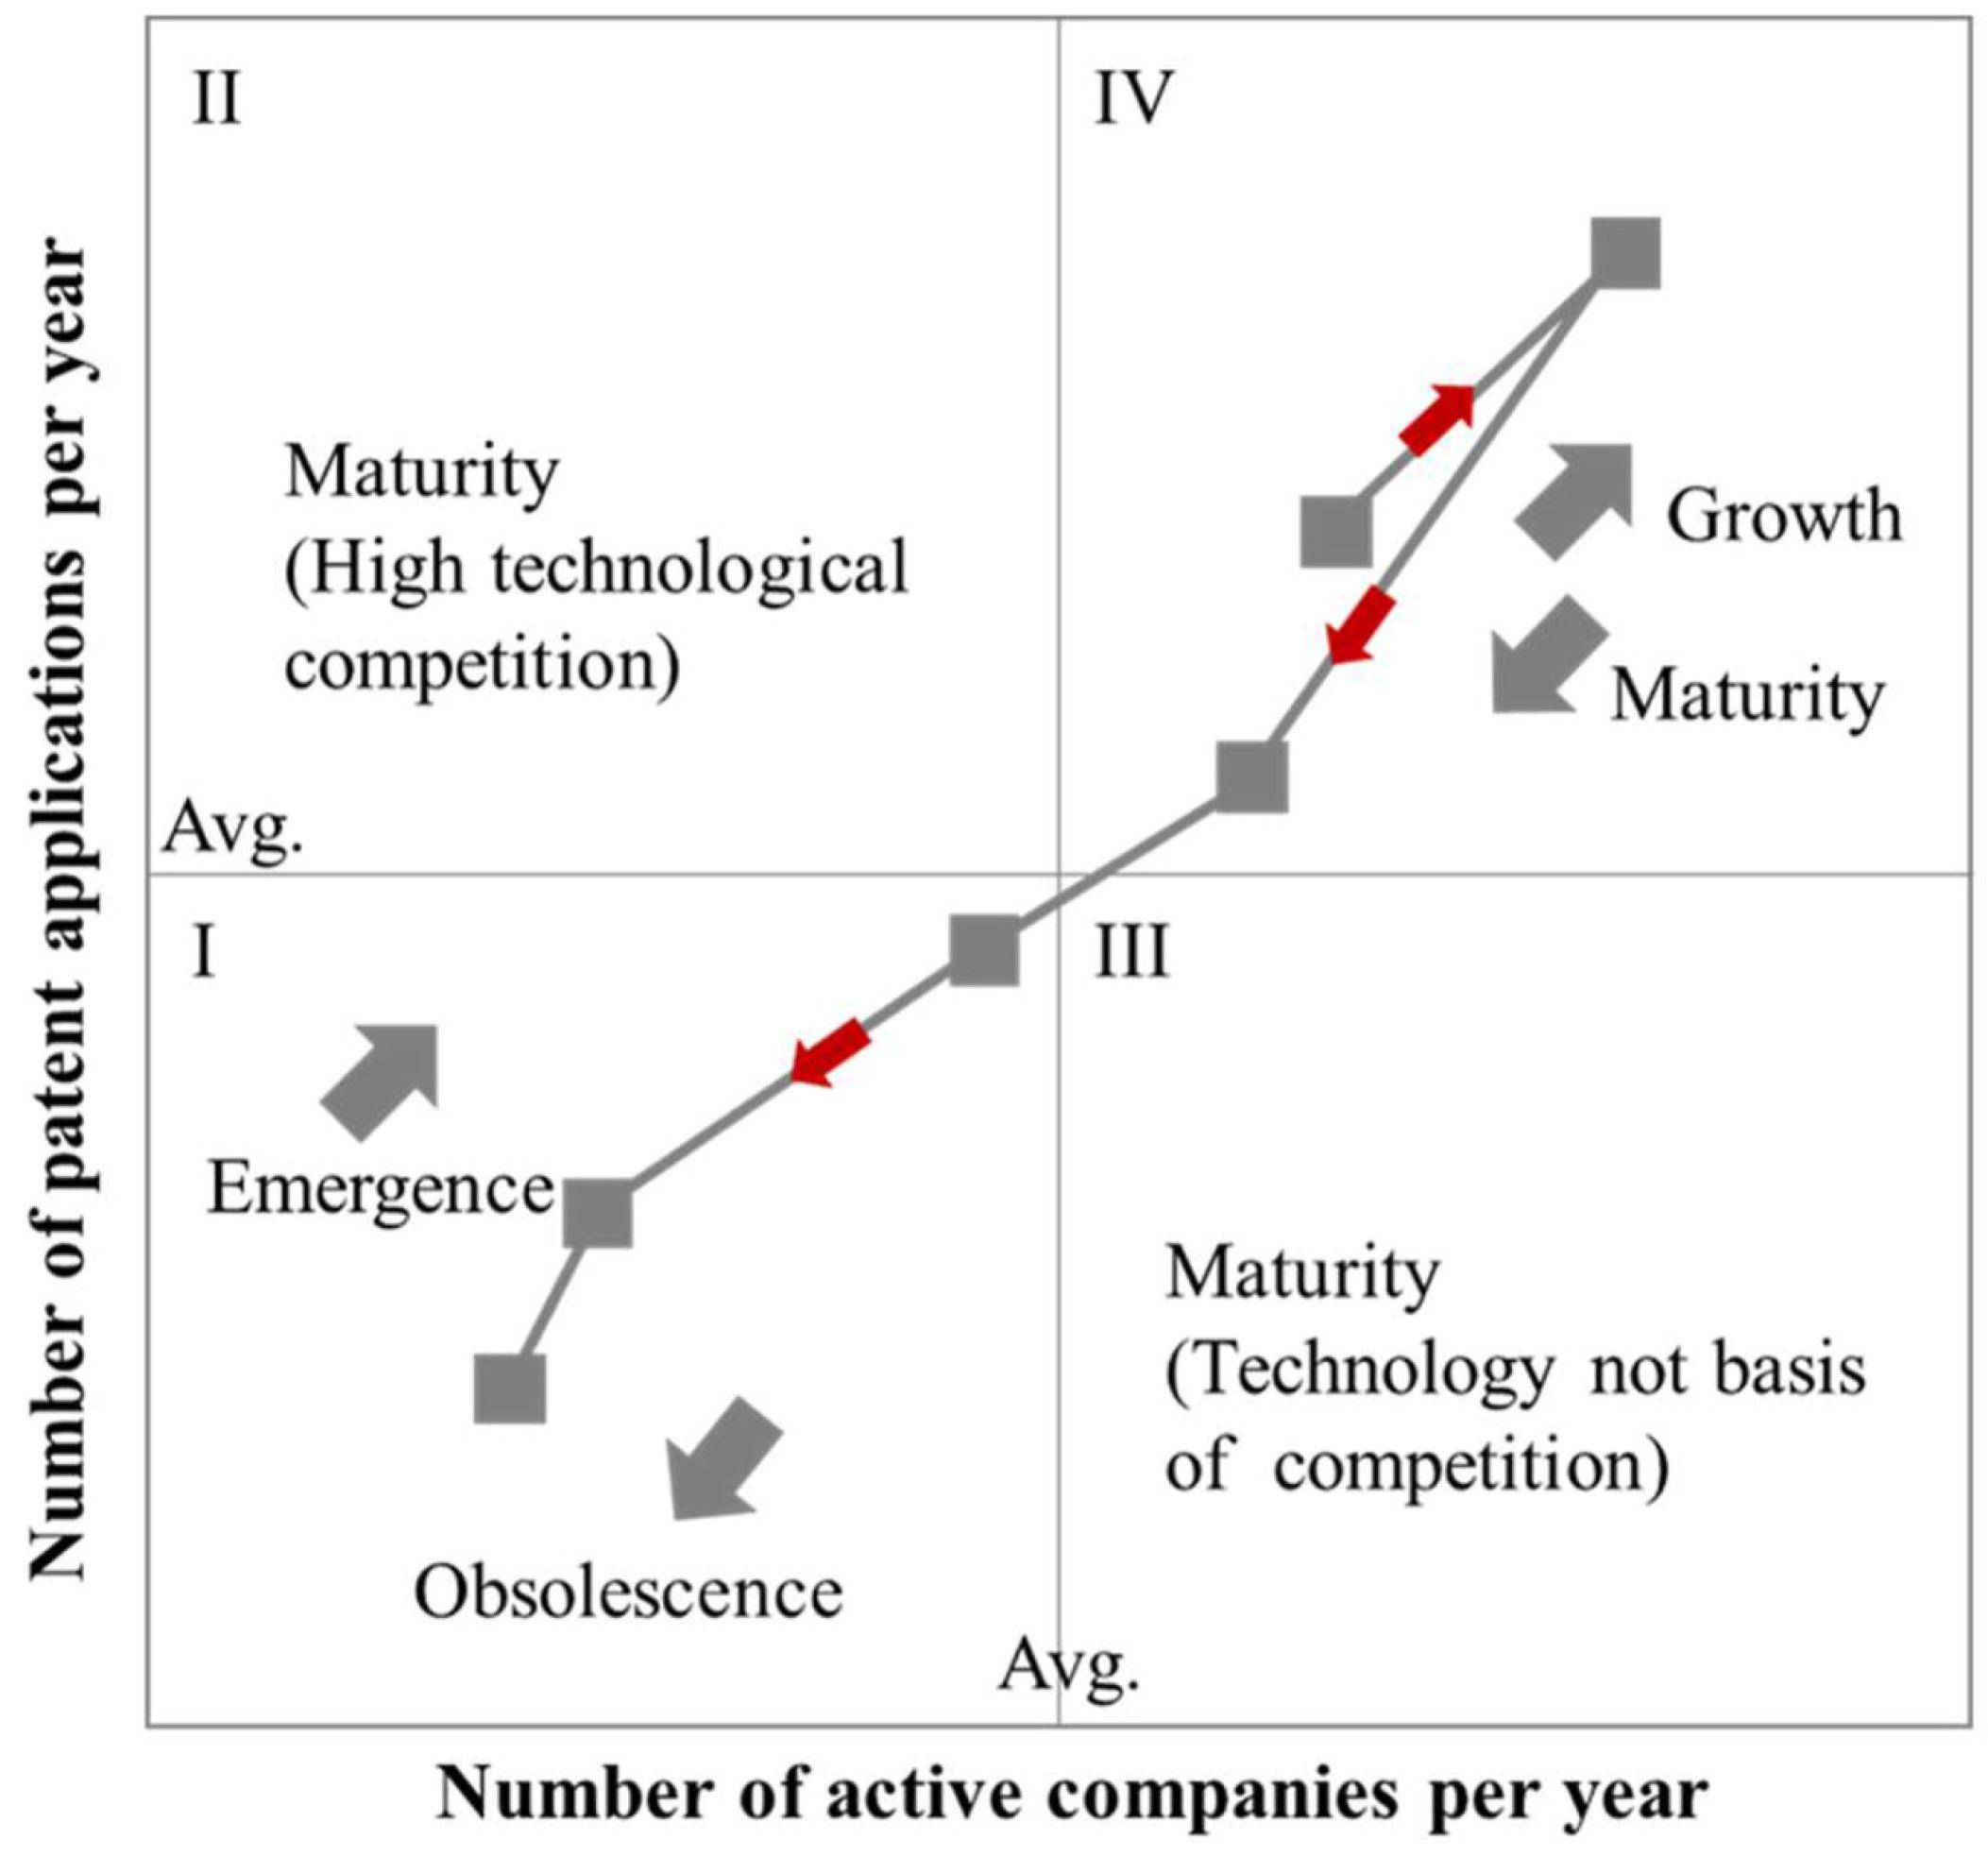
3.4. Evaluation of Technological Growth Potential for High-Value Areas through Technology Life Cycle Analytics
4. Results
4.1. Derive Technology Topics of ULS through Topic Modeling
4.2. Portfolio Analytics to Derive Technology Topics of High Value in the ULS
4.3. Identify Technology Opportunities in High-Value ULS through Technology Life Cycle Analytics
5. Conclusions and Discussions
5.1. Research Questions and Key Findings
5.2. Key Contribution of Our Research
5.3. Validation through Literature ReviewValidation through Literature Review
5.4. Validation through Policy Review
5.5. Limitations and Future Research Directions
Author Contributions
Funding
Institutional Review Board Statement
Informed Consent Statement
Data Availability Statement
Conflicts of Interest
References
- Guo, D.; Chen, Y.; Yang, J.; Tan, Y.H.; Zhang, C.; Chen, Z. Planning and application of underground logistics systems in new cities and districts in China. Tunn. Undergr. Space Technol. 2021, 113, 103947. [Google Scholar] [CrossRef]
- Dong, J.; Xu, Y.; Hwang, B.-g.; Ren, R.; Chen, Z. The impact of underground logistics system on urban sustainable development: A system dynamics approach. Sustainability 2019, 11, 1223. [Google Scholar] [CrossRef]
- Hu, W.; Dong, J.; Yang, K.; Hwang, B.-G.; Ren, R.; Chen, Z. Modeling Real-time operations of Metro-based urban underground logistics system network: A discrete event simulation approach. Tunn. Undergr. Space Technol. 2023, 132, 104896. [Google Scholar] [CrossRef]
- Knight, H.J. Patent Strategy: For Researchers and Research Managers; John Wiley & Sons: Hoboken, NJ, USA, 2013. [Google Scholar]
- Marco, A.C.; Sarnoff, J.D.; Charles, A. Patent claims and patent scope. Res. Policy 2019, 48, 103790. [Google Scholar] [CrossRef]
- Graham, S.; Hall, B.H.; Harhoff, D.; Mowery, D.C. Post-Issue Patent “Quality Control”: A Comparative Study of US Patent Re-Examinations and European Patent Oppositions; National Bureau of Economic Research: Cambridge, MA, USA, 2002. [Google Scholar]
- Noh, H.; Song, Y.-K.; Lee, S. Identifying emerging core technologies for the future: Case study of patents published by leading telecommunication organizations. Telecommun. Policy 2016, 40, 956–970. [Google Scholar] [CrossRef]
- Wang, G.; Guan, J. Value chain of nanotechnology: A comparative study of some major players. J. Nanoparticle Res. 2012, 14, 702. [Google Scholar] [CrossRef]
- Liu, K.-T.; Chen, C.-H. Formulation of research and development strategy by analysing patent portfolios of key players the semiconductor industry according to patent strength and technical function. World Pat. Inf. 2022, 70, 102125. [Google Scholar] [CrossRef]
- Bhatt, P.C.; Lai, K.-K.; Drave, V.A.; Lu, T.-C.; Kumar, V. Patent analysis based technology innovation assessment with the lens of disruptive innovation theory: A case of blockchain technological trajectories. Technol. Forecast. Soc. Change 2023, 196, 122864. [Google Scholar] [CrossRef]
- de Moura, L.C.M.A.; González, M.O.A.; de Oliveira Ferreira, P.; Sampaio, P.G.V. Technology mapping of direct seawater electrolysis through patent analysis. Int. J. Hydrogen Energy 2024, 56, 1120–1131. [Google Scholar] [CrossRef]
- Sampaio, P.G.V.; González, M.O.A.; de Vasconcelos, R.M.; dos Santos, M.A.T.; de Toledo, J.C.; Pereira, J.P.P. Photovoltaic technologies: Mapping from patent analysis. Renew. Sustain. Energy Rev. 2018, 93, 215–224. [Google Scholar] [CrossRef]
- Su, Y.-S.; Huang, H.; Daim, T.; Chien, P.-W.; Peng, R.-L.; Akgul, A.K. Assessing the technological trajectory of 5G-V2X autonomous driving inventions: Use of patent analysis. Technol. Forecast. Soc. Change 2023, 196, 122817. [Google Scholar] [CrossRef]
- Wang, J.; Cheng, L.; Feng, L.; Lin, K.-Y.; Zhang, L.; Zhao, W. Tracking and predicting technological knowledge interactions between artificial intelligence and wind power: Multimethod patent analysis. Adv. Eng. Inform. 2023, 58, 102177. [Google Scholar] [CrossRef]
- Ghaffari, M.; Aliahmadi, A.; Khalkhali, A.; Zakery, A.; Daim, T.U.; Yalcin, H. Topic-based technology mapping using patent data analysis: A case study of vehicle tires. Technol. Forecast. Soc. Change 2023, 193, 122576. [Google Scholar] [CrossRef]
- Ni, L.; Chen, X.; Gong, X.; Ai, M.; Xiong, M.; Tao, X.; Hu, Y.; Li, J.; Zhang, S. Patent information analysis of TCM prescription for the treatment of diabetes based on patent analysis and SWOT model. Phytomedicine Plus 2022, 2, 100307. [Google Scholar] [CrossRef]
- Mastilović, J.; Kevrešan, Ž.; Kukolj, D.; Kovač, R.; Samek, D.U.; Stankovski, S.; Ostojić, G.; Đerić, M. Sensors in postharvest technologies: Evidence from patent portfolio analysis. Postharvest Biol. Technol. 2024, 208, 112628. [Google Scholar] [CrossRef]
- Liu, M.; Guo, J.e.; Bi, D. Comparison of administrative and regulatory green technologies development between China and the US based on patent analysis. Data Sci. Manag. 2023, 6, 34–45. [Google Scholar] [CrossRef]
- Li, T.; He, X.; Gao, P. Analysis of offshore LNG storage and transportation technologies based on patent informatics. Clean. Eng. Technol. 2021, 5, 100317. [Google Scholar] [CrossRef]
- Jin, L.; Sun, X.; Ren, H.; Huang, H. Hotspots and trends of biological water treatment based on bibliometric review and patents analysis. J. Environ. Sci. 2023, 125, 774–785. [Google Scholar] [CrossRef] [PubMed]
- Rezaei, A.; Kamali, A.R. Evaluation of Technological Knowledge Transfer between Silicon Fen Firms and University of Cambridge Based on Patents Analysis. J. Open Innov. Technol. Mark. Complex. 2022, 8, 216. [Google Scholar] [CrossRef]
- Ma, R.; Zhang, Y.; Chen, J.; Wen, H. Patent research front mining of GaN semiconductor based on the LDA model. In SHS Web of Conferences; EDP Sciences: Les Ulis, France, 2022; Volume 140. [Google Scholar]
- Korobkin, D.; Saveliev, M.; Vereschak, G.; Fomenkov, S. The Building a Patent Landscape for Technological Forecasting Tasks. In Proceedings of the International Russian Automation Conference, Sochi, Russia, 4–10 September 2022; Springer: Berlin/Heidelberg, Germany, 2022; pp. 314–324. [Google Scholar]
- Yaman, A.; Sartono, B.; Soleh, A.M.; Indrawati, A.; Kartika, Y.A. Automated Multi-Label Classification on Fertilizer-Themed Patent Documents in Indonesia. DESIDOC J. Libr. Inf. Technol. 2022, 42, 218–226. [Google Scholar] [CrossRef]
- Zheng, Z.; Kang, B.-R.; Yuan, Q.-T.; Zhou, Y.-C.; Lu, X.-Z.; Lin, J.-R. Text Mining-Based Patent Analysis for Automated Rule Checking in AEC. arXiv 2022, arXiv:2212.05891. [Google Scholar]
- Huang, L.; Hou, Z.; Fang, Y.; Liu, J.; Shi, T. Evolution of CCUS Technologies Using LDA Topic Model and Derwent Patent Data. Energies 2023, 16, 2556. [Google Scholar] [CrossRef]
- Mastilović, J.; Kukolj, D.; Kevrešan, Ž.; Ostojić, G.; Kovač, R.; Đerić, M.; Samek, D.U. Emerging Perspectives of Blockchains in Food Supply Chain Traceability Based on Patent Analysis. Foods 2023, 12, 1036. [Google Scholar] [CrossRef] [PubMed]
- Tian, C.; Zhang, J.; Liu, D.; Wang, Q.; Lin, S. Technological topic analysis of standard-essential patents based on the improved Latent Dirichlet Allocation (LDA) model. Technol. Anal. Strateg. Manag. 2022, 36, 2084–2099. [Google Scholar] [CrossRef]
- Ryu, S.; Kim, J.; Park, N. Study on Trends and Predictions of Convergence in Cybersecurity Technology Using Machine Learning. J. Internet Technol. 2023, 24, 709–725. [Google Scholar]
- Mamaev, I.D.; Mamaeva, A.A.; Axenova, D.A. The Semantic Shifts of the Topical Structure in the Corpus of Lentach News Posts. In Proceedings of the Conference on Artificial Intelligence and Natural Language, Saint Petersburg, Russia, 14–15 April 2022; Springer: Berlin/Heidelberg, Germany, 2022; pp. 27–39. [Google Scholar]
- Song, Z.; Hu, Y.; Verma, A.; Buckeridge, D.L.; Li, Y. Automatic phenotyping by a seed-guided topic model. In Proceedings of the 28th ACM SIGKDD Conference on Knowledge Discovery and Data Mining, Washington, DC, USA, 14–18 August 2022; pp. 4713–4723. [Google Scholar]
- Lidan, Z. Topic Modeling Based on Attributed Graph. In Proceedings of the 2022 19th International Computer Conference on Wavelet Active Media Technology and Information Processing (ICCWAMTIP), Chengdu, China, 16–18 December 2022; pp. 1–4. [Google Scholar]
- Alazba, A.; Abouhagar, L.; Al-Harbi, R.; Al-Jamimi, H.A.; Sultan, A.; Al-Zaidy, R.A. Detection of Research Trends using Dynamic Topic Modeling. In Proceedings of the 2022 7th International Conference on Data Science and Machine Learning Applications (CDMA), Riyadh, Saudi Arabia, 1–3 March 2022; pp. 157–162. [Google Scholar]
- Lee, J.; Zo, H.J.; Steinberger, T. Exploring Trends in Blockchain Publications with Topic Modeling: Implications for Forecasting the Emergence of Industry Applications. ETRI J. 2023, 45, 982–995. [Google Scholar] [CrossRef]
- An, W.; Wang, L.; Zhang, D. Comprehensive commodity price forecasting framework using text mining methods. J. Forecast. 2023, 42, 1865–1888. [Google Scholar] [CrossRef]
- Kumar, A.; Esmaili, N.; Piccardi, M. A Temperature-Modified Dynamic Embedded Topic Model. In Proceedings of the Data Mining: 20th Australasian Conference, AusDM 2022, Western Sydney, Australia, 12–15 December 2022; Springer: Berlin/Heidelberg, Germany, 2022; pp. 15–27. [Google Scholar]
- Bekamiri, H.; Hain, D.S.; Jurowetzki, R. A Survey on Sentence Embedding Models Performance for Patent Analysis. arXiv 2022, arXiv:2206.02690. [Google Scholar]
- Ramadhani, P.A.; Wibawa, A.D. ICT Evolution Map Based on Indonesian Patent Documents Using Text Clustering Analysis. In Proceedings of the 2022 6th International Conference on Information Technology, Information Systems and Electrical Engineering (ICITISEE), Yogyakarta, Indonesia, 13–14 December 2022; pp. 109–114. [Google Scholar]
- Sokhansanj, B.A.; Rosen, G.L. Predicting Institution Outcomes for Inter Partes Review (IPR) Proceedings at the United States Patent Trial & Appeal Board by Deep Learning of Patent Owner Preliminary Response Briefs. Appl. Sci. 2022, 12, 3656. [Google Scholar] [CrossRef]
- Pujari, S.C.; Mantiuk, F.; Giereth, M.; Strötgen, J.; Friedrich, A. Evaluating Neural Multi-Field Document Representations for Patent Classification. 2022. Available online: https://opus.bibliothek.uni-augsburg.de/opus4/frontdoor/index/index/year/2023/docId/105570 (accessed on 10 April 2022).
- Choi, J.; Lee, J.; Yoon, J.; Jang, S.; Kim, J.; Choi, S. A two-stage deep learning-based system for patent citation recommendation. Scientometrics 2022, 127, 6615–6636. [Google Scholar] [CrossRef]
- Khan, A.; Ali, R. Measuring the Effectiveness of LDA-Based Clustering for Social Media Data. In Proceedings of the 2023 International Conference on Advances in Intelligent Computing and Applications (AICAPS), Kochi, India, 1–3 February 2023; pp. 1–8. [Google Scholar]
- Xu, Y.; Liang, Y.; Jia, B.; Xiong, S.; Xiao, Q. A Study of Text Mining for Chinese Coal Mine Safety Based on BILSTM-CRR-LDA. 2022. Available online: https://assets-eu.researchsquare.com/files/rs-2179141/v1_covered.pdf (accessed on 1 July 2024).
- Katarya, R.; Das, I.; Shrivastava, B.; Keswani, K. An Evaluation of LDA Modeling in Financial News Articles. In International Conference on Artificial Intelligence and Sustainable Engineering: Select Proceedings of AISE 2020; Springer: Berlin/Heidelberg, Germany, 2020; Volume 1, pp. 365–379. [Google Scholar]
- Cruz, C.A.A.; Balahadia, F.F. Province of Laguna Legislative Management and Tracking System with the Application of Latent Dirichlet Allocation (LDA) Algorithm. Int. J. Comput. Sci. Res. 2023, 7, 1162–1186. [Google Scholar] [CrossRef]
- Qian, Y.; Jiang, Y.; Shang, J.; Chai, Y.; Liu, Y. Why some products compete and others don’t: A competitive attribution model from customer perspective. Decis. Support Syst. 2023, 169, 113956. [Google Scholar] [CrossRef]
- Kamaruddin, S.S.; Ahmad, F.K.; Taiye, M.A. LDA based topic modeling on hospital Facebook posts. In Recent Advances in Soft Computing and Data Mining: Proceedings of the Fifth International Conference on Soft Computing and Data Mining (SCDM 2022), Virtual Event, 30–31 May 2022; Springer: Berlin/Heidelberg, Germany, 2022; pp. 140–149. [Google Scholar]
- Haghighian Roudsari, A.; Afshar, J.; Lee, W.; Lee, S. PatentNet: Multi-label classification of patent documents using deep learning based language understanding. Scientometrics 2021, 127, 207–231. [Google Scholar] [CrossRef]
- Wu, Y. Predicting the Unpredictable–Using Language Models to Assess Literary Quality. 2023. Available online: https://uu.diva-portal.org/smash/get/diva2:1769205/FULLTEXT01.pdf (accessed on 1 July 2024).
- Edman, L.; Toral, A.; van Noord, G. The Importance of Context in Very Low Resource Language Modeling. arXiv 2022, arXiv:2205.04810. [Google Scholar]
- Pandey, A.K.; Roy, S.S. Natural Language Generation Using Sequential Models: A Survey. Neural Process. Lett. 2023, 55, 7709–7742. [Google Scholar] [CrossRef]
- Choi, I.; Sung, W. Sleep Model—A Sequence Model for Predicting the Next Sleep Stage. arXiv 2023, arXiv:2302.12709. [Google Scholar]
- Krishnan, A.; Alabi, J.; Klakow, D. On the N-gram Approximation of Pre-trained Language Models. arXiv 2023, arXiv:2306.06892. [Google Scholar]
- Kronemeyer, L.L.; Kotzab, H.; Moehrle, M.G. Analyzing technological competencies in the patent-based supplier portfolio: Introducing an approach for supplier evaluation using semantic anchor points and similarity measurements. Int. J. Oper. Prod. Manag. 2022, 42, 1732–1759. [Google Scholar] [CrossRef]
- Rene, A.O.N.; Okuhara, K.; Matsui, T. Natural Language Generation System for Knowledge Acquisition Based on Patent Database. J. Adv. Comput. Intell. Intell. Inform. 2022, 26, 160–168. [Google Scholar] [CrossRef]
- Wei, C.; Wang, Y.-C.; Wang, B.; Kuo, C.-C.J. An overview on language models: Recent developments and outlook. arXiv 2023, arXiv:2303.05759. [Google Scholar] [CrossRef]
- Grimaldi, M.; Cricelli, L.; Di Giovanni, M.; Rogo, F. The patent portfolio value analysis: A new framework to leverage patent information for strategic technology planning. Technol. Forecast. Soc. Change 2015, 94, 286–302. [Google Scholar] [CrossRef]
- Park, S.; LiPuma, J.A. New venture internationalization: The role of venture capital types and reputation. J. World Bus. 2020, 55, 101025. [Google Scholar] [CrossRef]
- Fabry, B.; Ernst, H.; Langholz, J.; Köster, M. Patent portfolio analysis as a useful tool for identifying R&D and business opportunities—An empirical application in the nutrition and health industry. World Pat. Inf. 2006, 28, 215–225. [Google Scholar]
- Ponta, L.; Puliga, G.; Manzini, R. A measure of innovation performance: The Innovation Patent Index. Manag. Decis. 2021, 59, 73–98. [Google Scholar] [CrossRef]
- Song, K.; Kim, K.S.; Lee, S. Discovering new technology opportunities based on patents: Text-mining and F-term analysis. Technovation 2017, 60, 1–14. [Google Scholar] [CrossRef]
- Lee, S.; Kim, W. The knowledge network dynamics in a mobile ecosystem: A patent citation analysis. Scientometrics 2017, 111, 717–742. [Google Scholar] [CrossRef]
- Choi, D.; Song, B. Exploring technological trends in logistics: Topic modeling-based patent analysis. Sustainability 2018, 10, 2810. [Google Scholar] [CrossRef]
- Korotky, S.K. Semi-empirical description and projections of Internet traffic trends using a hyperbolic compound annual growth rate. Bell Labs Tech. J. 2013, 18, 5–21. [Google Scholar] [CrossRef]
- van Genuchten, M.; Hatton, L. Compound annual growth rate for software. IEEE Softw. 2012, 29, 19–21. [Google Scholar] [CrossRef]
- Hegde, D.; Herkenhoff, K.F.; Zhu, C. Patent Publication and Innovation; National Bureau of Economic Research: Cambridge, MA, USA, 2022. [Google Scholar]
- da Silva, A.G.; Mendes Gomes, M.V.; Winkler, I. Virtual reality and digital human modeling for ergonomic assessment in industrial product development: A patent and literature review. Appl. Sci. 2022, 12, 1084. [Google Scholar] [CrossRef]
- Otero, D.M.; Mendes, G.d.R.L.; da Silva Lucas, A.J.; Christ-Ribeiro, A.; Ribeiro, C.D.F. Exploring alternative protein sources: Evidence from patents and articles focusing on food markets. Food Chem. 2022, 394, 133486. [Google Scholar] [CrossRef] [PubMed]
- Takalo, T.; Kanniainen, V. Do patents slow down technological progress?: Real options in research, patenting, and market introduction. Int. J. Ind. Organ. 2000, 18, 1105–1127. [Google Scholar] [CrossRef]
- Lang, J.C. Management of intellectual property rights: Strategic patenting. J. Intellect. Cap. 2001, 2, 8–26. [Google Scholar] [CrossRef]
- Harhoff, D.; Wagner, S. The duration of patent examination at the European Patent Office. Manag. Sci. 2009, 55, 1969–1984. [Google Scholar] [CrossRef]
- Seungho, J.E. Qualitative Comparison of the Qualities of Patents out of IP5 Countries. KDI School. 2016. Available online: https://archives.kdischool.ac.kr/bitstream/11125/31926/1/Qualitative%20comparison%20of%20the%20qualities%20of%20patents%20out%20of%20IP5%20countries.pdf (accessed on 1 July 2024).
- Yang, H.; Zhang, Y.; Liu, L. Patent priority examination under mission orientation: Can speed and quality coexist? Technol. Soc. 2024, 76, 102452. [Google Scholar] [CrossRef]
- Hoshino, K.; Okuma, Y.; Nishimura, H. Research on Patent Examination Practices for Emerging Technologies in ASEAN Member States. 2021. Available online: https://www.eria.org/publications/research-on-patent-examination-practices-for-emerging-technologies-in-asean-member-states/ (accessed on 1 July 2024).
- Cao, S.; Lei, Z.; Oh, J. How do firms utilize the deferred patent examination system? Evidence from Korea. Eur. J. Innov. Manag. 2019, 22, 234–256. [Google Scholar] [CrossRef]
- Breschi, S.; Helg, R. Technological Change and International Competitiveness: The Case of Switzerland; Cattaneo University: Castellanza, Italy, 1996. [Google Scholar]
- Rousseau, R. Balassa= revealed competitive advantage= activity. Scientometrics 2019, 121, 1835–1836. [Google Scholar] [CrossRef]
- Gokovali, U.; Medettin, B. RCA vs. RTA and Sectoral Import vs. RTA: First Empirical Evidence for Turkey. In Industrial Dynamics, Innovation Policy, and Economic Growth through Technological Advancements; IGI Global: Hershey, PA, USA, 2013; pp. 217–236. [Google Scholar]
- Cudré-Mauroux, C.; Gugler, P. Industrial clusters as drivers of revealed technological advantages of regions: The case of the Swiss chemical and pharmaceutical industries. Eur. J. Int. Manag. 2023, 21, 440–459. [Google Scholar] [CrossRef]
- Rojas-Lamorena, Á.J.; Del Barrio-García, S.; Alcántara-Pilar, J.M. A review of three decades of academic research on brand equity: A bibliometric approach using co-word analysis and bibliographic coupling. J. Bus. Res. 2022, 139, 1067–1083. [Google Scholar] [CrossRef]
- Maghzian, A.; Aslani, A.; Zahedi, R. Review on the direct air CO2 capture by microalgae: Bibliographic mapping. Energy Rep. 2022, 8, 3337–3349. [Google Scholar] [CrossRef]
- Lee, Y.-J.; Han, Y.J.; Kim, S.-S.; Lee, C. Patent data analytics for technology forecasting of the railway main transformer. Sustainability 2022, 15, 278. [Google Scholar] [CrossRef]
- Kwon, K.; Jun, S.; Lee, Y.-J.; Choi, S.; Lee, C. Logistics Technology Forecasting Framework Using Patent Analysis for Technology Roadmap. Sustainability 2022, 14, 5430. [Google Scholar] [CrossRef]
- Wang, X.; Daim, T.; Huang, L.; Li, Z.; Shaikh, R.; Kassi, D.F. Monitoring the development trend and competition status of high technologies using patent analysis and bibliographic coupling: The case of electronic design automation technology. Technol. Soc. 2022, 71, 102076. [Google Scholar] [CrossRef]
- Mate, Y.D.; Mate, S.Y.; Barad, P.H. Patent literature in Astronomy and Astrophysics Subject Area: Scientometrics analysis. Int. J. Mech. Eng. 2021, 6, 547–561. [Google Scholar]
- Yang, H.; Han, Y.J.; Yu, J.; Kim, S.; Lee, S.; Kim, G.; Lee, C. Exploring future promising technologies in hydrogen fuel cell transportation. Sustainability 2022, 14, 917. [Google Scholar] [CrossRef]
- Zamani, M.; Yalcin, H.; Naeini, A.B.; Zeba, G.; Daim, T.U. Developing metrics for emerging technologies: Identification and assessment. Technol. Forecast. Soc. Change 2022, 176, 121456. [Google Scholar] [CrossRef]
- Malekli, M.; Aslani, A.; Zolfaghari, Z.; Zahedi, R.; Moshari, A. Advanced bibliometric analysis on the development of natural gas combined cycle power plant with CO2 capture and storage technology. Sustain. Energy Technol. Assess. 2022, 52, 102339. [Google Scholar] [CrossRef]
- Viswanathan, R.; Telukdarie, A. The role of 4IR technologies in waste management practices-a bibliographic analysis. Procedia Comput. Sci. 2022, 200, 247–256. [Google Scholar] [CrossRef]
- Lareyre, F.; Lê, C.D.; Ballaith, A.; Adam, C.; Carrier, M.; Amrani, S.; Caradu, C.; Raffort, J. Applications of artificial intelligence in non-cardiac vascular diseases: A bibliographic analysis. Angiology 2022, 73, 606–614. [Google Scholar] [CrossRef]
- Song, Y.; Lei, L. A comparative analysis of Inventor Patent Classification Coupling between the first-inventor and all-inventor: Taking 3D printing as an example. J. Inf. Sci. 2022, 50, 378–393. [Google Scholar] [CrossRef]
- Denter, N.M.; Seeger, F.; Moehrle, M.G. How can Blockchain technology support patent management? A systematic literature review. Int. J. Inf. Manag. 2023, 68, 102506. [Google Scholar] [CrossRef]
- Habiburrahman, I.; Sumaryana, A.; Ismanto, S.U.; Sukarno, D. Publication Pattern of Patent Policy Research: A Bibliometric Analysis. Sci. Technol. Libr. 2022, 41, 397–410. [Google Scholar] [CrossRef]
- Song, Y.; Lei, L.; Wu, L.; Chen, S. Studying domain structure: A comparative analysis of bibliographic coupling analysis and co-citation analysis considering all authors. Online Inf. Rev. 2023, 47, 123–137. [Google Scholar] [CrossRef]
- Harvey, M.G. Application of technology life cycles to technology transfers. J. Bus. Strategy 1984, 5, 51–58. [Google Scholar] [CrossRef]
- Campbell, R.S. Patent trends as a technological forecasting tool. World Pat. Inf. 1983, 5, 137–143. [Google Scholar] [CrossRef]
- Mogee, M.; Ashton, W.; Klavans, R.A. Keeping Abreast of Science and Technology: Technical Intelligence for Business; Battelle Pr: Columbus, OH, USA, 1997. [Google Scholar]
- Lee, T.H.; Nakicenovic, N. Technology life–cycles and business decisions. Int. J. Technol. Manag. 1988, 3, 411–426. [Google Scholar]
- Markard, J. The life cycle of technological innovation systems. Technol. Forecast. Soc. Change 2020, 153, 119407. [Google Scholar] [CrossRef]
- Gao, L.; Porter, A.L.; Wang, J.; Fang, S.; Zhang, X.; Ma, T.; Wang, W.; Huang, L. Technology life cycle analysis method based on patent documents. Technol. Forecast. Soc. Change 2013, 80, 398–407. [Google Scholar] [CrossRef]
- Roussel, P.A. Technological maturity proves a valid and important concept. Res. Manag. 1984, 27, 29–34. [Google Scholar] [CrossRef]
- Bergerson, J.A.; Brandt, A.; Cresko, J.; Carbajales-Dale, M.; MacLean, H.L.; Matthews, H.S.; McCoy, S.; McManus, M.; Miller, S.A.; Morrow, W.R. Life cycle assessment of emerging technologies: Evaluation techniques at different stages of market and technical maturity. J. Ind. Ecol. 2020, 24, 11–25. [Google Scholar] [CrossRef]
- Jamali, M.Y.; Aslani, A.; Moghadam, B.F.; Naaranoja, M.; Madvar, M.D. Analysis of photovoltaic technology development based on technology life cycle approach. J. Renew. Sustain. Energy 2016, 8, 035905. [Google Scholar] [CrossRef]
- Edelenbos, J.; Monnikhof, R.; Haasnoot, J.; Van Der Hoeven, F.; Horvat, E.; Van Der Krogt, R. Strategic study on the utilization of underground space in the Netherlands. Tunn. Undergr. Space Technol. 1998, 13, 159–165. [Google Scholar] [CrossRef]
- Bobylev, N. Mainstreaming sustainable development into a city’s Master plan: A case of Urban Underground Space use. Land Use Policy 2009, 26, 1128–1137. [Google Scholar] [CrossRef]
- Chen, Z.; Dong, J.; Ren, R. Urban underground logistics system in China: Opportunities or challenges? Undergr. Space 2017, 2, 195–208. [Google Scholar] [CrossRef]
- Qihu, Q. Present state, problems and development trends of urban underground space in China. Tunn. Undergr. Space Technol. 2016, 55, 280–289. [Google Scholar] [CrossRef]
- Makana, L.; Jefferson, I.; Hunt, D.; Rogers, C. Assessment of the future resilience of sustainable urban sub-surface environments. Tunn. Undergr. Space Technol. 2016, 55, 21–31. [Google Scholar] [CrossRef]
- Hunt, D.; Makana, L.; Jefferson, I.; Rogers, C. Liveable cities and urban underground space. Tunn. Undergr. Space Technol. 2016, 55, 8–20. [Google Scholar] [CrossRef]
- Nelson, P.P. A framework for the future of urban underground engineering. Tunn. Undergr. Space Technol. 2016, 55, 32–39. [Google Scholar] [CrossRef]
- Zhang, Z.; Paulsson, J.; Gong, J.; Huan, J.e. Legal Framework of Urban Underground Space in China. Sustainability 2020, 12, 8297. [Google Scholar] [CrossRef]
- Gantenbein, P. Traffic Infrastructure in Switzerland: Are We Ready for the Future? RICS-Impulse. 2016. Available online: https://edoc.unibas.ch/53131/ (accessed on 1 July 2024).
- Markvica, K.; Hu, B.; Prandtstetter, M.; Ritzinger, U.; Zajicek, J.; Berkowitsch, C.; Hauger, G.; Pfoser, S.; Berger, T.; Eitler, S. On the development of a sustainable and fit-for-the-future transportation network. Infrastructures 2018, 3, 23. [Google Scholar] [CrossRef]
- Visser, J.G. The development of underground freight transport: An overview. Tunn. Undergr. Space Technol. 2018, 80, 123–127. [Google Scholar] [CrossRef]
- Lee, H.S.; Zho, Y. Status and issues for underground space development in Singapore. Tunn. Undergr. Space 2018, 28, 304–324. [Google Scholar] [CrossRef]
- Wei, H.; Li, A.; Jia, N. Research on optimization and design of sustainable urban underground logistics network framework. Sustainability 2020, 12, 9147. [Google Scholar] [CrossRef]
- Xue, D.; Zhao, X.; Dong, J.; Ren, R.; Xu, Y.; Chen, Z. Critical Success Factors of Underground Logistics Systems from the Project Life Cycle Perspective. Buildings 2022, 12, 1979. [Google Scholar] [CrossRef]
- Zheng, C.; Zhao, X.; Shen, J. Research on location optimization of metro-based underground logistics system with Voronoi diagram. IEEE Access 2020, 8, 34407–34417. [Google Scholar] [CrossRef]
- Hu, H.; Wang, J. Research on the Design and Sustainable Evaluation of Metro-Based Underground Logistics Systems. IEEE Access 2023, 11, 67600–67612. [Google Scholar] [CrossRef]
- Zhan, J.; Li, T. Comparative research on intelligent optimization algorithm of urban underground logistics system. ICIC Express Lett. 2018, 12, 1041–1046. [Google Scholar]
- Ren, M.; Fan, Z.; Wu, J.; Zhou, L.; Du, Z. Design and optimization of underground logistics transportation networks. IEEE Access 2019, 7, 83384–83395. [Google Scholar] [CrossRef]
- Hu, W.; Dong, J.; Ren, R.; Chen, Z. Underground logistics systems: Development overview and new prospects in China. Front. Eng. Manag. 2023, 10, 354–359. [Google Scholar] [CrossRef]
- Gong, D.; Tian, J.; Hu, W.; Dong, J.; Chen, Y.; Ren, R.; Chen, Z. Sustainable Design and Operations Management of Metro-Based Underground Logistics Systems: A Thematic Literature Review. Buildings 2023, 13, 1888. [Google Scholar] [CrossRef]
- Cui, J.; Nelson, J.D. Underground transport: An overview. Tunn. Undergr. Space Technol. 2019, 87, 122–126. [Google Scholar] [CrossRef]


| Technology Topic | Period | Dataset | Reference |
|---|---|---|---|
| Blockchain | 1974–2021 | 6206 | [10] |
| Direct Seawater Electrolysis (DSE) | 1963–2022 | 138 | [11] |
| Photovoltaic Cells | 2004–2013 | 22,682 | [12] |
| 5G-V2X | 2014–2021 | 10,671 | [13] |
| AI and Wind Power | 1990–2022 | 2411 | [14] |
| Airless and Smart Tire | 1966–2022 | 47,998 | [15] |
| Traditional Chinese Medicine Prescriptions | 2001–2019 | 2962 | [16] |
| Sensors in Postharvest | All Period | 881 | [17] |
| ARD Green Inventory | 2001–2020 | 69,412 | [18] |
| Offshore LNG Storage and Transportation | 1969–2020 | 689 | [19] |
| Biological Water Treatment | 1967–2021 | 50,326 | [20] |
| Silicon Fen (SF) | 1999–2021 | 1140 | [21] |
| Research Question | Description | Methodology |
|---|---|---|
| Q1 | What are the detailed technology areas within the underground logistics system (ULS)? | TF-IDF, Topic Modeling, N-gram |
| Q2 | Which companies and research institutes lead patent applications for detailed technology areas and high-value technology areas that have a higher technology value than other areas? | Scientometrics, Portfolio Analytics, Bibliographic |
| Q3 | What is the potential for technological growth in specific high-value areas within the underground logistics system? | Technology Life Cycle |
| IPC or Technology Keyword | Description |
|---|---|
| Technology Keyword | Drilling, Mining, Tunneling (Tube), Underground |
| B60B | VEHICLE WHEELS; CASTORS; AXLES FOR WHEELS OR CASTORS; INCREASING WHEEL ADHESION |
| B60P | VEHICLES ADAPTED FOR LOAD TRANSPORTATION OR TO TRANSPORT, TO CARRY, OR TO COMPRISE SPECIAL LOADS OR OBJECTS |
| B65B | MACHINES, APPARATUS OR DEVICES FOR, OR METHODS OF, PACKAGING ARTICLES OR MATERIALS; UNPACKING |
| B65C | LABELLING OR TAGGING MACHINES, APPARATUS, OR PROCESSES |
| B65D | CONTAINERS FOR STORAGE OR TRANSPORT OF ARTICLES OR MATERIALS, e.g., BAGS, BARRELS, BOTTLES, BOXES, CANS, CARTONS, CRATES, DRUMS, JARS, TANKS, HOPPERS, FORWARDING CONTAINERS; ACCESSORIES, CLOSURES, OR FITTINGS THEREFOR; PACKAGING ELEMENTS; PACKAGES |
| B65G | TRANSPORT OR STORAGE DEVICES, e.g., CONVEYORS FOR LOADING OR TIPPING, SHOP CONVEYOR SYSTEMS OR PNEUMATIC TUBE CONVEYORS |
| B65H | HANDLING THIN OR FILAMENTARY MATERIAL, e.g., SHEETS, WEBS, CABLES |
| B66 | HOISTING; LIFTING; HAULING |
| G06Q | DATA PROCESSING SYSTEMS OR METHODS, SPECIALLY ADAPTED FOR ADMINISTRATIVE, COMMERCIAL, FINANCIAL, MANAGERIAL, SUPERVISORY OR FORECASTING PURPOSES; SYSTEMS OR METHODS SPECIALLY ADAPTED FOR ADMINISTRATIVE, COMMERCIAL, FINANCIAL, MANAGERIAL, SUPERVISORY OR FORECASTING PURPOSES, NOT OTHERWISE PROVIDED FOR [2006.01] |
| G07C | TIME OR ATTENDANCE REGISTERS; REGISTERING OR INDICATING THE WORKING OF MACHINES; GENERATING RANDOM NUMBERS; VOTING OR LOTTERY APPARATUS; ARRANGEMENTS, SYSTEMS OR APPARATUS FOR CHECKING NOT PROVIDED FOR ELSEWHERE |
| H04L | TRANSMISSION OF DIGITAL INFORMATION, e.g., TELEGRAPHIC COMMUNICATION |
| H04W | WIRELESS COMMUNICATION NETWORKS |
| Information | |
|---|---|
| Identified Region | AR, AT, AU, BE, BR, CA, CH, CL, CN, CO, CZ, DE, DK, EA, ES, FR, GB, GR, HK, HU, IE, IT, JP, KR, LU, MX, NL, NO, PL, RU, SE, SU, UA, US, WO, YU, ZA |
| Period | 1909∼2023 (Application Year) |
| Database | Google Patent DB |
| Number of Selected Data | 2022 |
| IPC | Number of Raw Data (%) | ULS Technology Keyword Data (%) | Data Selection Rate |
|---|---|---|---|
| B60B | 19,282 (10.2%) | 140 (6.9%) | 0.726% |
| B60P | 20,227 (10.7%) | 136 (6.7%) | 0.672% |
| B65B | 11,910 (6.3%) | 270 (13.4%) | 2.267% |
| B65C | 11,154 (5.9%) | 268 (13.3%) | 2.403% |
| B65D | 9074 (4.8%) | 294 (114%) | 3.240% |
| B65G | 8129 (12%) | 283 (14.0%) | 3.481% |
| B65H | 5860 (3.1%) | 61 (3.0%) | 1.041% |
| B66 | 29,301 (15.5%) | 122 (6.0%) | 0.416% |
| G06Q | 21,544 (11.4%) | 112 (5.5%) | 0.520% |
| G07C | 18,526 (9.8%) | 100 (4.9%) | 0.540% |
| H04L | 17,392 (9.2%) | 106 (5.2%) | 0.609% |
| H04W | 16,635 (8.8%) | 130 (6.4%) | 0.781% |
| Total | 189,034 (100%) | 2022 (100%) | 1.06% |
| Patent Number | IPC | Application Year | Title |
|---|---|---|---|
| US1076737A | B65G | 1909 | Pneumatic-dispatch-tube system |
| DE387804C | B66B | 1923 | Equipment for loading the vessels and processing of the conveyed material underground |
| DE507903C | B65G | 1927 | Conveyor belt for underground operation in mines with an arrangement of the drive in the lower belt run between the end reversing rollers |
| DE497092C | B65G | 1928 | Conveyor belt for the simultaneous conveyance of goods in both directions, especially for underground operations |
| DE507904C | B65G | 1928 | Conveyor belt that can be laid in horizontal curves for underground operation |
| Patent Number | ULS Relevance |
|---|---|
| US1076737A | Pneumatic tubes are a basic technology for transporting goods through enclosed tubes. Modern ULS might utilize similar concepts for specific applications (Possibly Relevant). |
| DE387804C | This patent deals with underground material handling, a core function of ULS (Likely Relevant). |
| DE507903C | Conveyor belts are a fundamental technology for ULS, especially for bulk material transport (Possibly Relevant). |
| DE497092C | Bidirectional conveyor belts are useful for ULS where efficient movement in both directions is required (Possibly Relevant). |
| DE507904C | Flexible conveyor belts that can navigate curves could be valuable for complex ULS networks (Possibly Relevant). |
| Technology Keyword | Specific Topic | Average Value of Other Topics | Log Ratio |
|---|---|---|---|
| administration | 0.000431 | 0.00138 | 1.68 |
| ago | 0.00107 | 0.000842 | −0.339 |
| agreement | 0.000671 | 0.00104 | 0.630 |
| aid | 0.0000476 | 0.00105 | 136 |
| air | 0.00214 | 0.000297 | −2.85 |
| american | 0.00203 | 0.00168 | −0.270 |
| analysts | 0.00109 | 0.000000578 | −10.9 |
| area | 0.00137 | 0.000231 | −2.57 |
| army | 0.000262 | 0.00105 | 2.00 |
| asked | 0.000189 | 0.00156 | 3.05 |
| TF-IDF Score | |
|---|---|
| Max | 151.4535 |
| Q3 | 10.60657 |
| Median | 5.349762 |
| Q1 | 3.546848 |
| Min | 1.066552 |
| Technical Keyword | TF-IDF Index |
|---|---|
| ‘system’, ‘storag’, ‘method’, ‘mine’, ‘conveyor’, ‘devic’, ‘oper’, ‘coal’, ‘base’, ‘water’, ‘tank’, ‘monitor’, ‘belt’, ‘mud’, ‘pipe’, ‘manag’, ‘posit’, ‘irrigation’, ‘facil’, ‘chain’, ‘cabl’, ‘transport’, ‘gas’, ‘crop’, ‘control’, ‘network’, ‘convey’, ‘communic’, ‘wireless’, ‘equip’, ‘scraper’, ‘construct’, ‘especi’, ‘detect’, ‘line’, ‘intellig’, ‘pipelin’, ‘materi’, ‘autonomous’, ‘power’, ‘station’, ‘machin’, ‘vehicl’, ‘galleri’, ‘structur’, ‘space’, ‘particular’, ‘reservoir’, ‘safeti’, ‘process’, ‘liquid’, ‘distribut’, ‘work’, ‘urban’, ‘inform’, ‘data’, ‘cavern’, ‘tunnel’, ‘locat’, ‘park’, ‘store’, ‘drive’, ‘type’, ‘instal’, ‘evalu’, ‘risk’, ‘sensor’, ‘contain’, ‘logist’, ‘driving’, ‘area’, ‘caviti’, ‘fluid’, ‘transmiss’, ‘oil’, ‘predict’, ‘operations’, ‘warn’, ‘util’, ‘pollut’, ‘void’, ‘rock’, ‘product’, ‘medium’, ‘garag’, ‘environ’, ‘bottom’, ‘wall’, ‘engin’, ‘automat’, ‘mobil’, ‘load’, ‘build’, ‘roller’, ‘remot’, ‘assembl’, ‘inspect’, ‘seal’, ‘protect’, ‘repeater’, ‘lay’, ‘support’, ‘bunker’, ‘measur’, ‘earli’, ‘and’, ‘comprehens’, ‘applic’, ‘prevent’, ‘electr’, ‘personnel’, ‘assess’, ‘energi’, ‘pressur’, ‘spiral’, ‘optim’, ‘technolog’, ‘pneumat’, ‘model’, ‘integr’, ‘face’, ‘ore’, ‘map’, ‘provid’, ‘analysi’, ‘fault’, ‘combin’, ‘bit’, ‘vault’, ‘leakag’, ‘chute’, ‘excav’, ‘hydraul’, ‘survey’, ‘vessel’, ‘termin’, ‘robot’, ‘suitabl’, ‘uwb’, ‘hydrocarbon’, ‘realtim’, ‘time’, ‘determin’, ‘platform’, ‘ground’, ‘mechan’, ‘level’, ‘storage’, ‘transfer’, ‘air’, ‘realiti’, ‘lot’, ‘track’, ‘deliveri’, ‘link’, ‘identif’, ‘format’, ‘drill’, ‘bulk’, ‘section’, ‘radio’, ‘mainten’, ‘slide’, ‘charg’, ‘soil’, ‘wire’, ‘qualiti’, ‘chamber’, ‘mean’, ‘connect’, ‘signal’, ‘navig’, ‘servic’, ‘wind’, ‘flow’, ‘roadway’, ‘sump’, ‘discharg’, ‘acquisit’, ‘arrang’, ‘unload’, ‘emerg’, ‘command’, ‘make’, ‘improvement’, ‘calcul’, ‘run’, ‘compress’, ‘form’, ‘good’, ‘comput’, ‘thing’, ‘cover’, ‘move’, ‘doubl’, ‘bim’, ‘railway’, ‘car’, ‘threedimension’, ‘visual’, ‘fill’, ‘continu’, ‘guid’, ‘field’, ‘sens’, ‘suppli’, ‘lock’, ‘site’ | X > 10.6 |
| Topic | T1 | T2 | T3 | T4 | T5 | T6 |
|---|---|---|---|---|---|---|
| Max | −0.30 | −0.30 | −0.20 | −0.08 | −0.18 | −0.35 |
| Q3 | −1.10 | −0.89 | −0.73 | −0.49 | −0.70 | −1.59 |
| Median | −2.33 | −2.25 | −1.83 | −1.30 | −1.56 | −2.81 |
| Q1 | −5.14 | −143 | −100 | −3.18 | −144 | −8.26 |
| Min | −253.6 | −831.9 | −58.66 | −4712 | −61.70 | −1048 |
| Topic | Discriminatory Technology Keyword | Selected 3 Identified Tokens | Patent Data (%) |
|---|---|---|---|
| Topic 1 | drive, run | ‘conveyor chain drive’, ‘chain drive mechanisms’, ‘lower belt run’ | 389 (17.7%) |
| Topic 2 | operations, mud | ‘underground mining operations’, ‘lot shutdown operations’, ‘mud risk evaluating’ | 315 (112%) |
| Topic 3 | crop, irrigation | ‘crop irrigation system’, ‘crop store consists’, ‘root crop store’ | 349 (15.8%) |
| Topic 4 | autonomous, driving | ‘autonomous federated learning’, ‘driving risk assessment’, ‘road driving device’ | 396 (18.0%) |
| Topic 5 | bottom, void | ‘cave depot bottom’, ‘void space occupied’, ‘bottom funnel bunker’ | 334 (15.2%) |
| Topic 6 | repeater, wireless | ‘network integrated repeater’, ‘relay wireless repeater’, ‘integrated repeater system’ | 419 (19.0%) |
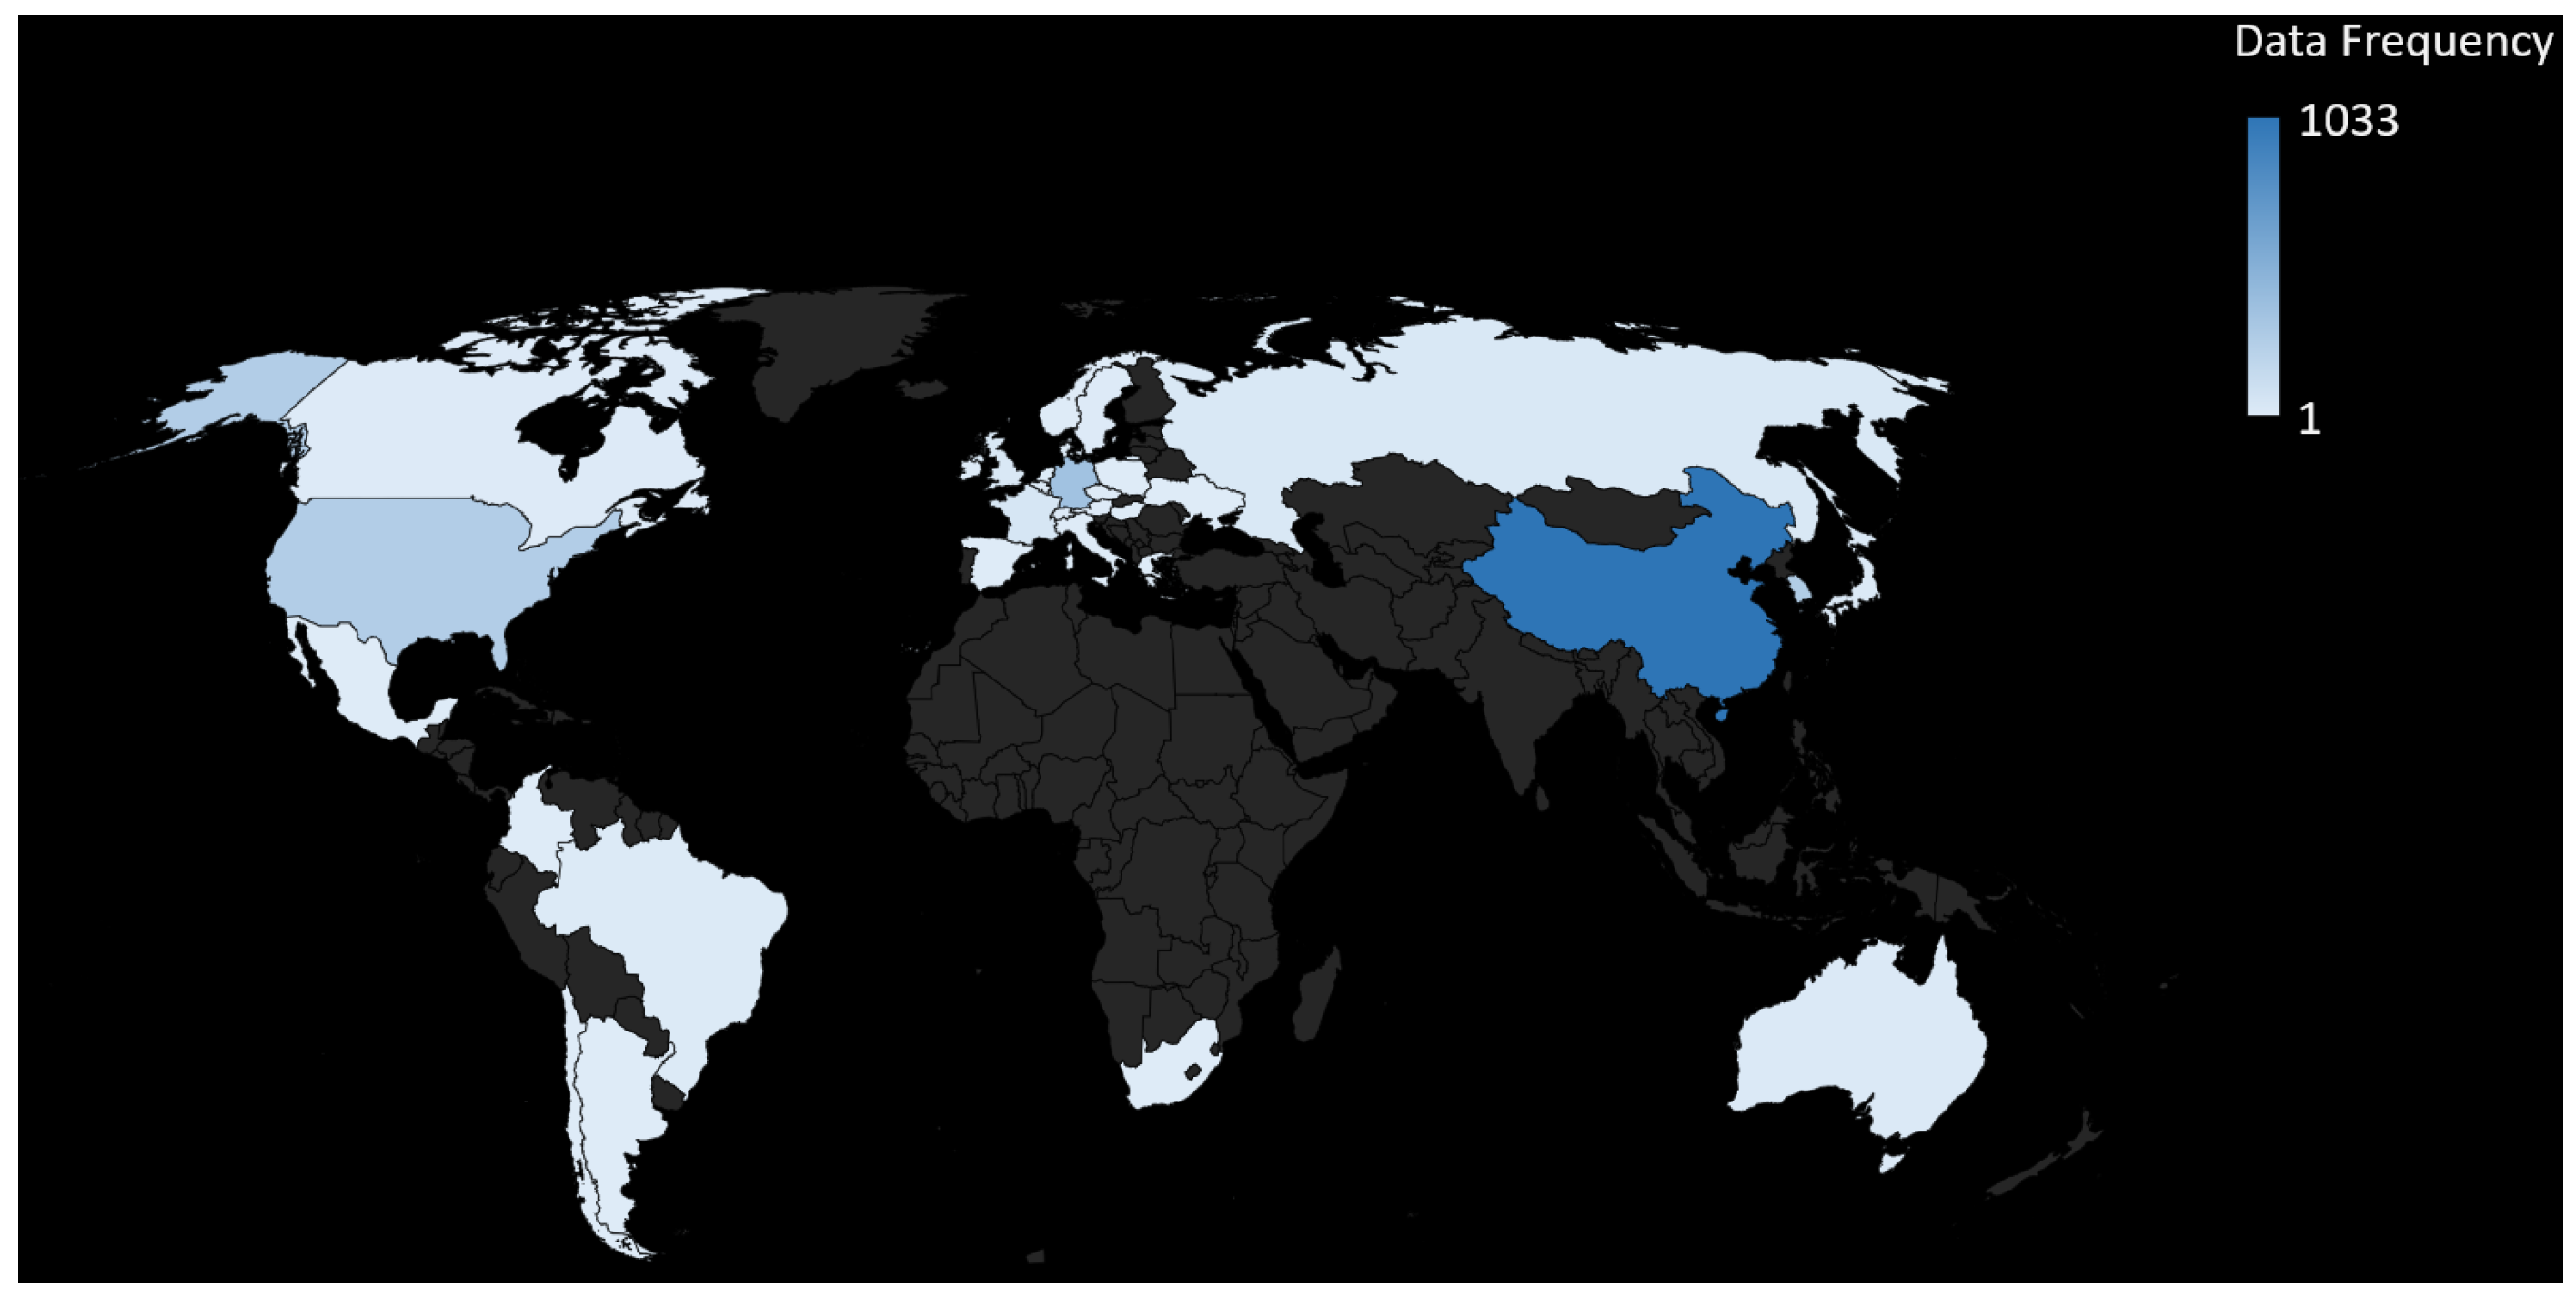
| Rank | Country | Abbreviation | Patent Data (%) |
|---|---|---|---|
| 1 | China | CN | 1033 (46.9%) |
| 2 | Germany | DE | 357 (16.2%) |
| 3 | South Korea | KR | 266 (12.1%) |
| 4 | United States | US | 259 (11.8%) |
| 5 | France | FR | 47 (2.1%) |
| 6 | Russia | RU | 30 (1.4%) |
| 6 | United Kingdom | GB | 30 (1.4%) |
| 7 | Japan | JP | 18 (0.8%) |
| 7 | Australia | AU | 18 (0.8%) |
| 8 | Brazil | BR | 10 (0.5%) |
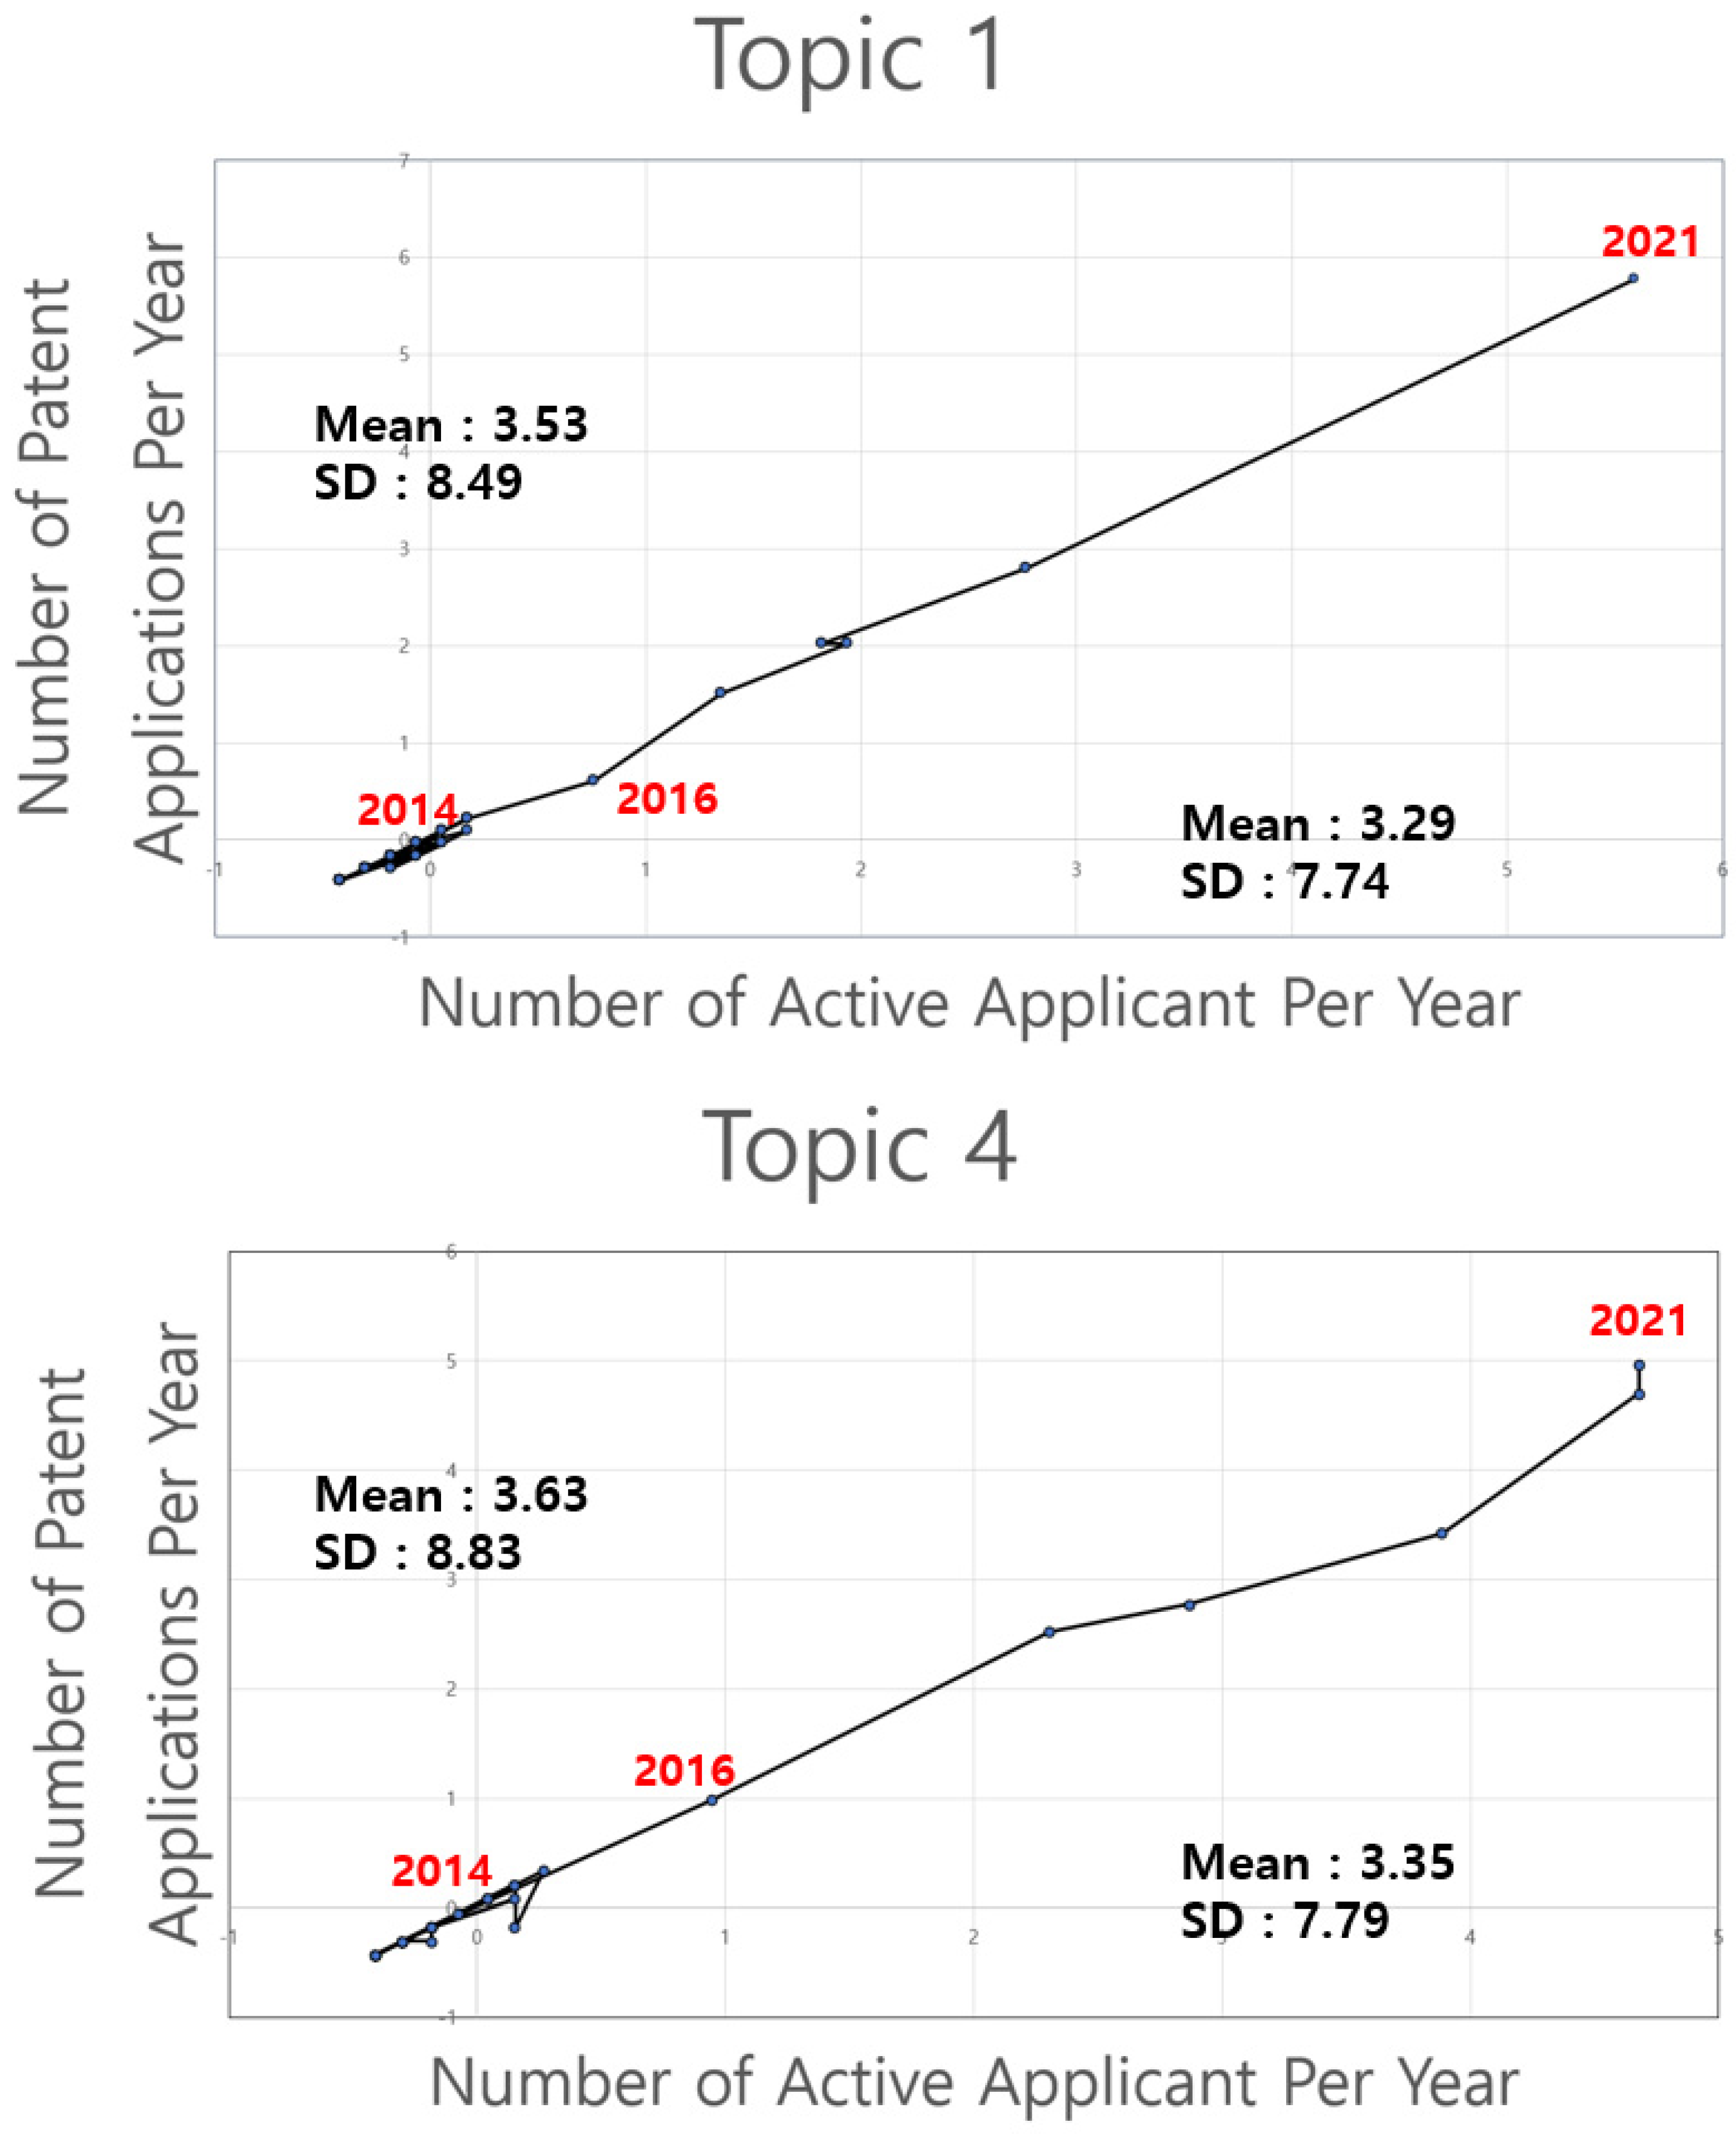
| Topic | TAP | Cagr | Share | Time | AI | VR |
|---|---|---|---|---|---|---|
| T1 | 0.305 | 1 | 1 | 0.838 | 1 | 1 |
| T2 | 0.756 | 0.312 | 0 | 1 | 0.494 | 3 |
| T3 | 0 | 0.05 | 0.319 | 0.081 | 0 | 6 |
| T4 | 1 | 0.921 | 0.787 | 0.662 | 0.742 | 2 |
| T5 | 0.272 | 0.306 | 0.191 | 0 | 0.513 | 5 |
| T6 | 0.088 | 0 | 0.723 | 0.706 | 0.696 | 4 |
| Min | 13.8 | 0.015 | 0.143 | 0.001664 | 0.69 | |
| Max | 17.33 | 0.17 | 0.19 | 0.00191 | 1.21 |
| Topic Area | Description | Selected Patent (Patent Number) | Key Innovation |
|---|---|---|---|
| Underground Material Handling (Topic 1) | Systems for transporting materials within underground mines | Coal face underground mine conveyor chain drive assembly (DE19616458A1) | Improved design for conveyor chain drives used in underground mines |
| A kind of underground coal mine belt-conveying dewatering system and belt conveyor (CN106219190A) | Integrated system for dewatering (removing water) from belt conveyors | ||
| A kind of downhole intelligent belt conveyor system suitable for underground coal mine (CN109533865A) | Intelligent belt conveyor system with enhanced capabilities for underground mines | ||
| Automatic belt frame extending device of coal mine tunnel conveyor and underground tunnel driving working face transportation system (CN115477125A) | Scalable material handling system for underground tunnels | ||
| Method, system, equipment and medium for controlling underground coal mine belt conveyor system (CN114671213B) | Advanced control system for underground belt conveyors | ||
| Underground Transportation (Topic 4) | Systems for transporting personnel and equipment within underground mines | Positioning device and method for coal mine underground transportation robot (CN111417069A) | Uses Ultra-Wideband (UWB) technology for precise positioning of underground robots |
| TOA underground person positioning system and method (CN104333905A) | Accurate personnel positioning system even in Non-Line-of-Sight (NLOS) situations | ||
| Uwb technology-based attitude self-correcting underground transportation device (CN113766418B) | Self-correcting navigation system for underground transportation devices using UWB | ||
| Detachable sharing express delivery device and sharing method for underground road or pipeline transportation (CN113989994B) | Express delivery system specifically designed for underground transportation networks | ||
| Communication node arrangement method for underground rescue robot (CN106781370B) | Optimized placement of communication nodes for underground rescue robots to improve communication in challenging environments |
| Patent Number (Topic) | Technical Effects (Token Relevance) |
|---|---|
| DE19616458A1(1) | It improves the underground coal mine conveyor chain drive assembly (‘conveyor chain drive’, ‘chain drive mechanisms’). |
| CN106219190A (1) | This technology offers a novel dewatering solution for underground coal mine conveyor systems. (‘conveyor chain drive’). |
| CN109533865A (1) | An intelligent belt conveyor system specifically designed for underground coal mines (‘conveyor chain drive’, ‘chain drive mechanisms’). |
| CN115477125A (1) | Automatic belt frame expansion technology streamlines transportation in coal mine tunnels and underground work surfaces. (‘conveyor chain drive’, ‘chain drive mechanisms’). |
| CN114671213B (1) | This comprehensive technology controls the entire underground coal mine conveyor system. (‘chain drive mechanisms’, ‘lower belt run’). |
| CN111417069A (4) | Improves the accuracy of positioning for underground transportation robots using UWB technology, leading to safer and more efficient navigation (‘autonomous federated learning’). |
| CN104333905A (4) | Provides a method for accurate underground personnel positioning, especially in situations where there’s no direct line of sight (NLOS), which is essential for worker safety and avoiding collisions (‘driving risk assessment’). |
| CN113766418B (4) | Utilizes UWB technology to allow underground transportation devices to self-correct their navigation, ensuring smoother and safer operation (‘autonomous federated learning’). |
| CN113989994B (4) | Introduces a new concept for an express delivery system designed specifically for underground transportation networks, featuring detachable and shareable components (‘road driving device’). |
| CN106781370B (4) | Addresses communication challenges in underground environments by proposing a method for optimal placement of communication nodes for rescue robots, enabling better emergency response (‘road driving device’). |
| Rank | Applicant | Country | Patent Data (%) |
|---|---|---|---|
| 1 | Gutehoffnungshuette Sterkrade | DE | 15 (3.9%) |
| 2 | China Coal Technology & Engineering Group | CN | 12 (3.1%) |
| 3 | China University of Mining and Technology | CN | 10 (2.6%) |
| 4 | Siemag Masch Stahlbau | DE | 9 (2.3%) |
| 5 | Hauhinco Maschf | DE | 8 (2.1%) |
| 6 | Certusview Technologies, LLC | US | 6 (1.5%) |
| 6 | Dbt Gmbh | DE | 6 (1.5%) |
| 6 | Demag Ag | DE | 6 (1.5%) |
| 7 | Phillips Petroleum Co | US | 5 (1.3%) |
| 8 | Chahoo | KR | 4 (1.0%) |
| Period | CN | DE | KR | US |
|---|---|---|---|---|
| –1988 | 0 | 42 | 0 | 25 |
| 1989–1993 | 0 | 0 | 0 | 9 |
| 1994–1998 | 0 | 4 | 0 | 6 |
| 1999–2003 | 1 | 2 | 1 | 2 |
| 2004–2008 | 0 | 1 | 1 | 4 |
| 2009–2013 | 2 | 1 | 9 | 3 |
| 2014–2018 | 43 | 0 | 11 | 8 |
| 2019–2023 | 146 | 0 | 11 | 7 |
| Rank | Applicant | Country | Patent Data (%) |
|---|---|---|---|
| 1 | Certusview Technologies, LLC | US | 9 (2.3%) |
| 1 | Anhui University of Science and Technology | CN | 9 (2.3%) |
| 2 | China University of Mining and Technology | CN | 8 (2.0%) |
| 3 | Hu’Nan Guoao Electric Power Equipment Co., Ltd. | CN | 6 (1.5%) |
| 3 | Dimine | CN | 5 (1.3%) |
| 4 | Demag Ag | DE | 4 (1.0%) |
| 4 | Dbt Gmbh | DE | 4 (1.0%) |
| 4 | ChinaMTA | CN | 3 (0.8%) |
| 4 | Smart Geotech | KR | 3 (0.8%) |
| 4 | Siemag Masch Stahlbau | DE | 3 (0.8%) |
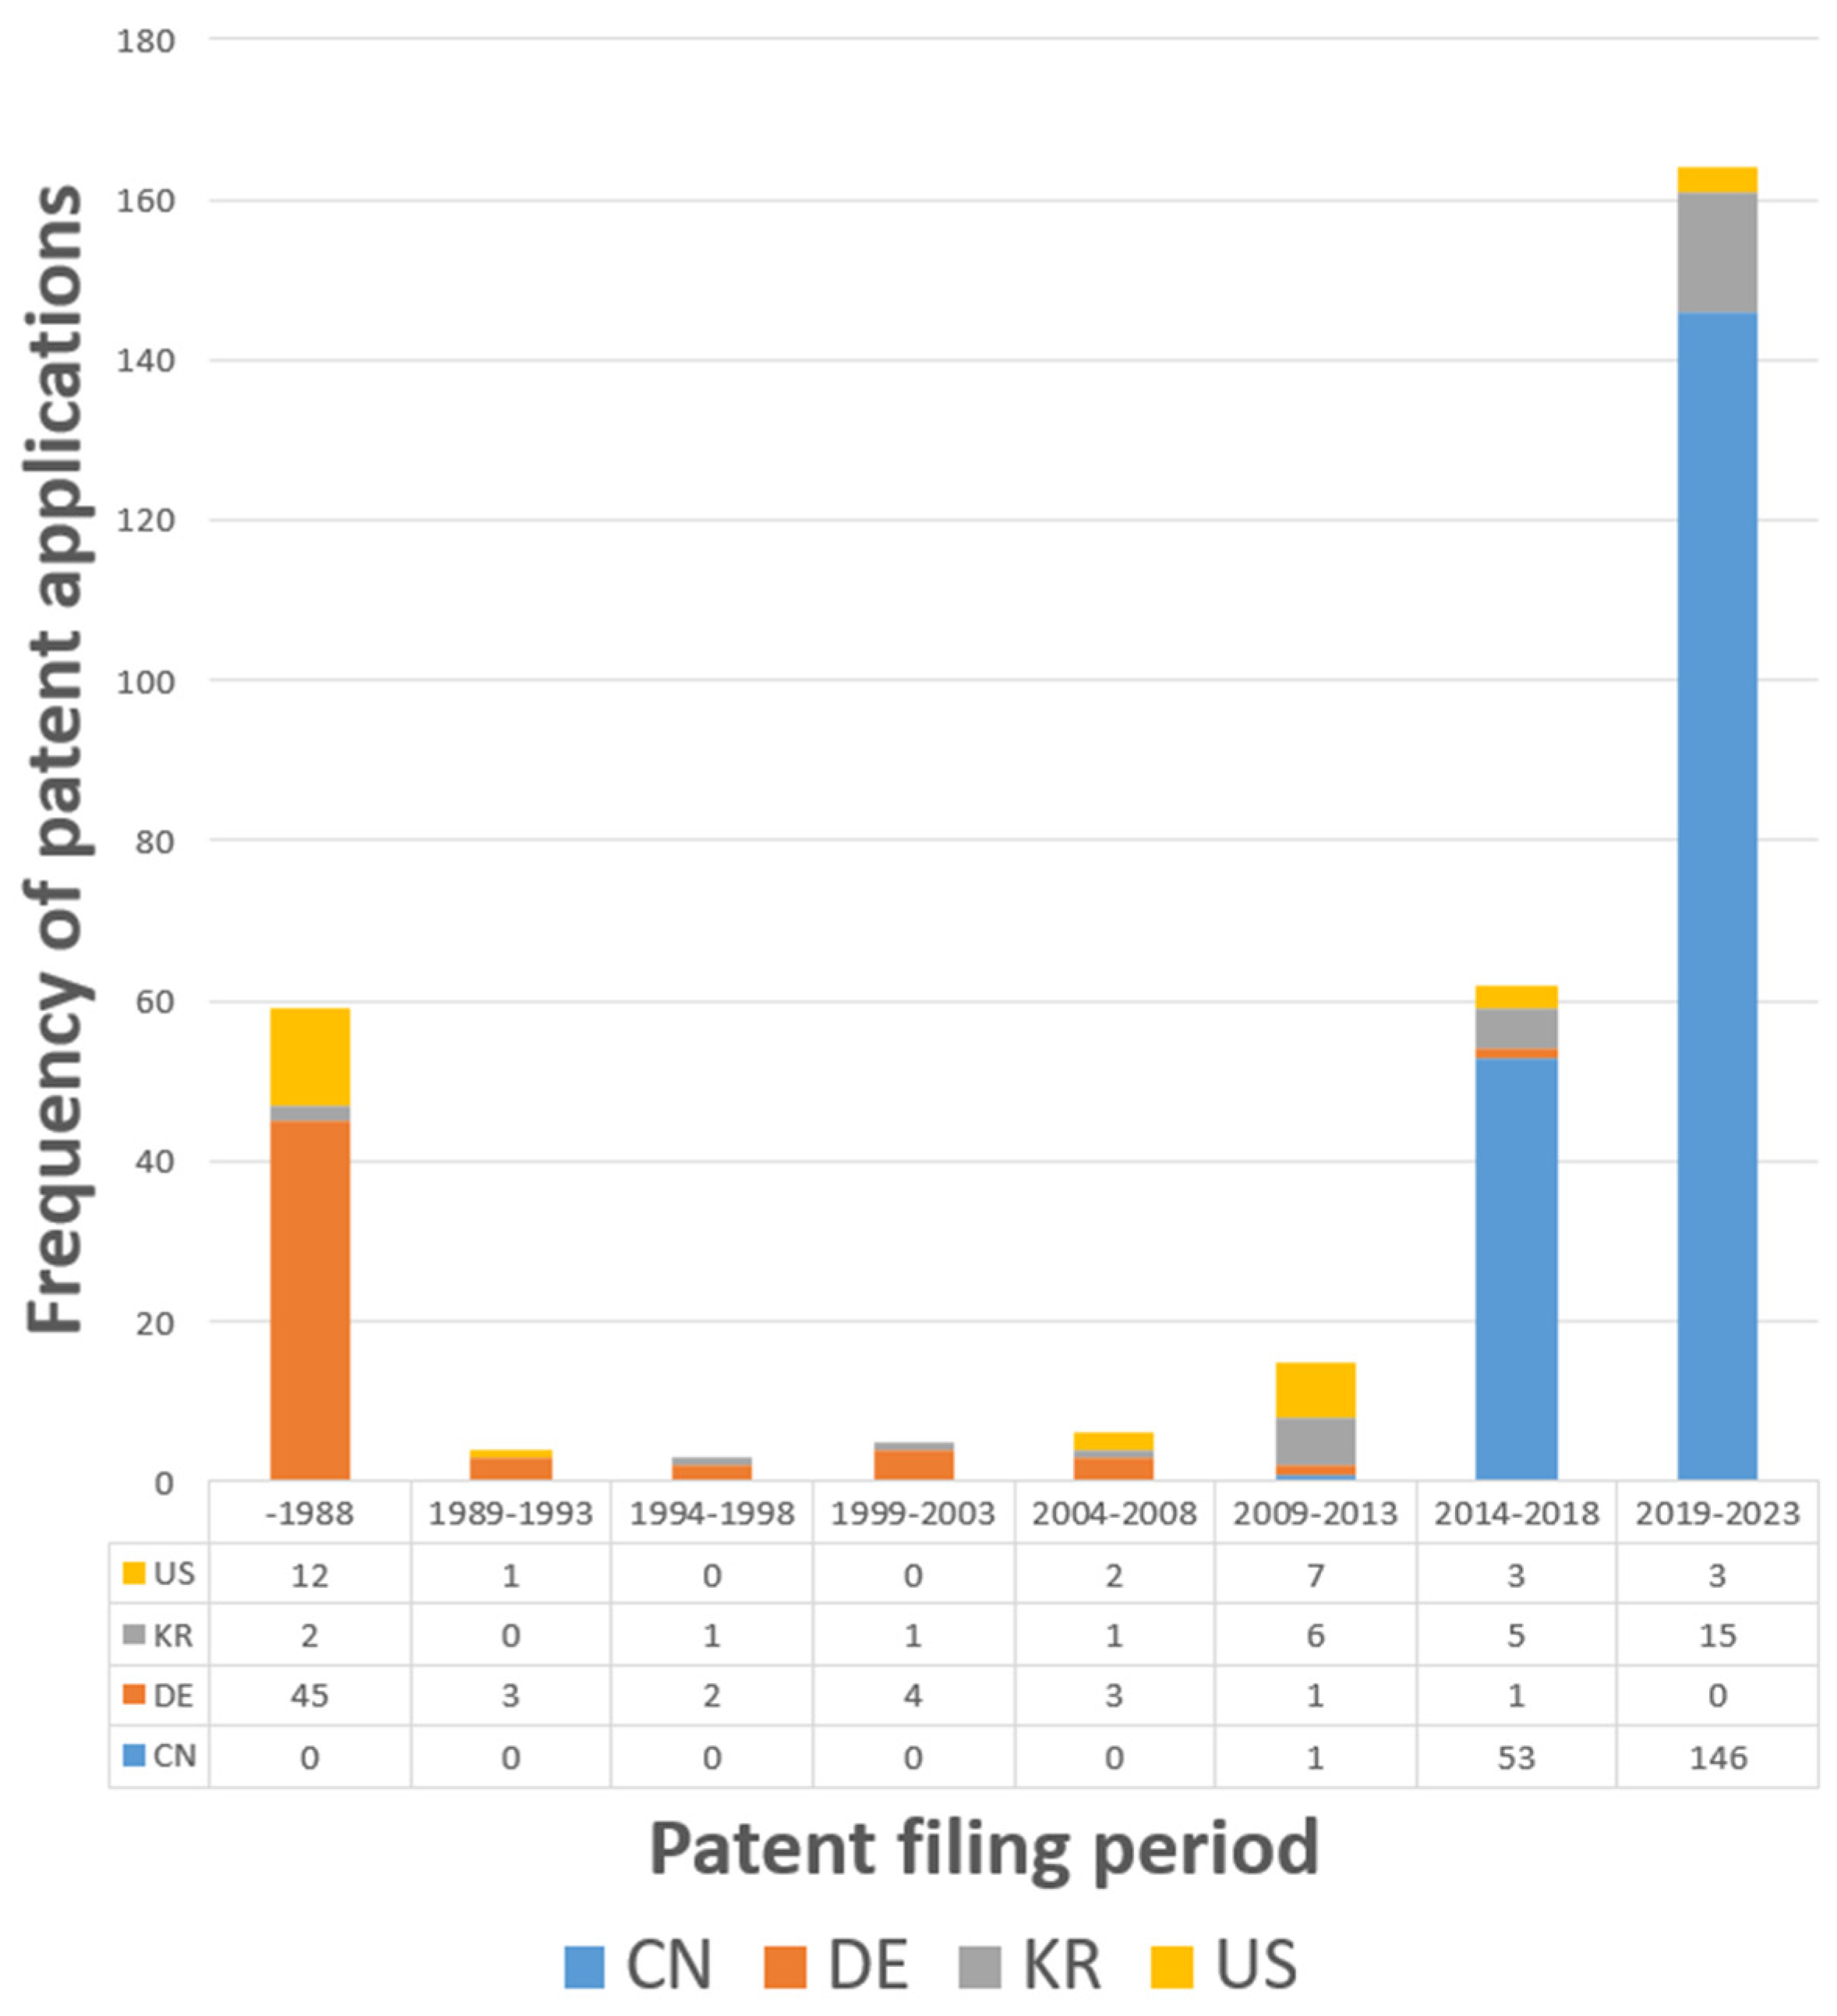
| Period | CN | DE | KR | US |
|---|---|---|---|---|
| –1988 | 0 | 45 | 2 | 12 |
| 1989–1993 | 0 | 3 | 0 | 1 |
| 1994–1998 | 0 | 2 | 1 | 0 |
| 1999–2003 | 0 | 4 | 1 | 0 |
| 2004–2008 | 0 | 3 | 1 | 2 |
| 2009–2013 | 1 | 1 | 6 | 7 |
| 2014–2018 | 53 | 1 | 5 | 3 |
| 2019–2023 | 146 | 0 | 15 | 3 |
| Term | Proposed Technology Roadmap |
|---|---|
| Short-term (1–3 years) | Focus on the refinement and optimization of existing technologies within Topic 1 (Underground Material Handling System) and Topic 4 (Underground Transportation System). This includes advancing conveyor systems, optimizing chain drive mechanisms, developing more sophisticated autonomous driving capabilities, and enhancing driving risk assessment algorithms. |
| Medium-term (3–5 years) | Invest in research and development to accelerate the transition of Topic 1 and Topic 4 technologies from the growth phase to the maturity phase. This involves fostering collaboration between industry and academia to address technical challenges, standardize solutions, and reduce costs. |
| Long-term (5–10 years) | Explore the potential of emerging technologies, such as artificial intelligence, blockchain, and robotics, to further enhance the efficiency, safety, and sustainability of ULS. Investigate the feasibility of integrating ULS with other urban infrastructure systems, such as energy grids and waste management systems, to create a more holistic and interconnected urban environment. |
| Contribution to ULS Development | Description |
|---|---|
| Identifying Key Technology Areas | The six topics we found represent different technological components of ULS. This gives developers a clear roadmap of the most important areas to focus on. |
| Prioritizing Research and Development | The analytics showed that Topic 1 (Underground Material Handling) and Topic 4 (Underground Transportation) are high-value areas. This suggests that investing in these areas could have a bigger impact on advancing ULS technology. |
| Understanding the Competitive Landscape | By looking at who is patenting in these areas (e.g., companies from China, the US, Korea), developers can understand who their main competitors are and where innovation is happening. |
| Predicting Future Trends | The technology life cycle analytics suggests that Topic 1 and Topic 4 are in the growth phase, meaning we can expect to see more development and innovation in these areas in the coming years. |
| Research Area | Existing Literature | This Study’s Contributions | References |
|---|---|---|---|
| ULS Technologies | Focus on specific technologies (material handling, transportation) in isolation, limited integration of different ULS components. | Comprehensive analytics of interdependencies between ULS technologies, identification of key technologies driving ULS potential (material handling, transportation). | [1,116,117,118] |
| ULS Implementation | SWOT/PEST analytics for specific countries (China), case studies on individual projects (CST in Switzerland), limited focus on policy impacts beyond individual projects. | Cross-country policy review highlighting common themes (government support, private sector participation), analytics of policy impact on high-value-added technology areas. | [106,116,119,120] |
| ULS Challenges | Identification of general challenges (cost, management, regulation), limited discussion of technology’s role in overcoming challenges. | Specific focus on technological solutions for ULS challenges (automation for human resources, integrated systems for management), highlighting the transformative potential of technology. | [2,116,121,122] |
| ULS Potential | Emphasis on specific use cases (warehouses, transportation), limited exploration of broader urban development impacts. | Broader vision for ULS integration into sustainable city development, connection to concepts like Multi-Utility Tunnels (MUTs) and urban resilience. | [2,106,116,123,124] |
Disclaimer/Publisher’s Note: The statements, opinions and data contained in all publications are solely those of the individual author(s) and contributor(s) and not of MDPI and/or the editor(s). MDPI and/or the editor(s) disclaim responsibility for any injury to people or property resulting from any ideas, methods, instructions or products referred to in the content. |
© 2024 by the authors. Licensee MDPI, Basel, Switzerland. This article is an open access article distributed under the terms and conditions of the Creative Commons Attribution (CC BY) license (https://creativecommons.org/licenses/by/4.0/).
Share and Cite
Youn, S.J.; Lee, Y.-J.; Han, H.-E.; Lee, C.-W.; Sohn, D.; Lee, C. A Data Analytics and Machine Learning Approach to Develop a Technology Roadmap for Next-Generation Logistics Utilizing Underground Systems. Sustainability 2024, 16, 6696. https://doi.org/10.3390/su16156696
Youn SJ, Lee Y-J, Han H-E, Lee C-W, Sohn D, Lee C. A Data Analytics and Machine Learning Approach to Develop a Technology Roadmap for Next-Generation Logistics Utilizing Underground Systems. Sustainability. 2024; 16(15):6696. https://doi.org/10.3390/su16156696
Chicago/Turabian StyleYoun, Seok Jin, Yong-Jae Lee, Ha-Eun Han, Chang-Woo Lee, Donggyun Sohn, and Chulung Lee. 2024. "A Data Analytics and Machine Learning Approach to Develop a Technology Roadmap for Next-Generation Logistics Utilizing Underground Systems" Sustainability 16, no. 15: 6696. https://doi.org/10.3390/su16156696
APA StyleYoun, S. J., Lee, Y.-J., Han, H.-E., Lee, C.-W., Sohn, D., & Lee, C. (2024). A Data Analytics and Machine Learning Approach to Develop a Technology Roadmap for Next-Generation Logistics Utilizing Underground Systems. Sustainability, 16(15), 6696. https://doi.org/10.3390/su16156696