Article

Long-Term Variation Patterns of Precipitations Driven by Climate Change in China from 1901 to 2022

1
School of Space Science and Physics, Shandong University, Weihai 264200, China
2
Key Laboratory of Remote Sensing of Gansu Province, Heihe Remote Sensing Experimental Research Station, Northwest Institute of Eco-Environment and Resources, Chinese Academy of Sciences, Lanzhou 730000, China
3
School of Civil Engineering and Geomatics, Shandong University of Technology, Zibo 255000, China
4
Zibo Natural Resources and Planning Bureau, Zibo 255000, China
*
Authors to whom correspondence should be addressed.
Sustainability 2024, 16(17), 7283; https://doi.org/10.3390/su16177283 (registering DOI)
Submission received: 27 June 2024 / Revised: 21 August 2024 / Accepted: 22 August 2024 / Published: 24 August 2024
(This article belongs to the Special Issue Changes in Atmospheric Environment)

Abstract

:
Studying long-term precipitation trends is crucial for sustainable development, as the proper utilization of water resources is essential for maintaining a sustainable water supply. The objective and novelty of this paper was to reveal the gradual mutation process of precipitation in China over a century. This study utilized monthly precipitation data from 1901 to 2022 (at a century scale) to analyze and explore the spatiotemporal variability in precipitation across different time scales and regions with a trend analysis, an abrupt change analysis, and gravity center models. The findings indicate that (1) from 1901 to 2022, the precipitation in China generally decreased from the southeast coastal areas toward the northwest inland regions. (2) There were significant differences in the migration of precipitation gravity centers among the different study regions, with the least dispersion being observed in the Liao River basin, while the Hai River basin, various river basins in the northwest, and the Pearl River basin exhibited certain regularities in gravity center movement, and other regions showed periodic variations. (3) Over the period from 1901 to 2022, there was a trend of transitioning from lower to higher precipitation levels. (4) According to continuous long-term abrupt change tests, the timing of precipitation shifts varied across different basins. Precipitation, as a crucial component of natural resources, directly impacts various aspects of socio-economic life. Research findings provide decision support for regional flood control and disaster reduction and offer scientific decisions for ecological security.

1. Introduction

Under the influence of global warming, the spatial and temporal distribution patterns of precipitation have already undergone significant changes. Precipitation is an important factor affecting regional water cycles, water ecology, and social and economic development [1]. The chain of climate anomalies caused by global warming has become one of the most serious challenges in the world [2]. Precipitation is an important indicator for measuring the climate characteristics of a region, which can greatly affect human production activities and the social economy. Studies indicate that global warming is significantly enhancing the Earth’s water cycle. Since the 1950s, global precipitation has substantially increased, yet areas receiving less than 200 mm of annual rainfall have seen a decline. Concurrently, extreme weather events, including intense heat, droughts, and floods, are dramatically on the rise. China, with its distinctive geography and expansive territory, is situated adjacent to the Pacific and near the Indian Ocean. Its vast expanse from east to west and north to south makes it highly vulnerable to the impacts of global warming [3]. In the past half-century, the climate of China has also undergone significant changes. Due to China’s vast territory and significant climate differences in different regions, the national precipitation changes have shown an extremely complex pattern [4]. Studying long-term precipitation trends is beneficial for helping us understand precipitation patterns, providing crucial decision support for regional flood control and disaster reduction, promoting regional economic development, safeguarding ecological security, and holding significant importance for sustainable development. Therefore, in-depth research, analysis, and prediction of the temporal and spatial changes in precipitation throughout the country provide indispensable technological support for key work such as water environment analysis and the restoration of water ecology [5].
In recent years, many studies have adopted statistical analysis methods to analyze the spatiotemporal changes in precipitation in various regions. For example, Yang et al. [6] proposed a dynamic weighted ensemble forecasting method based on dynamic statistical forecasting methods for the prediction of summer precipitation in China. Liu et al. [7] investigated the spatiotemporal characteristics of precipitation concentration in China based on daily precipitation data from 773 meteorological stations around the country from 1960 to 2017 by using the precipitation concentration degree. Wang et al. [8] used the Gumbel linear moment fitting method and the k-means algorithm to quantify the short-term heavy rainfall levels in three regions. Hu et al. [9] selected hot regions in China using climate zoning methods and analyzed the characteristics of interannual and decadal climate change from 1961 to 2015. Lu et al. [10] comprehensively analyzed the spatiotemporal distribution and variation characteristics of extreme precipitation events in China and various regions based on daily precipitation data from 1961 to 2016. Deng et al. [11] analyzed the spatiotemporal patterns of diurnal precipitation changes in nine major river basins in China based on precipitation observation data from 1961 to 2016. Zhao et al. [12] studied the dynamic characteristics of rainfall and groundwater in Jinan through methods such as the moving average, STL time-series decomposition, and the Mann–Kendall trend test. Oliver [13] and Michels et al. [14] defined the precipitation concentration index (PCI) based on monthly precipitation data, and then defined the precipitation concentration degree (PCD) based on the vector expression of the time distribution of annual precipitation. Martin Vede [15] defined the concentration index (CI) for precipitation based on daily precipitation data. Kong et al. [16] analyzed the connotations and extensions of the current definition of extreme precipitation and the characteristics of threshold definitions and diagnostic statistical methods. Many scholars have also employed machine learning methods to analyze precipitation data. Liu et al. [17] analyzed the co-evolution characteristics of precipitation and temperature in China based on the MK test, wavelet analysis, and the RClimDex extreme temperature index method. He et al. [18] proposed a multi-source remote sensing daily precipitation data fusion method based on the random forest model. Zhang et al. [19] deeply explored the possible mechanism of the influence of spring Arctic sea ice change on summer precipitation in China. However, most of the current studies chose the 1950s as the starting point and focused on the temporal and spatial variations in the gradual process of precipitation and fewer studies on the mutation process have been reported. Moreover, due to significant climate and terrain differences in China, it was urgent to reveal the spatiotemporal differentiation patterns of precipitation in different sub-regions. In addition, the transfer process between different precipitation levels is not intuitive, and research at the century scale still needs further discussion.
Based on China’s monthly precipitation from 1901 to 2022, this research utilized the center of gravity and mutation analysis models to explore the spatial distribution and temporal variation in precipitation across various regions and historical periods in China. The findings offer crucial insights for decision-making in the prevention of natural disasters such as floods and droughts. The objective and novelty of this paper was to reveal the spatiotemporal variations in the gradual mutation process of precipitation at a century scale across different time scales and regions.

2. Materials and Methods
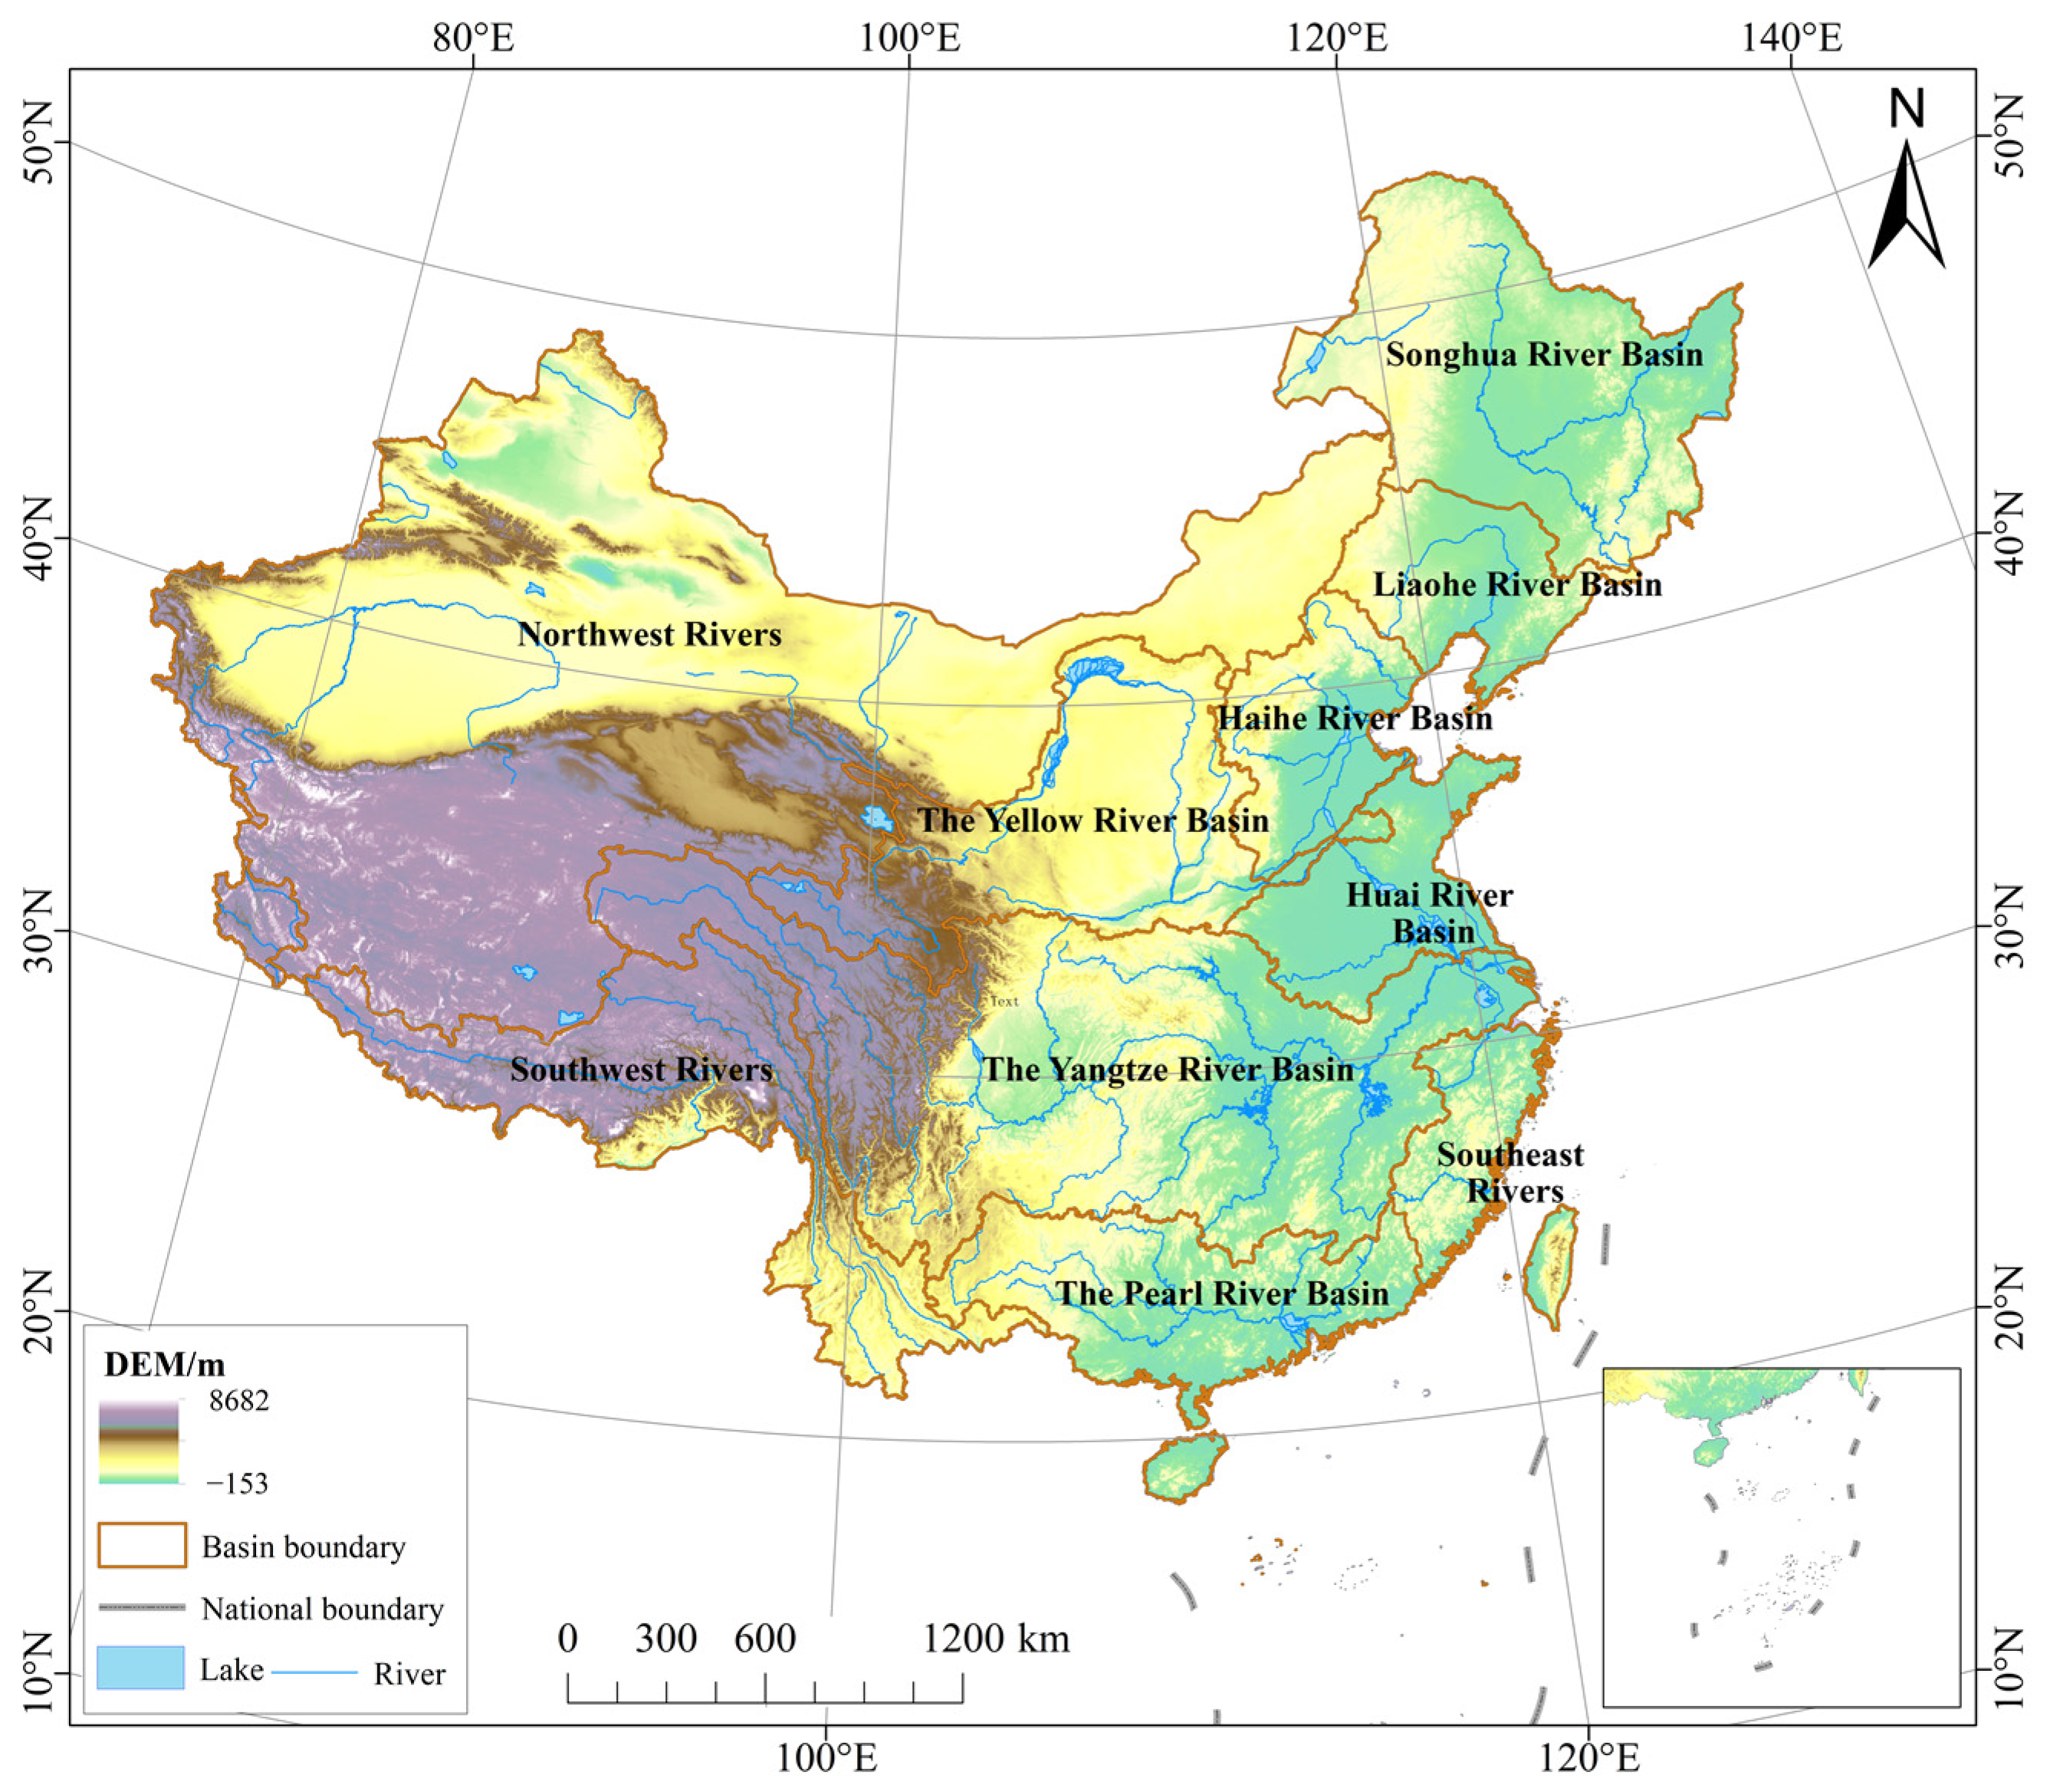
2.1. Study Area

As shown in Figure 1, China is located in the eastern part of Asia and the west coast of the Pacific Ocean. It extends to the north until the center line of the main channel of Heilongjiang, north of Mohe River (53°33′ N), to the south until a site with dark sand (3°31′00′′ N), to the east until the intersection of Heilongjiang and Wusuli River (135°2′30′′ E), and to the west until the Pamir Plateau (73°29′59.79′′). Its east–west span is about 60°, while its north–south span is about 50°. Its land area is 9.6 million km2, ranking it third in the world [20]. The seas adjacent to China provide it with a superior geographical location, with a coastline of 18,000 km and rich marine resources. According to the physical geographical characteristics, the study area has been divided into ten major divisions according to the basin scope, namely, the Yellow River basin, the Yangtze River basin, the Huai River basin, the Hai River basin, the southwest rivers, the Pearl River basin, the northwest rivers, the Songhua River basin, the Liao River basin, and the southeast rivers. The terrain of China is complex and diverse, with mountainous areas accounting for the largest proportion at about 33%, followed by plateaus at about 26%. The terrain is high in the west and low in the east, presenting a three-step distribution. China has a vast territory and a large latitudinal and longitudinal span; thus, it has a complex and diverse climatic environment. The monsoon climate is the most significant. Under the influence of southeastern monsoons, the precipitation distribution shows a decreasing trend from the southeast to the northwest.

2.2. Data Source and Preprocessing

China’s monthly precipitation data during the period of 1901–2022 were generated with a spatial resolution of 1 km and in a NETCDF format through the Delta spatial downscaling scheme based on the global 0.5° climate dataset published by the CRU and the global high-resolution climate dataset published by WorldClim [21]. For ease of storage, the data were stored in an NC file as int16 with precipitation units of 0.1 mm. The precipitation dataset was preprocessed using ArcGIS10.7 (ESRI, RedLands, CA, USA), converted into .tif format, and multiplied by a coefficient of 10. It was resampled to a resolution of 1 km and projected into Krasovsky_1940_Albers.

2.3. Research Methods

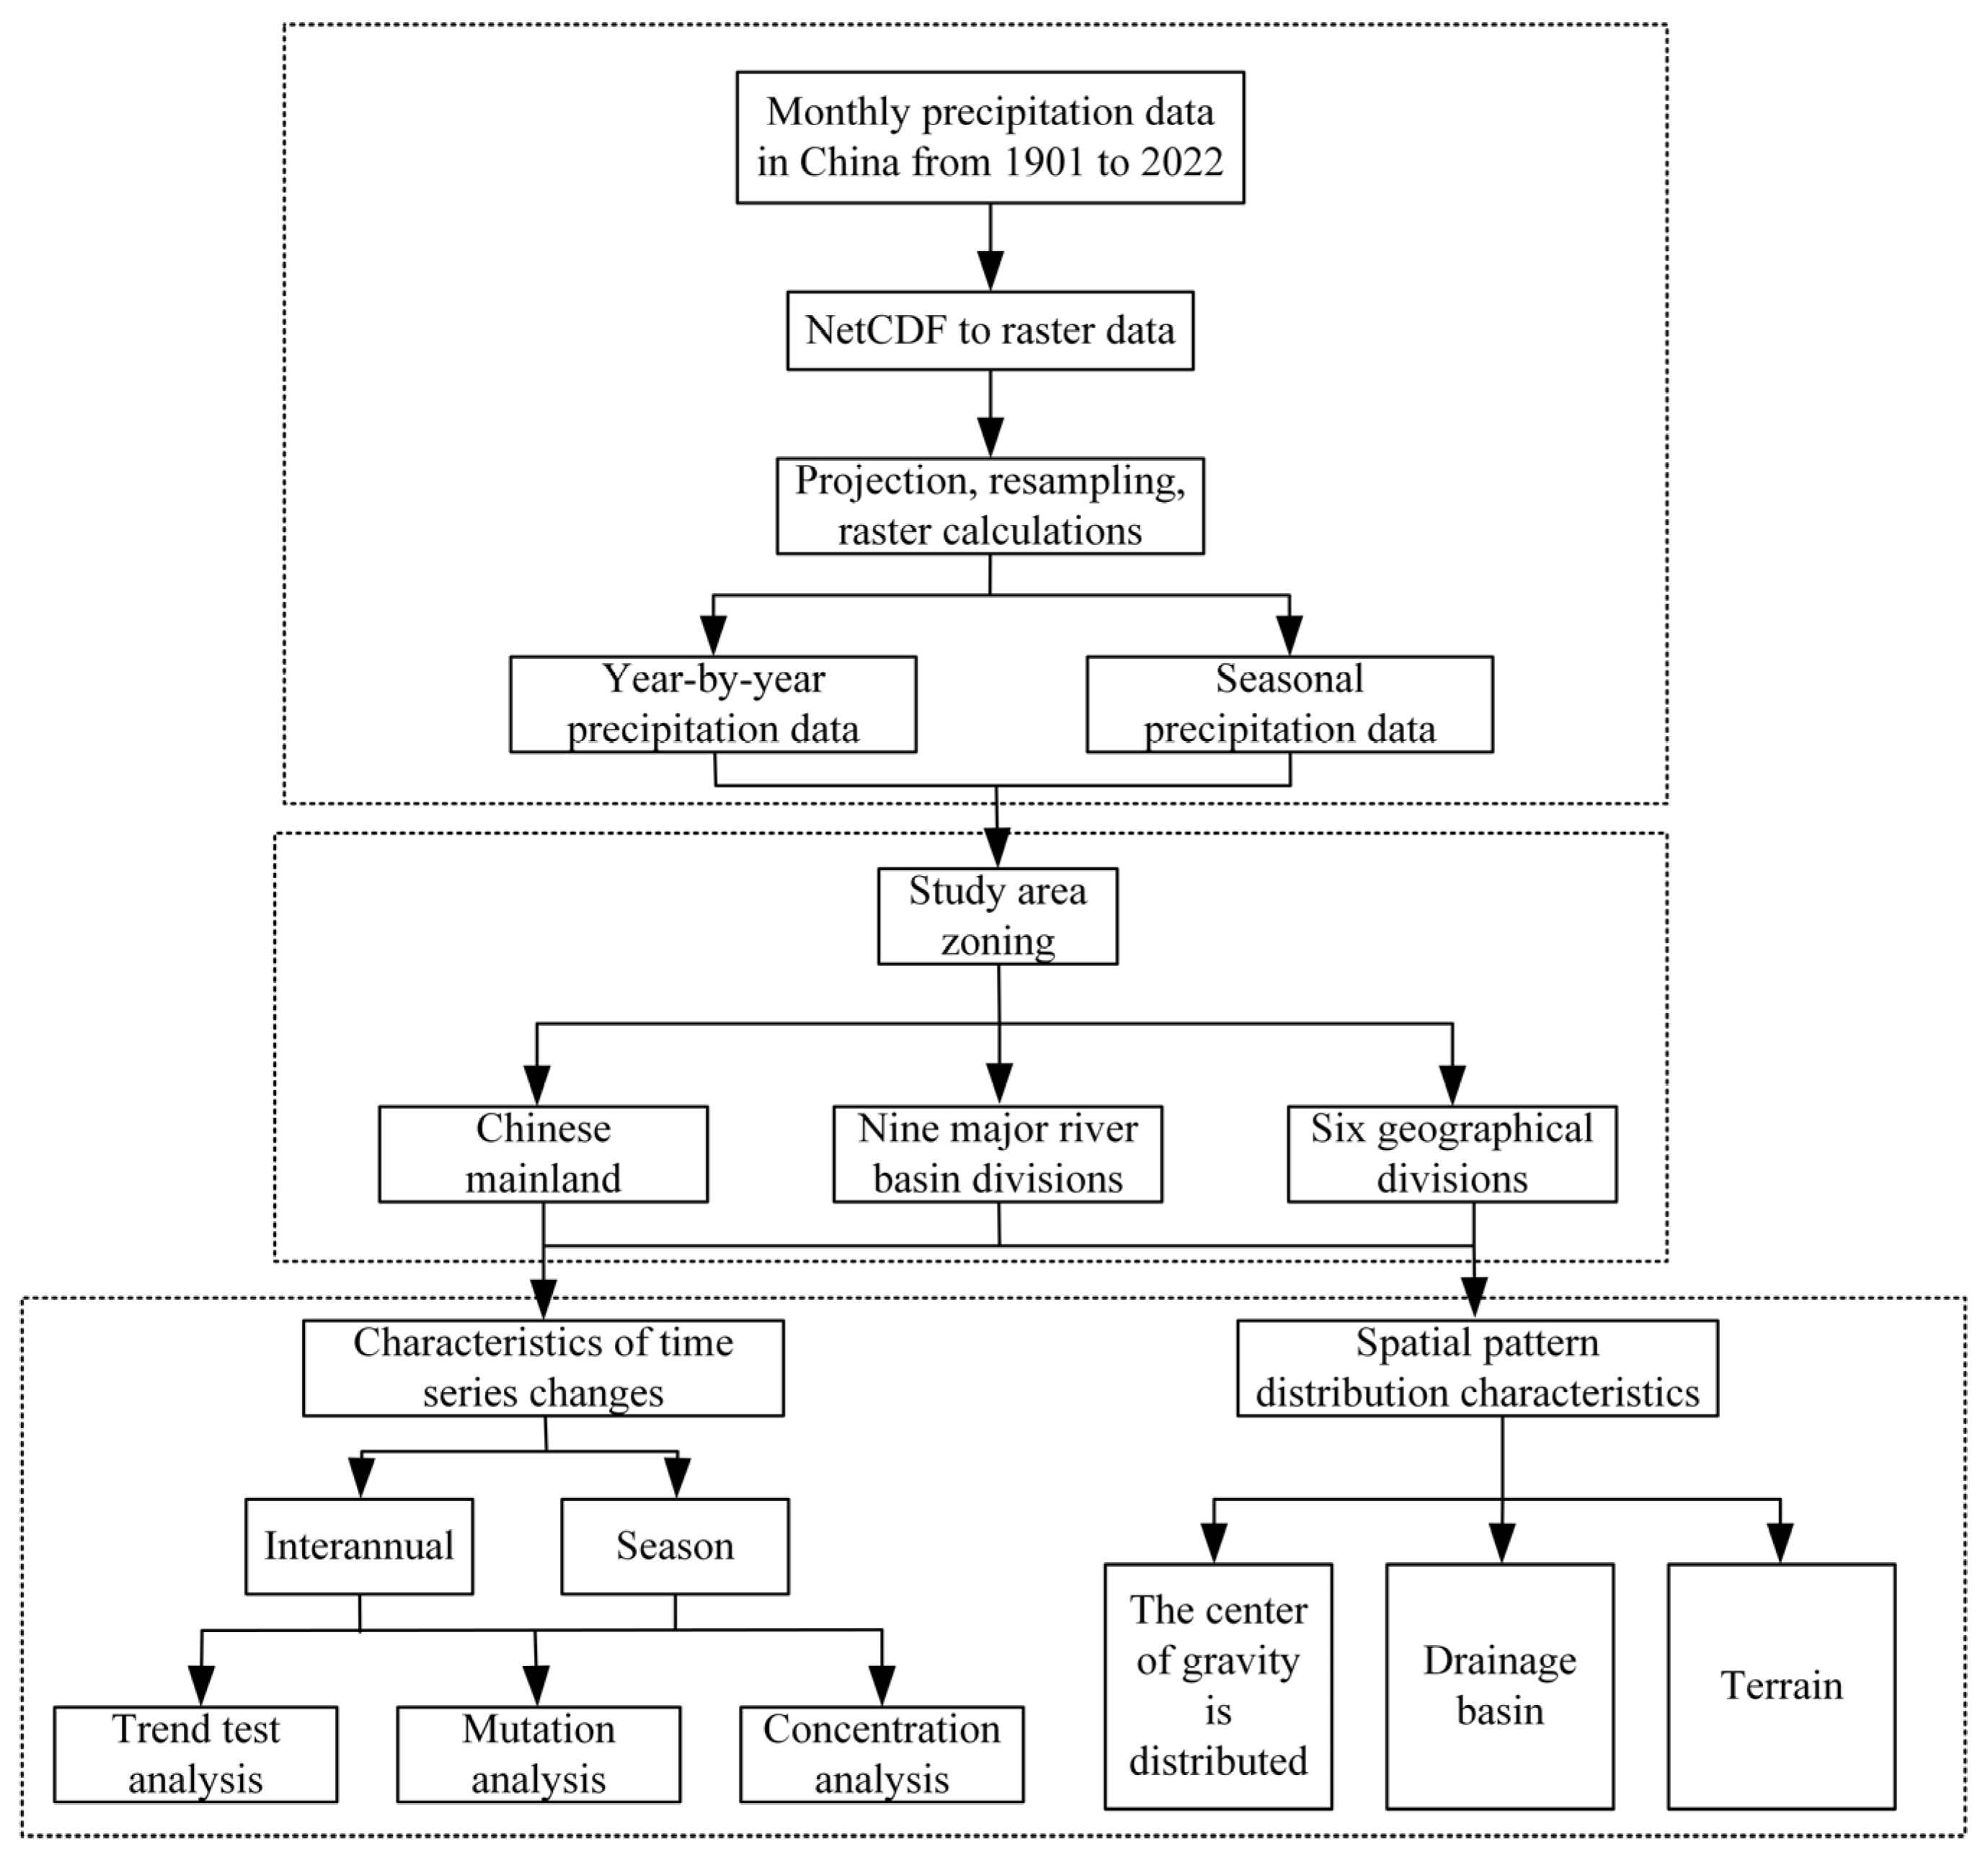
2.3.1. Technical Flowchart

Monthly precipitation data from China spanning from 1901 to 2022 were preprocessed in this study. The study area was divided into mainland China, nine major river basins, and six major geographical regions. The characteristics of their temporal variations and spatial distribution patterns were analyzed. Figure 2 presents the specific process: (1) the monthly precipitation datasets from 1901–2022 with NetCDF were re-projected and re-sampled by ArcGIS 10.7; (2) at annual and seasonal scales, the gradual mutation process was analyzed utilizing a trend analysis, an abrupt change analysis, and gravity center models; (3) from the partition perspective, such as river basins, the spatial differentiation patterns of precipitation were explored.

2.3.2. Mann–Kendall Trend Test

The Mann–Kendall trend analysis method (MK test for short) is a non-parametric test that is commonly used to test the significance of trends and is, therefore, widely used in the study of trend testing in hydrological sequences. In the MK test, the null hypothesis indicates that the samples in dataset X are independently and identically distributed without any trends, while the alternative hypothesis indicates a monotonic trend change in dataset X. The statistics constructed with the MK test are
Z c = S 1 var S , S > 0 0 , S = 0 S + 1 var S , S < 0
S = i = 1 n 1 k = i + 1 n sgn x k x i
In the formula, x k and x i are the sample data values, n is the sample size, and sgn ( x k x i ) is 1, 0, or −1 depending on if C is positive or negative. If − Z 1 α / 2 Z C Z 1 α / 2 , the original assumption H 0 is accepted. In addition, another indicator of the MK test, the Kendall slope E, is used to quantify monotonic trends; here, F is
β = Median x i x j i j , j < i
In the formula, 1 < j < i < n. When β > 0, it reflects an upward trend; otherwise, it indicates a downward trend.

2.3.3. Mann–Kendall Mutation Test

For a time-series x with n samples, an order column is constructed as follows:
s k = i = 1 k r i , k = 2 , 3 , , n
r i = + 1 , x i > x j 0 , x i x j j = 1 , 2 , , i
Under the assumption of the random independence of time series, the following statistics are defined:
U F k = s k E s k var s k k = 1 , 2 , 3 , n
In the formula, U F 1 = 0 , E s k , and V a r s k are the mean and variance of the cumulative number s k . When x 1 , x 2 , , x n are independent of each other and have the same continuous distribution,
E s k = n n + 1 4
V a r s k = n n 1 2 n + 5 72
In the formula, U F i is a standard normal distribution, which is a sequence of statistics calculated using time series. Given a significance level α , if U F i > U α , there is a significant change in the trend. This process is repeated in the reverse order of the time series, and U B k = U F k , k = n , n 1 , 1 , U B = 0. If the two curves of U F k and U B k have intersection points, and the intersection points are between the critical lines, then the corresponding time of the intersection point is the start time of the mutation, and the range beyond the critical line is determined to be the time region where the mutation occurs.

2.3.4. Center of Gravity Model

The center of gravity can characterize the spatial and temporal distribution characteristics of geographical elements, and it is widely used in the fields of economics, population analysis, ecology, and so on [22]. The spatial variation characteristics of the center of gravity can reflect the trend of precipitation changes. The precipitation of grid i is vi, and the calculation formulas for the center of gravity of precipitation are as follows:
x ¯ = i = 1 n z i x i i = 1 n z i
y ¯ = i = 1 n z i y i i = 1 n z i
In the formula, z i is the attribute value of the ith plane space unit, x i , y i is the coordinate value of the ith plane space unit, and the point x ¯ , y ¯ is the spatial mean value of n plane space units.

2.3.5. Validation of WorldClim Data

In order to validate the accuracy of the WorldClim data, we utilized 496 field-measured meteorological stations across the country from the China Meteorological Data Sharing Network to obtain the over accuracy and RMSE. The over accuracy and RMSE of monthly precipitation were 0.91 and 0.857, respectively, which indicates that the WorldClim datasets have higher applicability in China.

3. Results

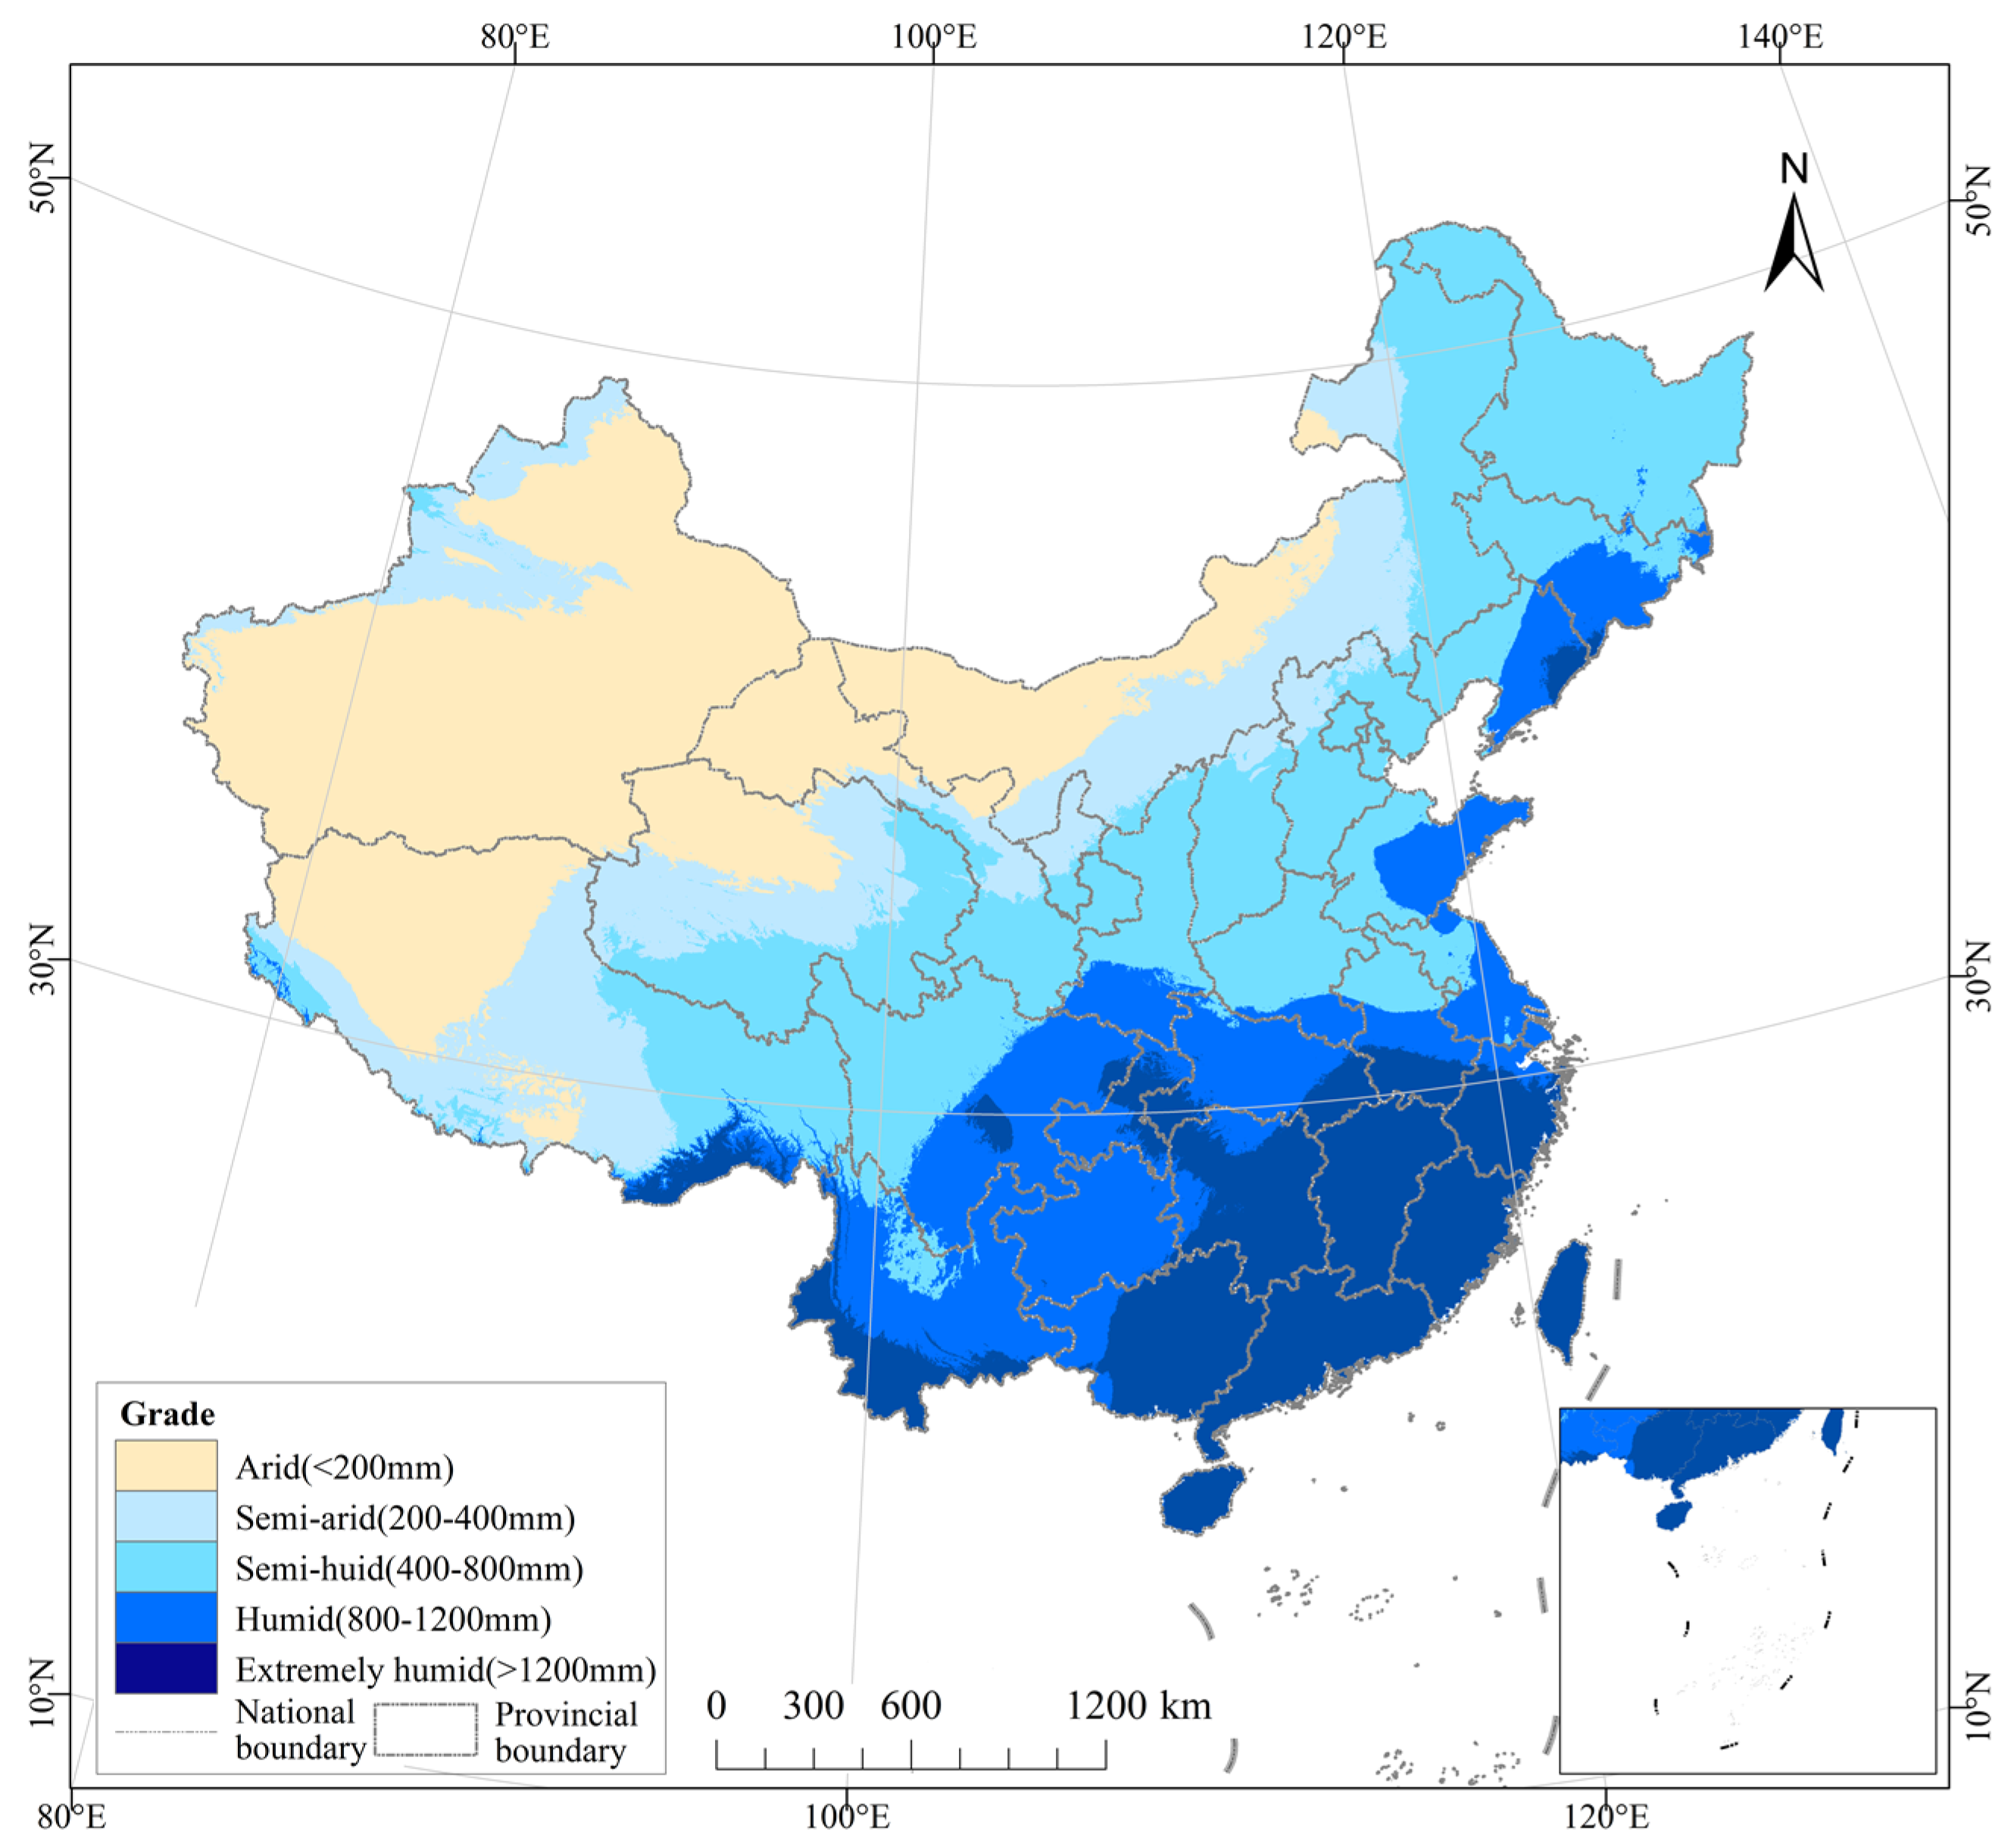
3.1. Spatial Distribution of Precipitation during 1901–2022

As shown in Figure 3, the mean precipitation during 1901–2022 ranged from 0 to 4936 mm. In order to better analyze the spatial patterns of precipitation, the data were divided into five levels, namely, <200 mm for arid, 200–400 mm for semi-arid, 400–800 mm for semi-humid, 800–1200 mm for humid, and >1200 mm for extremely humid (Figure 4). The annual precipitation showed a marked decrease from the southeastern coastal regions to the northwestern inland areas, and the precipitation contour line roughly followed a northeast–southwest direction. The semi-humid zones had the largest area proportion, accounting for 28.96%, and they were mainly distributed in Heilongjiang, northeastern Inner Mongolia, northwestern Jilin, western Liaoning, Beijing, Tianjin, Shanghai, Hebei, Shanxi, western Shandong, northern Henan, northern Jiangsu, northern Anhui, Ningxia, Shaanxi, northwestern Sichuan, southern Qinghai, and eastern Tibet. The arid zones had the second largest area, accounting for 27.42%, namely Xinjiang, northwestern Tibet, northwestern Qinghai, northwestern Gansu, and northwestern Inner Mongolia. Semi-arid zones accounted for 15.32%, including northern Xinjiang, central and western Qinghai, central Xizang, central Inner Mongolia, northern Ningxia, and northern Hebei. Humid zones accounted for 14.53%, including central and eastern Shandong, southeastern Sichuan, southern Jiangsu, central Anhui, Shanghai, Guizhou, Yunnan, and Hubei. Extremely humid zones accounted for 13.77%, and they were mainly distributed in southwestern Yunnan, Guangxi, Hunan, Jiangxi, Fujian, Zhejiang, Taiwan, Guangdong, Hong Kong, Macau, northeastern Chongqing, southern Anhui, and Hainan.
The Mann–Kendall trend test method was used to analyze the trends of changes in annual precipitation from 1901 to 1960 and from 1961 to 2022 (Figure 5 and Figure 6). For the period from 1901 to 1960, zones with no change trends accounted for the largest proportion, reaching 40.9%, mainly concentrated in the central and western regions of China, including Xinjiang, Gansu, Shaanxi, Qinghai, Tibet, Ningxia, southwestern Shanxi, and northwestern Sichuan, indicating that the annual precipitation in these areas during this period was very stable, and future fluctuations were predicted to be very slight. Southern Tibet exhibited a notable and highly significant decreasing trend, whereas the northeastern region demonstrated a notable and highly significant increasing trend. In southern Gansu and central Yunnan, there was a decreasing trend. For the period from 1961 to 2022, the regions with extremely significant increasing trends had the largest area proportion of 46%. In addition, the zones with an increasing trend had an area proportion of 58.5%. Regions with significant and highly significant increases were primarily located in Qinghai Province, southern central Xizang, northern Xinjiang, southern Xinjiang, central Gansu, western Inner Mongolia, Shanghai, southern Jiangsu, Zhejiang, and southern Anhui.
Compared with the period of 1901–1960, zones with a decreasing trend changed less from 1961 to 2022, while the area proportion of regions without changes decreased from 40.9% to 4.84%, indicating that the climate fluctuations during the period of 1961–2022 were more pronounced and the precipitation changes were more intensive. The climate changes between 1901 and 1960 were relatively stable, while the precipitation from 1961 to 2022 experienced a very wide range of changes, with a significant increase in the proportion of the total area showing an increasing trend.

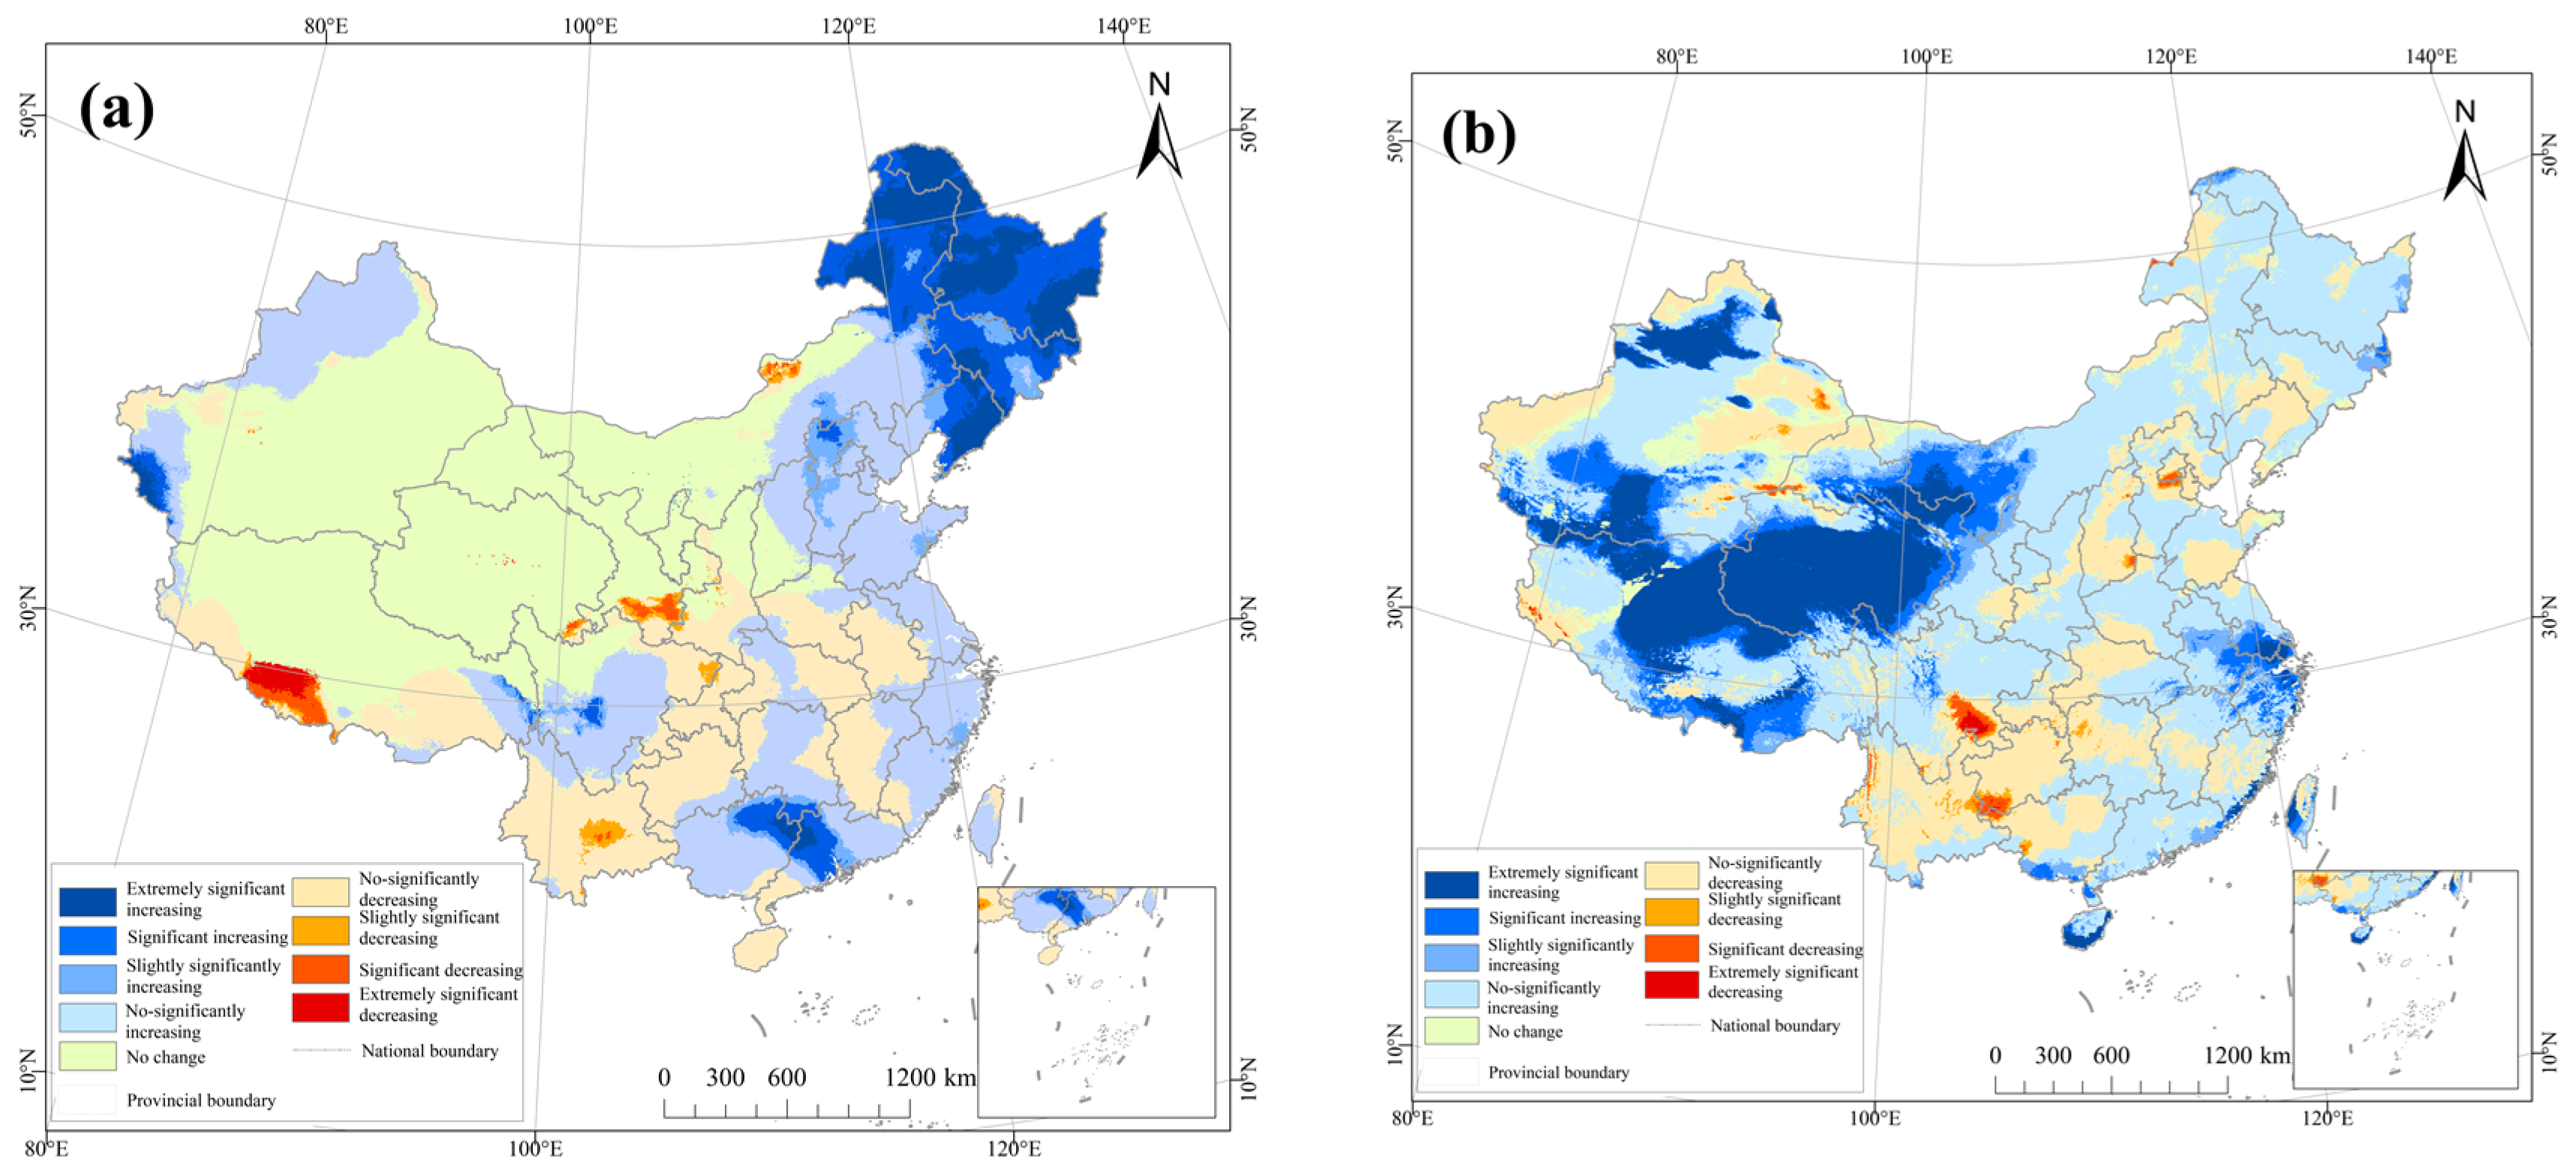
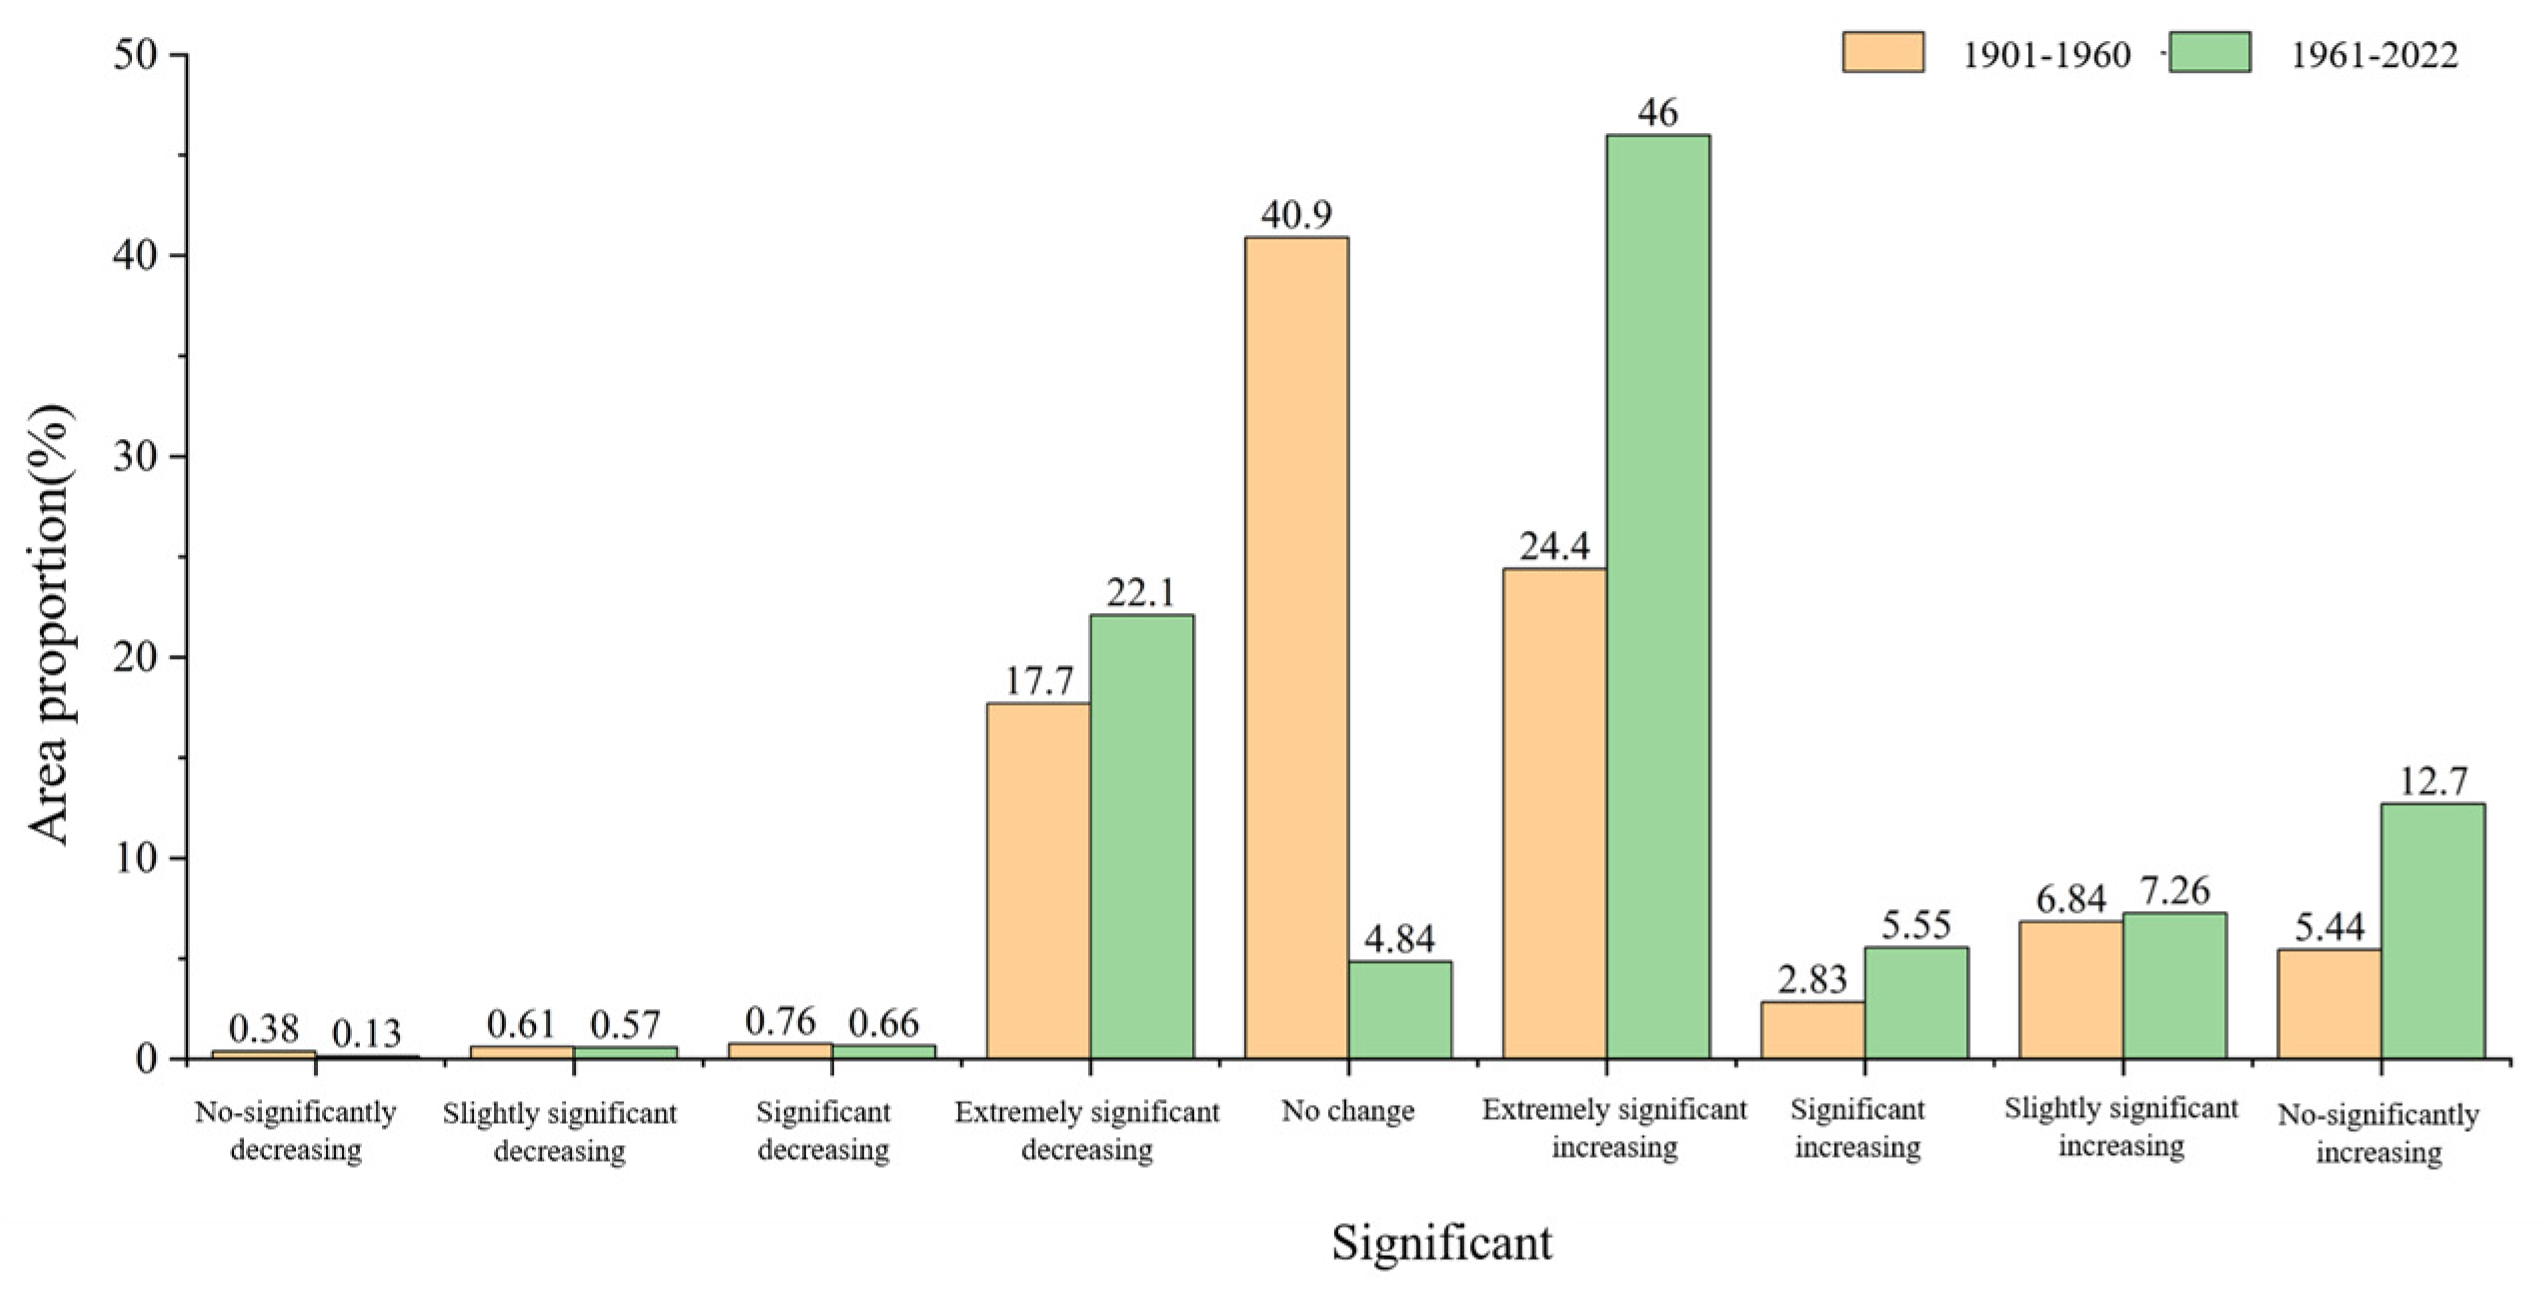
3.2. Temporal Variations in Precipitation during 1901–2022

Due to China’s location in the eastern part of the East Asian continent, with most of its territory located in the mid-latitudes of the Northern Hemisphere, its climate is significantly influenced by the summer monsoons, making studying changes in summer precipitation more representative. Firstly, the total summer precipitation in June, July, and August from 1901 to 2022 was calculated, and then the mean value was calculated to obtain the mean value of the total summer precipitation in different basins from 1901 to 2022.
As shown in Figure 7 and Figure 8, the variations in summer precipitation among the basins were pronounced, illustrating the highly uneven distribution of summer precipitation across China. According to the total precipitation in summer, the drainage basins were sorted as follows: the Pearl River basin > southeast river basins > Yangtze River basin > Huaihe River basin > southwest river basins > Liaohe River basin > Haihe River basin > Songhua River basin > Yellow River basin > northwest river basins. The precipitation in the Pearl River basin was the largest (698.3 mm), while that in the northwest river basins was the smallest (82.3 mm), with a maximum difference of 616 mm. Relative to the annual average summer precipitation in China, only the Yellow River basin and the northwest river basins experienced lower levels.
Linear fitting was used to reflect the overall change tendencies, while the mutation test was used to more comprehensively highlight the changes in summer precipitation in the whole time series of each basin.
In Figure 9, abrupt changes in summer precipitation in each watershed over the years and their significance are shown. From 1978 to 1979, the summer precipitation in the Yangtze River basin exhibited a significant decreasing trend with 95% confidence. There were multiple precipitation mutation points in the range of the time series, and after the mutation in 1972, the precipitation showed continuous attenuation and reached a significant level, which was determined to be a significant mutation point for attenuation. The southeast river basins only reached a significant level in 1910, showing a significant decreasing trend with a significant mutation point for attenuation in 1909. The Haihe River basin experienced a notable increasing trend during the periods from 1911 to 1912 and from 1964 to 1980, and 1910 and 1956 were significant mutation points for growth. The Huaihe River basin showed a significant trend of attenuation in 1933–1937 and 1942–1945, and the significant mutation point for attenuation was in 1933. The Yellow River basin exhibited a significant increasing trend in 1904 and during the period from 1911 to 1912, as well as a significant trend of attenuation in 1923–1925 and 1929–1931; there was a significant mutation point for attenuation in 1917. The Liao River basin displayed a notable increasing trend in 1904 and from 1962 to 1971, and 1952 was a significant mutation point for growth. The Songhua River basin demonstrated a significant increasing trend between 1906 and 1908, 1960 and 1973, and 1990 and 2000, and 1930 was a significant mutation point for attenuation. There were several significant years of attenuation and mutation points in the northwest river basins from 1919 to 1950. In addition, there was a significant trend of attenuation from 1962 to 1970, and 1960 was a significant mutation point for attenuation. The southwest river basins showed a significant trend of growth in 1911 and 1921–1929, and 1921 was a significant mutation point for growth. The Pearl River basin exhibited a notable increasing trend in 1904 and from 1919 to 1955, and 1917 was a significant mutation point for growth.

3.3. Distribution Characteristics of the Centers of Gravity in Different Basins

The center of gravity model was employed to analyze the distribution and migration of precipitation centers across various regions of China from 1901 to 2022. Using a ten-year time scale, the centers of gravity of different watershed zones and time periods were calculated to display the distribution and migration patterns over a long time period(Figure 10 and Table 1). The center of gravity of the average precipitation during 1901–2022 was taken as the origin of the polar coordinate. As shown in Figure 10(a1,a2), the multi-year centers of gravity in the Yangtze River basin were mainly distributed in Xianfeng, Enshi Tujia, and Miao Autonomous Prefecture in Hubei. The standard deviation ellipse angle was measured to be 86.536°, suggesting that the distribution of the multi-year centers of gravity primarily followed an east–west orientation. The area of the ellipse was 219.7 km2, and its larger area indicated the greater degree of dispersion of the centers of gravity as a whole. In polar coordinates, the centers of gravity were mainly concentrated on the east side of the mean center of gravity. As shown in Figure 10(b1,b2), the centers of gravity of the southeast rivers were mainly distributed in Ningde, Fujian, with a standard deviation ellipse angle of 159.135°, indicating that the distribution of the centers of gravity over the years showed a pattern in the northwest–southeast direction. The area of the ellipse was 30.9 km2, making it the smallest among the standard deviation ellipse surface products in all zones and indicating that the dispersion of the centers of gravity was relatively small. As shown in Figure 10(c1,c2), the multi-year centers of gravity in the Haihe River basin were mainly distributed in Qingyuan, Baoding, Hebei, with an elliptical angle of 28.621°, indicating that the distribution of multi-year centers mainly showed a pattern in the northeast–southwest direction. In polar coordinates, the numbers of centers of gravity in the north and south quadrants were the same. As shown in Figure 10(d1,d2), the multi-year centers of gravity in the Huai River basin were mainly distributed in Suzhou, Anhui, with an elliptical angle of 27.766°, indicating that the distribution of the multi-year centers of gravity mainly showed a pattern in the northeast–southwest direction. As shown in Figure 10(e1,e2), the multi-year centers of gravity in the Yellow River basin were mainly distributed at the junction of Huan and Zhenyuan in Qingyang, Gansu, and in Pengyang in Guyuan, Ningxia Hui Autonomous Region, with an elliptical angle of 73.629°. This indicated that the distribution of the centers of gravity over the years mainly showed a pattern in the northeast–southwest direction, with an elliptical area of 94.766 km2. This larger area indicated the greater dispersion of the centers of gravity as a whole. In polar coordinates, the number of centers of gravity in the southern quadrant was greater than that in the northern quadrant, showing obvious northeast–southwest distribution characteristics. As shown in Figure 10(f1,f2), the multi-year centers of gravity in the Liaohe River basin were mainly distributed in Xinmin, Liaoning, with an elliptical angle of 108.775°, indicating that the distribution of multi-year centers of gravity showed a pattern in the northwest–southeast direction. In polar coordinates, the number of centers of gravity in the northern quadrant was greater than that in the southern quadrant. As shown in Figure 10(g1,g2), the multi-year centers of gravity in the Songhua River basin were mainly distributed in Mingshui, Suihua, Heilongjiang, with an elliptical rotation angle of 136.282°, indicating that the multi-year distribution of centers of gravity was mainly in the northwest–southeast direction. When using the polar coordinates, the number of centers of gravity in the northern quadrant was greater than that in the southern quadrant, indicating that the increase in precipitation in the northern parts was greater than that in the southern parts. As shown in Figure 10(h1,h2), the multi-year centers of gravity of the northwest rivers were mainly distributed in Dunhuang, Gansu and Aksai, and Jiuquan in Gansu. The ellipse rotation angle was 77.143°, indicating that the multi-year distribution of centers of gravity was mainly in the northeast–southwest direction. The ellipse covered an area of 1370.655 km2, with the standard deviation ellipse being the largest, indicating substantial overall dispersion of the centers of gravity. As shown in Figure 10(i1,i2), the multi-year centers of gravity for the southwestern rivers were predominantly located in the southeastern region of the Tibet Autonomous Region, and the elliptical angle was 126.563°, indicating that the distribution of the multi-year centers of gravity was mainly in the northwest–southeast direction. When using the polar coordinates, the number of centers of gravity in the southern quadrant was greater than that in the northern quadrant, indicating that the increase in precipitation in the southern parts was greater than that in the southern quadrant. As shown in Figure 10(j1,j2), the multi-year centers of gravity of the Pearl River basin were mainly distributed in Guiping, Guangxi Zhuang Autonomous Region, with an elliptical rotation angle of 101.161°, indicating that the distribution of the multi-year centers of gravity was mainly in the northwest–southeast direction. In polar coordinates, the multi-year centers of gravity were predominantly situated in the eastern quadrant, suggesting that precipitation increases were more pronounced in the eastern areas than in the western regions.

4. Discussion

In this study, we systematically analyzed the spatiotemporal patterns of precipitation changes in China from 1901 to 2022 [23]. By employing methods such as the Mann–Kendall trend analysis, Pettitt’s test for change point detection, the gravity center model, and transition matrices, we conducted a detailed statistical analysis of precipitation data across different regions and periods. These methods could not only reveal the spatial distribution characteristics of precipitation in China but also enable us to identify the temporal trends and abrupt changes in precipitation [24,25].
Previous studies on the spatiotemporal patterns of precipitation in China have mostly selected the period from the 1950s onward as their starting point [26]. This study, however, encompasses a broader timeframe, extending from 1901 to 2022. By including data from the early 20th century, this research enriches the existing body of knowledge. The extended time range allowed for a more comprehensive analysis of the spatiotemporal patterns of precipitation in China, enabling the identification of potential long-term trends and periodic changes; in addition, this study employed the transition matrix method to conduct a quantitative analysis of the areas with changes between different precipitation categories, thereby enhancing the analysis of the temporal variation characteristics [27].
The distribution of the average precipitation during 1901–2022 had a certain regularity. The equi-precipitation line was roughly in the northeast–southwest direction, and precipitation typically declined from the southeastern coast towards the northwestern inland areas. This trend was closely related to factors such as geographical location and topography [28]. At the same time, the region was significantly affected by the East Asian monsoon. Summer monsoons brought a lot of moist air from the Pacific Ocean, which led to abundant precipitation in the southeastern coastal area [29]. In regions adjacent to the ocean, a substantial amount of water vapor generated by ocean evaporation was transported to the inland areas, thereby further increasing precipitation [30]. However, as the distance from the southeast monsoon increased, the precipitation gradually decreased. This was attributable to the scarcity of water vapor sources far from the ocean, leading to a considerable reduction in precipitation [31]. In addition, the existence of the Himalayas and the Qinghai–Tibet Plateau also had an important impact on the distribution of precipitation. These topographic barriers block the warm and wet airflow from the Indian Ocean and the Pacific Ocean, resulting in dry rain shadows in the northern and northwestern regions [32]. Terrain factors had a notable influence on the distribution of precipitation. From the southeastern coast to the inland, the terrain gradually rose and became complex and diverse. These terrain features would affect the movement of warm and humid air currents, significantly affecting the crossing between different precipitation levels [33].
The spatial distribution of the multi-year average precipitation across various historical periods exhibited some similarities. Compared with 1901–1960, the area of arid, semi-arid, and humid areas slightly decreased from 1961 to 2022, and the proportion of semi-humid areas slightly increased, while the proportion of humid areas significantly increased. The change in climate from 1901 to 1960 was relatively stable, and only a few areas showed significant trends. The precipitation from 1961 to 2022 showed different degrees of increase and decrease in the whole country. Compared with the precipitation in the two periods, the precipitation showed an overall increase. During the period from 1961 to 2022, the area of increased precipitation expanded significantly, indicating that China’s climate experienced a significant wetting process during this period. Global warming and glacier melting were two important factors affecting this change [34]. Global warming led to the rapid retreat of glaciers in these regions, and increased glacier melt water, in turn, increased the water vapor content in the atmosphere and promoted increased precipitation [35]. The increase in surface temperature in these glacier areas also further enhanced evaporation and convection activities, resulting in more precipitation. As shown by the investigation of its underlying causes, climate change not only affects water vapor content in the atmosphere but also influences atmospheric circulation patterns. Convection activities near tropical regions were impacted, and long-term climatic cycles and trends significantly influence the precipitation distribution. For instance, changes in atmospheric circulation, such as the El Niño–Southern Oscillation (ENSO), also contributed to variations in precipitation across different regions of China [36].
The breakpoint year of 1961 (which was the midpoint between 1901 and 2022) was reasonably selected to divide the entire period into two equal parts for more refined research. Within the period from 1901 to 2022, precipitation breakpoints were identified in various river basins. Significant shifts in precipitation gravity centers were observed in areas such as the Haihe River basin, Huaihe River basin, and various rivers in the northwest, indicating substantial changes in precipitation distribution during these periods. In contrast, the shifts in precipitation gravity centers were relatively minor in the rivers of the southeast and southwest, suggesting a more stable precipitation distribution in these basins. Between 1901 and 2022, the precipitation levels in the Songhua River basin, Hai River basin, Yellow River basin, Huai River basin, Pearl River basin, and various northwest river basins showed an increasing trend, while the Liao River basin, Yangtze River basin, southeast river basins, and southwest river basins exhibited a decreasing trend. The differing precipitation trends across these regions were influenced by multiple factors. The blocking and lifting effects of mountains on air currents may have contributed to localized increases in precipitation, and human activities such as urbanization could have indirectly affected the climate and precipitation patterns. The transfer of precipitation levels showed strong periodicity and repeatability, and the overall precipitation showed an increasing trend. The influencing factors that cause changes in precipitation in each basin at different time nodes are diverse [37]. The El Niño–Southern Oscillation (ENSO), Pacific SST Oscillation (PDO), and North Atlantic Oscillation (NAO), which reflect atmospheric circulation and SST anomalies, are key factors for global climate anomalies and periodic changes [38]. El Niño is usually associated with drought events, while La Niña may trigger flood events [39]. Additionally, human activities such as urbanization, land use changes, and industrial emissions impact the atmospheric composition, alter surface heat and humidity distributions, and subsequently influence climate and precipitation patterns [40]. Precipitation is one of China’s primary sources of freshwater. Studying its distribution, seasonal variations, and long-term trends is beneficial for scientifically managing water resources [28]. Precipitation also significantly impacts agricultural production; researching it could inform decisions such as agricultural irrigation planning [27]. Moreover, extreme precipitation could trigger natural disasters such as floods. Studying the spatial distribution and patterns of precipitation changes is the basis for implementing preventive measures [34].
In addition, the above spatiotemporal change laws in this study would be conducive to identify areas prone to floods and droughts, which would provide important data and decision support for disaster management and prevention [18]. Moreover, the results obtained at a century scale could help reveal the future changes of precipitation in a spatial and temporal distribution, which could provide support for the implementation of government disaster prevention and mitigation projects [29].

5. Conclusions

In this study, based on monthly precipitation from 1901 to 2022 in China, the spatiotemporal patterns of precipitation at different time scales from 1901 to 2022 were investigated by utilizing mutation analysis and the center of gravity model. The conclusions were as follows:
(1) The equi-precipitation lines were generally oriented in a northeast–southwest direction, with precipitation decreasing from the southeastern coast toward the northwestern inland areas;
(2) The spatial distributions of the mean annual precipitation in different periods had certain similarities. Compared with that from 1901 to 1960, the precipitation from 1961 to 2022 showed an upward trend for 122 years;
(3) From 1901 to 2022, the precipitation in the Songhua River basin, Haihe River basin, Yellow River basin, Huaihe River basin, Pearl River basin, and northwest river basins showed an upward trend, while that in the Liaohe River basin, Yangtze River basin, southeast river basins, and southwest river basins showed a downward trend;
(4) The standard deviation ellipse formed by the multi-year precipitation centers of gravity in the southeast river basins had the smallest area and degree of dispersion. The standard deviation ellipse in the northwest river basins had the largest area and the most significant degree of dispersion;
(5) From 1901 to 2022, the transfer process among different grades of precipitation showed strong periodicity and repeatability. The precipitation finally showed a trend of transferring from a low precipitation grade to a high precipitation grade, and the overall precipitation showed an increasing trend.

Author Contributions

Conceptualization, methodology, and writing—original draft preparation, J.H.; investigation, supervision, project administration, and funding acquisition, R.Z., B.G. and B.H.; methodology and writing—original draft preparation, T.X. and Q.G. All authors have read and agreed to the published version of the manuscript.

Funding

This research was funded by the National Natural Science Foundation of China (grant numbers: 42471329, 42101306, 42301102), Scientific Innovation Project for Young Scientists in Shandong Provincial Universities (grant number: 2022KJ224),the Natural Science Foundation of Shandong Province (grant number: ZR2021MD047), and the Gansu Youth Science and Technology Fund Program (grant numbers: 24JRRA100).

Institutional Review Board Statement

Not applicable.

Informed Consent Statement

Not applicable.

Data Availability Statement

Data are contained within the article.

Conflicts of Interest

The authors declare no conflicts of interest.

References

  1. Yao, H.X.; Li, Q.Q.; Zhao, L.; Wu, X.Q.; Shen, X.Y.; Duan, C.F.; Li, C. Evolution characteristics of compound drought and heat events during the warm season in the Huaihe River Basin and their relationship with climate and vegetation. Acta Ecol. Sin. 2024, 44, 5596–5608. [Google Scholar]
  2. Zhao, Z.C.; Luo, Y.; Huang, J.B. Global climate indicators, climatic-impact drivers and global warming. Clim. Chang. Res. 2024, 20, 384–388. [Google Scholar]
  3. Liang, P.D.; Liu, A.X.; Duan, L.Y.; Zhou, M.S.; Zhou, L.D. The Relationship between the Persistent Anomaly of Spring and Summer Atmospheric Circulation in the Middle Part of Asia and the Summer Drought/Waterlogging in Eastern China. Chin. J. Atmos. Sci. 2008, 32, 1174–1186. [Google Scholar]
  4. Xu, D.P.; Li, J.M.; Zhou, Z.H.; Liu, J.J.; Yan, Z.Q.; Wang, D.X. Study on the spatial and temporal distribution of precipitation characteristics in China from 1956 to 2018. Water Resour. Hydropower Eng. 2020, 51, 20–27. [Google Scholar]
  5. Chen, S.; Zhao, W.W.; Han, Y. Spatio-temporal variation of vegetation precipitation use efficiency and influencing factors in arid and semi-arid areas of China. Acta Ecol. Sin. 2023, 43, 10295–10307. [Google Scholar]
  6. Yang, Z.H.; Tuo, Y.; Yang, J.; Wu, Y.Z.; Gong, Z.Q.; Feng, G.L. Integrated prediction of summer in China based on multi dynamic-statistic methods. Chin. J. Geophys. 2024, 67, 982–996. [Google Scholar]
  7. Liu, X.P.; Tong, X.H.; Jia, Q.Y.; Xin, Z.H.; Yang, J.R. Precipitation concentration characteristics in China during 1960–2017. Adv. Water Sci. 2021, 32, 10–19. [Google Scholar]
  8. Wang, L.P.; Wang, Y.Z.; Xiang, X.; Sun, H.; Lian, Z.H. Research on classification of short-duration heavy rain based on Gumbel-Linear Moment and K-Means algorithm. Chin. J. Geophys. 2023, 66, 3171–3184. [Google Scholar]
  9. Hu, Y.Y.; Xiao, Y.; Dai, S.P.; Luo, H.X.; Li, Y.P.; Li, M.F. Spatio-temporal Variation Characteristics of Precipitation and Temperature in Tropical China from 1961 to 2015. Southwest China J. Agric. Sci. 2021, 34, 1788–1795. [Google Scholar]
  10. Lu, S.; Hu, Z.Y.; Wang, B.P.; Qin, P.; Wang, L. Spatio-temporal Patterns of Extreme Precipitation Events over China in Recent 56 Years. Plateau Meteorol. 2020, 39, 683–693. [Google Scholar]
  11. Deng, H.J.; Guo, B.; Cao, Y.Q.; Chen, Z.S.; Zhang, Y.Q.; Chen, X.W.; Gao, L.; Chen, Y.; Liu, M.B. Spatial and temporal patterns of daytime and nighttime precipitation in China during 1961–2016. Geogr. Res. 2020, 39, 2415–2426. [Google Scholar]
  12. Zhao, Z.H.; Luo, Z.J.; Huang, L.X.; Xing, L.T.; Sun, H.J.; Chen, H.L.; Sun, B. Analysis of Precipitation and Groundwater Variation Based on STL and Mann-Kendall Methods in Jinan City. J. China Hydrol. 2022, 42, 73–77. [Google Scholar]
  13. Oliver, J.E. Monthly precipitation distribution: A comparative index. Prof. Geogr. 1980, 32, 300–309. [Google Scholar] [CrossRef]
  14. Michiels, P.; Gabriels, D.; Hartmann, R. Using the seasonal and temporal Precipitation concentration index for characterizing the monthly rainfall distribution in Spain. Catena 1992, 19, 43–58. [Google Scholar] [CrossRef]
  15. Javier, M. Spatial distribution of a daily precipitation concentration index in peninsular Spain. Int. J. Climatol. 2004, 24, 959–971. [Google Scholar]
  16. Kong, F.; Shi, P.J.; Fang, J.; Lu, L.L.; Fang, J.Y.; Guo, J.P. Advances and Prospects of Spatiotemporal Pattern Variation of Extreme Precipitation and its Affecting Factors under the Background of Global Climate Change. J. Catastrophol. 2017, 32, 165–174. [Google Scholar]
  17. Liu, K.; Nie, G.G.; Zhang, S. Study on the spatiotemporal evolution of temperature and precipitation in China from 1951 to 2018. Adv. Earth Sci. 2020, 35, 1113–1126. [Google Scholar]
  18. He, Q.X.; Chen, C.F.; Wang, Y.H.; Sun, Y.N.; Liu, Y.T.; Hu, B.J. Fusion Method for Multi-Source Remote Sensing Daily Precipitation Data: Random Forest Model Considering Spatial Autocorrelation. J. Geo-Inf. Sci. 2024, 26, 1517–1530. [Google Scholar]
  19. Zhang, R.N.; Sun, C.H.; Li, W.J. Relationship between the interannual variations of Arctic sea ice and summer Eurasian teleconnection and associated on summer precipitation over China. Chin. J. Geophys. 2018, 61, 91–105. [Google Scholar]
  20. Zhang, L.J.; Qian, Y.F. Annual distribution features of precipitation in China and their interannual variations. Acta Meteorol. Sin. 2003, 17, 146–163. [Google Scholar]
  21. Peng, S.Z. 1-km monthly precipitation dataset for China (1901–2023). Natl. Tibet. Plateau/Third Pole Environ. Data Cent. 2020, 12, 15–24. [Google Scholar]
  22. Zhang, D. Study on the Characteristics of Nighttime Light Distribution and Urban Gravity Center Migration in Urumqi. J. Xinjiang Norm. Univ. 2021, 40, 29–34+51. [Google Scholar]
  23. Yan, J.; Li, H.; Wang, J.N. Prediction of the Spatio-Temporal Variation Characteristics of Precipitation in Central Asia Based on the CMIP6 Model. Sci. Technol. Inf. 2024, 22, 244–248. [Google Scholar]
  24. Gao, X.T.; Dong, J.; Yang, R.R. Temporal and Spatial Variation of Precipitation in North China During the Last 50 Years. Henan Sci. 2016, 34, 596–600. [Google Scholar]
  25. Liu, M.R.; Liu, S.T.; Ma, C.Y.; Li, H.; Chang, S.H.; Hou, F.J.; Liu, Y.J. Research progress of the responses of grassland plants and soil to the variation of temperature and precipitation. Chin. J. Ecol. 2023, 8, 125–137. [Google Scholar]
  26. Zhang, X.; Li, P.; Li, D. Spatiotemporal variations of precipitation in the southern part of the Heihe river basin (China), 1984–2014. Water 2018, 10, 410. [Google Scholar] [CrossRef]
  27. Lv, J.X.; Liu, C.M.; Liang, K.; Tian, W.; Bai, P.; Zhang, Y.H. Spatiotemporal variations of extreme precipitation in the Yellow River Basin based on water resources regionalization. Resour. Sci. 2022, 44, 261–273. [Google Scholar] [CrossRef]
  28. Wang, L.Z.; Miao, J.F.; Han, F.R. Overview of Impact of Topography on Precipitation in China over Last 10 Years. Meteorol. Sci. Technol. 2018, 46, 64–75. [Google Scholar]
  29. Du, Y.B.; Li, S.S.; Feng, D.; Xiao, Y.Q.; Chen, X.T.; Huang, S.N.; Du, L.L. Characteristics of Extreme Summer Precipitation and Large-Scale Cir-culation in Shaanxi Province under Global Warming. Plateau Meteorol. 2024, 43, 342–352. [Google Scholar]
  30. Wang, Q.F.; Chen, M.; Qi, X.H. Analysis of Multi-Year Precipitation and Evaporation Changes in Fujin City from 1992 to 2020. Water Resour. Dev. Manag. 2024, 10, 70–73+69. [Google Scholar]
  31. Zhang, Y.Y.; Xin, C.L.; Guo, X.Y.; Zhang, B.; Chen, N.; Shi, Y.F. Characteristics of Stable Isotopes in Precipitation and Its Moisture Sources in the Inland Regions of Northwest China. Environ. Sci. 2024, 45, 2080–2095. [Google Scholar]
  32. Lang, L.C.; Tang, C.; Gao, X.; Li, Z.H.; Wu, F. Spatial interpolation of high-resolution daily precipitation over complex terrains. Acta Geogr. Sin. 2023, 78, 101–120. [Google Scholar]
  33. Tang, W.R.; Fang, K.Y.; Mei, Z.P.; Wu, H.; Zhou, F.F.; Chen, Y.; Li, W.L. The influence of climate change on social evolution in Eurasia over the past millennium. Chin. Sci. Bull. 2024, 1–12. [Google Scholar]
  34. Li, X.E.; Liu, Y.; Jiang, L.M.; Huang, R.G.; Zhou, Z.W.; Pang, X.G. A Review on Remote Sensing Monitoring of Glacial Lake Change and Glacial Lake Outburst Floods in Mountain Glacier Regions. J. Geo-Inf. Sci. 2024, 26, 1019–1039. [Google Scholar]
  35. Zhang, Y.R.; Zhou, D.G.; Guo, X.F. Regional climate response to global warming in the source region of the Yellow River and its impact on runoff. Sci. China Earth Sci. 2024, 54, 862–873. [Google Scholar] [CrossRef]
  36. Liu, J.X.; Zhu, Z.W.; Lu, R.; Li, J. Objective Classification of Sea Surface Temperature Evolution diversity of ENSO Cycle. Plateau Meteorol. 2024, 4, 87–102. [Google Scholar]
  37. Yang, B.L. Analysis of Runoff Change Characteristics and Driving Factors in the Upper Reaches of the Meijiang River Basin. Guangdong Water Resour. Hydropower 2022, 7, 43–47. [Google Scholar]
  38. Chen, L.J.; Wang, Y.Y.; Li, W.J.; Sun, L.H.; Li, X.; Zhang, D.Q. Review of the Influence and Application of SST Anomaly to Flood Season Precipitation in China. J. Appl. Meteorol. Sci. 2024, 35, 129–141. [Google Scholar]
  39. Hao, Z.C.; Chen, Y. Research progresses and prospects of multi-sphere compound extremes from the Earth System perspective. Sci. China Earth Sci. 2024, 67, 343–374. [Google Scholar] [CrossRef]
  40. Wang, J.W.; Ran, J.L.; Wu, W.; Shang, R.Y.; Zhang, Z.M.; Zhang, M.X.; Liu, J.K. Scaling Effects of Anthropogenic and Climate Change Impacts on Runoff in the Haihe River Basin. J. Ecol. Rural. Environ. 2024, 40, 757–765. [Google Scholar]
Figure 1. Overview of the study area.
Sustainability 16 07283 g001
Figure 2. Technical flowchart.
Sustainability 16 07283 g002
Figure 3. Distribution of the annual average precipitation in China from 1901 to 2022.
Sustainability 16 07283 g003
Figure 4. Area proportions of different grades of precipitation.
Sustainability 16 07283 g004
Figure 5. Distributions of change trends: (a) 1901–1960 and (b) 1961–2022.
Sustainability 16 07283 g005
Figure 6. Comparison of areas with significant trends in the periods 1901–1960 and 1961–2022.
Sustainability 16 07283 g006
Figure 7. Comparison of the annual summer precipitation in different basins.
Sustainability 16 07283 g007
Figure 8. Changes in summer precipitation in different basins: (a) Yangtze River basin; (b) southeast rivers; (c) Haihe River basin; (d) Huai River basin; (e) Yellow River basin; (f) Liaohe River basin; (g) Songhua River basin; (h) northwest rivers; (i) southwest rivers; and (j) Pearl River basin.
Sustainability 16 07283 g008aSustainability 16 07283 g008b
Figure 9. Test for sudden changes in summer precipitation in different basins: (a) Yangtze River basin; (b) southeast rivers; (c) Haihe River basin; (d) Huai River basin; (e) Yellow River basin; (f) Liaohe River basin; (g) Songhua River basin; (h) northwest rivers; (i) southwest rivers; and (j) Pearl River basin.
Sustainability 16 07283 g009
Figure 10. Distribution of centers of gravity for precipitation in different basins: (a1,a2) Yangtze River; (b1,b2) southeast rivers; (c1,c2) Haihe River; (d1,d2) Huai River; (e1,e2) Yellow River; (f1,f2) Liaohe River; (g1,g2) Songhua River; (h1,h2) northwest rivers; (i1,i2) southwest rivers; and (j1,j2) Pearl River.
Sustainability 16 07283 g010
Table 1. Parameters of the standard deviation ellipse.
Standard Deviation Ellipse ParameterCorner Angle (°)Standard Deviation along the x-Axis (km)Standard Deviation along the y-Axis (km)Area
(km2)
Yangtze River basin86.53614.0034.993219.653
Southeast rivers159.1351.9365.07630.868
Haihe River basin28.6212.6266.98957.649
Huaihe River basin27.7661.9978.56253.712
Yellow River basin73.62914.5552.07294.766
Liaohe River basin108.7756.7252.53353.520
Songhua River basin136.2823.5868.62297.122
Northwest rivers77.14328.81815.1391370.655
Southwest rivers126.56311.5513.268118.604
Pearl River basin101.1619.8233.962122.268
Disclaimer/Publisher’s Note: The statements, opinions and data contained in all publications are solely those of the individual author(s) and contributor(s) and not of MDPI and/or the editor(s). MDPI and/or the editor(s) disclaim responsibility for any injury to people or property resulting from any ideas, methods, instructions or products referred to in the content.

