Article

The “Butterfly Effect” of Volatility in Net International Capital Flows: An Analysis of Co-Movement Characteristics and Influencing Factors

1
Sino-Danish College, University of Chinese Academy of Sciences, Beijing 100190, China
2
Sino-Danish Center for Education and Research, University of Chinese Academy of Sciences, Beijing 100190, China
3
School of Economics and Management, University of Chinese Academy of Sciences, Beijing 100190, China
4
Academy of Mathematics and Systems Science, University of Chinese Academy of Sciences, Beijing 100190, China
*
Authors to whom correspondence should be addressed.
Sustainability 2024, 16(17), 7302; https://doi.org/10.3390/su16177302
Submission received: 18 July 2024 / Revised: 19 August 2024 / Accepted: 22 August 2024 / Published: 25 August 2024
(This article belongs to the Section Sustainable Management)

Abstract

:
This paper employs social network analysis to investigate the characteristics and determinants of co-movement in the volatility of net cross-border capital flows. We have identified a significant “small-world” pattern in the co-movement network. Economies with highly positive or negative co-movement of volatility in net capital flows display regional differences. Furthermore, economies with high trade intensity, large interest-rate spreads, membership in the same economic organization, and geographical adjacency exhibit significantly increased co-movement of volatility in net private capital flows and net other investment flows. Economies with large differences in economic growth present less co-movement of volatility in net portfolio flows.

1. Introduction

Since the 1980s, economic globalization and financial integration have made cross-border capital flows a crucial linkage for international economic and financial activities. In the interconnected global financial market, economic variations in one country, whether growth or turmoil, can rapidly transmit through capital flows to others, leading to co-movement of volatility in capital flows [1,2]. This co-movement enhances resource allocation efficiency and fosters global economic growth [3,4], but also facilitates the contagion of financial risks [5,6].
Currently, the slowdown in global economic recovery, the rise in geopolitical risks, and the expected shift in monetary policy by major developed economies are likely to exacerbate the volatility of international capital flows, potentially threatening the financial stability of economies through co-movement effects [4]. Therefore, it is necessary to thoroughly investigate the co-movement characteristics of volatility in international capital flows, particularly by identifying the key economies and regions involved in positive and negative co-movements, and examining the primary factors driving these co-movements. This research tries to facilitate a deeper insight into interconnections of global financial market and identify economies with strong co-movement of volatility in capital flows, which would offer valuable inspiration for improving global policy cooperation and promoting the sustainable development of the global financial markets at the current stage.

2. Literature Review

Existing research on the co-movement of volatility in international capital flows can be divided into three major categories.
The first category primarily focusses on the characteristics of the networks of bank flows or portfolio investment flows among economies [7,8,9,10,11,12,13,14,15].
Network analysis is employed to investigate the global banking network and its evolution over time in [7,8,9]. By analyzing cross-border bank flows, these studies reach a common conclusion: traditional financial centers, such as the United States and the United Kingdom, occupy core positions within the international financial network. Specifically, Giudici and Spelta [7] utilize a dynamic Bayesian graph model to identify the significant influence of offshore financial centers, including Luxembourg and Hong Kong, as well as The Netherlands, Switzerland, and Germany, in the global banking network. These findings are consistent with the conclusions drawn by Ahelegbey et al. [8], who emphasize the central role of traditional financial centers in the international financial network. Additionally, Minoiu and Reyes [9] further examine the synchronization between variations in network density and the global capital flow cycle. They discover that network connectivity increased prior to the 2008 global financial crisis and significantly declined in its aftermath. Cerutti and Zhou [10] extend this line of research by employing network analysis to explore the de-globalization phenomenon in international banking networks following the 2008 financial crisis. Their findings reveal a strengthening of regional linkages and more regionally concentrated clustering within the network. Mercado and Noviantie [11] contribute further by employing panel regression and Probit models to analyze data from 64 developed and emerging economies. Their findings indicate that the development level of a domestic financial system is crucial for an economy’s centrality in the network, with banking-related investments being more sensitive in this regard compared to direct and portfolio investments. Jackson and Pernoud [12] shift the focus to the relationship between financial networks and systemic risk. Reviewing the existing literature, they argue that banks and financial institutions with large-scale cross-border capital flows are more vulnerable to financial shocks, and as network density increases, so does the intensity of contagion effects. Zhao et al. [13] reinforce this view by utilizing network analysis and spatial econometrics to examine global syndicated loan networks, finding that credit links with high-risk countries increase domestic banks’ exposure to financial risks.
Network analysis has also been utilized to examine the attributes of international portfolio investment networks, as documented in [14,15]. Both studies note a significant increase in network density, a trend that is particularly pronounced in the aftermath of the 2008 financial crisis. Specifically, Li and Yang [14] highlight the pivotal roles of emerging economies like Malaysia, India, Poland, Turkey, and South Africa, while developed countries like Canada, Japan, France, and New Zealand acted as intermediaries. Ahn et al. [15] further reveal that the United States, the United Kingdom, and major Eurozone economies have more network linkages, making them central hubs, while offshore financial centers like the Cayman Islands play important intermediary roles. Additionally, Ahn et al. [15] find a positive correlation between a country’s per capita GDP and its network centrality, indicating that wealthier nations are more likely to become financial centers.
The second category mainly examines the contagion effects of volatility in capital flows among economies. Several studies within this field explore the contagion of international capital flows both within and across geographic regions [1,2,16,17,18,19]. For example, Calvo and Reinhart [16] use panel regression to analyze the contagion of capital flows in Latin America, finding that increased (or decreased) inflows into larger countries lead to corresponding increases (or decreases) in smaller countries, while reverse contagion effects are not significant. Popper et al. [17] divide international capital flows into direct investment and short-term investment, then use Granger causality tests and a VAR model to study the interactions between these flows, revealing that short-term investment is more sensitive to similar flows in other countries than direct investment. Lee et al. [1] utilize generalized method of moments (GMM) estimation to analyze the contagion effects of international capital flows across 49 emerging and developing economies from 1980 to 2009, showing that portfolio and other investments are more prone to contagion than direct investment, particularly within regions such as East Asia, Latin America, and Eastern Europe. Rey [2] studies the relationship between cross-border capital flows within and across major geographic regions using correlation coefficients, observing a strong positive correlation between North America and Western Europe in both gross capital inflows and outflows, particularly in portfolio and other investments. Puy [18] employs the Bayesian dynamic latent factor model to demonstrate the clustering of international portfolio investment within regions, while the IMF [19] notes that since the COVID-19 pandemic, international capital flows have exhibited fragmented clustering due to uneven regional recoveries.
Another set of studies focuses on the direction of contagion and extreme movements in international capital flows [3,5,20]. For example, Xu et al. [3] apply the fuzzy dynamic system model to analyze the contagion phenomenon of “surges” in net international capital flows, revealing that financial shocks are transmitted through these channels to other countries, resulting in increased co-movements of net capital flows. They identify six distinct patterns of contagion, including both expansionary and contractionary types, indicating that the effects of contagion can manifest as either positive or negative co-movements. Forbes and Warnock [5] employ the cloglog regression model to study extreme movements in international capital flows from 1978 to 2020, finding that after the 2008 financial crisis, the incidence of extreme capital flow episodes shifted from “waves” to “ripples”, with significant contagion effects among geographically proximate countries, particularly in cross-border bank flows. Gori et al. [20] use panel data and network analysis to explore capital flow deflection, whereby the introduction or tightening of capital controls in one economy tends to increase capital inflows to other similar borrowing economies. Their findings suggest that portfolio investment and bank credit are the main drivers of this effect, with international investors adjusting their capital flows in response to capital control policies—investors in developed economies shift towards portfolio equity investments, while banks in emerging market economies tend to redirect bank-related flows. The study further suggests that enhanced international coordination of capital account policies can mitigate the negative impacts of capital flow deflection.
Additionally, Correa et al. [21] and Agénor et al. [22] focus on the contagion effects of cross-border bank flows. Correa et al. [21], using regression analysis, conclude that banks in peripheral countries (such as Brazil, China, and India) face higher default risks and regulatory obstacles, making them more sensitive to external shocks (such as global bank credit shocks), leading to greater spillover effects. Agénor et al. [22], through the dynamic stochastic general equilibrium model, argue that when the source country’s monetary policy is relatively tight, banks channel funds to safer foreign counterparties, with this cross-border credit reallocation being particularly pronounced in banks with lower capital reserves.
The third category explores the factors influencing the co-movements of capital flows among economies, which can be categorized into global, country-specific, and regional factors [5,23,24]. First, changes in the global economic environment—such as global economic growth rates, international interest rates, and geopolitical risk levels—can exert common influences on multiple countries, leading to similar adjustments in their economic and financial markets, thus causing co-movements in cross-border capital flows [10,23,25,26,27,28,29,30]. For example, Amiti et al. [27] apply weighted least squares regression to quarterly data on consolidated foreign claims—including loans, debt securities, and other financial claims—by banks headquartered in 31 countries on counterparties in over 200 countries from 2000 to 2017. Their findings indicate that during non-crisis periods, international bank flows are primarily influenced by common global factors, particularly the global financial cycle. Koepke [28] reviews the empirical literature on the drivers of capital flows to emerging markets and concludes that, based on the traditional “push” and “pull” framework, push factors (typically external) such as global risk aversion and U.S. interest rates have the greatest impact on bond and equity portfolio flows, with a slightly smaller effect on bank flows.
Second, differences in countries’ economic fundamentals—such as economic growth, interest rates, inflation, capital account openness, and financial market development—affect the direction and scale of capital flows among economies, thereby influencing the co-movements of volatility in capital flows [1,3,28,31]. Xu et al. [3], using panel data analysis, find that countries more closely linked to the source of financial shocks and those with lower investor confidence are more vulnerable to contagion, while countries with greater economic resilience are better able to mitigate such shocks. Koepke [28] concludes that domestic output growth and asset returns significantly influence capital flows into emerging markets. Pagliari and Hannan [31] employ panel regression analysis to explore the determinants of capital flow volatility in emerging markets and developing economies (EMDEs). Their results suggest that when economic fundamentals in emerging markets are similar—particularly when characterized by rapid growth, high interest rates, and open capital accounts—these economies attract greater capital inflows, intensifying the co-movement of capital flow volatility.
Finally, regional factors also play a crucial role. Capital flow volatility in one country can trigger corresponding movements in neighboring countries [5]. Within economic unions, shared macroeconomic policies and capital flow management practices can lead to the contagion of capital flow volatility among member economies [20,24]. For instance, Ftiti et al. [24] utilize panel regression analysis to study the drivers of international capital flows from a regional perspective, analyzing the cases of BRICS and European countries. They find that BRICS countries’ capital flows are primarily characterized by inflows, while European countries are predominantly characterized by outflows. This difference may stem from BRICS countries’ greater attractiveness to foreign investment, while European countries have stronger capacities for outbound investments.
Although existing research has extensively examined the volatility of international capital flows, several gaps remain to be addressed. Firstly, current research on international capital flow networks primarily concentrates on portfolio and bank investments, neglecting the integration of direct investment. This results in a significant gap in understanding of the comprehensive co-movement characteristics of capital flow volatility. Moreover, the direction of volatility co-movements in international capital flows is often overlooked, despite studies by Xu et al. [3] and Gori et al. [20] on positive and negative movements, as well as capital flow deflection effects (not co-movement direction). A more detailed analysis of the co-movement dynamics, including network structure changes, core economies’ roles, and regional distributions, is needed. Finally, research on regional factors that affect international capital flow co-movements focus mainly on geographic proximity, ignoring the impact of economic organizations [24]. The influence of common economic organization membership on net international capital flow volatility co-movements is yet to be fully investigated.
Based on the literature and analysis above, we select net capital flows over gross flows to examine the characteristics and determinants of their volatility co-movement, as net capital flows better capture the direction and fluctuations of capital flows, reflecting relatively precise trends and providing more practical reference for macroeconomic policymakers. To this end, we posit the following research hypotheses:
Hypothesis 1 (H1).
Economies with similar external market expectation characteristics tend to exhibit similar features in their capital flows (positive co-movement), whereas economies with opposing external market expectation characteristics tend to display different, and even opposite, features in their capital flows (negative co-movement).
Hypothesis 2 (H2).
The external market expectation can be captured to some extent by net international capital flows.
Hypothesis 3 (H3).
The factors driving the co-movements of volatility in net international capital flows differ across capital flow types and exhibit heterogeneity between developed and emerging economies.
Our research makes several contributions. To start with, we introduce a novel approach using Spearman correlation coefficients to measure the co-movement of volatility in net capital flows. This approach considers both the magnitude and direction of volatility and is not constrained by the normal distribution assumption like the Pearson method. Then, this paper offers a comprehensive and in-depth analysis of the co-movement characteristics of volatility in net capital flows using network analysis, examining different types of net capital flows, various time periods, and diverse co-movement directions. Furthermore, our analysis of the factors influencing the co-movement of volatility in net international capital flows is more detailed and multidimensional. We examine both net capital flows and its subtypes, different types of economies, and various regional factors. Finally, the Multiple Regression Quadratic Assignment Procedure (MRQAP), specifically designed for relational data, is employed to analyze the influencing factors, overcoming the limitations of linear regression and thereby enhancing the reliability of our findings.

3. Methodology and Data

3.1. Methodology

To better measure the volatility of net international capital flows, each country’s net cross-border capital flow is divided by the corresponding period’s GDP for normalization. Subsequently, the standard deviation of these normalized capital flows over a 5-year rolling window is computed as Equation (1) [1,32].
CFV i , t = 1 n k = t ( n 1 ) t ( CF i , k GDP i , k μ ) 2
where μ = 1 n k = t ( n 1 ) t CF i , k GDP i , k , CF i , k represents the net cross-border capital flow for country i in period k. GDP i , k is the corresponding GDP of country i at period k. For a 5-year time window, the number of quarters n = 20 . CF i , k GDP i , k is the normalization of CF i , k , and CFV i , t is the estimate of the volatility in net cross-border capital flows for country i in period t.
Similarly, we further categorize net cross-border capital flows into direct investment ( FDI i , k ) , portfolio investment ( PI i , k ) , and other investment ( O I i , k ) , then measure the volatility of each subtype. These are denoted as FDIV i , t , PIV i , t , and OIV i , t , respectively. As detailed in Equations (2)–(4)
FDIV i , t = 1 n k = t ( n 1 ) t ( FDI i , k GDP i , k μ FDI ) 2 ,
PIV i , t = 1 n k = t ( n 1 ) t ( PI i , k GDP i , k μ PI ) 2 ,
OIV i , t = 1 n k = t ( n 1 ) t ( OI i , k GDP i , k μ OI ) 2 ,
This paper utilizes the Spearman correlation coefficient to measure the co-movement of volatility in net international capital flows. The Spearman method, being rank-based, is suitable for our analysis as it does not rely on the normality and linearity assumptions like the Pearson method, ensuring a more precise and reliable estimate of co-movement in net capital flow volatility.

3.2. Data

We analyze the co-movement of volatility in net cross-border capital flows among 46 economies (including 22 emerging and developing economies and 24 advanced economies; see Appendix A) from 2000Q1 to 2020Q4, selecting economies with Spearman correlation coefficients significant at the 0.05 and 0.01 levels as samples. The post-2020 period is excluded due to abnormal fluctuations in net cross-border capital flows caused by the COVID-19 pandemic and increasing geopolitical risks, which could potentially distort long-term trend analysis and limit the reliability of our findings. Data on net international capital flows and its subtypes are obtained from the IMF Balance of Payments Database, while national-level data, such as GDP, are sourced from the CEIC Database.

4. Co-Movement Characteristics of Volatility in Net International Capital Flows: A Network Analysis Approach

This section utilizes network analysis to analyze the co-movement characteristics in the volatility of net international capital flows and its subtypes. We construct an undirected network with 46 economies as nodes and their correlations as edges. Following the method of [33], this paper defines the period from the third quarter of 2008 to the second quarter of 2009 as the 2008 international financial crisis period. Thus, the analysis considers three periods: the entire sample period (2000Q1–2020Q4), pre-2008 financial crisis (2000Q1–2008Q2), and post-2008 financial crisis (2009Q3–2020Q4).
Following the work of previous researchers [7,9,14,15], we adopt four key network indicators for analysis in this paper, i.e., average degree, network density, clustering coefficient, and average path length. Average degree represents the mean number of linkages per node, quantifying the co-movements in the volatility of net capital flows between economies. A higher average degree indicates greater co-movement, while a lower degree suggests fewer linkages. Network density measures the ratio of actual connections to possible connections within the network. A density closer to 1 reflects a more tightly connected network, whereas a lower density indicates a more dispersed structure. The clustering coefficient represents the proportion of actual connections between a node’s neighbors relative to all possible connections, reflecting the likelihood that economies connected to the same economy are also interconnected. A higher clustering coefficient suggests stronger clustering within the network, indicating more pronounced co-movement of volatilities in capital flows among economies. Finally, average path length captures the average shortest distance between any two nodes, indicating the number of intermediary economies required for two economies to have linkage in their capital flow volatilities.

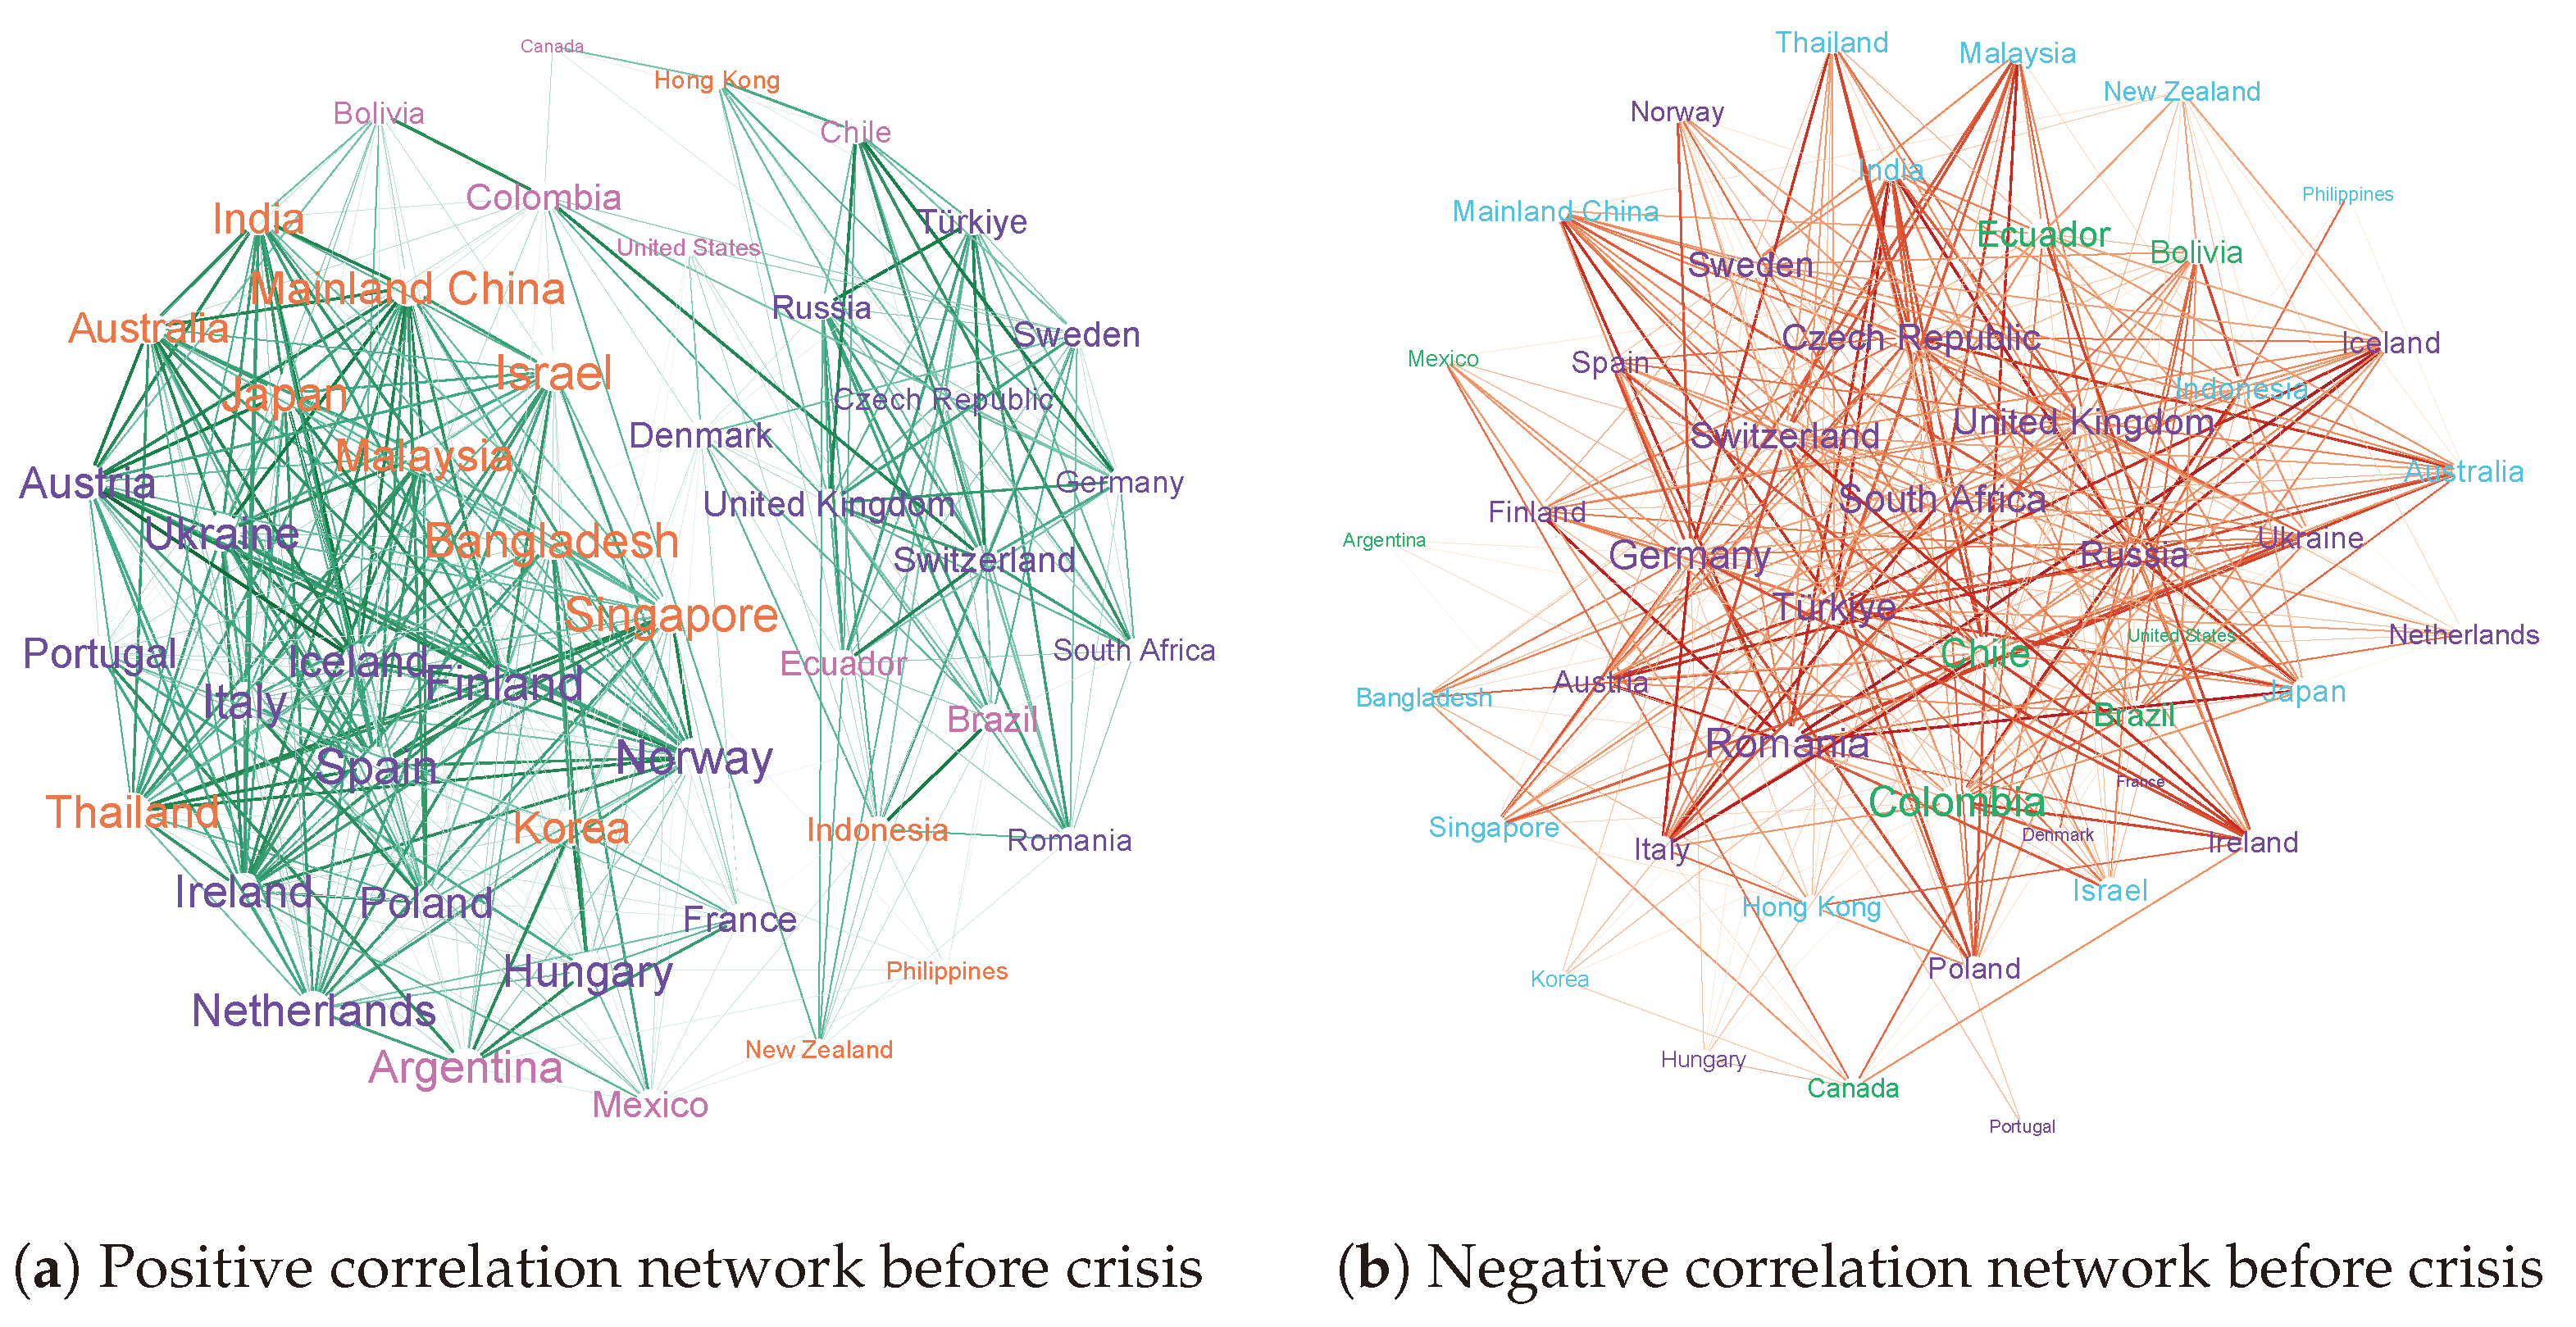
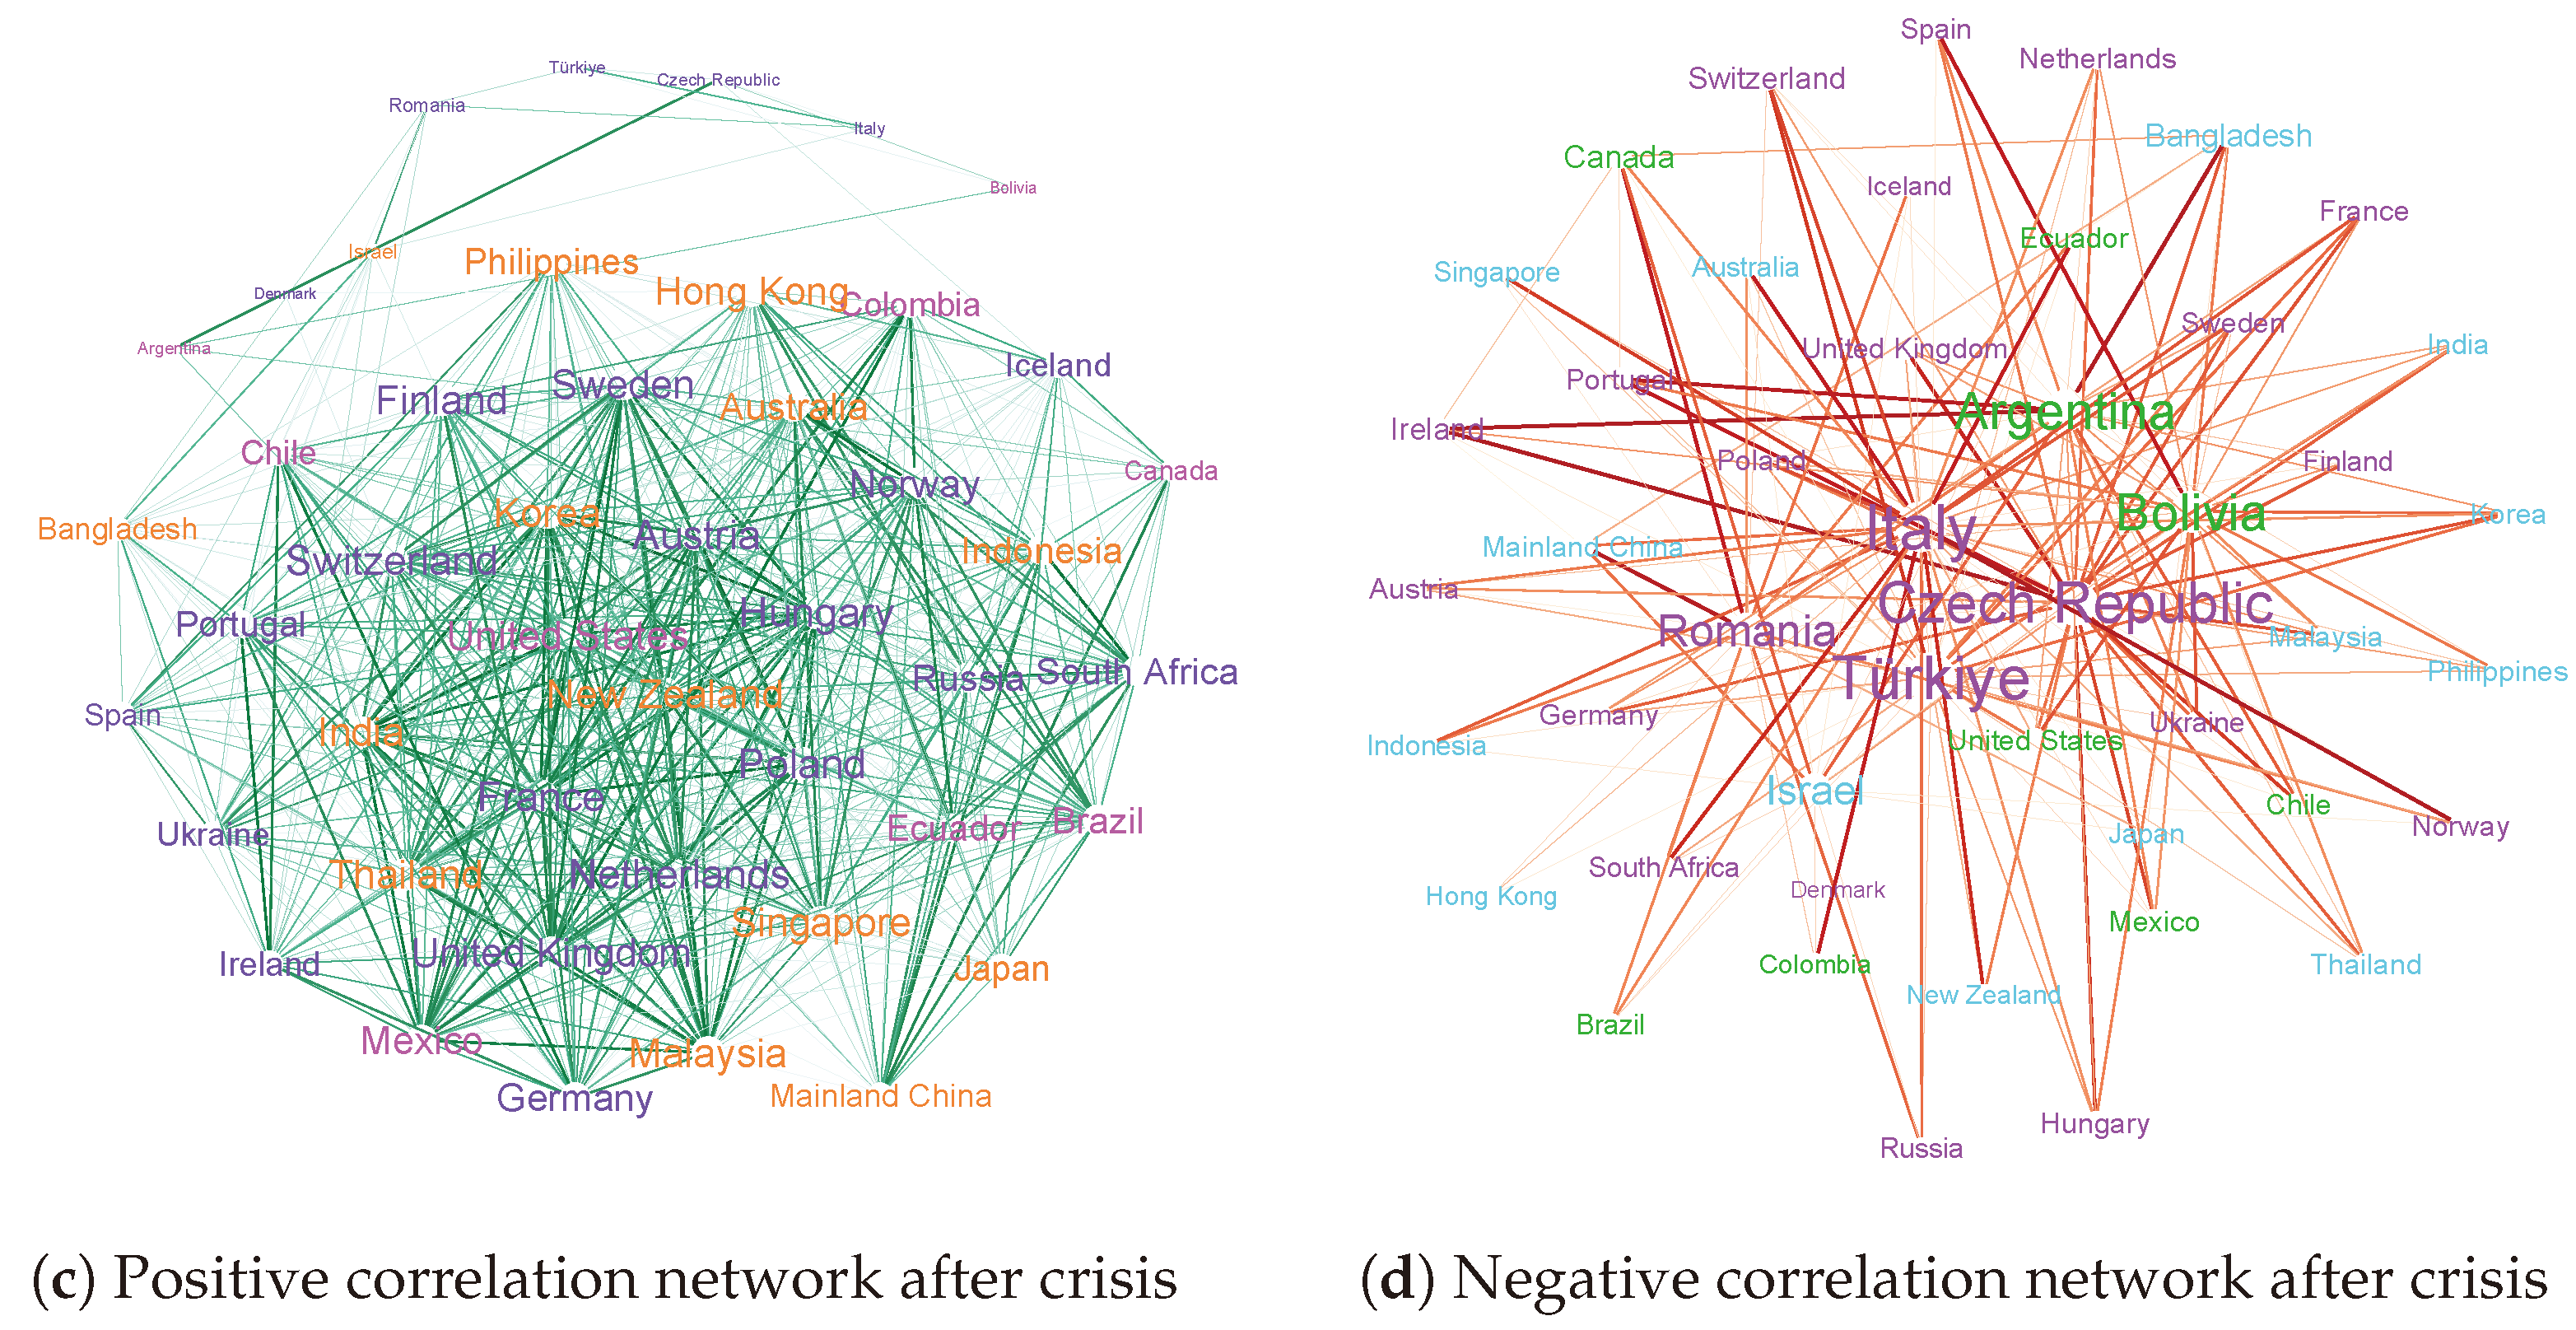
4.1. Co-Movement Characteristics of Volatility in Net Private Capital Flows

This subsection discusses the characteristics of the co-movement network in net private capital flow volatility among 46 economies (see Table 1). From 2000 to 2020, the network exhibits a high average degree (30.696) and density (0.682), indicating that significant co-movement of volatility in net private capital flows exists among most economies. The short average path length (1.3179) and high clustering coefficient (0.724) suggest a “small-world” network structure. This implies rapid transmission of volatility in net private capital flows among most economies, reflecting their strong financial linkages. These co-movement characteristics intensified after the 2008 financial crisis, with an increased average degree, density, and clustering coefficient, alongside a shorter average path length (see Table 1). This reveals a more pronounced “small-world” effect in the post-crisis network.
Further analysis investigates the characteristics of positive (positive correlation network) and negative (negative correlation network) co-movement in net private capital flow volatility among economies before and after the 2008 financial crisis (refer to Figure 1). Firstly, after the crisis, the average degree and network density increased due to a rise in positive co-movement exceeding the decline in negative co-movement. Moreover, core nodes in the positive correlation network include the United States, France, Switzerland, the Netherlands, Singapore, Malaysia, Thailand, and South Korea. In the negative correlation network, core nodes comprise Italy, the Czech Republic, Argentina, Canada, Ireland, Switzerland, China, and India. Finally, in the period before the crisis, highly positive and negative co-movements are primarily observed between developed European economies and emerging economies in the Asia-Pacific and Latin American regions (e.g., Ireland and India, Finland and Chile). After the crisis, highly positive co-movement is mainly observed among developed European economies and among developed Asia-Pacific economies. Highly negative co-movement is mainly found between developed Asia-Pacific economies and developed European economies (e.g., Denmark with both Australia and Singapore). The similar economic structures, mature financial markets, and high levels of economic development among developed European economies make them more susceptible to common external factors, such as global cycles, monetary policy changes, and international market fluctuations [18,27]. Moreover, regional economic unions further enhance the synchronization of capital flows across these economies [24]. This phenomenon also explains the highly synchronous co-movement of capital flow volatility observed among the developed economies in the Asia-Pacific region. When investors perceive divergent economic prospects, risk appetites, or policy directions between developed Asia-Pacific economies and developed European economies, they may reallocate their investments accordingly, leading to capital flows moving in opposite directions [5,24]. For instance, if investors anticipate stronger economic growth or favorable policy changes in European developed economies relative to their Asia-Pacific counterparts, they may shift their investments from the Asia-Pacific region to Europe.

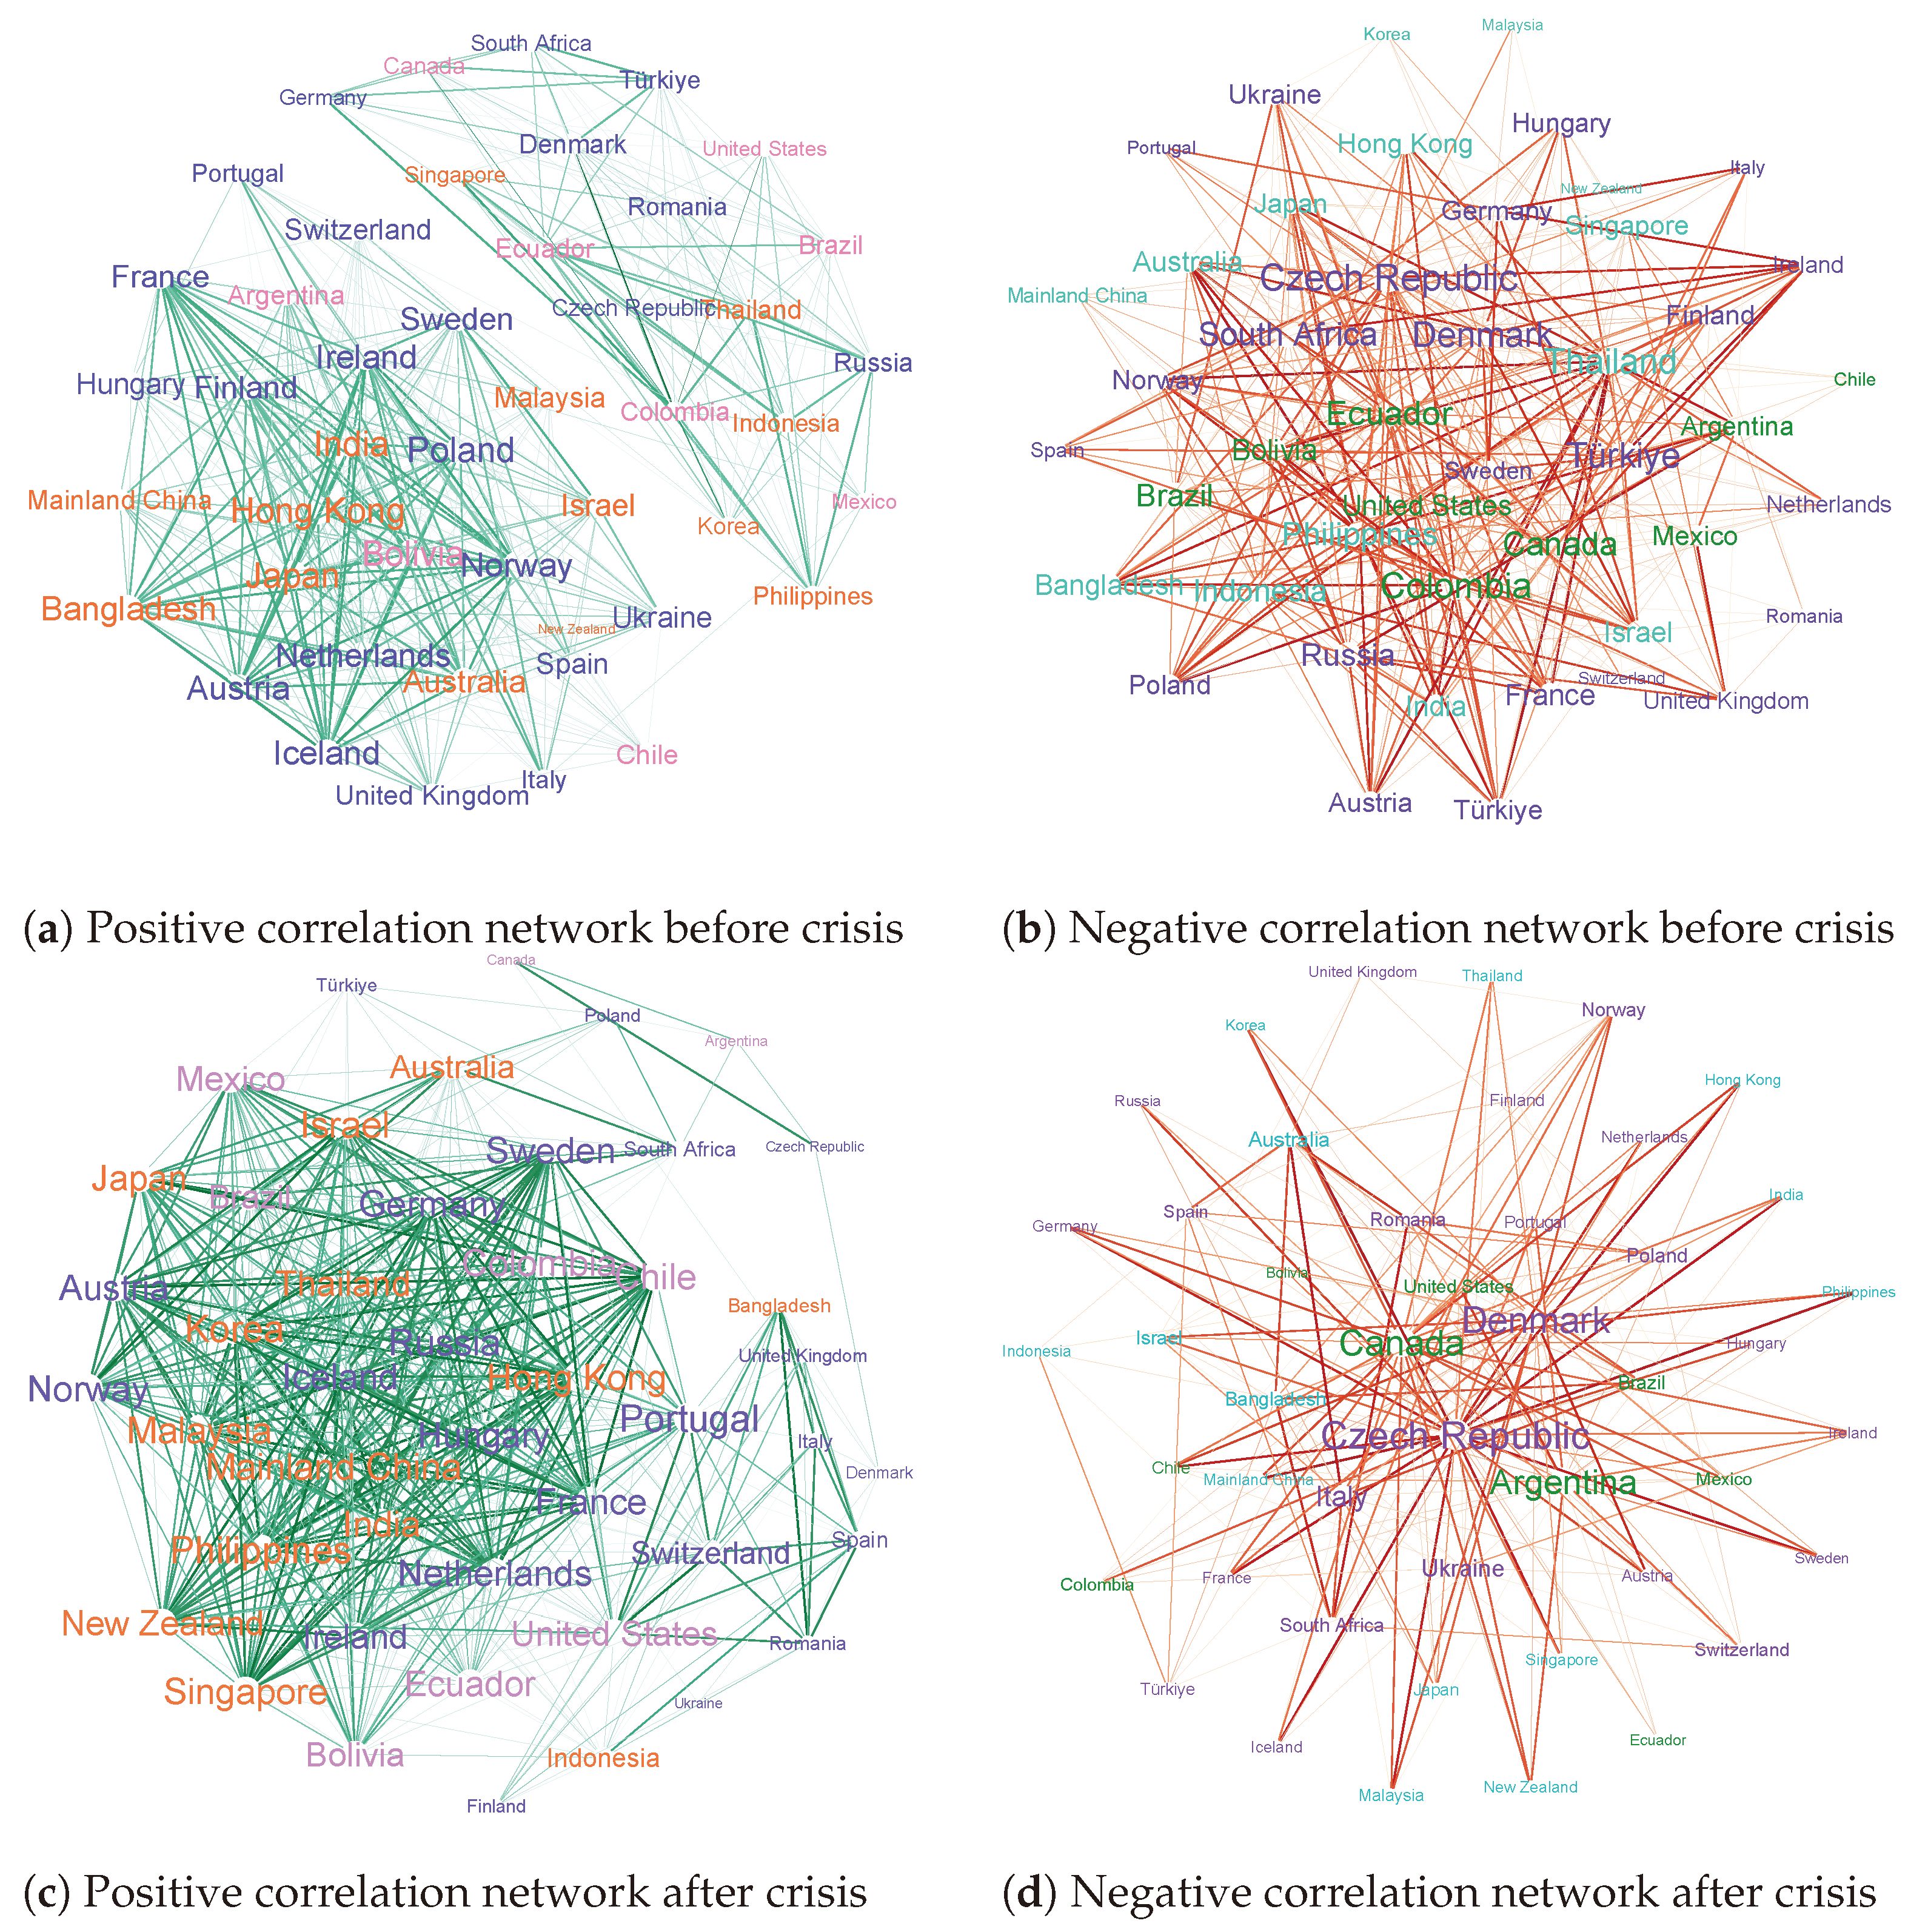
4.2. Co-Movement Characteristics of Volatility in Net Direct Investment Flows

Next, we move on to categorizing net capital flows and begin by analyzing the characteristics of the co-movement network in net direct investment flow volatility among 46 economies (see Table 2). From 2000 to 2020, the network demonstrates substantial co-movement of volatility in net direct investment flows among the majority of economies, as evidenced by the high average degree (31.826) and density (0.707). This is further highlighted by a pronounced “small-world” effect, characterized by a high clustering coefficient of 0.758 and a short average path length of 1.2928. However, the connectivity and transmission capacity within the network weakened after the 2008 crisis. This may be caused by increased investor caution post-crisis, prioritizing economic stability and growth prospects in investment destinations.
Further analysis examines the characteristics of positive (positive correlation network) and negative (negative correlation network) co-movement in net direct investment flow volatility among economies before and after the 2008 financial crisis (refer to Figure 2). Firstly, after the crisis, the average degree and network density decreased due to reduced positive co-movement, which surpassed the increase in negative co-movement. Secondly, Canada, the Netherlands, Norway, Sweden, and India are central in the positive correlation network, while the United Kingdom, Germany, France, Ireland, Poland, and Thailand are central in the negative correlation network. Finally, before the crisis, highly positive co-movement was primarily observed among developed economies, and between developed European economies and emerging economies. After the crisis, this shifted to being primarily among developed European economies (e.g., the Netherlands and Norway, Switzerland and France). Highly negative co-movement was mainly found between developed economies and emerging economies in the Asia-Pacific and the Americas before the crisis, which changed to being primarily among developed European economies and among developed Asia-Pacific economies post-crisis (e.g., Switzerland and Portugal, Hong Kong and South Korea). Increased economic uncertainty and investor caution after the crisis may have driven direct investment towards stable and well-developed markets, thereby enhancing the correlation of direct investment volatility among developed economies.

4.3. Co-Movement Characteristics of Volatility in Net Portfolio Investment Flows

The characteristics of the co-movement network in net portfolio investment flow volatility from 2000 to 2020, as shown in Table 3, reveal a high average degree (31.174) and network density (0.693). These findings demonstrate significant co-movement of volatility in net portfolio investment flows across the majority of economies. The network’s high clustering coefficient (0.731) and short average path length (1.3072) suggest a notable “small-world” pattern. After the 2008 global financial crisis, the characteristics of interconnection and “small-world” pattern became even more pronounced.
Further analysis investigates the characteristics of positive (positive correlation network) and negative (negative correlation network) co-movement in net portfolio investment flow volatility before and after the 2008 financial crisis (refer to Figure 3). Firstly, the increased average degree and density of the network post-crisis are attributed to a rise in both positive and negative co-movement of volatility in net portfolio investment flows among economies. Moreover, core nodes in the positive correlation network mainly include the United States, France, Switzerland, The Netherlands, Singapore, Malaysia, Thailand, and South Korea. The negative correlation network identifies Italy, the Czech Republic, Argentina, Bolivia, Romania, Canada, Ireland, Switzerland, China, and India as core nodes. Finally, before the crisis, highly positive co-movement is primarily observed between developed European and Asia-Pacific economies (e.g., Iceland and Japan, Norway and Singapore). After the crisis, this co-movement was mainly found between developed and emerging European economies (e.g., Austria and Poland, France and Hungary). Highly negative co-movement, chiefly found between developed and emerging European economies before the crisis, changed to between developed European economies and emerging Latin American economies after the crisis. Pre-crisis negative co-movement may be driven by differences in economic cycles within Europe. After the 2008 financial crisis, the slow recovery in Europe and the economic growth potential of Latin America fostered stronger negative co-movement between these regions.

4.4. Co-Movement Characteristics of Volatility in Net Other Investment Flows

The analysis of the characteristics of the co-movement network in net other investment flow volatility from 2000 to 2020 (see Table 4) indicates a high average degree of 31.696 and a large network density of 0.704, highlighting substantial co-movement of volatility in net other investment flows across most economies. The network also displays a strong “small-world” structure, characterized by a high clustering coefficient (0.752) and a short average path length (1.2957). Post-crisis, the characteristics of interconnection and “small-world” effect weakened. It suggests a decline in the co-movement of volatility in net other investment flows and a slower transmission of this volatility.
Further analysis reveals the characteristics of positive (positive correlation network) and negative (negative correlation network) co-movement in net other investment flow volatility among economies before and after the 2008 financial crisis (refer to Figure 4). Firstly, both the average degree and network density decreased, primarily due to a reduction in negative co-movement that outweighed the increase in positive co-movement. Furthermore, core nodes in the positive correlation network transitioned from developed European economies before the crisis to being dominated by economically robust Asia-Pacific economies after the crisis. In the negative correlation network, these are initially emerging economies in the Asia-Pacific and Latin American regions, shifting to primarily include the United States, Canada, and developed European economies after the crisis. Finally, highly positive co-movement, mainly concentrated among developed European economies before the crisis, changed to occur between developed Asia-Pacific economies and emerging economies in the Asia-Pacific and Latin American regions after crisis. Economies with high negative co-movement, initially predominantly observed between developed European economies and emerging economies in the Asia-Pacific and Latin America, transitioned post-crisis towards interconnections between developed European and Asia-Pacific economies, and among developed European economies themselves. Pre-crisis negative co-movement between developed and emerging economies in the Asia-Pacific and Latin America were likely driven by differences in economic cycles and monetary policies. After the 2008 financial crisis, developed economies in the Asia-Pacific region, experiencing robust economic growth, attracted capital inflows, while some European developed economies faced uncertain recovery prospects, leading to increased capital outflows. This resulted in a higher degree of negative correlation in other investment volatility between developed economies in the Asia-Pacific and Europe.

5. Factors Influencing the Co-Movement of Volatility in Net International Capital Flows—Based on the MRQAP Method

5.1. Model Construction

Building on the above analysis, this paper investigates the impact of trade linkages, economic fundamental differences, and regional factors on the co-movement of volatility in net cross-border capital flows among economies. The constructed model is as follows:
CFV i j , t = f ( Trade i j , t 1 , GDP i j , t 1 , Infr i j , t 1 , CapC i j , t 1 , Polr i j , t 1 , Eadj t 1 , Gadj t 1 )
where i and j represent economies and t denotes time. The dependent variable CFV i j , t signifies the correlation of net capital flow volatility between economies i and j at time t. The model also examines the factors influencing the co-movement of volatility in subtypes of net capital flows among economies, covering direct investment, portfolio investment, and other investment.
Independent variables include measures of trade relations, economic fundamentals, and regional factors. Trade intensity ( Trade ) is measured using the Spearman correlation coefficient of normalized net export sizes. Differences in economic fundamentals are captured by GDP growth rates ( GDP ), CPI inflation rates ( Infr ), the Chinn–Ito capital account openness index ( Capc ), and policy interest rates ( Polr ). Regional factors are represented by two dummy variables: economic organization ( Eadj ), which is equal to 1 if both economies belong to the same organization, and 0 otherwise; and geographical adjacency ( Gadj ), which is equal to 1 if both economies are geographically adjacent, and 0 otherwise. All independent variables are lagged by one period to tackle the problem of endogeneity.
Regarding the selection of empirical methods, the dependent variable in Model (5) is the correlation coefficient of cross-border capital flow volatility among economies, which represents a typical relational variable. Likewise, the independent variables are also relational data, making multicollinearity a common issue. Current regression methods for addressing multicollinearity include Ordinary Least Squares (OLS), Ridge Regression, Lasso Regression, Principal Component Regression (PCR), Partial Least Squares Regression (PLS), and the Multiple Regression Quadratic Assignment Procedure (MRQAP). Although OLS is simple and easy to implement, the presence of multicollinearity can increase the variance of parameter estimates, leading to unstable results. Ridge Regression enhances estimation robustness by introducing penalty terms, but the selection of these penalty terms can be subjective and may compress coefficients, leading to underestimation. Lasso Regression can automatically select variables to address multicollinearity, but when there are many variables, it may overlook the contributions of other important variables. PCR eliminates multicollinearity through dimensionality reduction but sacrifices model interpretability. PLS combines the advantages of principal component analysis and regression analysis, maintaining predictive performance, but its computational process is more complex and sensitive to outliers. In contrast, MRQAP is particularly well suited for analyzing regression relationships between a dependent variable matrix and multiple independent variable matrices. Its permutation test allows for more reliable significance testing in the presence of multicollinearity and autocorrelation, especially when dealing with network data or other relational data with dependent structures. However, the MRQAP regression method has three main limitations: (1) It is highly sensitive to autocorrelation in the data. When there is strong autocorrelation among independent variables, MRQAP may lead to increased errors, affecting the accuracy of the results [34]. (2) MRQAP is also sensitive to multicollinearity, and appropriate methods, such as the Freedman–Lane method or Double Semi-Partialing method, should be employed to effectively control the impact of multicollinearity and achieve more accurate results [34]. (3) MRQAP is primarily designed for static, matrix-form data and struggles to handle dynamic networks or time-varying data [35].
Thus, this paper adopts the Double Semi-Partialing method proposed by Dekker et al. [34] (2007) for MRQAP regression analysis to investigate the factors influencing the co-movement of international capital flow volatility. Applying the Double Semi-Partialing method in MRQAP regression significantly enhances the explanatory power of the MRQAP model in addressing multicollinearity and autocorrelation issues, making the analysis more robust and reliable. This improvement is mainly attributed to the following factors: (1) It reduces the impact of multicollinearity on the results by applying partial regression to the covariates. (2) It eliminates the shared variance among the independent variables, thereby reducing the dependency between them and clarifying the independent contribution of each variable. (3) It provides a more robust test of the independent contribution of the independent variables to the dependent variable, particularly in datasets where multicollinearity and autocorrelation are significant. Additionally, given the dynamic nature of the independent variables in this paper, we follow the approach of [36] by calculating the average values of the indicators for each economy over the sample period and constructing a difference matrix based on the absolute differences between these average values across economies.

5.2. Baseline Results

Analysis of factors influencing the co-movement of volatility in net cross-border capital flows among economies (see Table 5) reveals several key findings. Firstly, stronger trade intensity significantly increases the co-movement of volatility in net private capital flows, as well as in net other investment flows, but decreases the co-movement of volatility in net direct investment flows. This phenomenon may result from investors’ improved understanding of each economy’s development, leading to more stability in direct investment among economies. Moreover, concerning economic fundamentals: (1) Differences in GDP growth rate between economies have a significant negative impact on the co-movement of volatility in net portfolio investment flows. (2) Interest rate differentials negatively affect the co-movement of volatility in net private capital flows, as well as in net other investment flows. (3) Differences in capital control levels between economies have a significant positive effect on the volatility co-movement of net private capital flows, and this positive effect also applies to net portfolio investment flows. However, those differences have a significant negative impact on the volatility co-movement of net direct investment flows, and this negative impact also holds for net other investment flows. These may be attributed to economies with stricter capital controls that limit cross-border direct investment and other investment, while economies with more open capital markets have increased cross-border inflows [1]. Finally, geographical adjacency or membership in the same economic organization enhances the co-movement of volatility in net private capital flows and the co-movement of volatility in net other investment flows, due to closer economic linkages and policy coordination.

5.3. Heterogeneity Analysis

We further categorize the sampled economies into emerging and developing economies, as well as advanced economies. An analysis of factors influencing the co-movement of volatility in net cross-border capital flows among emerging and developing economies (see Table 6) reveals several key findings. Firstly, increased trade intensity between economies strengthens co-movement of volatility in net private capital flows but weakens it in net direct investment flows, as well as net portfolio investment flows. This is mainly because strong trade intensity promotes frequent exchange of goods and services, enhancing correlations in private capital flows among emerging and developing economies. Meanwhile, firms with close trade linkages may pursue cost-reducing direct investments, which tend to be more stable and thus dampen co-movement of volatility in these flows. Close trade ties also foster familiarity between economies and enable investors to better manage financial risks, reducing speculative capital fluctuations and decreasing co-movement of volatility in portfolio investments. Secondly, concerning economic fundamentals: interest rate spreads between economies negatively impact the volatility co-movement of net private capital flows, while capital control differentials negatively impact that of net other investment flows. Finally, regarding spatial regions: (1) geographic adjacency among emerging and developing economies enhances the co-movement of volatility in net direct investment flows, as well as in net other investment flows. (2) Membership in the same economic organization significantly increases the co-movement of volatility in net private capital flows.
Analysis of factors influencing the co-movement of volatility in net cross-border capital flows among developed economies (see Table 7) also indicates several key findings. Firstly, trade intensity among developed economies shows no significant impact on the co-movement of volatility in overall and specific types of net cross-border capital flows. This could be attributed to the diversified channels of capital flow among developed economies, including bilateral trade, multilateral investment cooperation, and the effect of global financial centers, which weaken the influence of trade linkages. Secondly, concerning economic fundamentals: (1) GDP growth among developed economies negatively impacts the co-movement of volatility in net private capital flows. Capital control differentials positively impact the co-movement of volatility in these flows; this positive effect also holds for net portfolio investment flows. (2) Moreover, interest rate spreads negatively affect the co-movement of volatility in net portfolio investment flows, as well as in net other investment flows. (3) Inflation differentials have a positive impact on volatility co-movement of net other investment flows but a negative impact on the co-movement of volatility in net direct investment flows. This may be because of the similarity in inflation rates among developed economies, which are indicative of comparable economic conditions and leading economies to make similar decisions about direct investments, thereby increasing the co-movement of volatility in direct investments. Finally, geographic adjacency among developed economies significantly reduces the co-movement of volatility in net portfolio investment flows, while the influence of economic organization factor is not significant.

6. Conclusions

This paper investigates the characteristics and influencing factors of volatility co-movement in net cross-border capital flows among 46 major global economies. The key research findings are as follows:
Firstly, our analysis indicates that the co-movement of volatility in net capital flows is prevalent across economies, with the network exhibiting a significant “small-world” feature. This suggests rapid contagion of risks in net capital flows among economies. These patterns are also observed across the subtypes of net capital flows.
Moreover, significant regional disparities are observed in the highly positive and negative co-movements of volatility in net international capital flows. For example, after the 2008 financial crisis, developed European economies exhibit a highly positive co-movement of volatility in net portfolio investment flows with emerging European economies, while displaying a strong negative co-movement with emerging Latin American economies.
Finally, analysis of influencing factors reveals that when economies belong to the same economic organizations, share geographical adjacency, exhibit strong trade intensity, and have similar interest rate levels, these factors significantly increase the co-movement of volatility in net private capital flows, as well as in net other investment flows. Economic growth differentials negatively impact the co-movement of volatility in net portfolio investment flows. Among emerging and developing economies, those with strong trade intensity and membership in the same economic organizations significantly enhance the co-movement of volatility in net private capital flows. Among developed economies, economic growth differentials negatively impact the co-movement of volatility in net private capital flows, while differences in capital controls have a positive impact.
This study has several limitations, primarily stemming from the data requirements inherent in Social Network Analysis (SNA) models, which need to be acknowledged. First, traditional SNA methods predominantly focus on static networks, analyzing relationship structures at specific points in time or within fixed periods. This approach makes it challenging to effectively capture the dynamic evolution of network structures (Li et al., 2022 [35]). Moreover, because SNA models rely on relational data, global variables such as economic growth rates and inflation levels cannot be directly incorporated as independent variables. As a result, this study was unable to include these global factors in its analysis of the drivers of co-movement. Future research should integrate global variables with relational data between economies to explore their combined effects on the co-movement of international capital flow volatility, enabling a more comprehensive understanding of the underlying drivers. Additionally, future studies should construct and compare co-movement networks of international capital flow volatility across different time periods to better capture the dynamic mechanisms and evolutionary characteristics of these networks.

Author Contributions

Conceptualization, H.L. and J.T.; methodology, H.L. and J.T.; software, H.L.; validation, H.L.; formal analysis, H.L.; investigation, H.L. and J.T.; resources, H.L.; data curation, H.L.; writing—original draft preparation, H.L.;writing—review and editing, H.L.and J.T.; visualization, H.L.and J.T.; supervision, J.T.; project administration, J.T.; funding acquisition, H.L. All authors have read and agreed to the published version of the manuscript.

Funding

This research received no external funding.

Institutional Review Board Statement

Not applicable.

Informed Consent Statement

Not applicable.

Data Availability Statement

Readers who wish to obtain the data used in this study can contact the corresponding author.

Conflicts of Interest

The authors declare no conflicts of interest.

Abbreviations

The following abbreviations are used in this manuscript:
MRQAPMultiple Regression Quadratic Assignment Procedure.

Appendix A

Table A1. The list of sampled economies.
Emerging and Developing Economies (21)Advanced Economies (25)
Asia-Pacific
Region
The Americas
Region
European
Region
Africa
Region
Asia-Pacific
Region
The Americas
Region
European
Region
Mainland ChinaArgentinaHungarySouth AfricaHong Kong, ChinaUnited StatesAustria
IndiaBoliviaPoland JapanCanadaCzech Republic
BangladeshBrazilRomania Korea Denmark
IndonesiaChileRussia Singapore Finland
MalaysiaColombiaTürkiye Israel France
PhilippinesEcuadorUkraine Australia Germany
ThailandMexico New Zealand Iceland
Ireland
Italy
The Netherlands
Norway
Portugal
Spain
Sweden
Switzerland
United Kingdom

References

  1. Lee, H.H.; Park, C.Y.; Byun, H.s. Do contagion effects exist in capital flow volatility? J. Jpn. Int. Econ. 2013, 30, 76–95. [Google Scholar] [CrossRef]
  2. Rey, H. Dilemma Not Trilemma: The Global Financial Cycle and Monetary Policy Independence; Technical Report; National Bureau of Economic Research: Cambridge, MA, USA, 2015. [Google Scholar]
  3. Xu, X.; Zeng, Z.; Xu, J.; Zhang, M. Fuzzy Dynamical System Scenario Simulation-Based Cross-Border Financial Contagion Analysis: A Perspective From International Capital Flows. IEEE Trans. Fuzzy Syst. 2017, 25, 439–459. [Google Scholar] [CrossRef]
  4. Peng, D.; Ye, Y.; Chen, Q. Impact of cross-border capital flows on foreign exchange market stability. Financ. Res. Lett. 2024, 62, 105155. [Google Scholar] [CrossRef]
  5. Forbes, K.J.; Warnock, F.E. Capital flow waves—Or ripples? Extreme capital flow movements since the crisis. J. Int. Money Financ. 2021, 116, 102394. [Google Scholar] [CrossRef]
  6. Wang, F.; Pan, C.; Wang, W. Impact of US monetary policy uncertainty on RMB exchange rate volatility: The role of international capital flows. Financ. Res. Lett. 2023, 58, 104582. [Google Scholar] [CrossRef]
  7. Giudici, P.; Spelta, A. Graphical network models for international financial flows. J. Bus. Econ. Stat. 2016, 34, 128–138. [Google Scholar] [CrossRef]
  8. Ahelegbey, D.F.; Giudici, P.; Hashem, S.Q. Network VAR models to measure financial contagion. N. Am. J. Econ. Financ. 2021, 55, 101318. [Google Scholar] [CrossRef]
  9. Minoiu, C.; Reyes, J.A. A network analysis of global banking: 1978–2010. J. Financ. Stab. 2013, 9, 168–184. [Google Scholar] [CrossRef]
  10. Cerutti, E.; Claessens, S.; Ratnovski, L. Global liquidity and cross-border bank flows. Econ. Policy 2017, 32, 81–125. [Google Scholar] [CrossRef]
  11. Mercado, R.; Noviantie, S. Financial flows centrality: Empirical evidence using bilateral capital flows. J. Int. Financ. Mark. Inst. Money 2020, 69, 101255. [Google Scholar] [CrossRef]
  12. Jackson, M.O.; Pernoud, A. Systemic Risk in Financial Networks: A Survey. Annu. Rev. Econ. 2021, 13, 171–202. [Google Scholar] [CrossRef]
  13. Zhao, H.; Li, Y.; Sai, Q.; Ren, Y. Cross-border credit networks, banking risk contagion and suppression effects. Soc. Netw. 2023, 73, 130–141. [Google Scholar] [CrossRef]
  14. Li, S.; Yang, H. Interactions of International Portfolio Flows: An Empirical Study Based on Network Analysis. Procedia Comput. Sci. 2017, 122, 826–833. [Google Scholar] [CrossRef]
  15. Ahn, S.J.; Jung, J.W.; Koo, H.K.; Ahn, S. An analysis of the evolution of global financial network of the coordinated portfolio investment survey. Int. Rev. Financ. 2023, 23, 437–459. [Google Scholar] [CrossRef]
  16. Calvo, S.G.; Reinhart, C. Capital Flows to Latin America: Is There Evidence of Contagion Effects? The World Bank: Washington, DC, USA, 1996. [Google Scholar]
  17. Chuhan, P.; Perez-Quiros, G.; Popper, H. International Capital Flows: Do Short-Term Investment and Direct Investment Differ? World Bank Publications: Washington, DC, USA, 1996. [Google Scholar]
  18. Puy, D. Mutual funds flows and the geography of contagion. J. Int. Money Financ. 2016, 60, 73–93. [Google Scholar] [CrossRef]
  19. Monetary, I.M.F.; Department, C.M. Global Financial Stability Report April 2023: Safeguarding Financial Stability amid High Inflation and Geopolitical Risks; International Monetary Fund: Washington, DC, USA, 2023. [Google Scholar]
  20. Gori, F.; Lepers, E.; Mehigan, C. Capital flow deflection under the magnifying glass. Int. J. Financ. Econ. 2024, 29, 3758–3778. [Google Scholar] [CrossRef]
  21. Correa, R.; Paligorova, T.; Sapriza, H.; Zlate, A. Cross-Border Bank Flows and Monetary Policy. Rev. Financ. Stud. 2021, 35, 438–481. [Google Scholar] [CrossRef]
  22. Agénor, P.R.; Jackson, T.P.; Pereira da Silva, L.A. Global banking, financial spillovers and macroprudential policy coordination. Economica 2023, 90, 1003–1040. [Google Scholar] [CrossRef]
  23. Sarno, L.; Tsiakas, I.; Ulloa, B. What drives international portfolio flows? J. Int. Money Financ. 2016, 60, 53–72. [Google Scholar] [CrossRef]
  24. Ftiti, Z.; Ameur, H.B.; Louhichi, W.; Anastasiou, D.; Awijen, H. Revisiting Capital Flow Drivers: Regional Dynamics, Constraints, and Geopolitical Influences. J. Int. Money Financ. 2024, 142, 103049. [Google Scholar] [CrossRef]
  25. Masson, M.P.R. Contagion: Monsoonal Effects, Spillovers, and Jumps between Multiple Equilibria; International Monetary Fund: Washington, DC, USA, 1998. [Google Scholar]
  26. Ghosh, A.R.; Qureshi, M.S.; Kim, J.I.; Zalduendo, J. Surges. J. Int. Econ. 2014, 92, 266–285. [Google Scholar] [CrossRef]
  27. Amiti, M.; McGuire, P.; Weinstein, D.E. International bank flows and the global financial cycle. IMF Econ. Rev. 2019, 67, 61–108. [Google Scholar] [CrossRef]
  28. Koepke, R. What drives capital flows to emerging markets? A survey of the empirical literature. J. Econ. Surv. 2019, 33, 516–540. [Google Scholar] [CrossRef]
  29. Avdjiev, S.; Gambacorta, L.; Goldberg, L.S.; Schiaffi, S. The shifting drivers of global liquidity. J. Int. Econ. 2020, 125, 103324. [Google Scholar] [CrossRef]
  30. Feng, C.; Han, L.; Vigne, S.; Xu, Y. Geopolitical risk and the dynamics of international capital flows. J. Int. Financ. Mark. Inst. Money 2023, 82, 101693. [Google Scholar] [CrossRef]
  31. Pagliari, M.S.; Hannan, S.A. The volatility of capital flows in emerging markets: Measures and determinants. J. Int. Money Financ. 2024, 145, 103095. [Google Scholar] [CrossRef]
  32. Neanidis, K.C. Volatile capital flows and economic growth: The role of banking supervision. J. Financ. Stab. 2019, 40, 77–93. [Google Scholar] [CrossRef]
  33. Forbes, K.J.; Warnock, F.E. Capital flow waves: Surges, stops, flight, and retrenchment. J. Int. Econ. 2012, 88, 235–251. [Google Scholar] [CrossRef]
  34. Dekker, D.; Krackhardt, D.; Snijders, T.A. Sensitivity of MRQAP tests to collinearity and autocorrelation conditions. Psychometrika 2007, 72, 563–581. [Google Scholar] [CrossRef]
  35. Li, L.; Derudder, B.; Shen, W.; Kong, X. Exploring the dynamics of the disaggregated intercity corporate network in the Yangtze River Delta, China: A relational event approach. J. Geogr. Syst. 2022, 24, 115–140. [Google Scholar] [CrossRef]
  36. Zhang, W.; Zhuang, X.; Lu, Y.; Wang, J. Spatial linkage of volatility spillovers and its explanation across G20 stock markets: A network framework. Int. Rev. Financ. Anal. 2020, 71, 101454. [Google Scholar] [CrossRef]
Figure 1. Correlation network of volatility in net private capital flows among economies. Note: Green and brown edges indicate positive and negative correlations, with darker shades representing stronger relationships. Node size reflects degree centrality (larger nodes denote stronger linkages). Yellow and red nodes represent emerging and developed economies, respectively. In the positive correlation network, purple, orange, and magenta nodes represent the economies of Europe, Asia-Pacific, and the Americas, respectively. In the negative correlation network, these regions are represented by purple, blue, and green nodes, respectively. Due to data limitations, only South Africa is included as a representative of African economies and is grouped with European economies. The same applies to subsequent diagrams.
Sustainability 16 07302 g001aSustainability 16 07302 g001b
Figure 2. Correlation network of volatility in net direct investment flows among economies.
Sustainability 16 07302 g002
Figure 3. Correlation network of volatility in net portfolio investment flows among economies.
Sustainability 16 07302 g003aSustainability 16 07302 g003b
Figure 4. Correlation network of volatility in net other investment flows among economies.
Sustainability 16 07302 g004
Table 1. Characteristics of the correlation network of volatility in net private capital flows among economies.
Times PeriodsAverage DegreeNetwork DensityAverage Clustering CoefficientAverage Path Length
2000Q1–2020Q430.6960.6820.7241.3179
2000Q1–2008Q224.5650.5460.6951.4821
2009Q3–2020Q431.3480.6970.7571.3034
Table 2. Characteristics of the correlation network of volatility in net direct investment flows among economies.
Times PeriodsAverage DegreeNetwork DensityAverage Clustering CoefficientAverage Path Length
2000Q1–2020Q431.8260.7070.7581.2928
2000Q1–2008Q228.6090.6360.7561.3662
2009Q3–2020Q427.0870.6020.6751.3981
Table 3. Characteristics of the correlation network of volatility in net portfolio investment flows among economies.
Times PeriodsAverage DegreeNetwork DensityAverage Clustering CoefficientAverage Path Length
2000Q1–2020Q431.1740.6930.7311.3072
2000Q1–2008Q231.7830.7060.7961.2937
2009Q3–2020Q434.0870.7570.8361.2435
Table 4. Characteristics of the correlation network of volatility in net other investment flows among economies.
Times PeriodsAverage DegreeNetwork DensityAverage Clustering CoefficientAverage Path Length
2000Q1–2020Q431.6960.7040.7521.2957
2000Q1–2008Q231.9570.7100.8241.3014
2009Q3–2020Q431.130.6920.8021.3082
Table 5. Results of factors affecting the co-movement of volatility in net cross-border capital flows among economies.
Variables Private Capital FlowDirect Investment FlowPortfolio Investment FlowOther Investment Flow
Trade intensity0.038 *−0.046 **0.0210.042 *
Economic growth rate differentials−0.1080.027−0.188 **−0.024
Interest rate spread−0.714 **−0.0380.026−0.158 *
Inflation rate differentials0.1020.071−0.119−0.017
Differences in capital controls0.056 *−0.056 *0.106 ***−0.113 **
Geographical adjacency0.309 ***−0.009−0.012 *0.056 **
Both belong to the same economic organization0.156 ***0.0040.0670.129 *
Constant0.150 ***0.015 ***0.279 ***0.154 ***
R-squared0.1580.0100.0990.098
Observations2070207020702070
Note: *, **, and *** denote p < 0.10 , p < 0.05 , and p < 0.01 , respectively.
Table 6. Results of factors affecting the co-movement of volatility in net cross-border capital flows among emerging and developing economies.
Variables Private Capital FlowDirect Investment FlowPortfolio Investment FlowOther Investment Flow
Trade intensity0.193 *−0.108 **−0.111 ***0.043
Economic growth rate differentials−0.0590.047−0.078−0.065
Interest rate spread−0.192 **−0.034−0.041−0.114
Inflation rate differentials0.0060.033−0.0180.021
Differences in capital controls−0.068−0.054−0.036−0.191 **
Geographical adjacency0.0730.142 **0.0020.202 ***
Both belong to the same economic organization0.119 *−0.0030.0950.084
Constant0.150 ***0.027 ***0.120 ***0.194 ***
R-squared0.1450.0380.0340.133
Observations462462462462
Note: *, **, and *** denote p < 0.10 , p < 0.05 , and p < 0.01 , respectively.
Table 7. Results of factors affecting the co-movement of volatility in net cross-border capital flows among developed economies.
Variables Private Capital FlowDirect Investment FlowPortfolio Investment FlowOther Investment Flow
Trade intensity0.0350.0020.0310.013
Economic growth rate differentials−0.171 **−0.0390.042−0.036
Interest rate spread0.0080.155 *−0.381 **−0.300 *
Inflation rate differentials−0.029−0.197 **0.1940.491 ***
Differences in capital controls0.155 *0.0060.198 *−0.070
Geographical adjacency−0.0330.010−0.139 **−0.021
Both belong to the same economic organization0.0360.076−0.1120.002
Constant0.110 ***−0.066 ***0.476 ***0.265 ***
R-squared0.0620.0170.0670.067
Observations552552552552
Note: *, **, and *** denote p < 0.10 , p < 0.05 , and p < 0.01 , respectively.
Disclaimer/Publisher’s Note: The statements, opinions and data contained in all publications are solely those of the individual author(s) and contributor(s) and not of MDPI and/or the editor(s). MDPI and/or the editor(s) disclaim responsibility for any injury to people or property resulting from any ideas, methods, instructions or products referred to in the content.

