Abstract
The rapid growth of e-commerce has led to an increase in the number of product returns in supply chains, which is both environmentally and economically challenging. E-commerce companies need to effectively manage product returns, as this has a direct impact on their reputation and consumer experience. Reducing returns is key to maintaining sustainable practices for online product sales. A significant increase in e-commerce transactions is also evident in Indonesia, which is the fourth largest country in the world. Despite the very large size of the market, research on e-commerce in the business-to-customer (B2C) market in Indonesia is underrepresented in the literature. The purpose of this paper is to identify key factors from the customer perspective that influence product returns in reverse logistics in Indonesian e-commerce. The novelty of this study stems from the focus on the customer perspective on product returns in the B2C market when shopping online and the spatial scope. Due to the uncertainty inherent in multi-criteria decision making, the analytic hierarchy process (AHP) method was used to rank factors and potential solutions derived from a critical literature review. As a result, the study provides a ranking of factors and alternatives for managing e-commerce returns in Indonesia. The results show that among Indonesian e-commerce customers, product quality (QP) was rated the highest, while (Pu) was rated the lowest. In terms of the alternatives that are the most suitable for improving the customer experience of e-commerce product returns in Indonesia, a clear returns policy (CRP) scored the highest, while the merchandise catalog (Cat) was rated as the lowest priority.
1. Introduction
In the last decade, electronic commerce (e-commerce) has seen significant growth, leading to changes in the way businesses operate and how customers make purchases [1]. This transformation has resulted in time and cost benefits for both buyers and sellers [2,3,4]. During the past five years, there has been a significant increase in online commercial activity, which has been further accelerated by the COVID-19 pandemic [5]. The rise in e-commerce is evident in countries such as Indonesia, which has the fourth largest population globally [6]. This growth may be attributed to the increase in smartphone use and Internet access, leading to an in-proportion growth in e-commerce transactions. The adoption rate in Indonesia jumped to 32.1% in 2023 and the trend is likely to continue, with a forecast rate of 46.5% in 2028 [7].
Customers often encounter difficulties in trying to choose from the variety of options available online [8]. To remain competitive in the e-commerce market, companies strive to improve the quality of their services and the experience of their customers [9]. This is achieved by offering high-quality products at rates that are competitive with others [10,11,12]. To satisfy consumers’ desire for faster delivery services, platforms often offer multiple delivery or shipping options to choose from [13]. Maintaining customer loyalty and satisfaction is the building block of a successful e-commerce business, to ensure a high repurchase rate [14]. Growth in e-commerce has also led to a substantial increase in demand for delivery services, including last-mile delivery [15,16]. However, this increase in demand can result in delays and other issues that can negatively impact the entire customer experience. Additionally, buyers may have challenges in assessing the product’s quality and may also experience complications in the process of returning products and obtaining a refund. Such actions can harm the reputation of e-commerce firms and discourage customers from making repeat purchases [1]. Online shopping allows customers to buy various items, and if the products do not meet their expectations, they can be conveniently returned to the store. Therefore, the impact of returns on e-commerce companies may have a substantial effect on their reputation and the satisfaction of their customers. Free return rules mitigate perceived risk while making online purchases, resulting in increased sales. However, they may also stimulate wasteful product returns, as online return behavior extends beyond just returning damaged products [17]. Enforcing a strict return policy can lead to loss due to bad return experiences, while a permissive return policy is vulnerable to abuse of returns [18].
Effectively handling reverse logistics is essential for enterprises across all sectors, especially in e-commerce since consumer happiness and loyalty greatly depend on the company’s capacity to efficiently manage returns and improve the customer experience [19]. Therefore, it is crucial for companies to effectively control the transportation of goods in both forward and reverse logistics throughout the whole supply chain [10]. Rogers and Tibben-Lembke [20] defined reverse logistics as the efficient transportation of finished items from their point of use back to their original site, with the purpose of either recovering their value or properly disposing of them, achieved through excellent planning. The primary goal of reverse logistics is to recover the value embodied in products, or to ensure appropriate disposal [21]. Incorporating reverse logistics into an established supply chain is a complex procedure that requires substantial restructuring of the current supply chain framework [21,22,23]. Furthermore, it includes a wide range of complicated techniques and methodologies [19]. Improvements have focused on critical areas such as the integration and utilization of reverse logistics; the analysis and prediction of product returns; the outsourcing of tasks; the optimization of RL networks; and the creation of decision support systems to improve product recovery, transportation, and processing [24]. Although there are many benefits and reasons for organizations to use RL, only a limited percentage of enterprises have efficient strategies to manage product return. Most organizations choose to ignore this feature, sticking to the conventional or progressive supply chain approach [25].
Previous studies highlighted the importance of factors related to the characteristics and demography when analyzing e-commerce [26,27,28,29]. Previous research on e-commerce product returns focused predominantly on business-to-business (B2B) perspective markets and/or other geographic regions [29,30,31,32,33,34,35,36]. Despite the very large size of the market, research on e-commerce in the business-to-customer (B2C) market in Indonesia is underrepresented in the literature. Based on a literature search conducted in the Scopus and Web of Science databases, only a very few articles on product returns management and reverse logistics in Indonesia were identified. Lesmono et al. [34] analyzed the effect of switching costs and product return management on repurchase intent with customer satisfaction and customer value playing as moderating variables in the B2B context in Indonesia. A study by Michel et al. [37] presented the comparative analysis of the quality of e-services in Indonesia based on the type of product, which was divided into physical product and digital product. The work of Chayanon et al. [38] included a statistical study on the nexus between green capability, product return, value chain costing, and the adoption of closed-loop supply chain in Indonesia. The study by Wilson et al. [39] focused on factors affecting customers satisfaction in e-commerce in the Indonesian market. They highlighted the importance of factors such as the quality of the e-service, including its reliability, web design, time saved, and performance, but did not investigate in-depth issues related to product returns. These facts allow us to formulate a conclusion about the existence of a theoretical research gap. The research carried out by the authors of this article is innovative both in terms of the topic (customer perspective), spatial scope (Indonesia), and the methodological approach (AHP method—as any of the identified studies applied it in Indonesian context).
Therefore, the purpose of this paper is to fill the theoretical research gaps by defining the key factors that influence the returns of products in reverse logistics in the e-commerce market in Indonesia, specifically focusing on the customer experience (B2C). After scoping the study of the literature [29,30,31,32,33,34,35,36,37,38,39], two research questions are stated as follows:
RQ1: What are the key factors that influence a customer’s experience when returning products in e-commerce in Indonesia?
RQ2: What solutions are the most suitable to improve the customer’s experience and thus reduce the volume of product returns in reverse logistics in e-commerce in Indonesia?
This study proposes an approach that is based on the analytical hierarchy process (AHP). The analytic hierarchy process (AHP) is a reliable method for evaluating intangible elements, using a discrete scale [40]. The AHP is often used to tackle complex decision-making situations that involve uncertain information [17]. Previous studies on returns management in e-commerce have employed the AHP approach [2,10,17,41,42,43], but to the best of our knowledge, no research has particularly investigated and identified the factors that influence product returns in the e-commerce sector in Indonesia.
The reminder of the article is structured as follows: Section 2 summarizes the literature review. Section 3 discusses the materials and methods. Section 4 presents the results of this study. Section 5 includes a discussion of the results. In Section 6, the final conclusions are stated, and further research is presented.
2. Theoretical Background
2.1. Reverse Logistics: Drivers and Barriers
To properly grasp the growing importance of reverse logistics, it is essential to have a thorough understanding of the elements that contribute to the implementation of reverse logistics. The scope of the reverse logistics processes is shown in Figure 1. According to Shih et al. [18], reverse logistics encompasses a broader range of processes beyond simple return, exchange or repair, and upgrading of ordinary goods. It also encompasses the recycling process of converting goods into materials and the techniques for handling scrap. There are several reasons for adopting and designing reverse logistics, including economic factors, legal obligations, and societal concerns [25]. Enterprises may view the financial and economic aspects of reverse logistics as an obstacle to integrating reverse logistics activities into their operations [22]. Furthermore, companies could improve their economic strength by incorporating circular economy concepts into their reverse logistics operations [44,45]. The main objective in an economic context is to limit the use of raw resources and the costs related to waste management while simultaneously increasing the value of the final product. Efficient utilization of valuable spare components in the recovery and reuse of goods and resources can lead to immediate economic gains by reducing expenses. The use of discarded materials and natural resources goes alongside the investigation of unexplored opportunities, such as the reselling of second-hand products on the market. Indirect advantages include the capacity to forecast forthcoming legislation, safeguarding the market, strengthened relationships with suppliers and consumers, and the establishment of a reputation that is environmentally conscious, leading to the acquisition of new clients and suppliers [46].
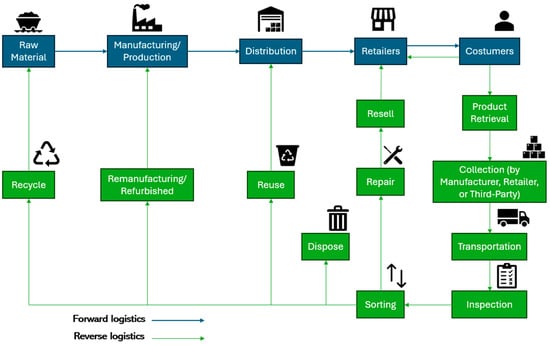
Figure 1.
Concept of reverse logistics, adopted from [47].
In the context of e-commerce, the volume of reverse logistics operations is larger than in traditional sales. The collection, sorting, and recovery of products (e.g., repair, resell, reuse) can be done by the seller or third-party providers [43].
Although the application of reverse logistics solutions has made a positive environmental impact on e-commerce, some obstacles are still faced. These barriers are detailed in Table 1.

Table 1.
Barriers in reverse logistics implementation.
Top management has a key role to play in addressing various barriers, such as establishing procedures for returns and gatekeeping, defining an appropriate framework for reverse logistics, and making informed decisions on IT investments to support the reverse logistics process [17]. This may include the use of forecasting tools to predict returns and order deletions. Furthermore, successful implementation of reverse logistics requires robust coordination between the organization and all third parties, as well as the establishment of appropriate reverse logistics policies [50].
2.2. Product Return in Electronic Commerce—Key Factors and Solutions
This article examines the key factors affecting product returns in e-commerce in Indonesia from a consumer perspective. Returns management is crucial for cost-effective and sustainable e-commerce logistics operations. The study by Zhao et al. [51] shows that 67% of customers check the return policies before making a purchase, while 66% of consumers expect free return shipping. A free return shipping service is also offered in the Indonesian e-commerce industry. Table 2 shows the five e-commerce platform providers in Indonesia that offer free product returns. The time range for requesting a free return and refund varies between 2 and 15 days. The availability of free returns depends on the conditions set by an e-merchant. The variability of these criteria depends on factors such as the nature of the returned goods [52]. Perishable products generally do not qualify for returns. Acceptable reasons for free returns may include cases where the product was not delivered on time, the seller sent the wrong product, the product does not match the description displayed in the online marketplace, or simply a change in preferences by consumers.
Table 2.
Return policies of five most used e-commerce in Indonesia.
Returns can be triggered by consumer purchasing patterns and behavior, such as [27,49,53,54]
- Change of mind or the inclination to order multiple items with different colors and sizes with intention to keep only one of them;
- Habit of ordering a product online to try it at home before visiting and purchasing from a brick-and-mortar store;
- Ordering additional products to qualify for free shipping;
- Returning unwanted gifts;
- ‘Act of wardrobe’, which refers to the practice of returning used items after using them;
- Financial constraints of customers. For example, customers regret spending too much money, customers bought product on impulse, or customers exceed the pre-defined budget.
Customers may buy a product for a discount or promotion, especially during the holiday season. With the evolution of purchasing behavior, there is a growing trend of consumers returning products that they bought as gifts for others, as well as returning items that they have used a few times before taking them back to the store. Product returns in e-commerce can also be linked to delivery terms [27,49,53,54]. Buyers often choose the most economical and fastest delivery option. If items do not arrive within the specified time, they may be canceled and sent back by customers back to the source. Returns may also be due to insufficient tracking of products. Due to the complexity of logistics processes, which involve several stages and participants, customers expect to receive prompt notifications about the progress of their orders at each stage [53]. When goods are delivered, it is important to quickly update their status. Therefore, an efficient information integration system is important for reverse logistics in e-commerce. Product returns can also be caused by poor service quality when the delivered products are defective or the wrong products have been delivered [27,49,53,54]. Based on the critical literature review, a set of six key factors that influence product return in e-commerce was identified, as shown in Table 3.
Table 3.
Key factors influencing product return in e-commerce from a customer perspective.
Shipping and handling processes play a vital role in the decision on product returns. If the product sustains damage as a result of insufficient packaging, the consumer has the choice to return it. Table 3 indicates that it is essential to prioritize efficient and timely delivery to minimize the number of product returns. The rationale behind this is that a prolonged delivery interval can induce purchasers to reconsider their chosen item. If the product description on the e-commerce platform fails to fulfill the customer’s expectations, it may result in refunds. Furthermore, the implementation of free shipping promotions has the ability to influence customers’ buying choices and return behaviors by motivating them to make riskier purchases, thereby leading to an increased volume of product returns. The client can return the goods due to their flaw or malfunction. Afterward, the consumer has the option to return the merchandise if they have received an incorrect item. Factors that affect product returns can significantly influence consumer satisfaction and ultimately the profitability of the company.
In order to reduce the volume of products returns, several solutions are proposed in the literature. These solutions in the context of AHP are referred to as alternatives. Table 4 shows the most promising alternatives (solutions), derived from the critical literature review.
Table 4.
Proposed alternatives.
Using technology such as RFID can be beneficial in guaranteeing a steady and uninterrupted transmission of information. In this specific situation, it can be used to track the movement of things during the delivery process and instantly notify customers of any possible delays. Using advanced technology, such as forecasting software, can provide benefits in accurately anticipating product returns, optimizing reverse logistics processes, and improving overall performance. When dealing with return policies, it is essential to thoroughly define and clearly communicate standards to all parties involved to improve the monitoring of returns and decrease their frequency. Badenhorst [62] stated that a well-defined return policy, together with the gatekeeping position and the use of information technology, allow sellers to address product quality concerns and enhance visibility in reverse logistics. Furthermore, Gupta et al. [1] asserted that implementing a comprehensive return policy has the ability to enhance consumer happiness, thus potentially increasing demand and fostering customer loyalty. Given the rising number of product returns, Badenhorst [42] emphasized that many companies are striving to establish a uniform system for reverse logistics. An effective strategy to manage this complexity is to establish partnerships with third-party logistics providers. This partnership involves efficient management of coordination by exchanging information and frequent meetings. A company can utilize reverse logistics standardization to maximize the value derived from returned goods while minimizing expenses. To minimize product returns, it is essential to provide detailed product descriptions that could improve consumer satisfaction with their purchases.
3. Materials and Methods
Prioritizing the criteria (Table 3) and alternatives (Table 4) can be accomplished through a variety of different approaches known as multiple criteria decision making (MCDM). There are different methodologies established for the purpose of tackling MCDM, such as the analytical hierarchy process (AHP) [18], analytical network model (ANP) [63], fuzzy-technique for order preference by similarity to ideal solution (TOPSIS) [60], and grey-based decision making trial and evaluation laboratory (DEMATEL) [58]. Hybrid combinations of MCDM can be utilized as well, such as AHP and criteria importance through intercriteria correlation (CRITIC) [1], the fuzzy AHP and TOPSIS approach [10], and fuzzy VIKOR and fuzzy TOPSIS [32].
AHP was previously used in related research by Aggarwal and Aakash [60], who applied it to discover the key factors for business-to-customer (B2C) e-commerce websites. They identified and ranked 23 key factors for supporting the effectiveness of B2C e-commerce systems. The findings indicated that the most important aspects for the success of an e-commerce website were timeliness, up-to-datedness, understandability, and preciseness in the content quality criteria. Lamba et al. [40] used the AHP to prioritize obstacles in the reverse logistics of e-commerce. They conducted an analysis of 16 obstacles in five distinct categories. The findings revealed that the three main obstacles were insufficient investment in RL, inadequate understanding of optimal methodologies, and unpredictable market demand. Naseem et al. [17] using the AHP to identify obstacles in the adoption of blockchain technology in RL. The mentioned research proofed the usefulness of AHP method in the identification of key factors based on expert survey. This method is an effective technique for assessing intangible attributes by employing a discrete scale. It is commonly employed to address intricate decision-making difficulties that involve uncertain information [10,41].
The main goal of the analytic hierarchy process (AHP) is to rank the different options by combining many levels of data into a unified score. The main feature of this is its dependence on matrices for pairwise comparisons. Hence, the utilization of the analytic hierarchy process (AHP) is applied to tackle the difficulties associated with decision making that involves several criteria in practical situations. The justifications for using AHP were the required small sample size, high level of consistency, simplicity, and availability of user-friendly software, as indicated by Darko et al. [64]. The quantitative research requires in order to ensure representativeness requires purposeful sampling and experts (informants) who are articulate, reflective, and interested in sharing the information [65]. The systematic literature review on practical applications of AHP by Ishizaka and Labib [66] indicate that involving three to seven experts is common practice to ensure diverse input and maintain practical manageability. Some case studies demonstrate the use of larger groups in AHP (e.g., studies involving public participation in urban planning or large organizational decision making) [67]. While a larger sample size can provide more diverse perspectives and improve the robustness of the decision, it also introduces challenges in terms of coordination, consistency, and analysis of the data [68].
As stated by Dong et al. [68], the selection of experts and the importance of their knowledge and expertise is crucial to ensure the quality of AHP outcomes. In this study, we applied purposive sampling with the target of sample size of 10 experts, which exceeds the minimal required sample size for AHP of 3–7 experts. Previous research recommended objective sampling, as this method can improve the reliability and quality of AHP analysis by focusing on the expertise and relevance of the participants rather than the number of respondents [66,67]. The choice of experts in the purposive sampling in AHP involved the deliberate selection of experts based on their relevant knowledge, experience, and ability to provide informed judgments on the management of product returns in e-commerce in Indonesia. The following criteria were applied for the purposive sampling in this study: (1) spatial scope—to be located in Indonesia; (2) time scope—to have at least 3 years of experience in making product returns in e-commerce; (3) to be familiar with the pairwise comparison concept.
The procedure consists of the following phases [3]:
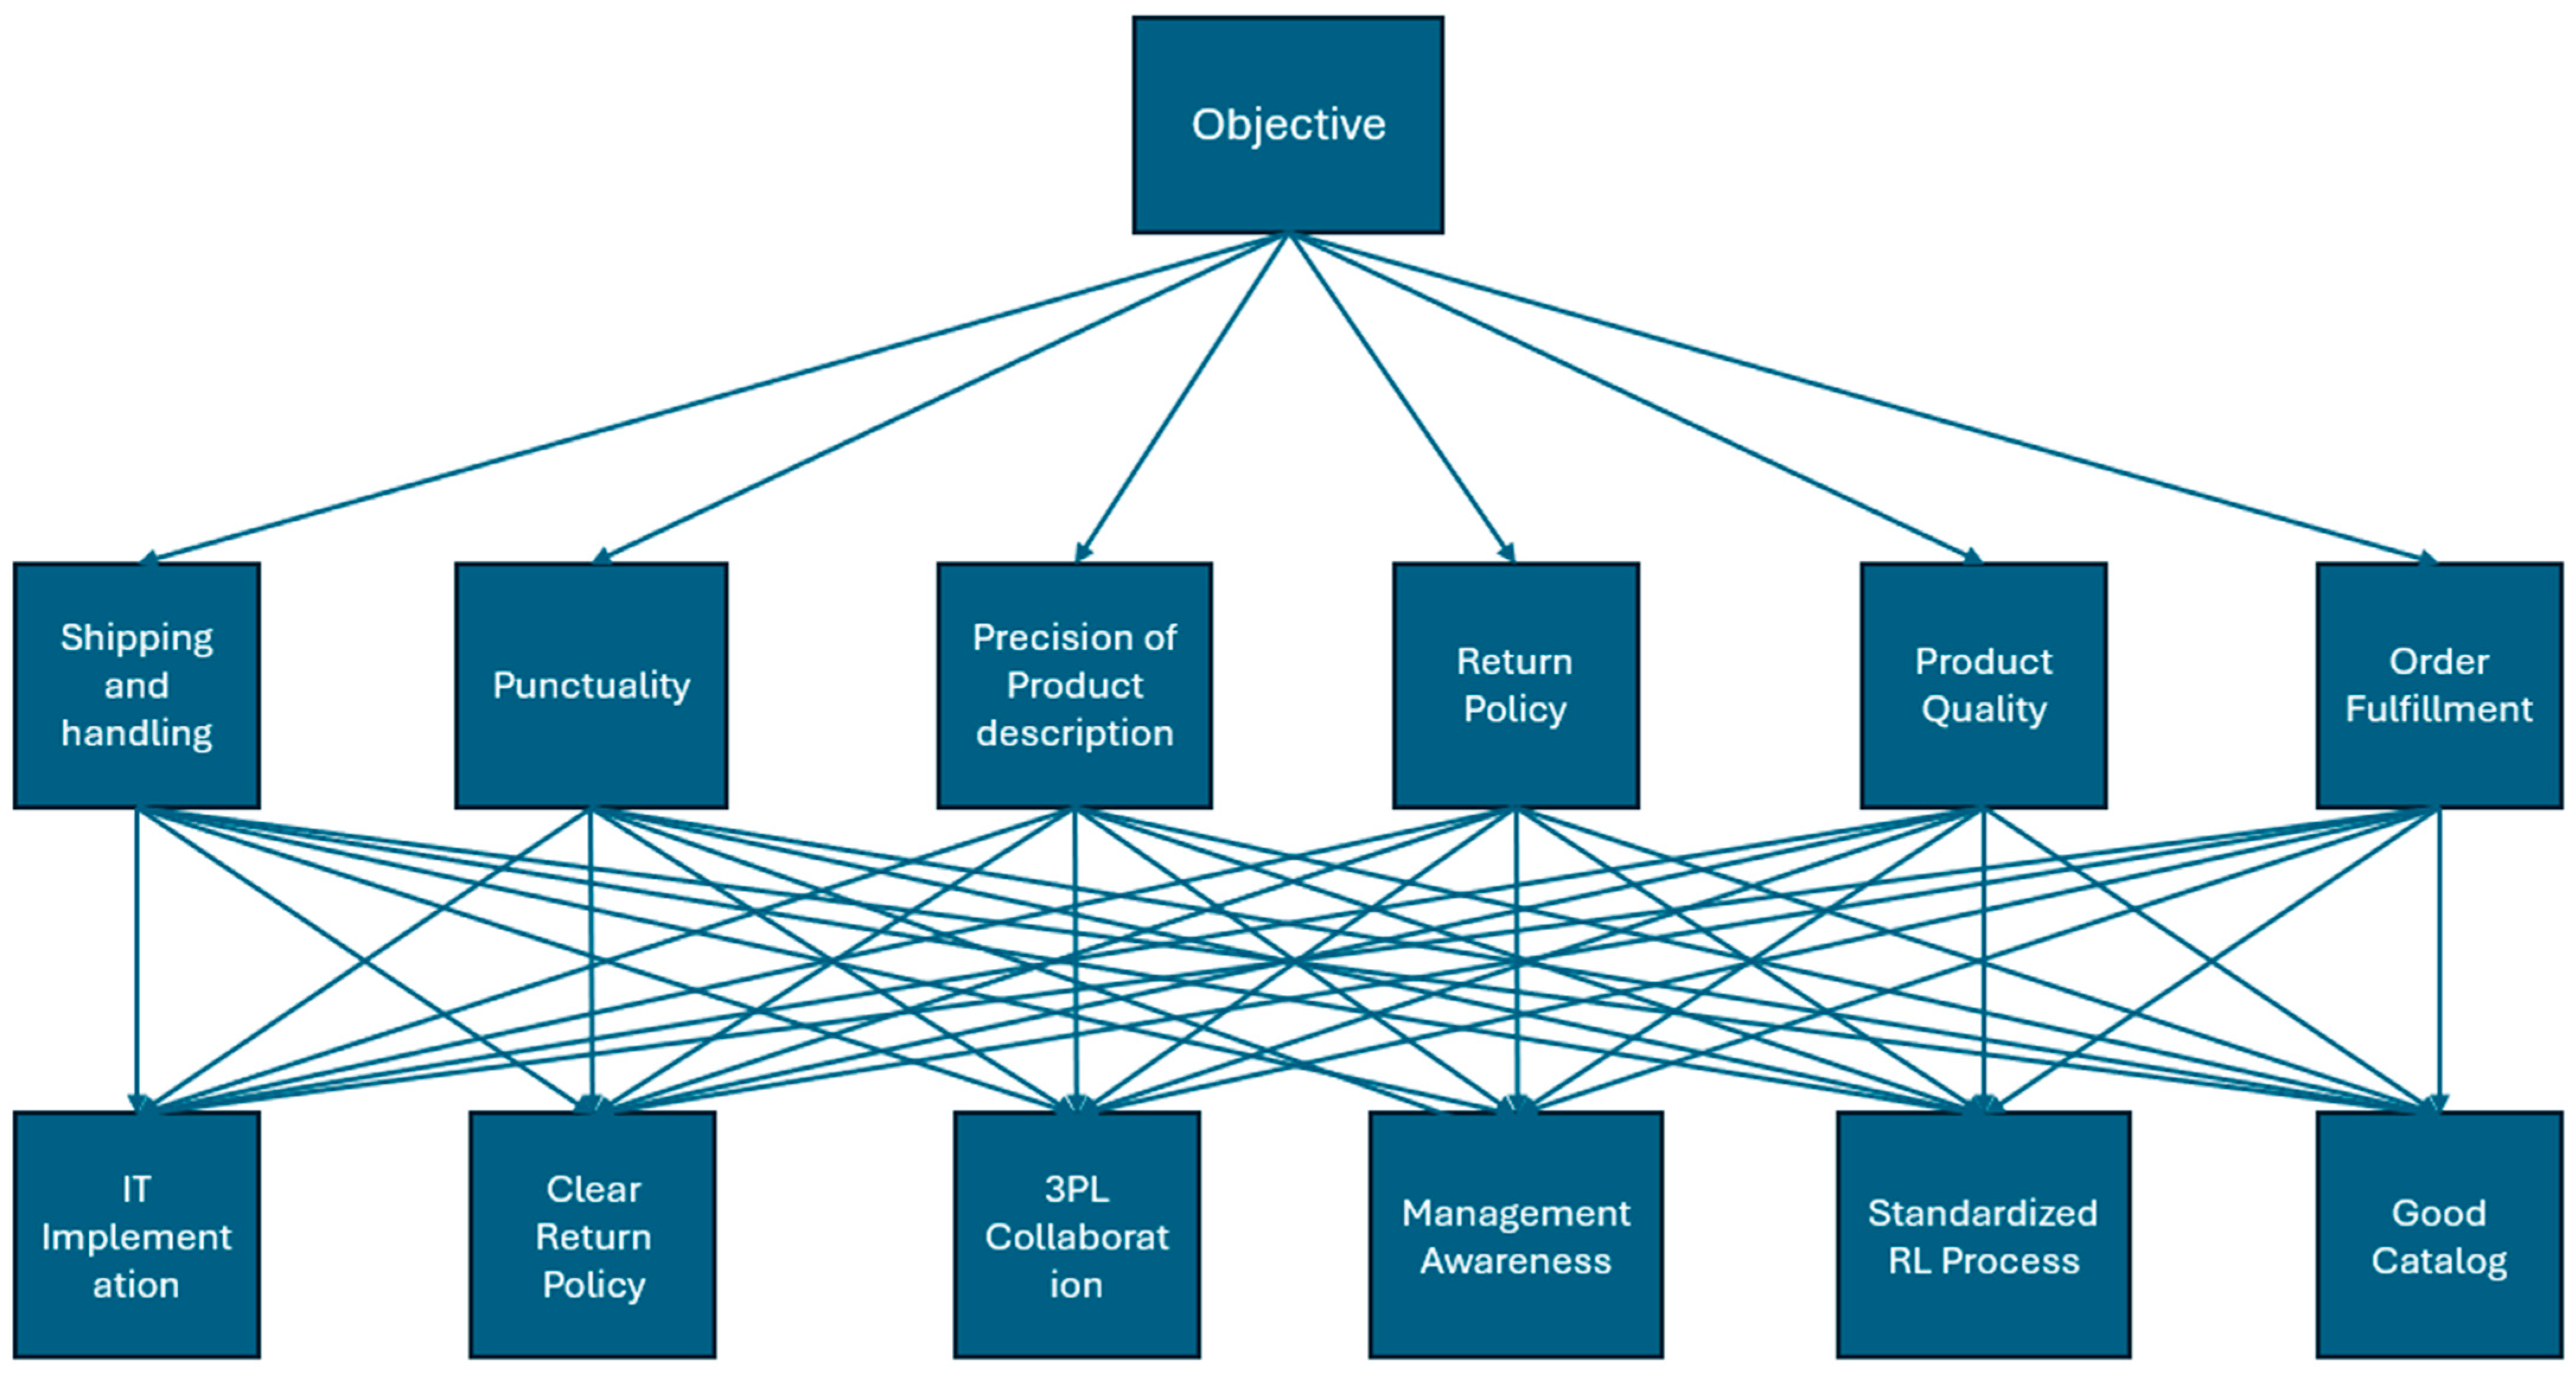
Step 1: Create hierarchical structure.
The first step includes identifying the hierarchical structure of the problem. The hierarchical framework comprises three levels: objective, standards, and options. The objective of the selection process is to identify the factors that the impact product returns in the reverse logistics of the Indonesian e-commerce business. This study introduces six key factors (from Table 3) and alternatives (Table 4) as potential solutions following a comprehensive assessment of the literature. Figure 2 depicts the hierarchical structure of the criteria selection.

Figure 2.
Problem structure for AHP.
Step 2: Construct matrices through pairwise comparison.
In the following stage, the key factor weights are obtained through the pairwise comparisons. Upper-level urgency and criteria are assessed by performing paired comparisons to evaluate each criterion. This is based on the assessment of matrices performed by 10 experts. As mentioned above, we applied the purposive sampling. The spatial scope of the research was limited to the Indonesian e-commerce B2C market. Data were collected via survey form for pairwise comparison and interviews conducted online in March–April 2024. The paired comparison matrices are generated using the standardized comparison scale outlined in Table 4. Let } be the key factor set and A be the evaluation matrix with relative weight () of the key factor, where [3].
Step 3: Normalized matrix and calculation of priority vector .
The normalization process begins by computing the total of values in each column. Hence, the normalization for the first column when is specified as [69]
The normalization for the column is specified as [45]
Then the normalization of matrix is written as [45]
The priority vector W is constructed by taking the arithmetic mean of the rows of the normalized matrix A [45]:
Step 4: Calculation of .
The formula for computing the eigenvector of a matrix A is specified as [3]
is computed by taking the sum of the product of each element of the eigenvector with the sum of the columns of the pairwise matrix A.
Step 5: Consistency test for pairwise matrix.
Assessing the consistency of the pairwise matrix A is a crucial step in AHP. It helps determine if the specific decision matrix should be accepted or rejected. Two parameters are computed to evaluate and confirm the coherence of the matrix, as outlined below [3]:
The value of the random index (RI) is contingent upon the number of key factor (n). The predefined random index (RI) values, as suggested by Saaty [67], are presented in the subsequent Table 5.
Table 5.
Relationship between random index (RI) and number of key factors (n) [3].
Step 6: Calculation of the final alternative value.
Calculation utilizing a weighted sum is necessary in this phase to obtain the final priority value for alternatives. The formula for the weighted total of alternative n is described as follows, assuming m represents the number of key factors [69]:
For the research methodology, this study employs a two-phase approach that is shown in Figure 3.
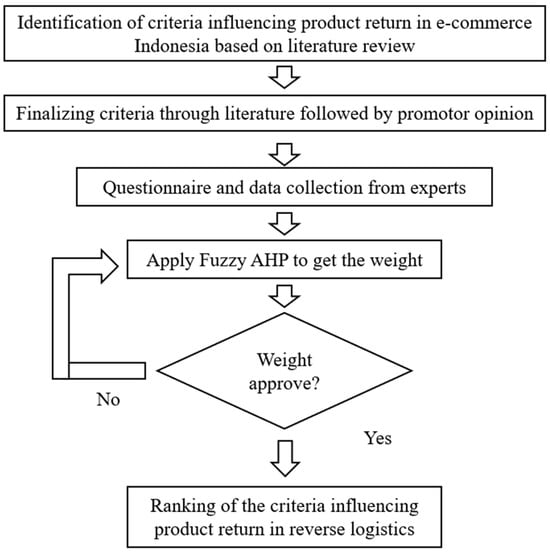
Figure 3.
Research methodology.
4. Results
The AHP analysis aimed to rank the key factors influencing the product returns in Indonesian e-commerce and to link them with most suitable solutions to reduce the volume of returns. An e-commerce company can use the results to efficiently handle returns and improve customer satisfaction. Moreover, the act of prioritizing the key factors is crucial for understanding the concept of returns management in the context of Indonesian e-commerce.
This study follows the methodology shown in Figure 3.
Phase 1: Selection Criterion Identification and Evaluation
The factors that affect product returns in reverse logistics in Indonesian e-commerce were identified and selected in the initial stage through critical literature research. Subsequently, these factors were assessed by experts using a questionnaire form. This study presents six parameters that have an influence on product returns in reverse logistics. The key factors encompass shipping and handling, timeliness, precision of product description, return policy, product quality, and order of fulfillment.
Phase 2: Application of AHP
In this step, the analytic hierarchy process (AHP) approach was used to prioritize the factors that impact product return in reverse logistics in the e-commerce industry in Indonesia. The 10 experts assessed the key factors and their alternatives as potential solutions. The selection of experts was based on the number of years of using e-commerce platform and the experiences of returning the purchased product. Table 6 displays the pairwise comparison and decision matrix of the key factors, together with their estimated weight and ranking.
Table 6.
Pairwise comparison matrix of key factors.
In order to answer the research question RQ1, we assessed by application of AHP the importance of factors that influence a customer’s experience when returning a product in e-commerce in Indonesia. As shown in Table 6, the weightage value was used to rank the key factors in descending order. Product quality (QP) obtained the highest weightage, followed in descending order by procedure and guideline for returning items (PGR); level of order fulfillment (LOF); shipping and handling (SH); and precision of the product description (PPD). Punctuality (Pu) was ranked the lowest with respect to its importance in product return in reverse logistics from a consumer perspective.
In order to find the answer to RQ2, we assessed alternative solutions to find out those that are the most suitable to improve the customer’s experience and thus reduce returns in reverse logistics in e-commerce in Indonesia. Potential solutions were assessed based on all key factors, starting from SH and ending with LOF. Consequently, alternatives were ranked based on each individual criterion (as shown in Table 7, Table 8, Table 9, Table 10, Table 11, Table 12 and Table 13).
Table 7.
Pairwise comparison matrix of alternatives (shipping and handling).
Table 8.
Pairwise comparison matrix of alternatives (punctuality).
Table 9.
Pairwise comparison matrix of alternatives (precision of product description).
Table 10.
Pairwise comparison matrix of alternatives (procedure and guideline for returning items).
Table 11.
Pairwise comparison matrix of alternatives (product quality).
Table 12.
Pairwise comparison matrix of alternatives (order fulfillment).
Table 13.
Final ranking of alternatives.
After all the pairwise comparison matrices were completed, the value of each alternative was determined in the last phase of the computation by applying formula 9. The rank of alternatives was then displayed, as shown in Table 13. The alternatives were prioritized in a decreasing sequence based on their weightage value. The alternative with the highest weightage was clear return policy (CRP), followed by standardized reverse logistics process (SRL), management awareness (MA), collaboration with logistics partners (CRL), IT implementation (IT), and establishing a good catalog (CAT), in that specific order.
5. Discussion
This study applied the AHP approach to identify key factors from the customer perspective that influence product returns in reverse logistics in Indonesian e-commerce. Furthermore, the most suitable solutions were linked. A clear return policy was ranked as the most important solution. This solution had a favorable weight to overcome issues related to the lack of the precision of product description (PPD), the procedures and guidelines for returning items (PGR), and the insufficient quality of the product (QP).
The standardization of reverse logistics procedures was ranked as the most preferable solution. This solution was deemed suitable to overcome the problems associated with shipping and handling (SH) and to ensure the quality of the product (QP). This aims to improve the management of return operations by developing their own protocols and standards. Standardizing practices in the field of reverse logistics has several benefits. The initial advantage of standardization is the improved visibility of returns. At the same time, it has the capacity to improve operational adaptability and boost operational effectiveness. Lastly, incorporating established procedures can help minimize ambiguity and discord in reverse logistics activities. To minimize ambiguity and uncertainties in reverse logistics, it is crucial to have a thorough comprehension of the procedures to control the flow of returns.
The third preferable solution is the enhancement of managerial awareness (MA). This demonstrates a high suitability to mitigate the issues related to lack of appropriate procedure and guidelines for returning items (PGR), troubles with the product quality (QP), and low level of order fulfillment (LOF). Returns management is not just an operational concern but also a strategic one. Companies that recognize this can better align their resources and create higher customer value, reduce costs, and enhance competitive advantage [70]. There are studies that indicate that with the increasing automation of returns management processes in e-commerce, the system has the potential to work effectively even with low involvement of top managers [71,72,73]. However, these studies do not take into account the perspective of customers and their satisfaction.
Engaging in collaboration with reverse logistics partners was the solution that was ranked fourth. This solution was most suitable to mitigate issues with the level of order fulfillment (LOF) and punctuality (Pu). Most previous studies proved that the collaboration with specialized logistics partners allowed for the improving of delivery time, as well as the accurateness and reliability of deliveries, especially in urban areas where customers might prefer to have multiple options to receive and eventually return products [35]. Previous studies on the B2C market in e-commerce in other countries were not conclusive on the level of importance of this solution. For example, Naseem et al. [10] have shown that establishing a favorable relationship with a third party logistics supplier was one of the top alternatives. On the contrary, Sirisawat and Kiatcharoenpol [41] assessed its importance as relatively low.
Information technology ranked fifth among all the alternatives analyzed. The solution effectively addressed both order fulfillment level (LOF) and on-time performance (Pu) issues. To better manage product returns, companies must strengthen their ties with their supply chain partners through regular information exchange to improve real-time traceability. Furthermore, the use of data analytics and visibility technologies, including predictive forecasting, can improve collaboration and information sharing among multiple supply chain participants through the use of the RFID (radio frequency identification system). From the customer’s perspective, easy access to e-commerce delivery status information reduces uncertainty and allows for proactive management of product delivery and making returns. However, some researchers have highlighted that information technology can also negatively impact the customer experience when returning e-commerce products in the B2C market. This can happen when, due to extended automation (for example chatbots), poor platform design, and outdated information, customers may find it difficult to return and reach a real person for assistance, leading to frustration and dissatisfaction [1].
The creation of catalog of products is the final solution to the issue of product returns in e-commerce on the B2C market in Indonesia. By creating a catalog of items on the e-commerce platform, it is feasible to effectively minimize the number of product returns caused by customers obtaining the wrong item. Using high-resolution images captured from diverse angles, along with a comprehensive description detailing the size, colors, and materials, can help to reduce the volume of returns. In addition, sellers can employ product information management systems to ensure that product descriptions are accurate and uniform across any e-commerce platform.
6. Conclusions
Despite the very large size of the market, research on e-commerce in the business-to-customer (B2C) market in Indonesia is underrepresented in the literature. This paper aimed to identify key factors from the customer’s perspective that influence product returns in B2C in Indonesian e-commerce. Furthermore, we explored the suitability of potential solutions derived from a critical review of the literature in regard to mitigate the issues related to the identified key factors. The AHP is applied to cope with information uncertainty in multi-criteria decision making. In the context of the research gap diagnosed in the Introduction, this article provides knowledge on product returns management in relation to the Indonesian e-commerce market. The geographical scope is relevant, as the size of population and rapid growth of the Internet and mobile accessibility in Indonesia increases the scale of the return problem, hence the need to address this in research. The novelty of this study comes from the focus on the customer’s perspective on product returns in B2C when shopping online and the spatial scope. The novel contribution to theory is the ranking of key factors that influence the customer’s experience when returning products in the context of the Indonesian e-commerce in B2C market (answer to RQ1). This study identified six factors that influence product returns in the reverse logistics of Indonesian e-commerce. They were prioritized using the analytical hierarchy approach (AHP). In terms of key factors, the results show that product quality (QP) received the highest importance, followed by the procedure and return guideline (PGR), the level of order fulfillment (LOF), the shipping and handling (SH), the precision of the product description (PPD), and punctuality (PU). To answer RQ2, we analyzed the set of suitable solutions to reduce the volume of returns. The results show that the clear return policy (CRP) had the highest level of importance, followed by the implementation of a standardized reverse logistics process (SRL), management awareness (MA), collaboration with logistics partners (CRL), IT implementation (IT), and product catalog of goods (CAT).
These results can also be useful for managers in e-commerce in Indonesia to better understand the customer’s perspective and proactively implement solutions that help to reduce the volume of returns. The results support the choice of the most suitable actions to mitigate the issues related to six key factors that influence the customers experience and satisfaction of customers when making a return in the context of Indonesian e-commerce in the B2C market.
Limitation and Future Research Direction
Despite the contribution to identify key factors influencing product return in Indonesian e-commerce, this study has limitations. First, the key factors were obtained from previously published scholarly studies. As these factors were not originally intended for the Indonesian market, it is probable that they may contain biases. Although attempts have been made to select reliable sources, it is not feasible to entirely eliminate the potential for biases. The methodological choice adopted to address the formulated research problem is one of the multi-criteria analysis methods. It should be emphasized at this point that the results obtained were directly determined by the data adopted. Hence, in the case of AHP, as in other multi-criteria methods, the step of assigning objective evaluations is crucial for the value of the results and their subsequent interpretation. The group of ten experts, who are frequent online shoppers on e-commerce platforms and have previous experience with product returns, assessed the key factors and their possible alternatives. Thus, there might be other factors that had not been considered in this research.
This study specifically examined the factors that influence product returns in reverse logistics in Indonesian e-commerce, with an emphasis on the customer’s viewpoint. However, a future study might explore the criteria from the company’s perspective and compare the findings of both studies. Moreover, the proposed framework outcome may be compared to the outcomes of other methodologies, such as ANP and ELECTRE, which can be used for future analysis.
Author Contributions
Conceptualization, D.H.P. and P.G.-D.; methodology, D.H.P. and P.G.-D.; formal analysis, D.H.P.; investigation, D.H.P.; resources, D.H.P. and P.G.-D.; data curation, D.H.P.; validation P.G.-D. and R.D., writing—original draft preparation, D.H.P.; writing—review and editing, D.H.P., P.G.-D. and R.D.; supervision, P.G.-D.; funding acquisition, P.G.-D. All authors have read and agreed to the published version of the manuscript.
Funding
The APC was funded by the internal research grant of the Poznan University of Technology 0812/SBAD/4217.
Institutional Review Board Statement
Not applicable.
Informed Consent Statement
Not applicable.
Data Availability Statement
Data are contained within the article.
Acknowledgments
We would like to thank the experts for their participation in this study.
Conflicts of Interest
The authors declare no conflict of interest. The funders had no role in the design of the study; in the collection, analyses, or interpretation of data; in the writing of the manuscript; or in the decision to publish the results.
References
- Gupta, S.; Kushwaha, P.S.; Badhera, U.; Chatterjee, P.; Gonzalez, E.D.R.S. Identification of Benefits, Challenges, and Pathways in E-Commerce Industries: An Integrated Two-Phase Decision-Making Model. Sustain. Oper. Comput. 2023, 4, 200–218. [Google Scholar] [CrossRef]
- Chiu, W.-Y.; Tzeng, G.-H.; Li, H.-L. A New Hybrid MCDM Model Combining DANP with VIKOR to Improve E-Store Business. Knowl.-Based Syst. 2013, 37, 48–61. [Google Scholar] [CrossRef]
- Aggarwal, A.G. Aakash Multi-Criteria-Based Prioritisation of B2C e-Commerce Website. Int. J. Soc. Syst. Sci. 2018, 10, 201–222. [Google Scholar] [CrossRef]
- Kawa, A.; Pierański, B. Green logistics in e-commerce. LogForum 2021, 17, 183–192. [Google Scholar] [CrossRef]
- Bjørgen, A.; Bjerkan, K.Y.; Hjelkrem, O.A. E-Groceries: Sustainable Last Mile Distribution in City Planning. Res. Transp. Econ. 2021, 87, 100805. [Google Scholar] [CrossRef]
- Indonesia Country Profile|Indonesia|Fact Sheet. Available online: https://www.usaid.gov/indonesia/fact-sheets/indonesia-country-profile (accessed on 6 August 2024).
- eCommerce in Indonesia: Market Development, Consumer Preferences, Social Commerce|ECDB.Com. Available online: https://ecommercedb.com/insights/ecommerce-in-indonesia-fueled-by-young-tech-savvy-consumers/4573 (accessed on 6 August 2024).
- Golinska-Dawson, P.; Werner-Lewandowska, K.; Kolinska, K.; Kolinski, A. Impact of Market Drivers on the Digital Maturity of Logistics Processes in a Supply Chain. Sustainability 2023, 15, 3120. [Google Scholar] [CrossRef]
- Minnema, A.; Bijmolt, T.H.A.; Gensler, S.; Wiesel, T. To Keep or Not to Keep: Effects of Online Customer Reviews on Product Returns. J. Retail. 2016, 92, 253–267. [Google Scholar] [CrossRef]
- Naseem, M.H.; Yang, J.; Xiang, Z. Prioritizing the Solutions to Reverse Logistics Barriers for the E-Commerce Industry in Pakistan Based on a Fuzzy AHP-TOPSIS Approach. Sustainability 2021, 13, 12743. [Google Scholar] [CrossRef]
- Bączkiewicz, A.; Kizielewicz, B.; Shekhovtsov, A.; Wątróbski, J.; Sałabun, W. Methodical Aspects of MCDM Based E-Commerce Recommender System. J. Theor. Appl. Electron. Commer. Res. 2021, 16, 2192–2229. [Google Scholar] [CrossRef]
- Brzezinski, L.; Hadas, L.; Cyplik, P. The Transformation of the Business Model of SMEs Due to COVID-19 Pandemic. Eur. Res. Stud. 2021, 24, 915–924. [Google Scholar] [CrossRef]
- Cheah, L.; Huang, Q. Comparative Carbon Footprint Assessment of Cross-Border E-Commerce Shipping Options. Transp. Res. Rec. 2022, 2676, 584–595. [Google Scholar] [CrossRef]
- Ginting, Y.; Chandra, T.; Miran, I.; Yusriadi, Y. Repurchase Intention of E-Commerce Customers in Indonesia: An Overview of the Effect of e-Service Quality, e-Word of Mouth, Customer Trust, and Customer Satisfaction Mediation. Int. J. Data Netw. Sci. 2023, 7, 329–340. [Google Scholar] [CrossRef]
- Golinska-Dawson, P.; Sethanan, K. Sustainable Urban Freight for Energy-Efficient Smart Cities—Systematic Literature Review. Energies 2023, 16, 2617. [Google Scholar] [CrossRef]
- Dubisz, D.; Golinska-Dawson, P.; Zawodny, P. Measuring CO2 Emissions in E-Commerce Deliveries: From Empirical Studies to a New Calculation Approach. Sustainability 2022, 14, 16085. [Google Scholar] [CrossRef]
- Naseem, M.H.; Yang, J.; Zhang, T.; Alam, W. Utilizing Fuzzy AHP in the Evaluation of Barriers to Blockchain Implementation in Reverse Logistics. Sustainability 2023, 15, 7961. [Google Scholar] [CrossRef]
- Shih, D.-H.; Huang, F.-C.; Chieh, C.-Y.; Shih, M.-H.; Wu, T.-W. Preventing Return Fraud in Reverse Logistics—A Case Study of ESPRES Solution by Ethereum. J. Theor. Appl. Electron. Commer. Res. 2021, 16, 2170–2191. [Google Scholar] [CrossRef]
- Bali, S.; Gunasekaran, A.; Aggarwal, S.; Tyagi, B.; Bali, V. A Strategic Decision-Making Framework for Sustainable Reverse Operations. J. Clean. Prod. 2022, 381, 135058. [Google Scholar] [CrossRef]
- Rogers, D.S.; Tibben-Lembke, R. An Examination of Reverse Logistics Practices. J. Bus. Logist. 2001, 22, 129–148. [Google Scholar] [CrossRef]
- Golinska, P.; Fertsch, M.; Gómez, J.M.; Oleskow, J. The Concept of Closed-Loop Supply Chain Integration Through Agents-Based System. In Information Technologies in Environmental Engineering; Gómez, J.M., Sonnenschein, M., Müller, M., Welsch, H., Rautenstrauch, C., Eds.; Springer: Berlin/Heidelberg, Germany, 2007; pp. 189–202. [Google Scholar]
- Kawa, A.; Golinska, P. Supply Chain Arrangements in Recovery Network. In Proceedings of the Agent and Multi-Agent Systems: Technologies and Applications: 4th KES International Symposium, KES-AMSTA 2010, Gdynia, Poland, 23–25 June 2010; pp. 292–301. [Google Scholar]
- Hadaś, Ł.; Domański, R.; Wojciechowski, H.; Majewski, A.; Lewandowicz, J. The Role of Packaging in Sustainable Omnichannel Returns—The Perspective of Young Consumers in Poland. Sustainability 2024, 16, 2231. [Google Scholar] [CrossRef]
- Dabo, A.-A.A.; Hosseinian-Far, A. An Integrated Methodology for Enhancing Reverse Logistics Flows and Networks in Industry 5.0. Logistics 2023, 7, 97. [Google Scholar] [CrossRef]
- Alarcón, F.; Cortés-Pellicer, P.; Pérez-Perales, D.; Mengual-Recuerda, A. A Reference Model of Reverse Logistics Process for Improving Sustainability in the Supply Chain. Sustainability 2021, 13, 10383. [Google Scholar] [CrossRef]
- Kar, B.; Kar, S.; Tripathy, S. Product Return in Online Purchase and Demography: E-Commerce Scenario in India. In Empirical Research for Futuristic E-Commerce Systems: Foundations and Applications; IGI Global: Hershey, PA, USA, 2022; pp. 196–212. ISBN 978-1-66844-969-1. [Google Scholar]
- Makkonen, M.; Frank, L.; Kemppainen, T. The Effects of Consumer Demographics and Payment Method Preference on Product Return Frequency and Reasons in Online Shopping; University of Maribor: Maribor, Slovenia, 2021. [Google Scholar]
- Ambilkar, P.; Dohale, V.; Gunasekaran, A.; Bilolikar, V. Product Returns Management: A Comprehensive Review and Future Research Agenda. Int. J. Prod. Res. 2022, 60, 3920–3944. [Google Scholar] [CrossRef]
- Hıda, K. The Impact of COVID-19 on e-Commerce Product Return Strategies: A Cross-National Study. Master’s Thesis, İzmir Ekonomi Üniversitesi, İzmir, Türkiye, 2021. [Google Scholar]
- Ayodele, O.O. The Impact of E-Commerce Adoption on the Return Management of Product: A Case Study of Manufacturing Industry in Nigeria. IRE J. 2024, 7, 399–408. [Google Scholar]
- Ahsan, K.; Rahman, S. A Systematic Review of E-Tail Product Returns and an Agenda for Future Research. Ind. Manag. Data Syst. 2021, 122, 137–166. [Google Scholar] [CrossRef]
- Ali, Y.; Zeb, K.; Babar, A.H.K.; Awan, M.A. Identification of Critical Factors for the Implementation of Reverse Logistics in the Manufacturing Industry of Pakistan. J. Def. Anal. Logist. 2021, 5, 95–112. [Google Scholar] [CrossRef]
- Davidavičienė, V.; Majzoub, M.A. Performance of Reverse Logistics in Electronic Commerce: A Case Study from Lebanon and Syria. Transport 2021, 36, 260–282. [Google Scholar] [CrossRef]
- Lesmono, S.U.; Santoso, T.; Wijaya, S.; Jie, F. The Effect of Switching Cost and Product Return Management on Repurchase Intent: A Case Study in the B2B Distribution Channel Context in Indonesia. Int. J. Supply Chain Manag. 2020, 9, 44–53. [Google Scholar]
- Wang, X.; Xie, J.; Fan, Z.-P. B2C Cross-Border E-Commerce Logistics Mode Selection Considering Product Returns. Int. J. Prod. Res. 2021, 59, 3841–3860. [Google Scholar] [CrossRef]
- Yu, Y.; Kim, H.-S. Online Retailers’ Return Policy and Prefactual Thinking: An Exploratory Study of USA and China e-Commerce Markets. J. Fash. Mark. Manag. Int. J. 2019, 23, 504–518. [Google Scholar] [CrossRef]
- Michel, A.; Handayani, P.W.; Fitriani, W.R. Mobile Commerce Service Quality Comparison Between Physical and Digital Product. In Proceedings of the 2020 International Conference on Information Management and Technology (ICIMTech), Bandung, Indonesia, 13–14 August 2020; pp. 681–686. [Google Scholar]
- Chayanon, S.; Srisorn, W. The Green Capability, Product Return, Value Chain Costing and the Adoption of Closed Loop Supply Chain in the Automobile Industry of Indonesia. Int. J. Supply Chain Manag. 2019, 8, 479–491. [Google Scholar]
- Wilson, N.; Christella, R. An Empirical Research of Factors Affecting Customer Satisfaction: A Case of the Indonesian E-Commerce Industry. DeReMa J. Manaj. 2019, 14, 21. [Google Scholar] [CrossRef]
- Lamba, D.; Yadav, D.K.; Barve, A.; Panda, G. Prioritizing Barriers in Reverse Logistics of E-Commerce Supply Chain Using Fuzzy-Analytic Hierarchy Process. Electron. Commer. Res. 2020, 20, 381–403. [Google Scholar] [CrossRef]
- Sirisawat, P.; Kiatcharoenpol, T. Fuzzy AHP-TOPSIS Approaches to Prioritizing Solutions for Reverse Logistics Barriers. Comput. Ind. Eng. 2018, 117, 303–318. [Google Scholar] [CrossRef]
- Titiyal, R.; Bhattacharya, S.; Thakkar, J.J. The Distribution Strategy Selection for an E-Tailer Using a Hybrid DANP VIKOR MCDM Model. Benchmarking Int. J. 2019, 26, 395–433. [Google Scholar] [CrossRef]
- Prakash, C.; Barua, M.K. A Combined MCDM Approach for Evaluation and Selection of Third-Party Reverse Logistics Partner for Indian Electronics Industry. Sustain. Prod. Consum. 2016, 7, 66–78. [Google Scholar] [CrossRef]
- Arab, A. A Systematic Review of Multi-Objective Optimization Applications in Reverse Logistics. J. Supply Chain Manag. Sci. 2022, 3, 37–64. [Google Scholar] [CrossRef]
- Sosnowski, P.; Cyplik, P. Closed Loop Supply Chains and Circular Economy—The Possibilities of Interplay. Logforum 2022, 18, 505–513. [Google Scholar] [CrossRef]
- Kawa, A.; Zdrenka, W. Logistics Value in E-Commerce and Its Impact on Customer Satisfaction, Loyalty and Online Retailers’ Performance. Int. J. Logist. Manag. 2023, 35, 577–600. [Google Scholar] [CrossRef]
- Alkahtani, M.; Ziout, A.; Salah, B.; Alatefi, M.; Abd Elgawad, A.E.E.; Badwelan, A.; Syarif, U. An Insight into Reverse Logistics with a Focus on Collection Systems. Sustainability 2021, 13, 548. [Google Scholar] [CrossRef]
- Frei, R.; Jack, L.; Krzyzaniak, S.-A. Mapping Product Returns Processes in Multichannel Retailing: Challenges and Opportunities. Sustainability 2022, 14, 1382. [Google Scholar] [CrossRef]
- Pei, Z.; Paswan, A. Consumers’ Legitimate and Opportunistic Product Return Behaviors: An Extended Abstract. In Marketing at the Confluence between Entertainment and Analytics; Rossi, P., Ed.; Springer International Publishing: Cham, Switzerland, 2017; pp. 1405–1408. [Google Scholar]
- Prajapati, D.; Pratap, S.; Zhang, M.; Lakshay; Huang, G.Q. Sustainable Forward-Reverse Logistics for Multi-Product Delivery and Pickup in B2C E-Commerce towards the Circular Economy. Int. J. Prod. Econ. 2022, 253, 108606. [Google Scholar] [CrossRef]
- Zhao, X.; Hu, S.; Meng, X. Who Should Pay for Return Freight in the Online Retailing? Retailers or Consumers. Electron. Commer. Res. 2020, 20, 427–452. [Google Scholar] [CrossRef]
- Kar, B.; Tripathy, A.; Pathak, M.D. What Causes Product Returns in Online Purchases? A Review and Research Agenda. Prabandhan Indian J. Manag. 2022, 15, 46–62. [Google Scholar] [CrossRef]
- Saarijärvi, H.; Sutinen, U.-M.; Harris, L.C. Uncovering Consumers’ Returning Behaviour: A Study of Fashion e-Commerce. Int. Rev. Retail Distrib. Consum. Res. 2017, 27, 284–299. [Google Scholar] [CrossRef]
- Vijayakumar, M. Online shopping: Motivations for purchase, customer satisfaction and product return. Korea Rev. Int. Stud. 2023, 16, 98–110. [Google Scholar]
- Lin, D.; Lee, C.K.M.; Siu, M.K.; Lau, H.; Choy, K.L. Analysis of Customers’ Return Behaviour after Online Shopping in China Using SEM. Ind. Manag. Amp Data Syst. 2020, 120, 883–902. [Google Scholar] [CrossRef]
- Qin, Z. The Inventory Control System of Reverse Logistics for E-Commerce Packaging Recovery Based on BP Neural Network. Int. J. Circuits Syst. Signal Process. 2022, 16, 413–425. [Google Scholar] [CrossRef]
- Risberg, A. A Systematic Literature Review on E-Commerce Logistics: Towards an e-Commerce and Omni-Channel Decision Framework. Int. Rev. Retail Distrib. Consum. Res. 2023, 33, 67–91. [Google Scholar] [CrossRef]
- Garg, C.P. A Robust Hybrid Decision Model to Evaluate Critical Factors of Reverse Logistics Implementation Using Grey-DEMATEL Framework. Opsearch 2020, 57, 837–873. [Google Scholar] [CrossRef]
- de Borba, J.L.G.; de Magalhães, M.R.; Filgueiras, R.S.; Bouzon, M. Barriers in Omnichannel Retailing Returns: A Conceptual Framework. Int. J. Retail Amp; Distrib. Manag. 2020, 49, 121–143. [Google Scholar] [CrossRef]
- Agrawal, S.; Singh, R.K.; Murtaza, Q. Prioritizing Critical Success Factors for Reverse Logistics Implementation Using Fuzzy-TOPSIS Methodology. J. Ind. Eng. Int. 2016, 12, 15–27. [Google Scholar] [CrossRef]
- Frei, R.; Jack, L.; Brown, S. Product Returns: A Growing Problem for Business, Society and Environment. Int. J. Oper. Prod. Manag. 2020, 40, 1613–1621. [Google Scholar] [CrossRef]
- Badenhorst, A. Prioritising the Implementation of Practices to Overcome Operational Barriers in Reverse Logistics: Original Research. J. Transp. Supply Chain Manag. 2016, 10, 1–12. [Google Scholar] [CrossRef]
- Thiyagarajan, G.; Ali, S. Analysis of Reverse Logistics Implementation Barriers in Online Retail Industry. Indian J. Sci. Technol. 2016, 9, 1–16. [Google Scholar] [CrossRef]
- Darko, A.; Chan, A.P.C.; Ameyaw, E.E.; Owusu, E.K.; Pärn, E.; Edwards, D.J. Review of Application of Analytic Hierarchy Process (AHP) in Construction. Int. J. Constr. Manag. 2019, 19, 436–452. [Google Scholar] [CrossRef]
- Charmaz, K.; Bryant, A. The SAGE Handbook of Grounded Theory; Sage Publications: New York, NY, USA, 2007; pp. 1–656. [Google Scholar]
- Ishizaka, A.; Labib, A. Review of the Main Developments in the Analytic Hierarchy Process. Expert Syst. Appl. 2011, 38, 14336–14345. [Google Scholar] [CrossRef]
- Saaty, T.L.; Vargas, L.G. The Analytic Network Process. In Decision Making with the Analytic Network Process: Economic, Political, Social and Technological Applications with Benefits, Opportunities, Costs and Risks; Saaty, T.L., Vargas, L.G., Eds.; Springer: Boston, MA, USA, 2013; pp. 1–40. ISBN 978-1-4614-7279-7. [Google Scholar]
- Dong, Y.; Xu, Y.; Li, H.; Dai, M. A Comparative Study of the Numerical Scales and the Prioritization Methods in AHP. Eur. J. Oper. Res. 2008, 186, 229–242. [Google Scholar] [CrossRef]
- Tutorials—AHP Calculation Methods. Available online: https://www.spicelogic.com/docs/ahpsoftware/intro/ahp-calculation-methods-396 (accessed on 6 August 2024).
- de Araújo, A.C.; Matsuoka, E.M.; Ung, J.E.; Massote, A.; Sampaio, M. An Exploratory Study on the Returns Management Process in an Online Retailer. Int. J. Logist. Res. Appl. 2018, 21, 345–362. [Google Scholar] [CrossRef]
- Hjort, K.; Hellström, D.; Karlsson, S.; Oghazi, P. Typology of Practices for Managing Consumer Returns in Internet Retailing. Int. J. Phys. Distrib. Logist. Manag. 2019, 49, 767–790. [Google Scholar] [CrossRef]
- Hjort, K. On Aligning Returns Management with the E-Commerce Strategy to Increase Effectiveness. Ph.D. Thesis, Chalmers University of Technology, Gothenburg, Sweden, 2013. [Google Scholar]
- Li, G.; Li, W. The Analysis of Return Reverse Logistics Management Strategy Based on B2C Electronic Commerce; Atlantis Press: Amsterdam, The Netherlands, October 2015; pp. 757–761. [Google Scholar]


Disclaimer/Publisher’s Note: The statements, opinions and data contained in all publications are solely those of the individual author(s) and contributor(s) and not of MDPI and/or the editor(s). MDPI and/or the editor(s) disclaim responsibility for any injury to people or property resulting from any ideas, methods, instructions or products referred to in the content. |
© 2024 by the authors. Licensee MDPI, Basel, Switzerland. This article is an open access article distributed under the terms and conditions of the Creative Commons Attribution (CC BY) license (https://creativecommons.org/licenses/by/4.0/).