Article

Integrated Control Design for Hybrid Grid-Photovoltaic Systems in Distillation Applications: A Reference Model and Fuzzy Logic Approach

1
Laboratory of Engineering Sciences for Energy (LABSIPE), National School of Applied Sciences (ENSA) of El Jadida, Chouaib-Doukkali University, El Jadida B.P. 299-24000, Morocco
2
Department of Electrical Engineering, Quaid-e-Azam College of Engineering and Technology, Sahiwal 57000, Pakistan
3
Department of Electrical Engineering, College of Engineering, Najran University, Najran 66462, Saudi Arabia
4
Smart Grids Research Group, Center of Research Excellence in Renewable Energy and Power Systems, King Abdulaziz University, Jeddah 21589, Saudi Arabia
5
Department of Electrical and Computer Engineering, Faculty of Engineering, King Abdulaziz University, Jeddah 21589, Saudi Arabia
6
Department of Electrical Engineering, College of Engineering, Northern Border University, Arar 73213, Saudi Arabia
*
Authors to whom correspondence should be addressed.
Sustainability 2024, 16(17), 7304; https://doi.org/10.3390/su16177304
Submission received: 4 May 2024 / Revised: 20 June 2024 / Accepted: 16 August 2024 / Published: 25 August 2024

Abstract

:
This paper presents a novel hybrid structural control solution designed for distillation systems that utilize a solar source alongside an electrical grid. The power conversion architecture incorporates a reversible bridge rectifier and a quadratic boost converter. The hybrid photovoltaic grid configuration offers several benefits, including source complementarity, enhanced dependability, and energy availability aligned with power requirements. Leveraging a photovoltaic source operating at maximum power facilitates energy conservation. On the control front, an adaptive technique based on a reference model is proposed. Fuzzy logic governs the quadratic boost converter, simplifying the management of its complex nonlinear nature. The control strategy aims to maximize solar power utilization, minimize harmonic components in the grid current, synthesize an adaptive controller, and achieve a near-unit power factor on the grid. The simulation results for a steady distillation system demonstrate promising findings. Despite variations in irradiation, load power, and grid drops, the system maintains a minimal bus voltage ripple, remaining close to the intended value. Optimization of the panel-generated power leads to improved PV source utilization and enhanced system efficiency. Furthermore, the combination with an electrical grid achieves a low rate of grid current distortion and a unitary power factor.

1. Introduction

Today, the world is facing the challenge of massive freshwater scarcity, which is expected to increase dramatically with rapid population and industrial growth, as well as the pollution of natural water resources (lakes and rivers). On the other hand, the water of oceans, seas, and rivers covers more than 75% of the planet, of which approximately 97% is saline or brackish in nature [1]. This indicates that desalination (using membrane and thermal technologies) is one of the most effective and affordable technologies for solving the global freshwater shortage problem [2,3,4]. In the distillation process, the quality of the heat exchange systems primarily involves the use of a mix of conventional generators and sources of renewable energy to produce thermal energy, as well as efficient management and proper control of the energy supplied to the desalination plant. In this type of hybrid system, electrical networks typically have complementary profiles and are used as backup energy sources.
With the emergence of many industrial applications powered by DC voltage sources, such as hybrid systems, AC–DC converters are in high demand to connect AC sources to DC voltage loads. Because AC–DC converters are nonlinear and non-minimum-phase AC–DC converters, connecting these converters to an AC source generates undesirable current harmonics [5]. To overcome these drawbacks, the control system must strive to achieve both goals simultaneously with load voltage regulation and power factor correction. Some studies have focused on the investigation and development of rectifier control strategies. In [6], the authors used the singular perturbation technique on AC–DC converters to design the control law and achieve closed-loop control objectives, as well as to determine the conditions that ensure open-loop power factor correction. Controlling filtered boost AC/DC converters was addressed in [7] using a backstepping approach to create a double-loop controller based on a nonlinear system model.
The performance of the controller was tested experimentally. In contrast to existing methods that only consider the dynamics of a single domain, a digital current control technique is designed [8] by combining time- and frequency-domain dynamics. The steady-state error in the frequency domain can be eliminated by adaptively changing the coefficients of the proposed controller. In [9], the authors proposed sensorless single-loop bidirectional current control (BCSC) for a full-bridge AC/DC converter for the first time. In [10], the authors proposed a nonlinear sliding mode controller with a redefined sliding collector and a boundary layer solution for a full-bridge AC/DC converter. To obtain a sinusoidal line current and single-phase rectifier with a unity power factor, the authors proposed in [11] a fixed switching frequency control by establishing a relationship between the fixed switching frequency and line current error.
In comparison to other types of power converters, DC–DC converters currently hold a significant position in photovoltaic (PV) applications because they can balance the solar energy produced with that required by the output load by operating independently of the output load and variation in the incoming voltage [12,13,14]. In this regard, a quadratic boost converter (QBC) is the best converter for the majority of PV applications because it can ensure high voltage gain and drain current without source ripple [15,16,17]. In various applications, control and observation techniques have been proposed for the control of DC–DC converters, such as the PI controller, singular perturbation, backstepping, and sliding mode [13,18,19]. To track the optimal operation of the PV system, maintain it at its maximum power point (MPP), and increase its maximum energy production efficiency, it is necessary to use a control algorithm known as maximum power point tracking (MPPT) [20,21,22,23]. Numerous methods have been suggested to obtain the highest amount of electricity from solar panels. The most popular and widely used algorithms are Perturb and Observe (PO) [24,25], hill climbing [26], and Incremental Conductance (INC) [27], as well as other intelligent techniques based on fuzzy logic and neural networks [17,28]. These techniques differ in their efficiency, low computational cost, robustness to climate change, and ease of implementation.
This study focuses on the control and management of hybrid systems for distillation applications. To the best of the authors’ knowledge, few studies have proposed a hybrid system for distillation applications, composed of a main renewable energy source represented by PV energy and a conventional secondary energy source represented by an electrical grid. The solution proposed in this study involves two controllers, one of which has a cascade structure. They are distinguished by their robustness to output load variations and changing climatic conditions (temperature and irradiation). The first, located on the PV array side, is designed using the fuzzy-logic technique to control the quadratic converter, such that the power generated by the PV is maximized. The second, located on the grid side, is synthesized based on model reference adaptive control to maintain tight regulation of the DC output voltage using an outer loop and to provide power factor correction using an inner loop. Model reference adaptive control ensures the character of the three switching levels, which leads to a reduction in the total harmonic distortion. This study contributes to the literature in several ways.
In comparison with existing studies based on a single energy source [29,30], whether conventional or renewable, the present work focuses on the optimization of an efficient hybrid system for the supply of distillation systems, combining an electrical grid and a PV source operating at maximum power.
Compared with other methods [31], the proposed control strategy for QBC, which is based on fuzzy logic, offers the benefit of maintaining the nonlinearity of the system without the need for an exact mathematical representation.
Unlike most existing works [13,14,17], which assume that the value of the load is perfectly known, this study develops a new adaptive controller based on the reference MRAC that can manage the hybrid energy system and achieve the control objectives despite the uncertainty that exists in the value of the load, which is assumed to be unknown. Moreover, the control strategy proposed in this study presents robustness by considering the variable behavior of the load, which leads to better control performance.
To test the reliability and performance of the hybrid system designed for power distillation systems, the authors validated the proposed control in MATLAB/Simulink by considering variations in load, solar irradiation, grid voltage, and load terminal voltage.
The remainder of this paper is structured: Section 2 is dedicated to presenting the hybrid system. The rectifier modelling and MRAC synthesis are detailed, followed by the fuzzy control of the QBC in Section 3. Section 4 and Section 5 present the simulation tests and comments on the results, in addition to the conclusions.

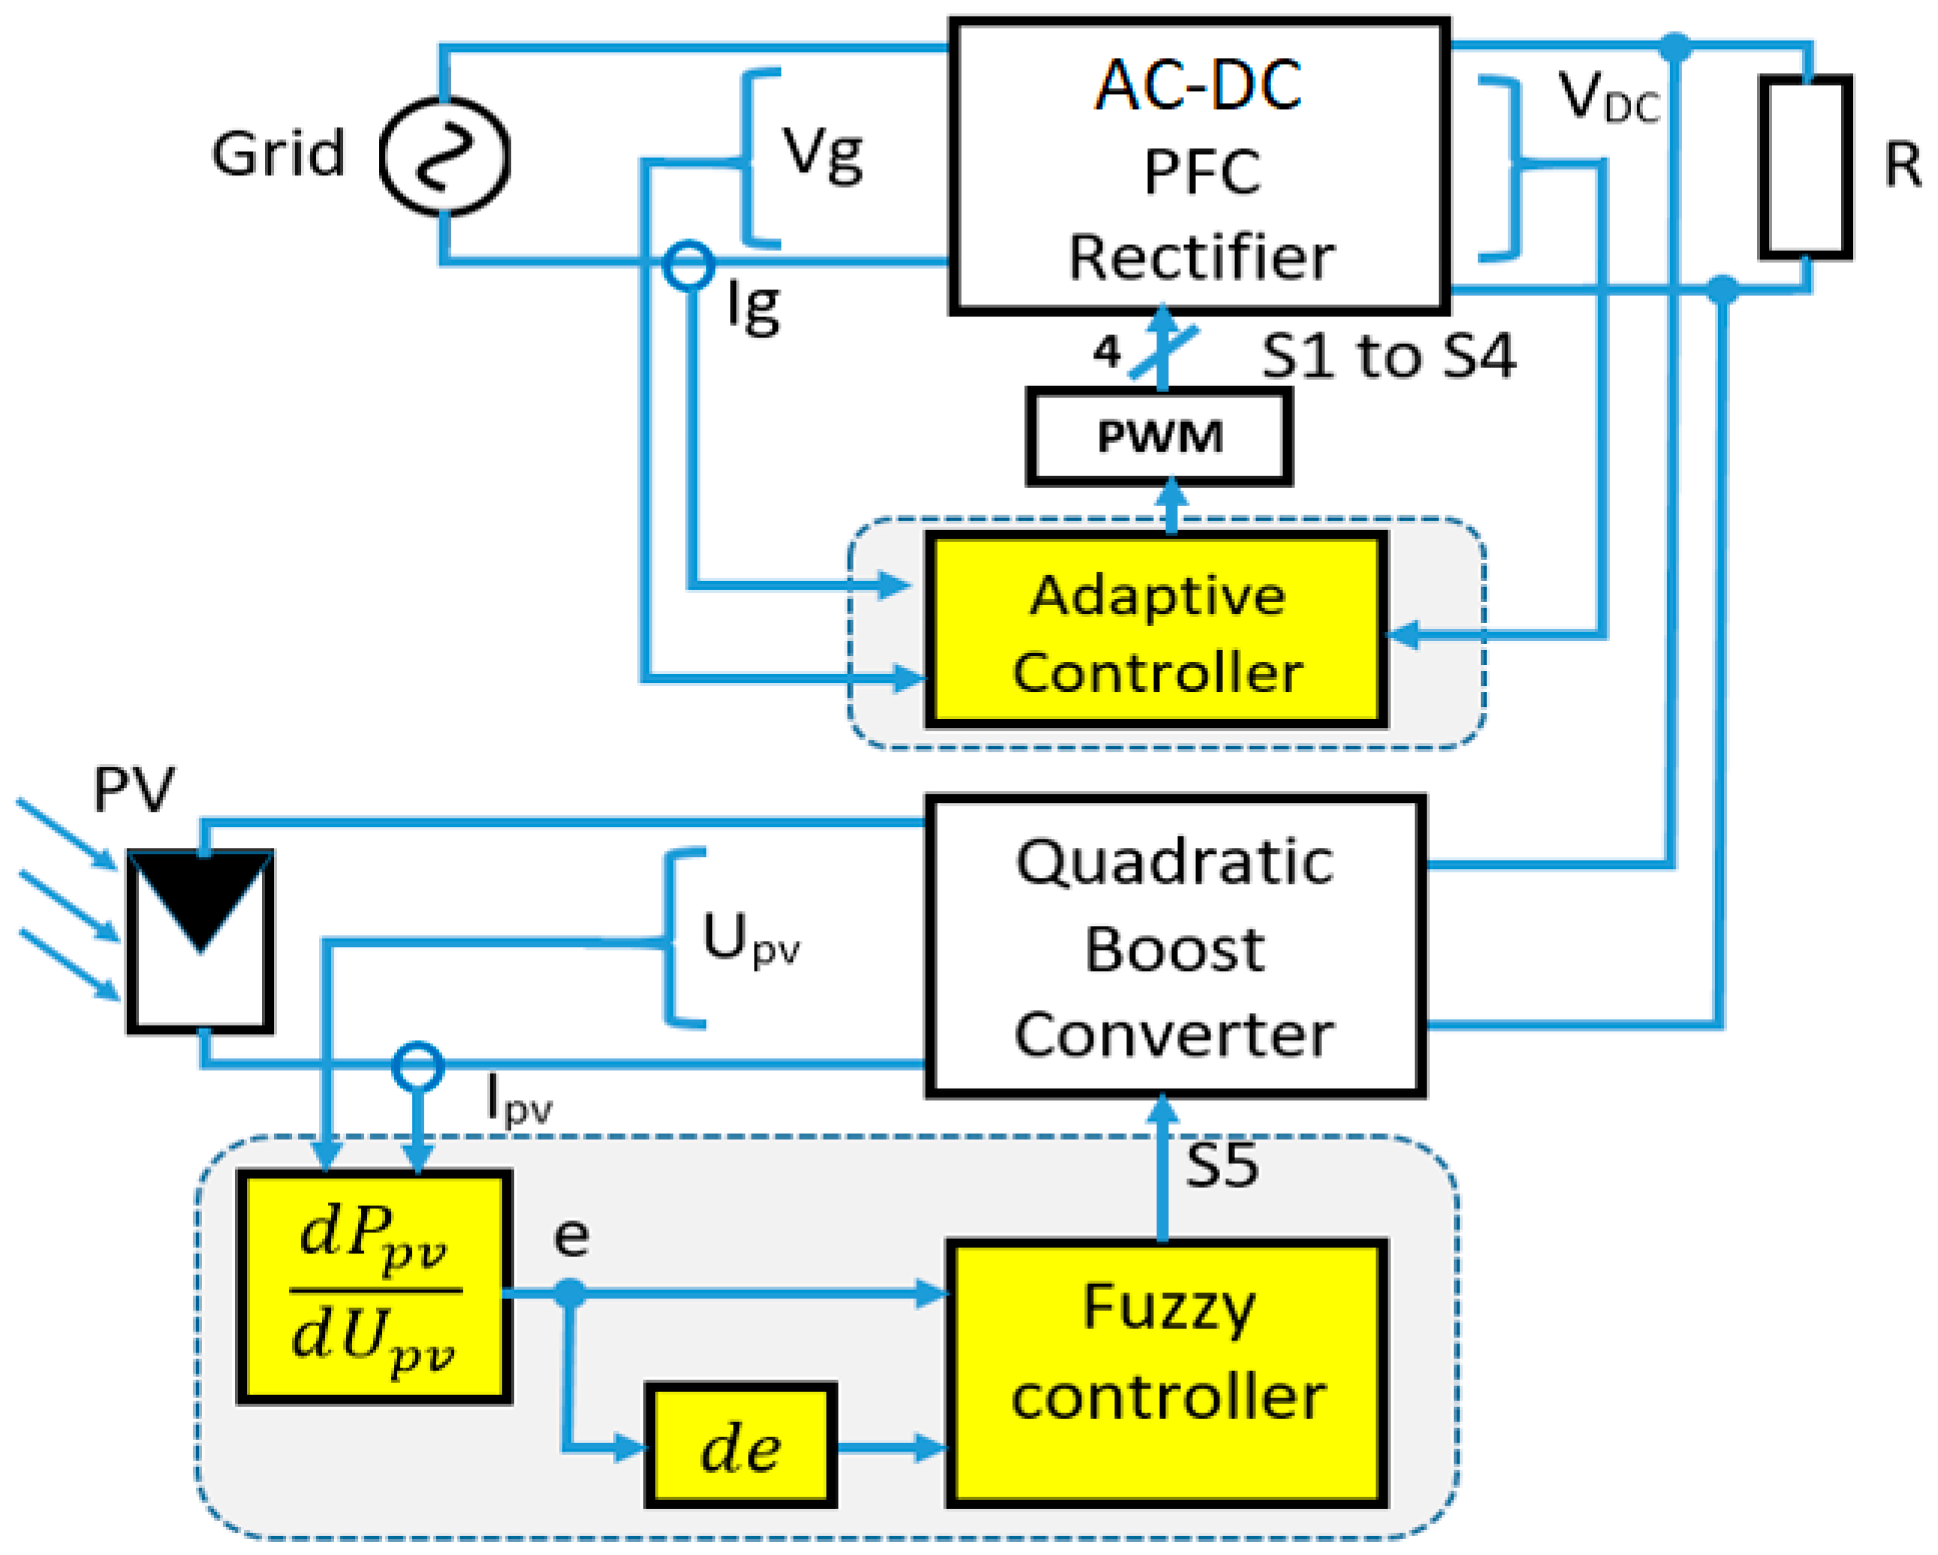
2. System Design and Justification

A block diagram of the distillation system power supply is shown in Figure 1. The electrical grid associated with the single-phase rectifier is considered the main source of the conversion of AC to DC power to supply heating resistance. The second block is composed of a PV generator associated with a QBC delivering an additional amount of power in the presence of sufficient and available irradiation and participates in reducing the load on the electrical grid and achieving energy savings. Figure 2 shows an electrical diagram of the distillation power supply. The current–voltage and power curves of the PV source for various irradiation levels are shown in Figure 3a,b.
The decision to supply the load with DC voltage in our hybrid PV grid system was based on several factors. A direct DC supply eliminates AC–DC conversion losses, which is advantageous for devices that operate on DC power. Photovoltaic panels produce DC power, which directly improves the efficiency of the system. Energy storage systems, such as batteries, also operate on DC, simplifying integration and enhancing energy management. Many modern devices such as light-emitting diodes (LED) and computers are designed for DC power, making this supply method more efficient. Additionally, DC systems avoid the harmonic distortion issues common in AC systems, thereby improving power quality and stability. These considerations ensure that our hybrid PV-grid system is efficient, reliable, and compatible with modern devices.

3. System Configuration and Design

Figure 4 illustrates the control strategies of the AC–DC and DC–DC converters. The control objectives are summarized as follows:
(a)
achieve a unity power factor (PF), grid current in phase with voltage P F 1 ;
(b)
regulate the output voltage of the heating resistor V D C 600   V ;
(c)
improve the THD and minimize the harmonics in the grid current T H D < 5 % ;
(d)
extract the maximum power from the PV source P P V P P V _ m a x .
The signal for the rectifier switch control is modulated in three levels [−1, 0, 1], the objective of which is to minimize the amplitude of the harmonics and subsequently enhance the THD of the grid current. A Fuzzy controller is used to control the DC–DC converter to operate the PV source at its maximum power according to changes in irradiation and/or temperature.

3.1. Single-Phase Rectifier Modelling and Control

Figure 2 shows an electrical diagram of the rectifier. On the AC side, the input circuit consists of the grid voltage Vg and inductance L 1 in series with parasitic resistance r . The power switches S 1 to S 4 with antiparallel diodes form the switching elements of the single-phase bridge rectifier. On the DC side, the output circuit consists of a capacitor C 1 and a resistive load R . The input voltage V g is a sinusoidal signal and the grid current is regulated to be in phase with the grid voltage. The rectifier circuit is characterized by its output voltage, whose average value is greater than the maximum grid voltage ( V D C > | V g | ) , because the rectifier is a voltage-increase circuit. Each switch has two logical states [0: open, 1: closed], and the expressions of the AC voltage V p and DC current I D C 1 according to the states of switches S1 to S4 are given in Table 1. The sinusoidal pulse width modulation (SPWM) control method, which is widely used for the control of AC–DC rectifier circuits is chosen, and the voltage V p has three levels [− V D C , 0, V D C ], and the output current I d c 1 has three levels [− I g , 0, I g ].
AC/DC rectifier modelling
Index D is the input variable evolving in the interval [−1, 1], and V D C is the output variable. Using the equivalent average model, the input voltage Vp and output current IDC1 are expressed by (1) and (2), respectively:
V P = D . V D C
I D C 1 = D . I g
The following Equations (3) and (4) govern the operation of a single-phase rectifier.
d I g d t = V g L 1 D . V D C L 1 r I g L 1
d V D C d t = I D C C 1 V D C R . C 1
where Ig and IDC are the grid current and the sum of the output current of the AC–DC rectifier and the DC–DC converter, respectively. Vg and VDC are the grid and load voltage, respectively. L 1 ,   r , and C 1 are the filtering inductance, parasitic resistance on the alternating current side, and capacitance on the DC side, respectively. Equations (3) and (4) can be rewritten in the following form
x ˙ 1 = a 1 x 1 + b 1 u 1  
x ˙ 2 = a 2 x 2 + b 2 u 2
where x 1 = V D C 2 , x 2 = I g ,   a 1 = 2 R . C 1 , b 1 = 2 C 1 ,   u 1 = P D C = V D C I D C , a 2 = r L 1 , b 2 = 1 L 1 and u 2 = V g D . V D C .
In the MRAC synthesis phase, the following assumptions are made:
(a)
The switch S1S5 are assumed to be ideal, and the AC–DC and DC–DC converters have a unit efficiency η A C D C = η D C D C = 1 ;
(b)
The Joule losses of the inductance L1 are presented by the resistance r;
(c)
The parameters R, r, L1, and C1 are assumed to be unknown;
(d)
Grid voltage V g may be measured, and the rectifier output voltage is thought to vary gradually V D C V ¯ D C ;
(e)
The internal grid current loop is faster than the external output voltage loop.

3.2. Selection of PV Array Voltage

The selection of a 150 V PV array voltage for the QBC output voltage of 600 V is based on several key considerations. A 150 V PV array voltage offers greater modularity and flexibility, accommodating various PV module configurations and enhancing adaptability. It also enables the use of more cost-effective components with lower voltage ratings, thereby reducing costs and complexities. Lower voltages inherently reduce electrical hazards, thereby improving the safety of installation and maintenance. The QBC is designed to operate efficiently within this voltage range, ensuring high efficiency. Additionally, the overall system, including energy storage and load requirements, has been optimized for a 150 V PV array voltage, balancing design parameters for reliable operation.

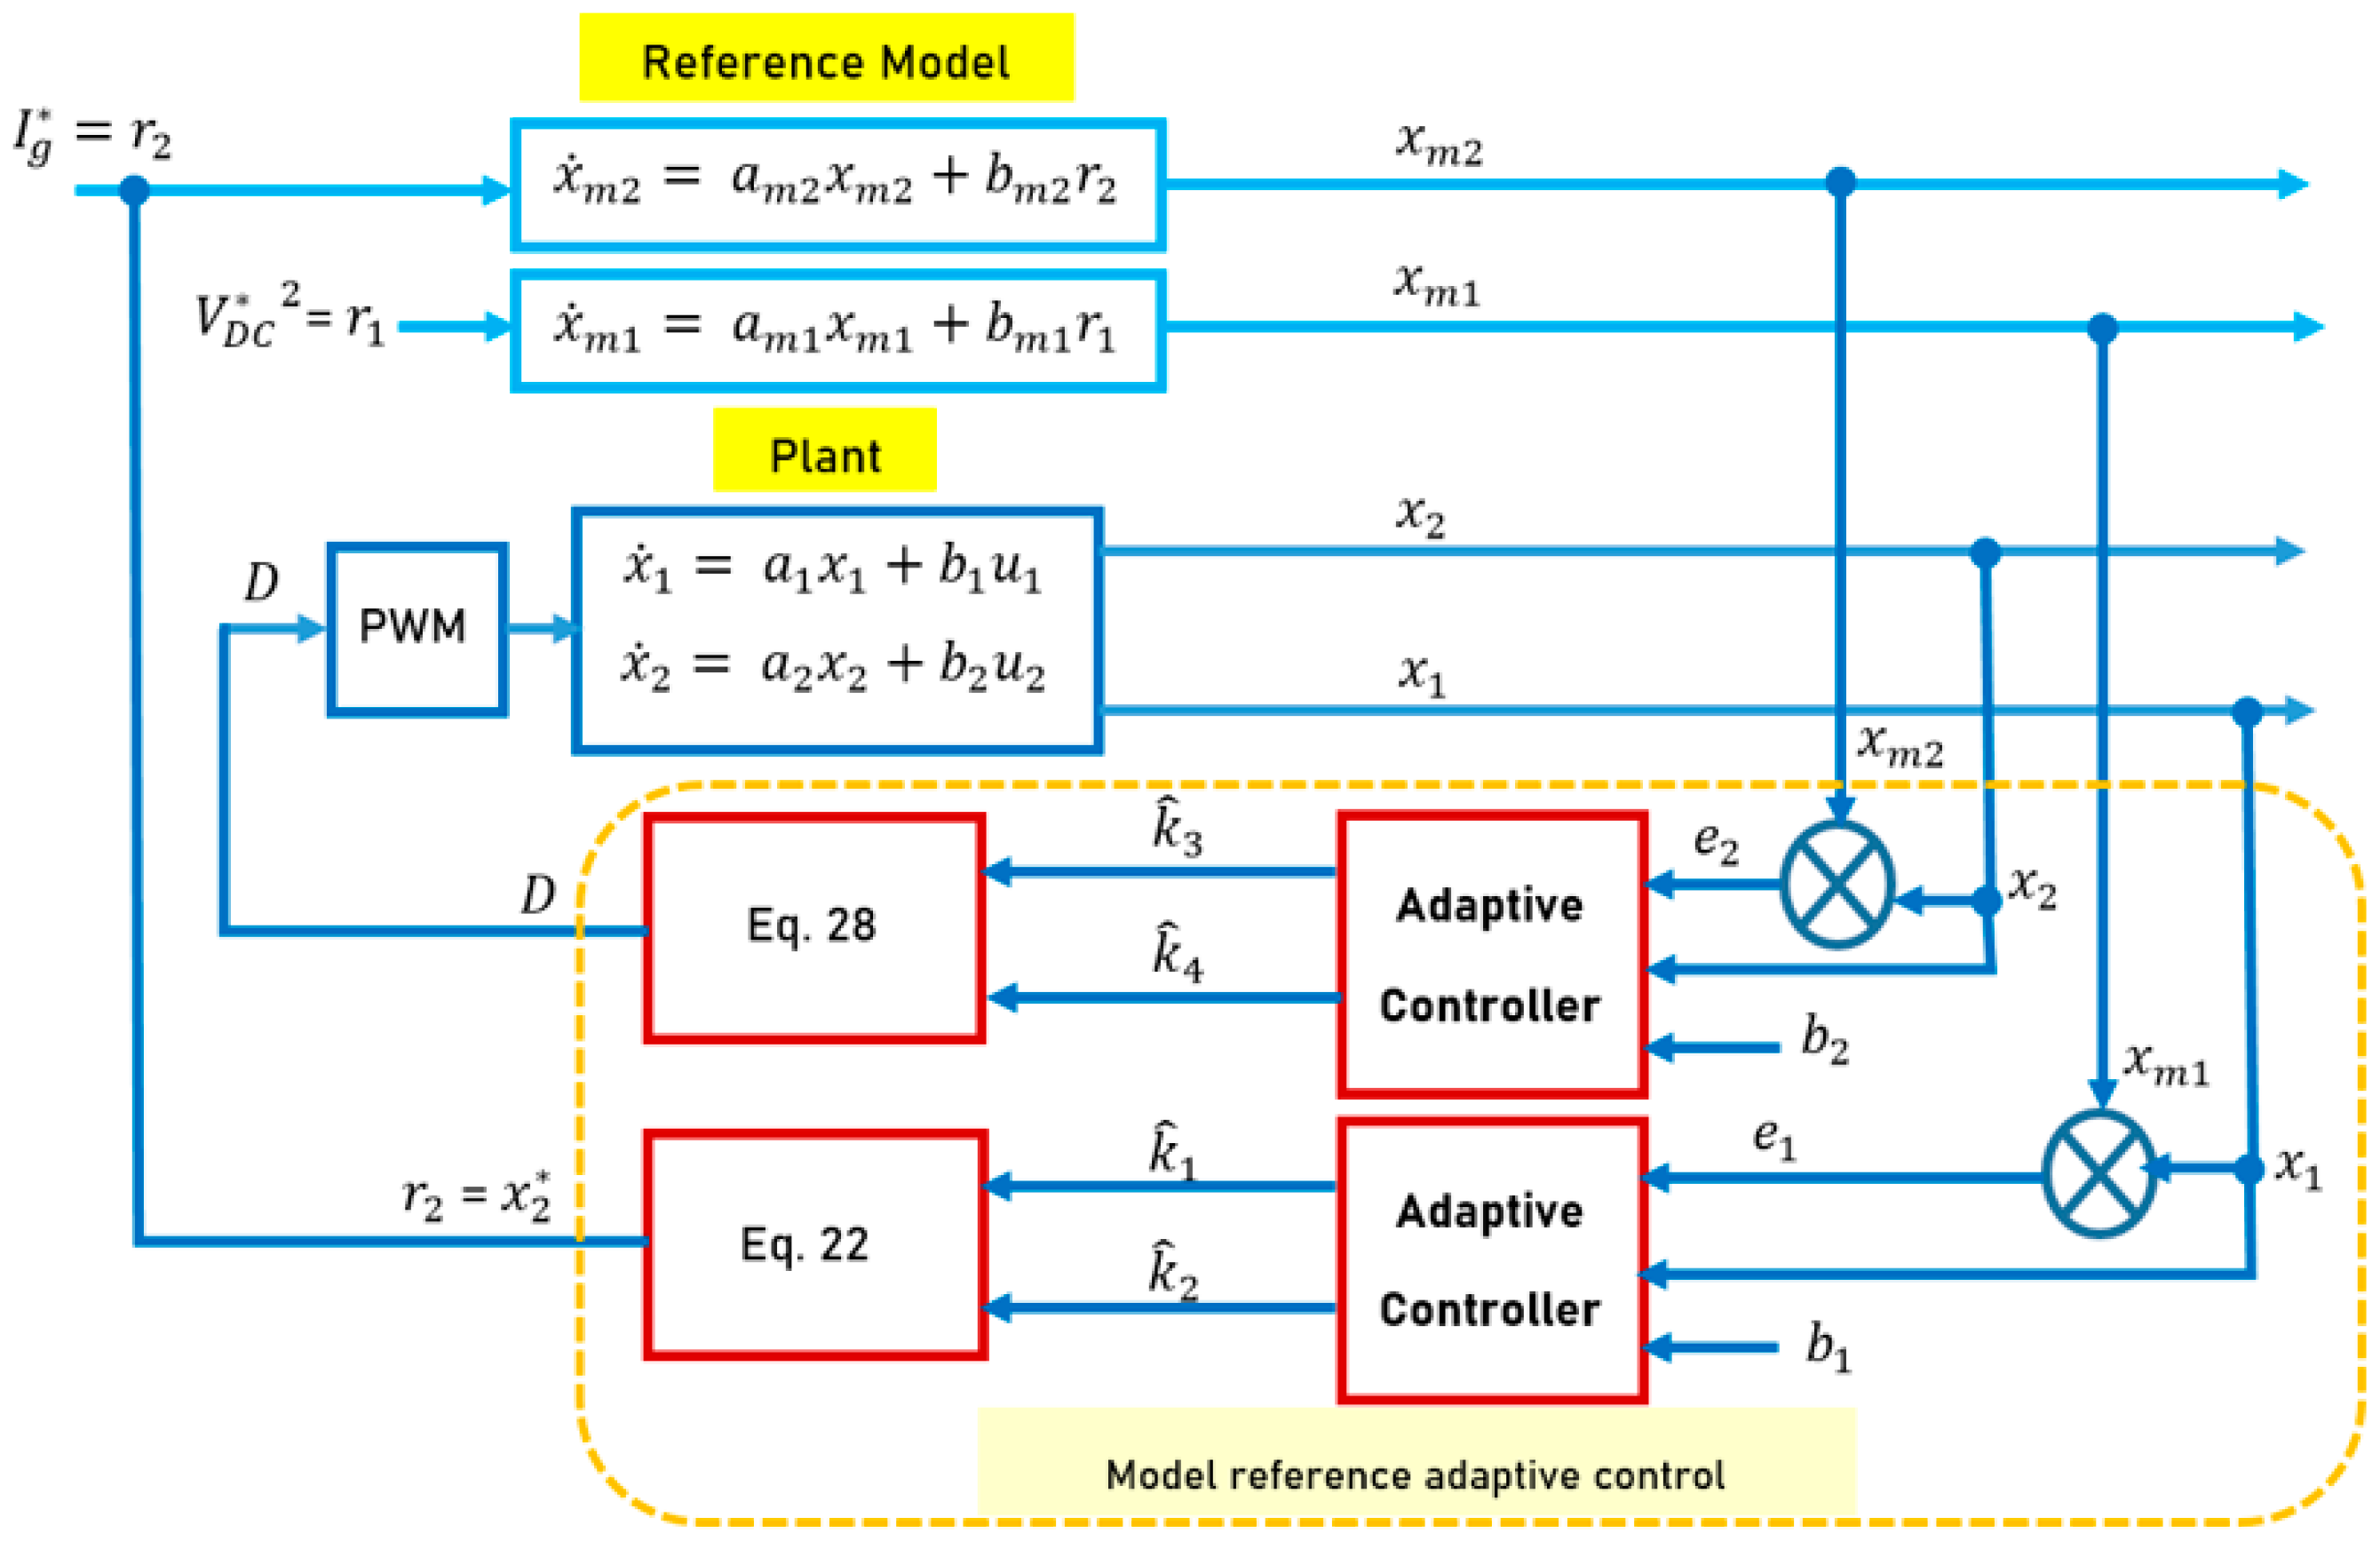
3.3. Model Reference Adaptive Control for Grid Current Optimization

To optimize the grid current characteristics, we utilized MRAC. MRAC aims to minimize the total harmonic distortion (THD) of the grid current and ensure phase alignment with the grid voltage. This adaptive control mechanism adjusts the inverter’s output in real-time based on the reference model that defines the desired performance criteria. Thus, the MRAC maintains a high-quality power supply, reduces losses, and improves the overall stability and efficiency of the hybrid system. Consider the following reference model
x ˙ m 1 = a m 1 x m 1 + b m 1 r 1
x ˙ m 2 = a m 2 x m 2 + b m 2 r 2
Parameters am1, am2, bm1, and bm2 of the reference model are assumed to be known, and r1 and r2 are the reference model inputs. The control objective is to converge x1 to xm1, and x2 to xm2.
Let us calculate the error e 1 and e 2
e 1 = x 1 x m 1
e 2 = x 2 x m 2
The derivative of the error is expressed by
e ˙ 1 = x ˙ 1 x ˙ m 1
e ˙ 2 = x ˙ 2 x ˙ m 2
By choosing a command of the following form
u 1 = k 1 x 1 + k 2 r 1
u 2 = k 3 x 2 + k 4 r 2
k1, k2, k3, and k4 are the controller parameters.
By replacing (5), (7) and (13) in (11), and replacing (6), (8), and (14) in (12), the error derivatives are expressed as
e ˙ 1 = x 1 a 1 + b 1 k 1 a m 1 x m 1 + a 1 b 1 k 2 b m 1
e ˙ 2 = x 2 a 2 + b 2 k 3 a m 2 x m 2 + a 2 b 2 k 4 b m 2
Because the objective is to converge x1 to xm1 and x2 to xm2, the derivatives of e1 and e2 converge to zero when the following conditions are satisfied:
a 1 + b 1 k 1 = a m 1
b 1 k 2 = b m 1
a 2 + b 2 k 3 = a m 2
b 2 k 4 = b m 2
Assuming that a1, b1, a2, and b2 are unknown, parameters k1, k2, k3, and k4 cannot be obtained.
Let the new expression for the control input
u 1 = k ^ 1 x 1 + k ^ 2 r 1
u 2 = k ^ 3 x 2 + k ^ 4 r 2
where k ^ 1 , k ^ 2 , k ^ 3 and k ^ 4 are the estimate of the parameters k 1 , k 2 , k 3 and k 4 .
The parameters estimation errors are expressed by
k ~ 1 = k 1 k ^ 1
        k ~ 2 = k 2 k ^ 2  
k ~ 3 = k 3 k ^ 3
        k ~ 4 = k 4 k ^ 4  
Let us recalculate the derivative of the error using (5)–(8) and (11)–(14)
e ˙ 1 = x 1 a 1 + b 1 k ^ 1 a m 1 x m 1 + r 1 b 1 k ^ 2 b m 1
e ˙ 2 = x 2 a 2 + b 2 k ^ 3 a m 2 x m 2 + r 2 b 2 k ^ 4 b m 2
Using (17)–(20) and (23)–(26), the simplified expression of the error derivative is obtained
e ˙ 1 = a m 1 e 1 b 1 k ~ 1 x 1 r 1 b 1 k ~ 2
e ˙ 2 = a m 2 e 2 b 2 k ~ 3 x 2 r 2 b 2 k ~ 4
Choosing the following Lyapunov function
V = e 1 2 2 + e 2 2 2 + k ~ 1 2 2 + k ~ 2 2 2 + k ~ 3 2 2 + k ~ 4 2 2
The derivative of the Lyapunov function is
V ˙ = e 1 e ˙ 1 + e 2 e ˙ 2 + k ~ 1 k ~ ˙ 1 + k ~ 2 k ~ ˙ 2 + k ~ 3 k ~ ˙ 3 + k ~ 4 k ~ ˙ 4
The Lyapunov function’s derivative using (29) and (30) is
V ˙ = a m 1 e 1 2 + a m 2 e 2 2 k ~ 1 b 1 e 1 x 1 + k ^ ˙ 1 k ~ 2 r 1 b 1 e 1 + k ^ ˙ 2 k ~ 3 b 2 e 2 x 2 + k ^ ˙ 3 k ~ 4 r 2 b 2 e 2 + k ^ ˙ 4
The parameters am1 and am2 have negative sign (am1 < 0, am2 < 0), the Lyapunov derivative is negative V ˙ = a m 1 e 1 2 + a m 2 e 2 2 < 0 if the following conditions (34)–(37) are satisfied
k ^ ˙ 1 = b 1 e 1 x 1
k ^ ˙ 2 = r 1 b 1 e 1
k ^ ˙ 3 = b 2 e 2 x 2
k ^ ˙ 4 = r 2 b 2 e 2
Because parameters b1 and b2 are unknown, b1 and b2 are chosen to obtain convergence in finite times of x1 to xm1 and x2 to xm2.
u1 is not a real input control, the expression (21) allows to choose the reference of the power PDC* delivered to the load, hence
P D C = u 1 = k ^ 1 x 1 + k ^ 2 r 1
r1 is the reference model input r 1 = V D C 2 .
Using the equality of the produced/consumed powers, we obtain the grid current reference r2, hence
r 2 = 2 . P D C P p v V g _ .   sin ω t
where V g _ is the grid voltage amplitude, Ppv is the PV power and ω is the grid current pulsation ω = 2 . π . f g .
By replacing u2 and r2 by their expressions in (22), we obtain the expression of u2
u 2 = V g D . V D C = k ^ 3 x 2 + 2 . k ^ 4 P D C P p v . sin ω t V g _
Replacing (21) in (26), and replacing x1, x2, and r1 by their expressions, the u2 is obtained
u 2 = k ^ 3 I g + 2 . k ^ 4 k ^ 1 V D C 2 + 2 . k ^ 4 k ^ 2 V D C 2 2 . k ^ 4 P p v   V g _ . sin ω t
Hence, the command input is
D = 1 V D C V g k ^ 3 I g 2 . k ^ 4 k ^ 1 V D C 2 + 2 . k ^ 4 k ^ 2 V D C 2 2 . k ^ 4 P p v   V g _ . sin ω t
The fundamentals of the proposed control technique based on MRAC are shown in Figure 5.

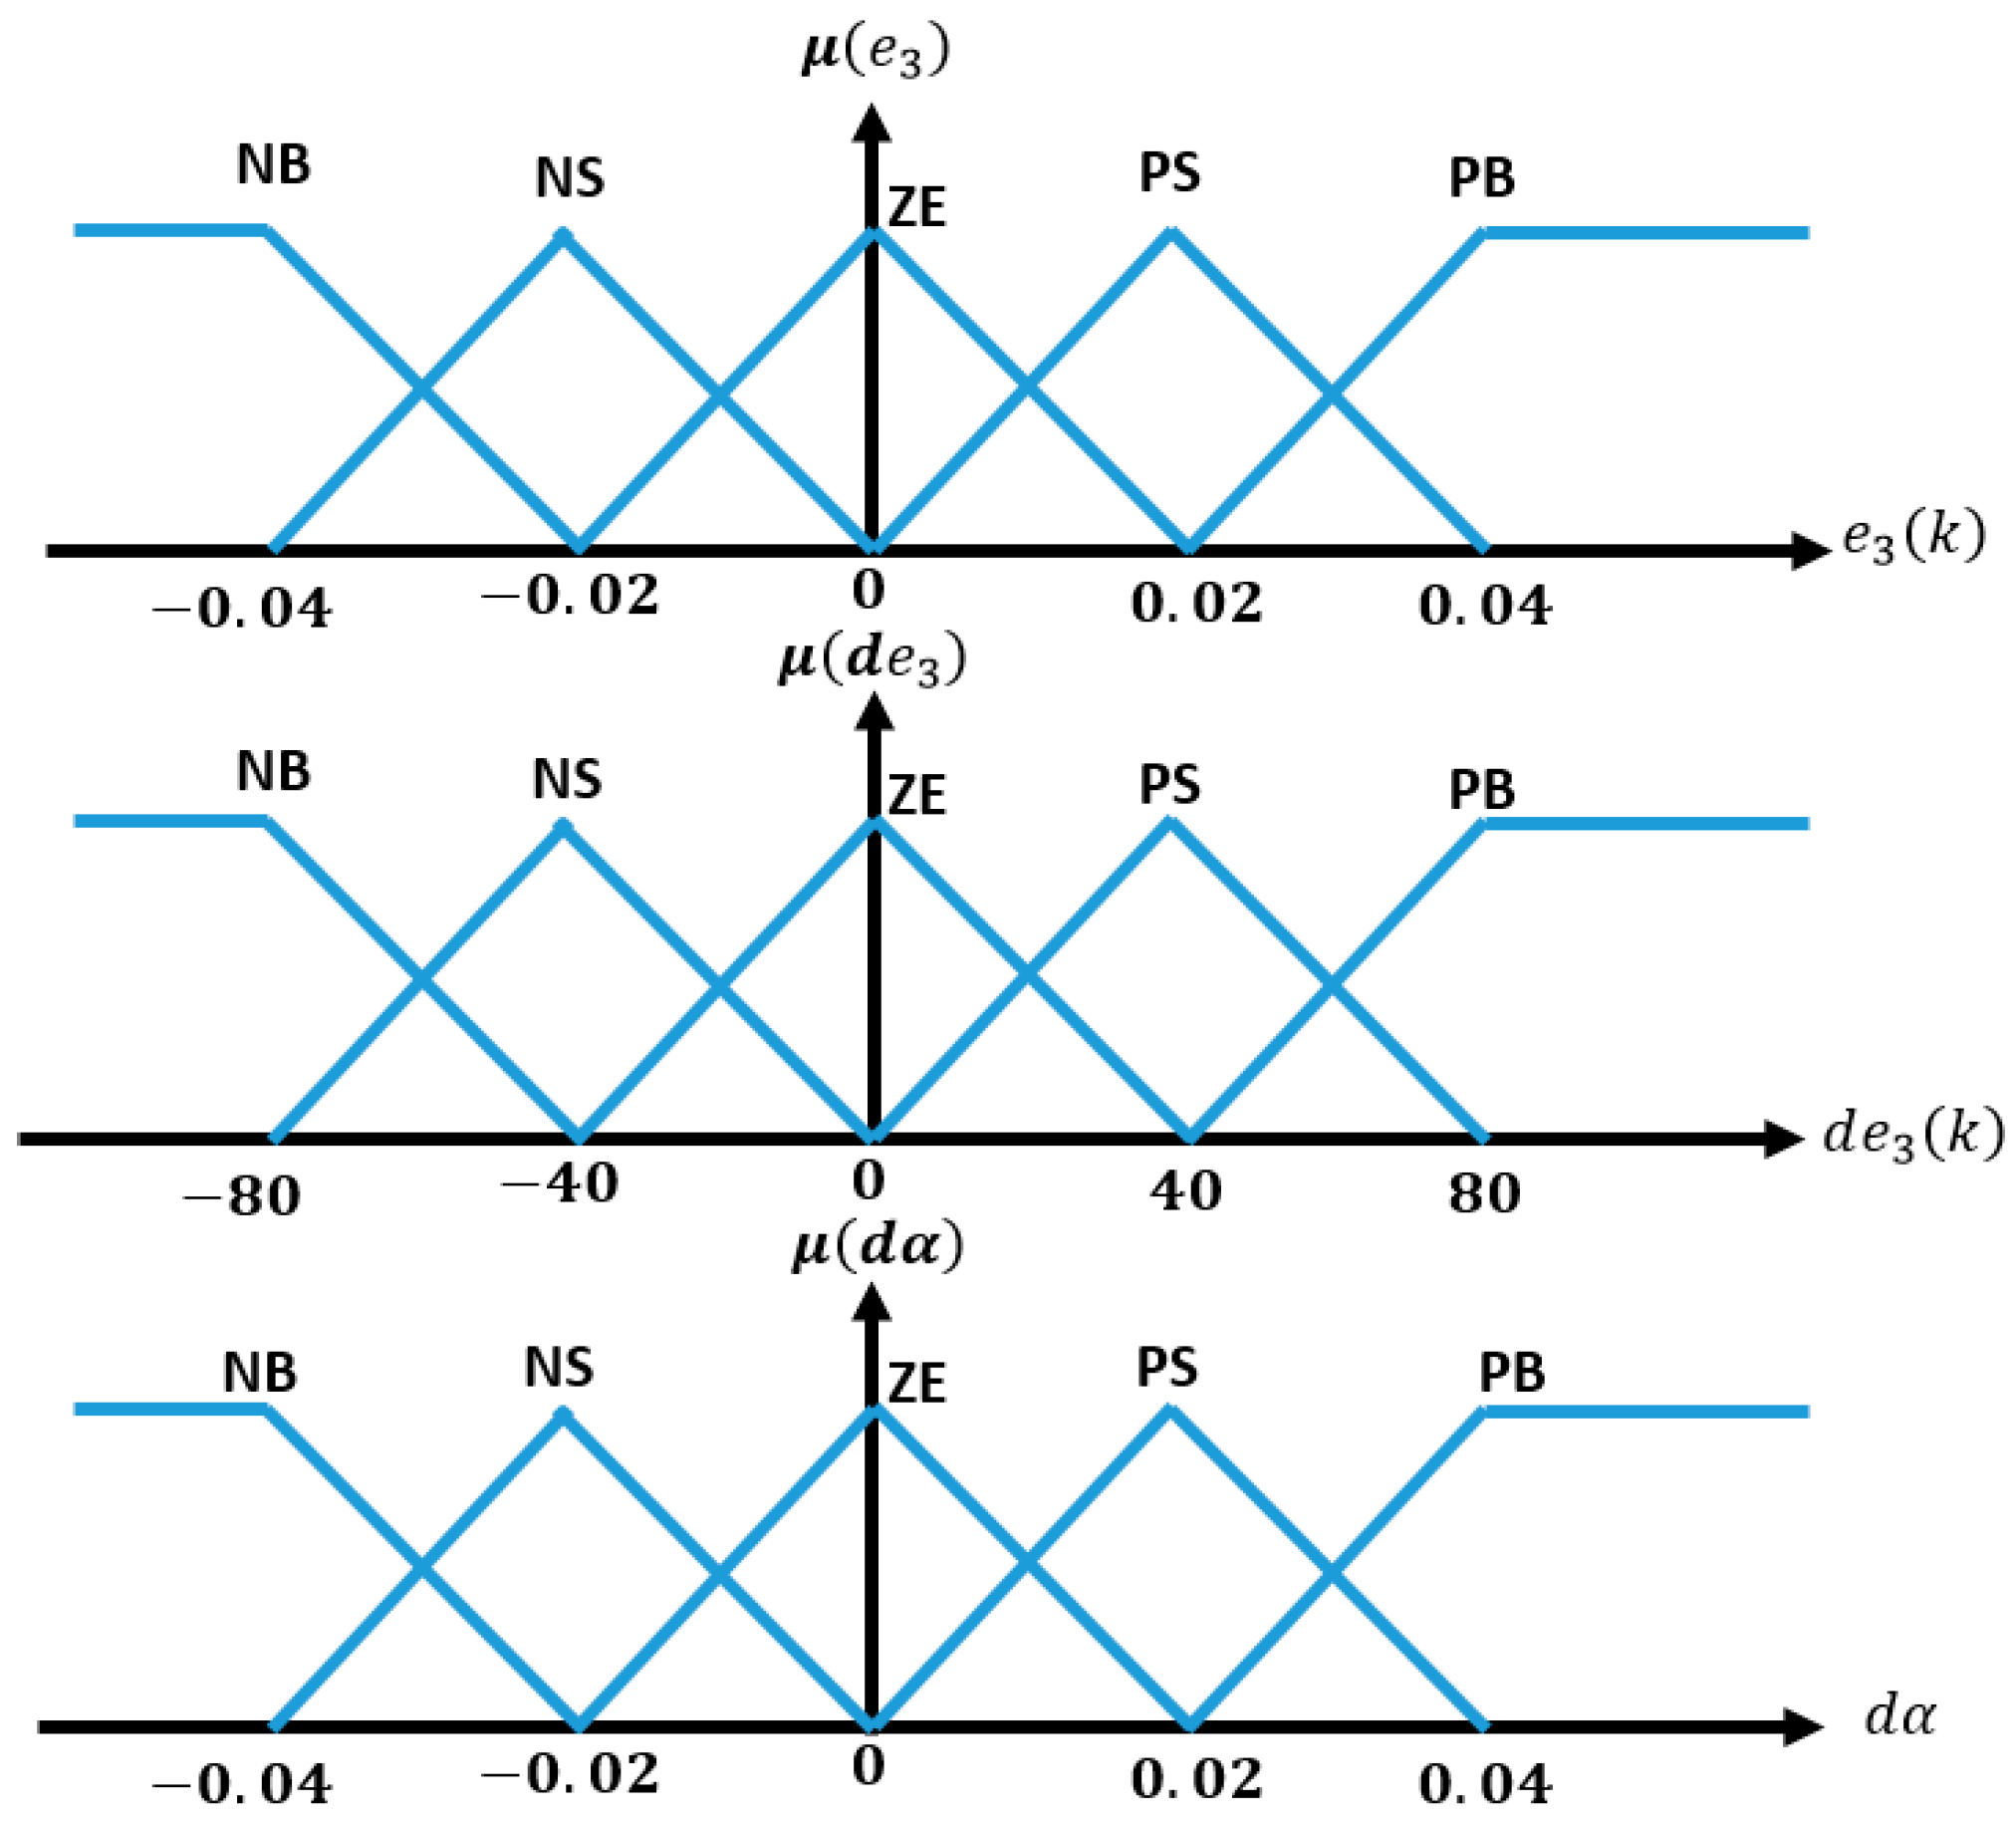
3.4. Fuzzy Logic Controller for PV Optimization

In our hybrid PV-grid system, a fuzzy logic controller (FLC) is employed to optimize the power extraction from the PV panels. The FLC dynamically adjusts the operating point of the PV panels to ensure MPPT under various environmental conditions. The FLC uses inputs, such as solar irradiance and temperature, to determine the optimal voltage and current settings for the PV array. By continuously adapting to changing conditions, the FLC maximizes the power output from the PV panels, thereby enhancing the overall efficiency of the hybrid system. The MPPT FLC principle is the foundation of QBC control. The FLC inputs are the error and its derivative, and the output is the derivative of the duty cycle dα. The goal of the control is to converge the error to zero for the maximum-power operation of the PV generator. The expression of the error is given by the following relation
e 3 k = P p v k P p v k 1 V p v k V p v k 1
The derivative of the error is therefore
d e 3 = e 3 k e 3 k 1
Fuzzification, inference, and defuzzification steps are used to calculate the fuzzy output. Figure 6 shows the elements constituting the fuzzy logic controller.
Fuzzification
Based on information regarding the evolution of the input and output variables, several intervals are defined and associated with linguistic variables. Functions are chosen to determine the degree of membership (fuzzification) of the variables at any interval. Figure 7 illustrates the membership functions of variables e1, de1, and .
Inference engine
Using the “if … Then” condition, a rule base linking the inputs to the output is set up for the production of a suitable fuzzy logic controller output. Typically, a rule base is built based on expertise. The FLC rule bases are listed in Table 2.
Defuzzification
The transformation of linguistic variables into useful numerical values using a control unit is a defuzzification step. This operation is based on the centroid of the area to determine the output variable according to the following expression:
d α = i = 1 25 w i C j i = 1 25 w i
where w i represents the minimum number of the membership function of the ith rule, and C j represents the middle value of the membership functions produced by the FLC. The MPPT Fuzzy control principle of the QBC is summarized in Figure 8.

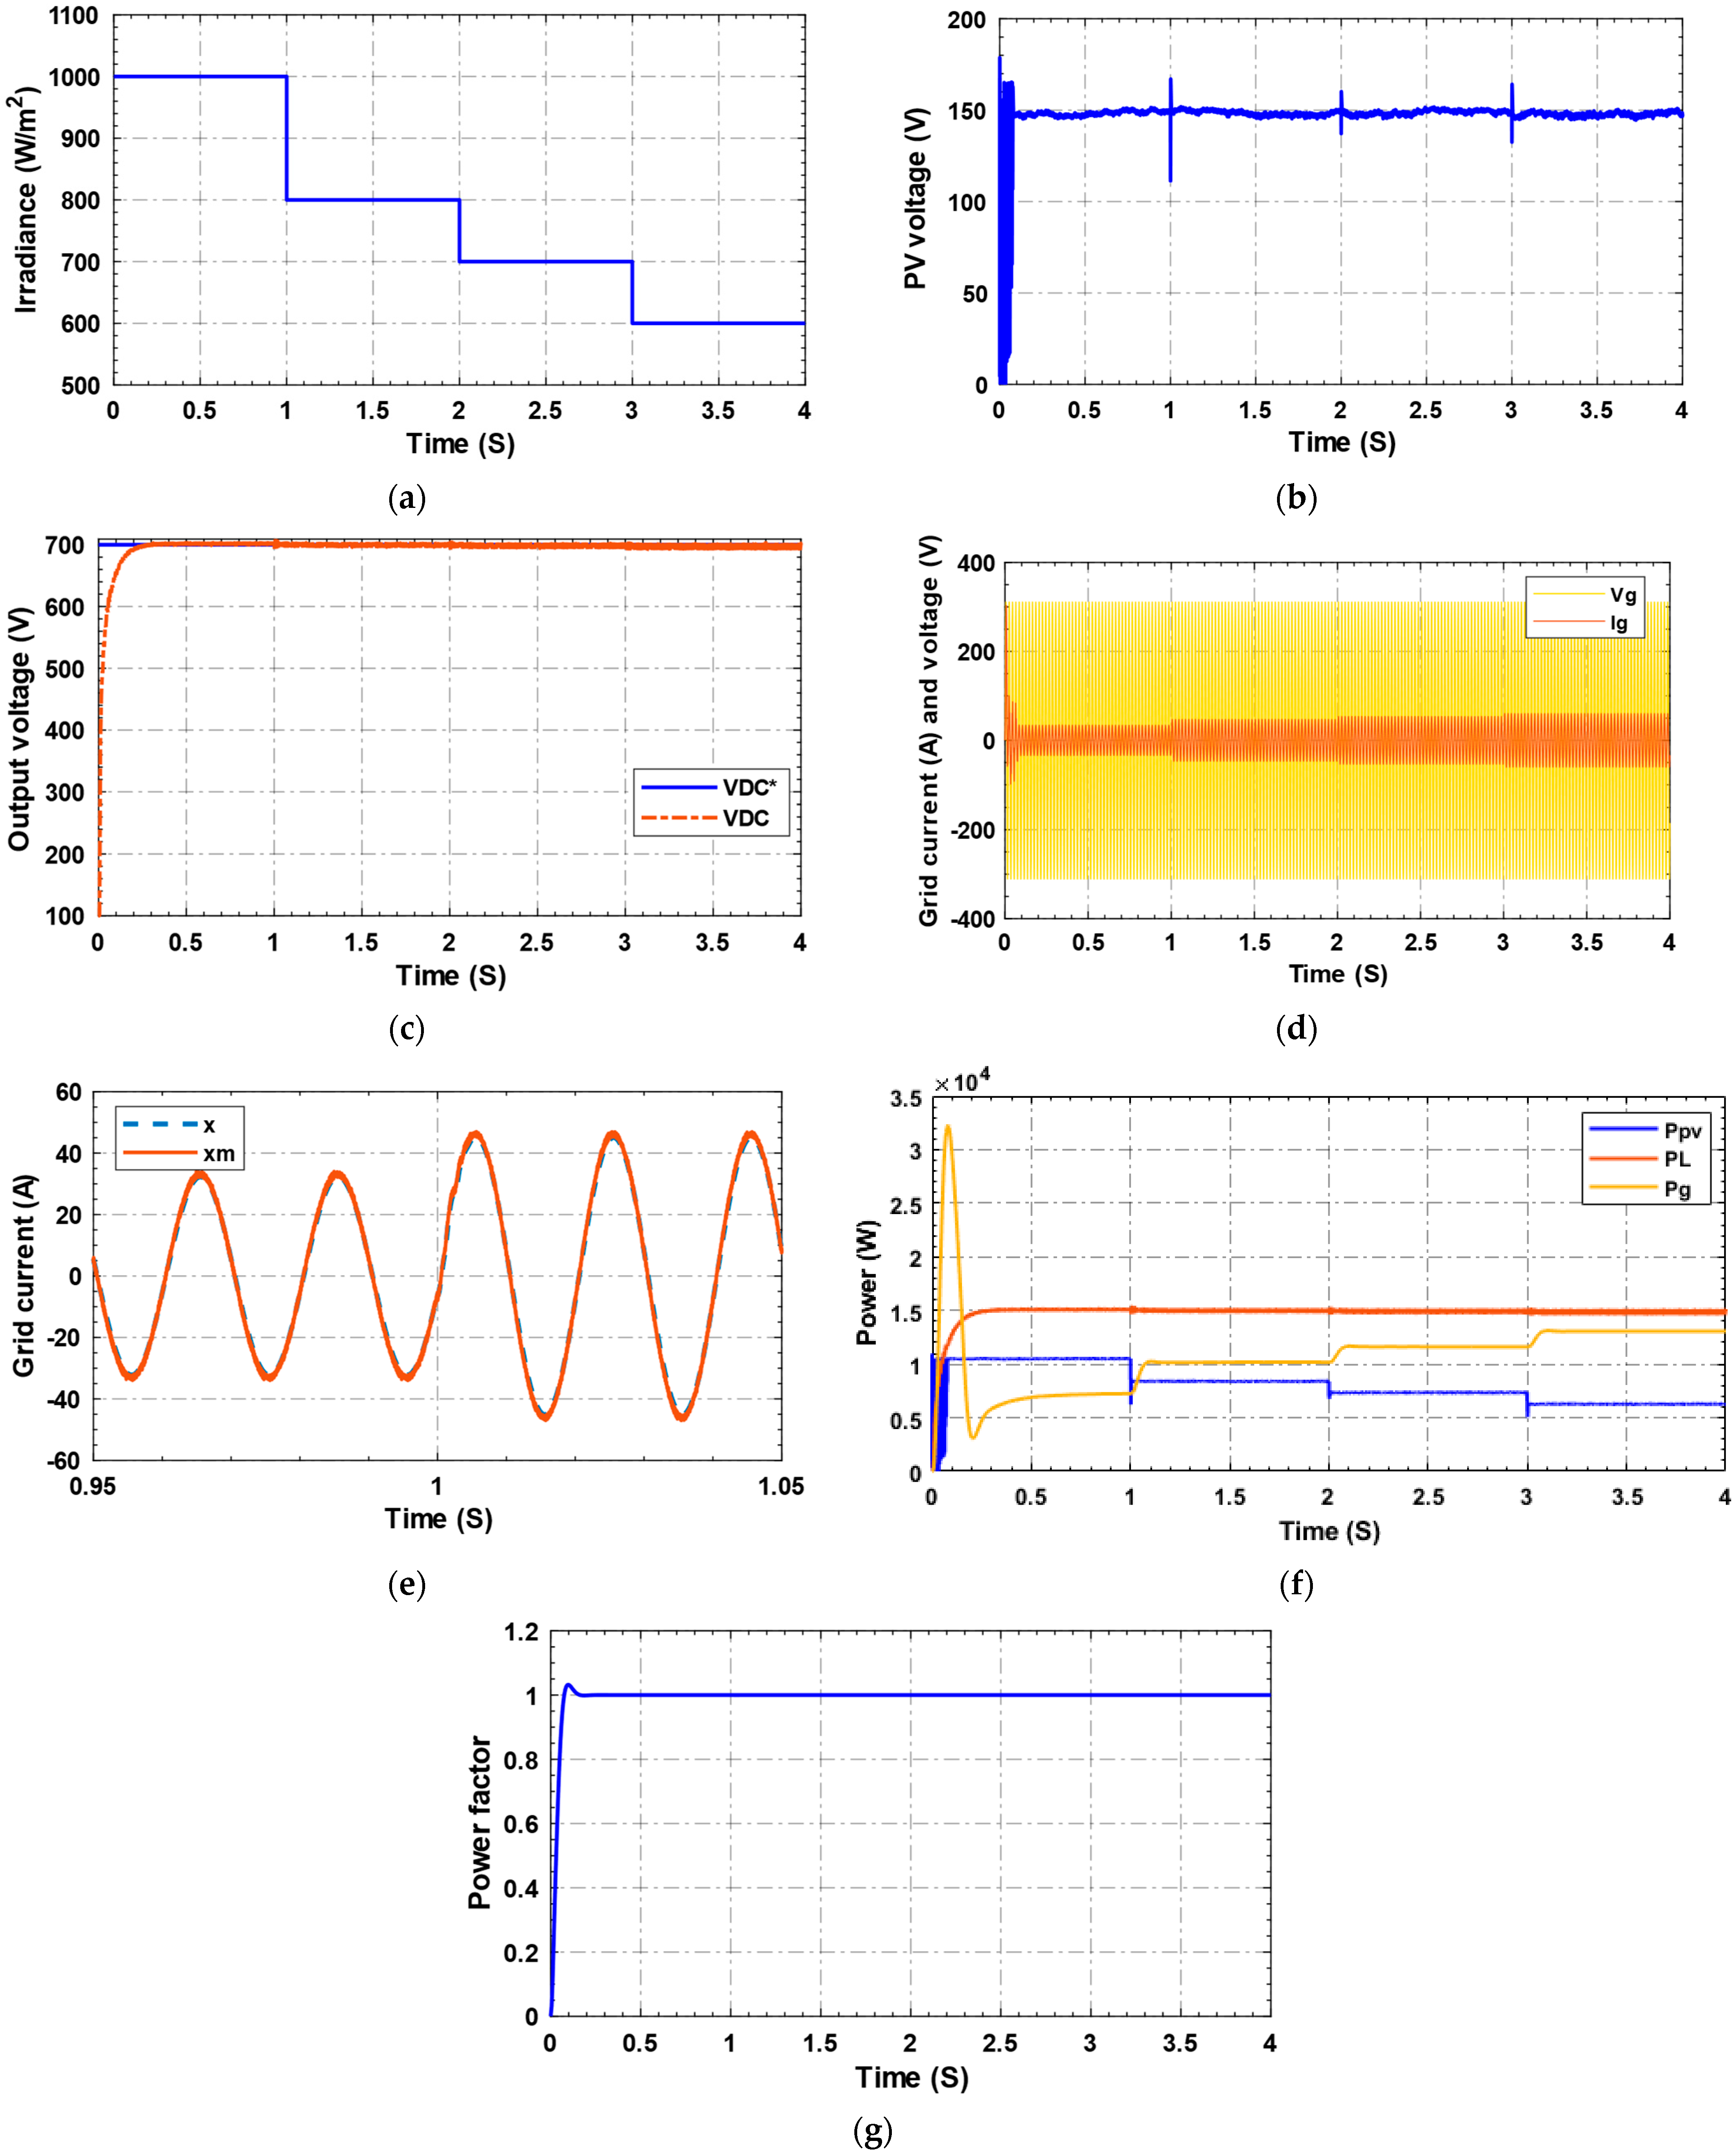
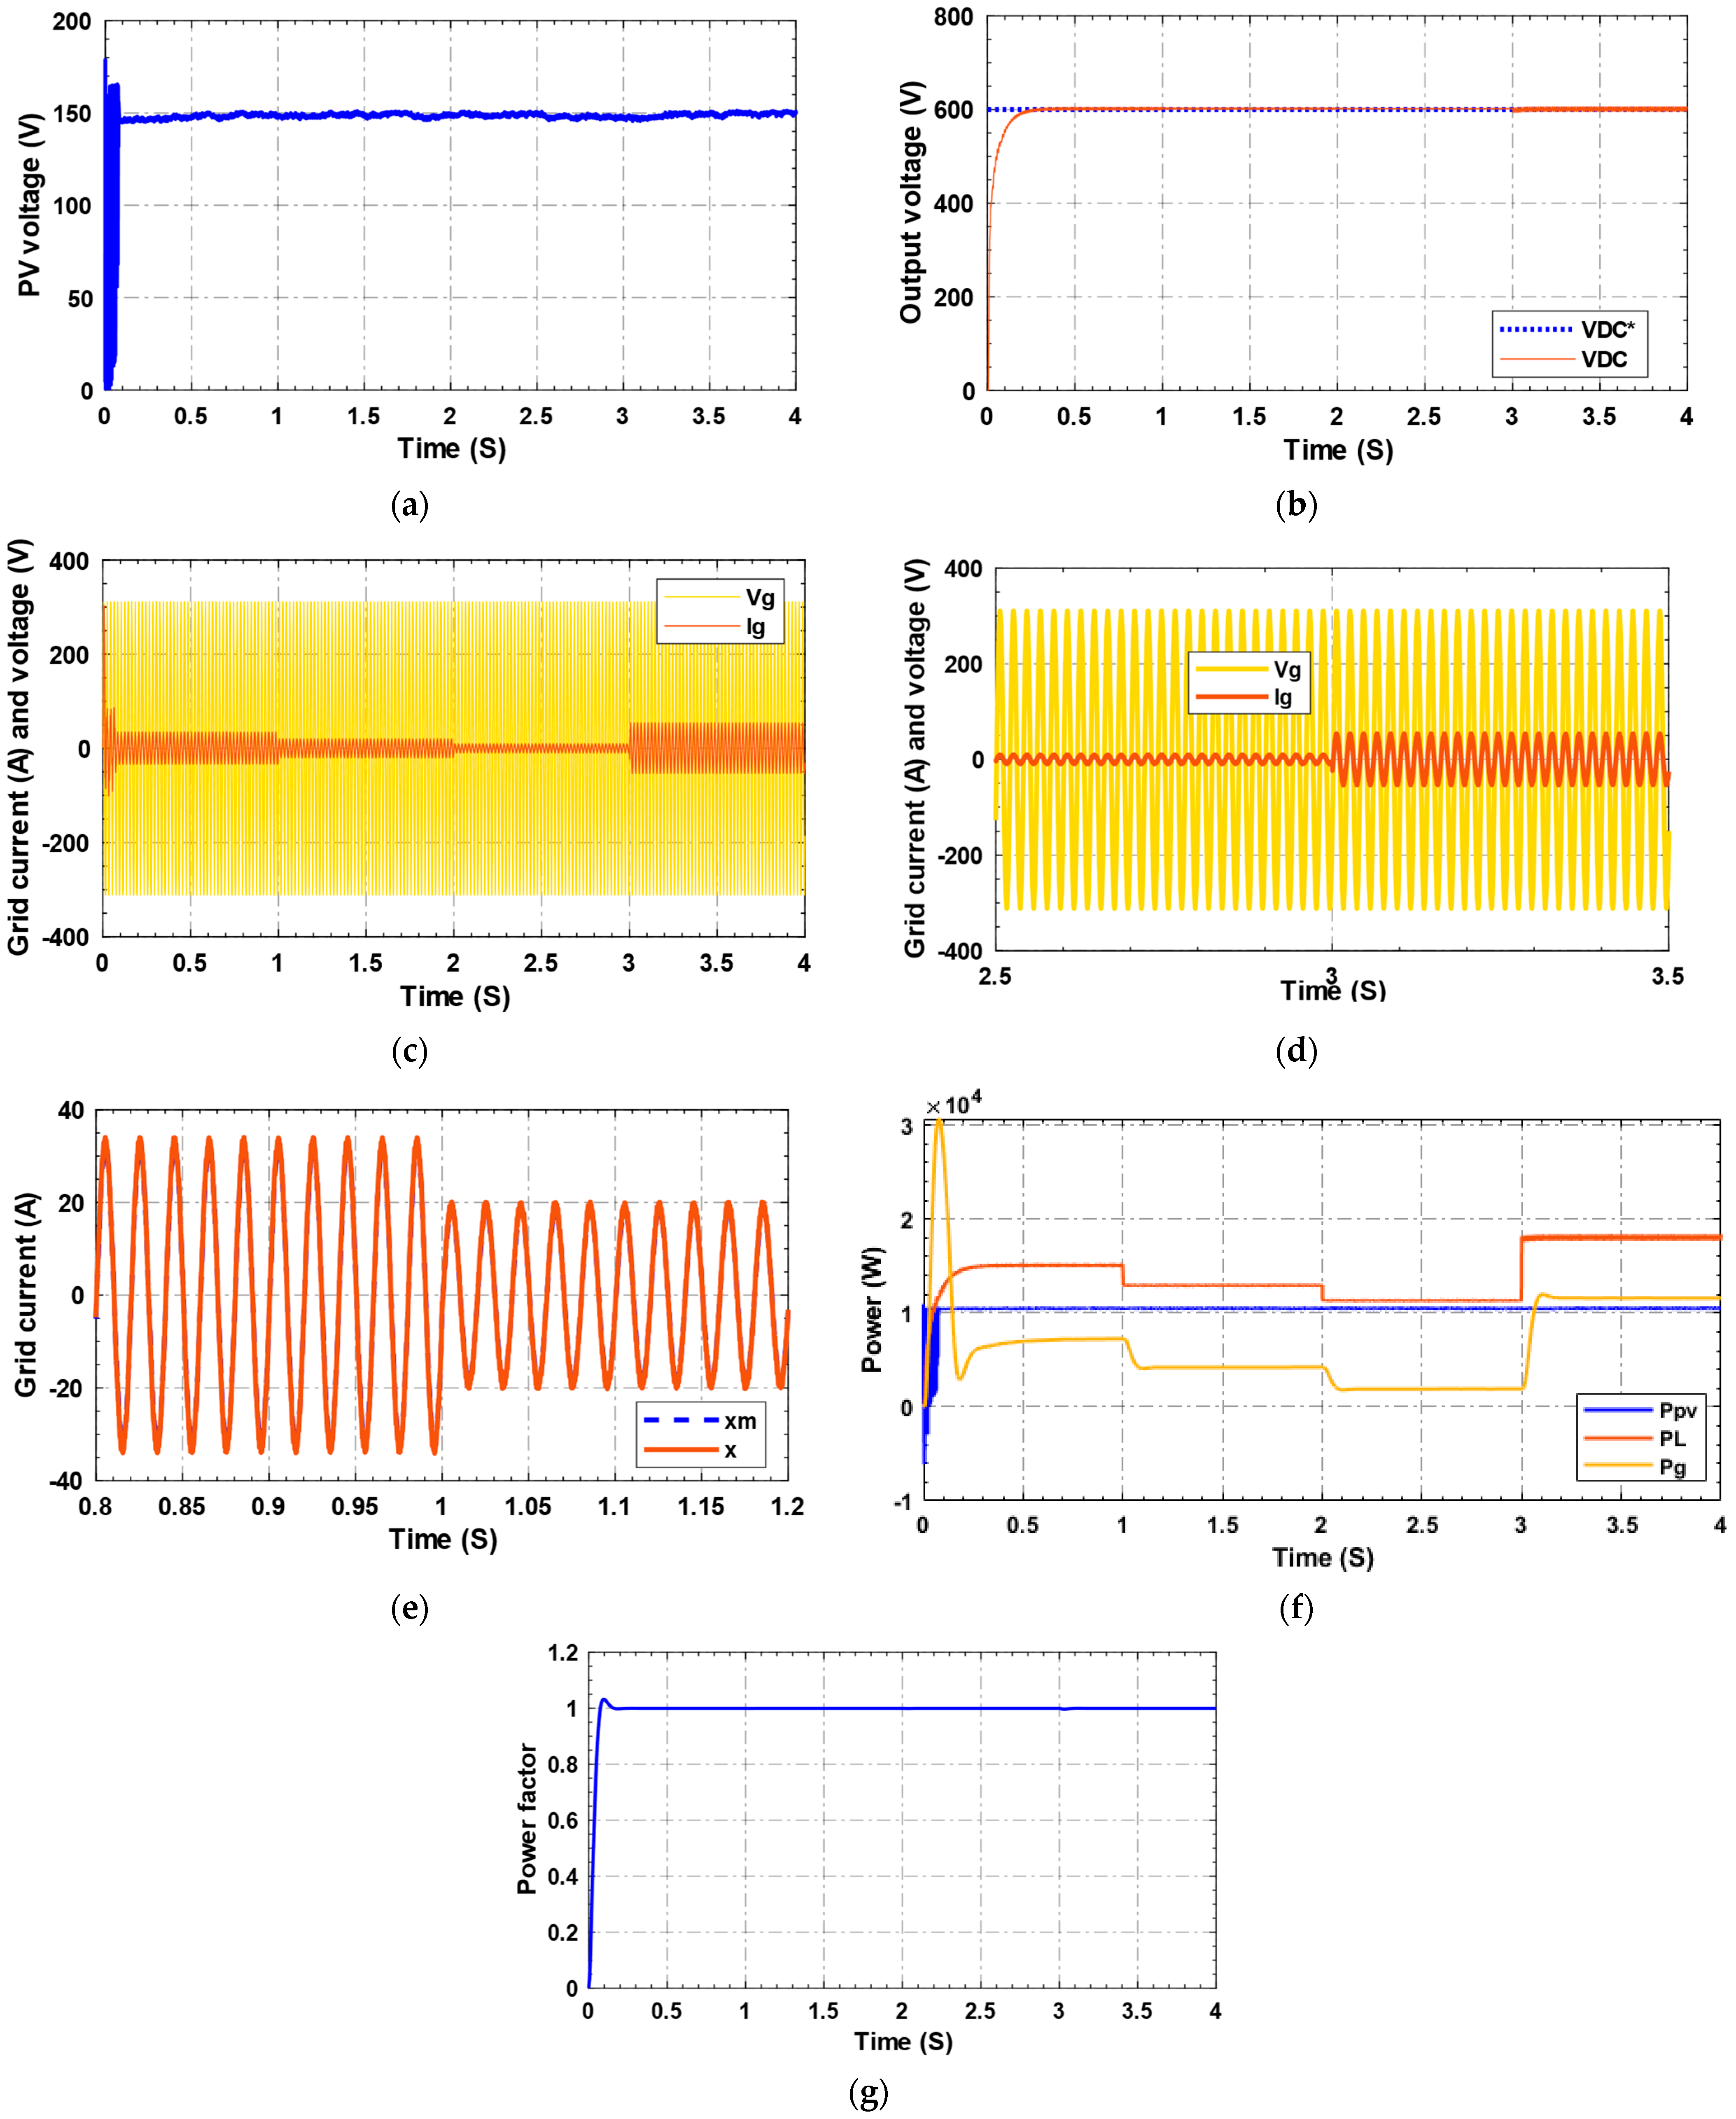
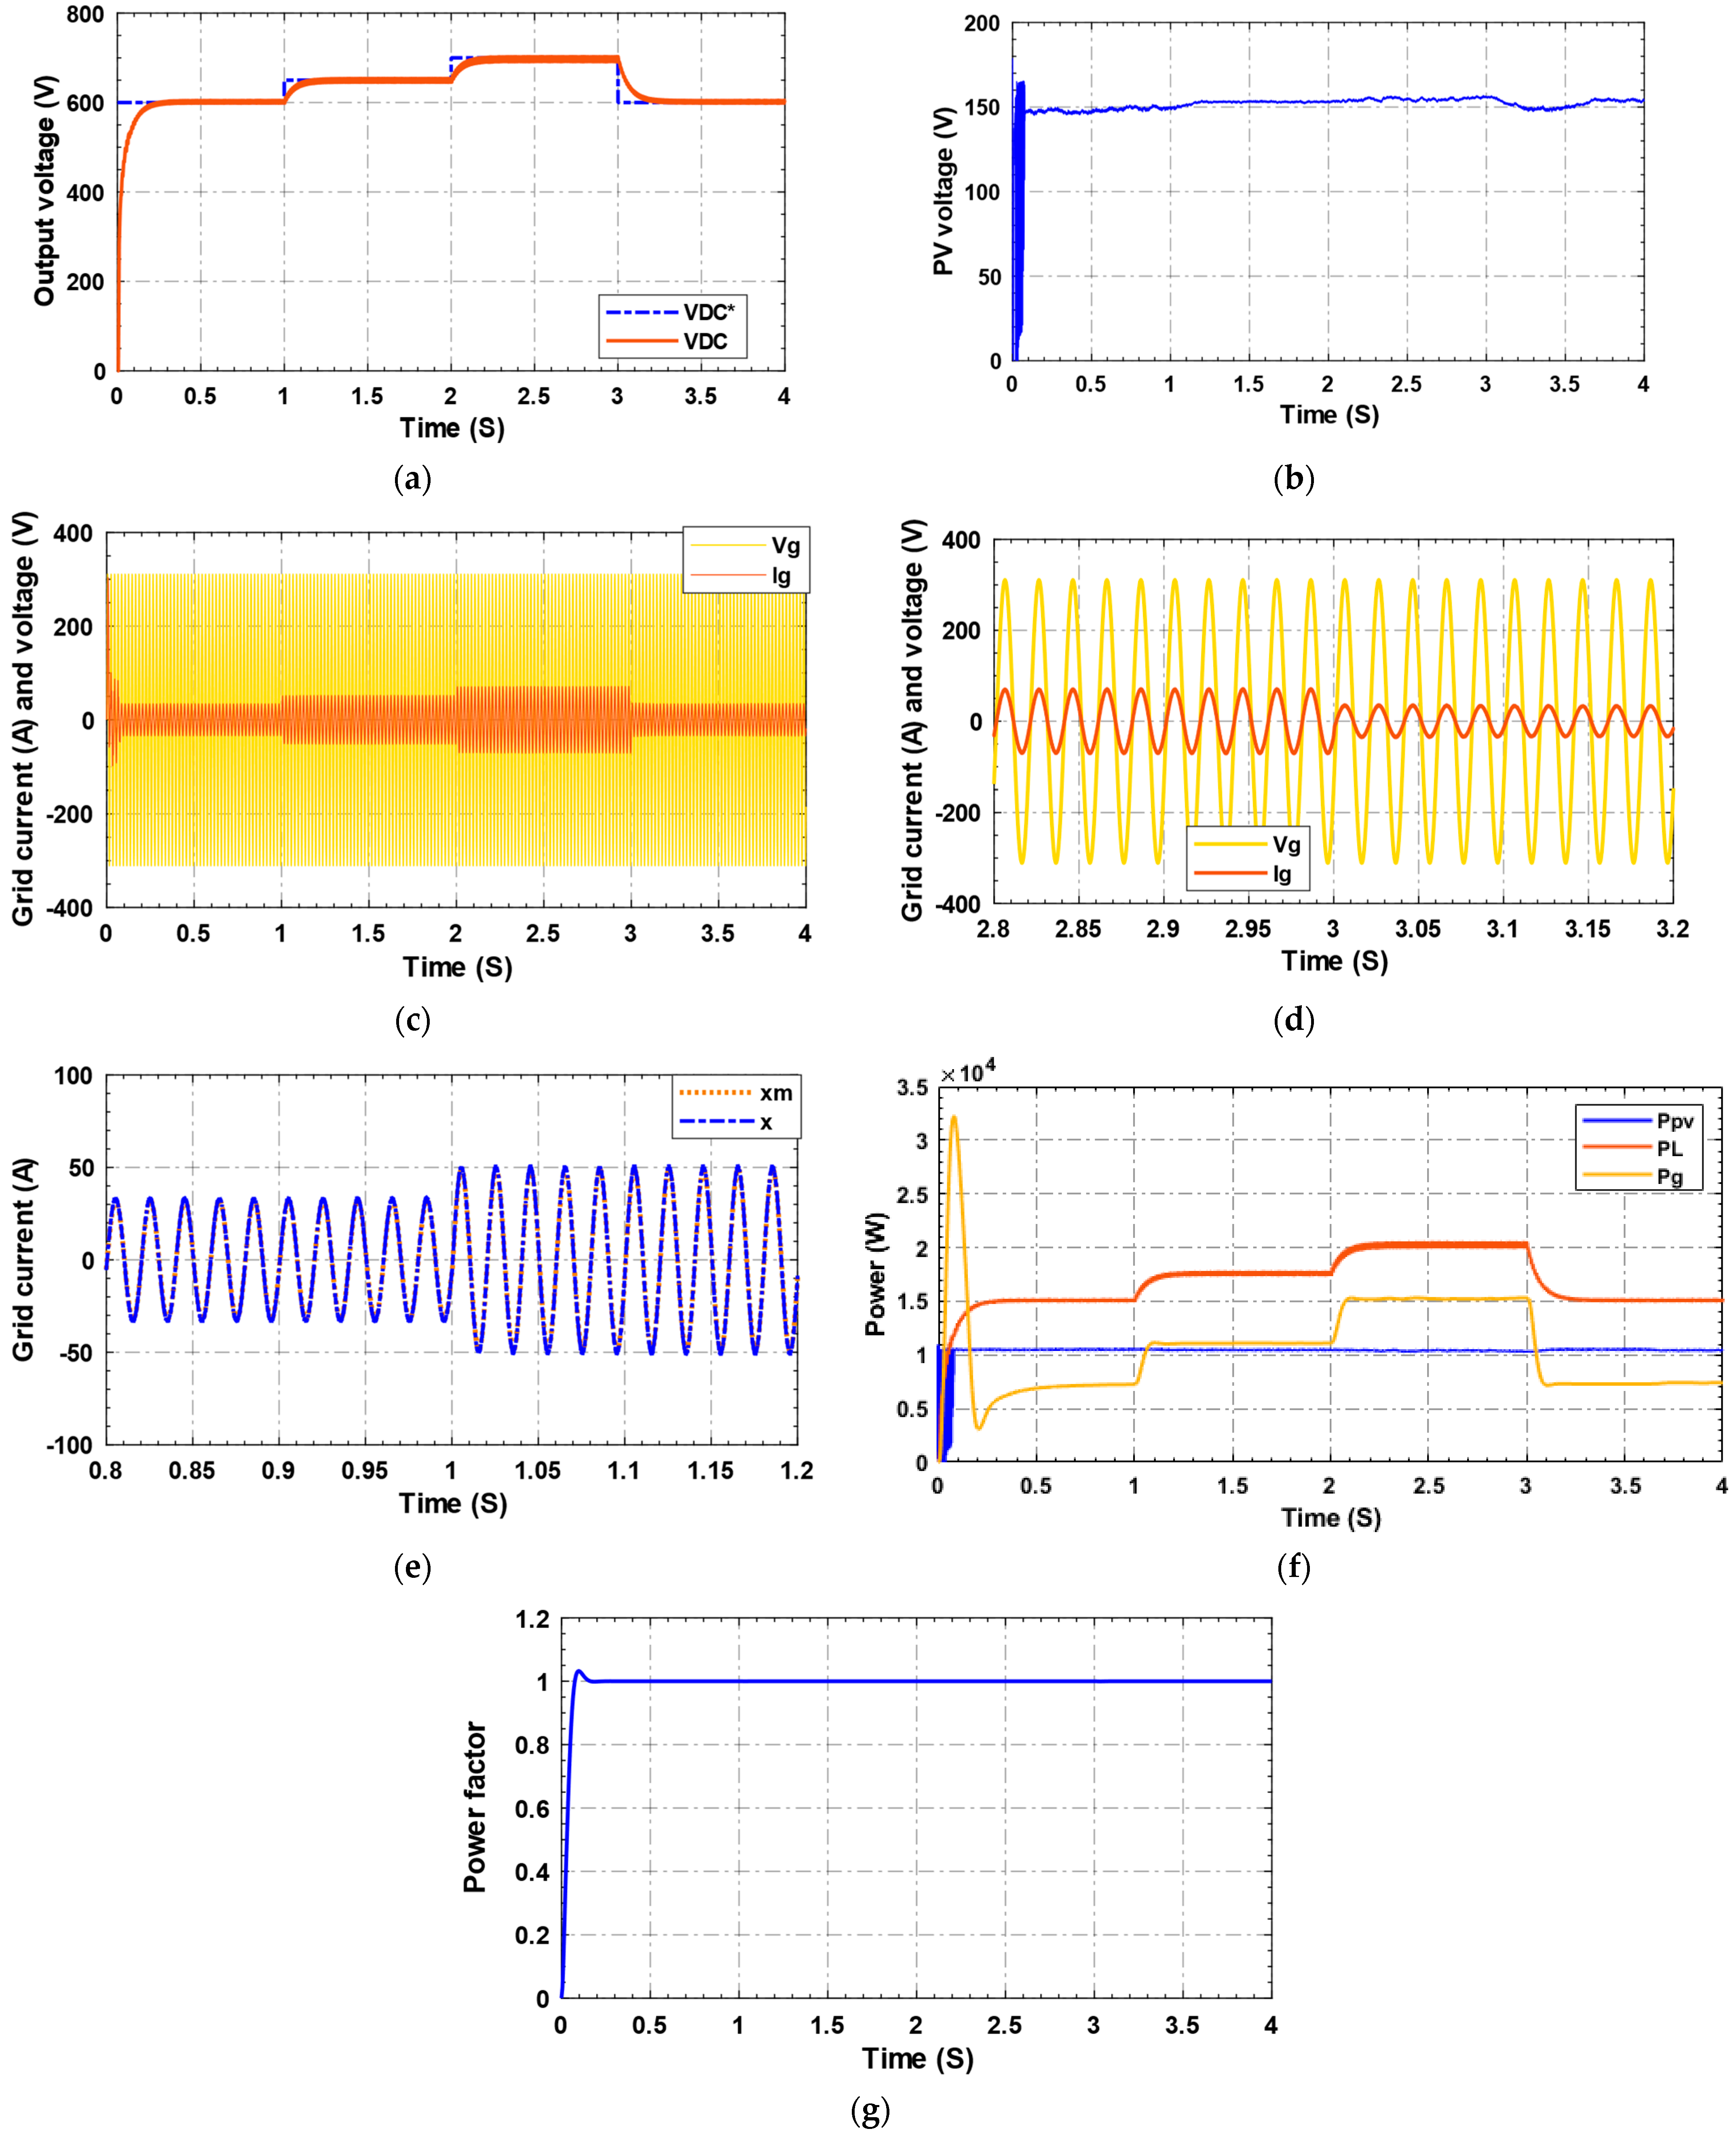
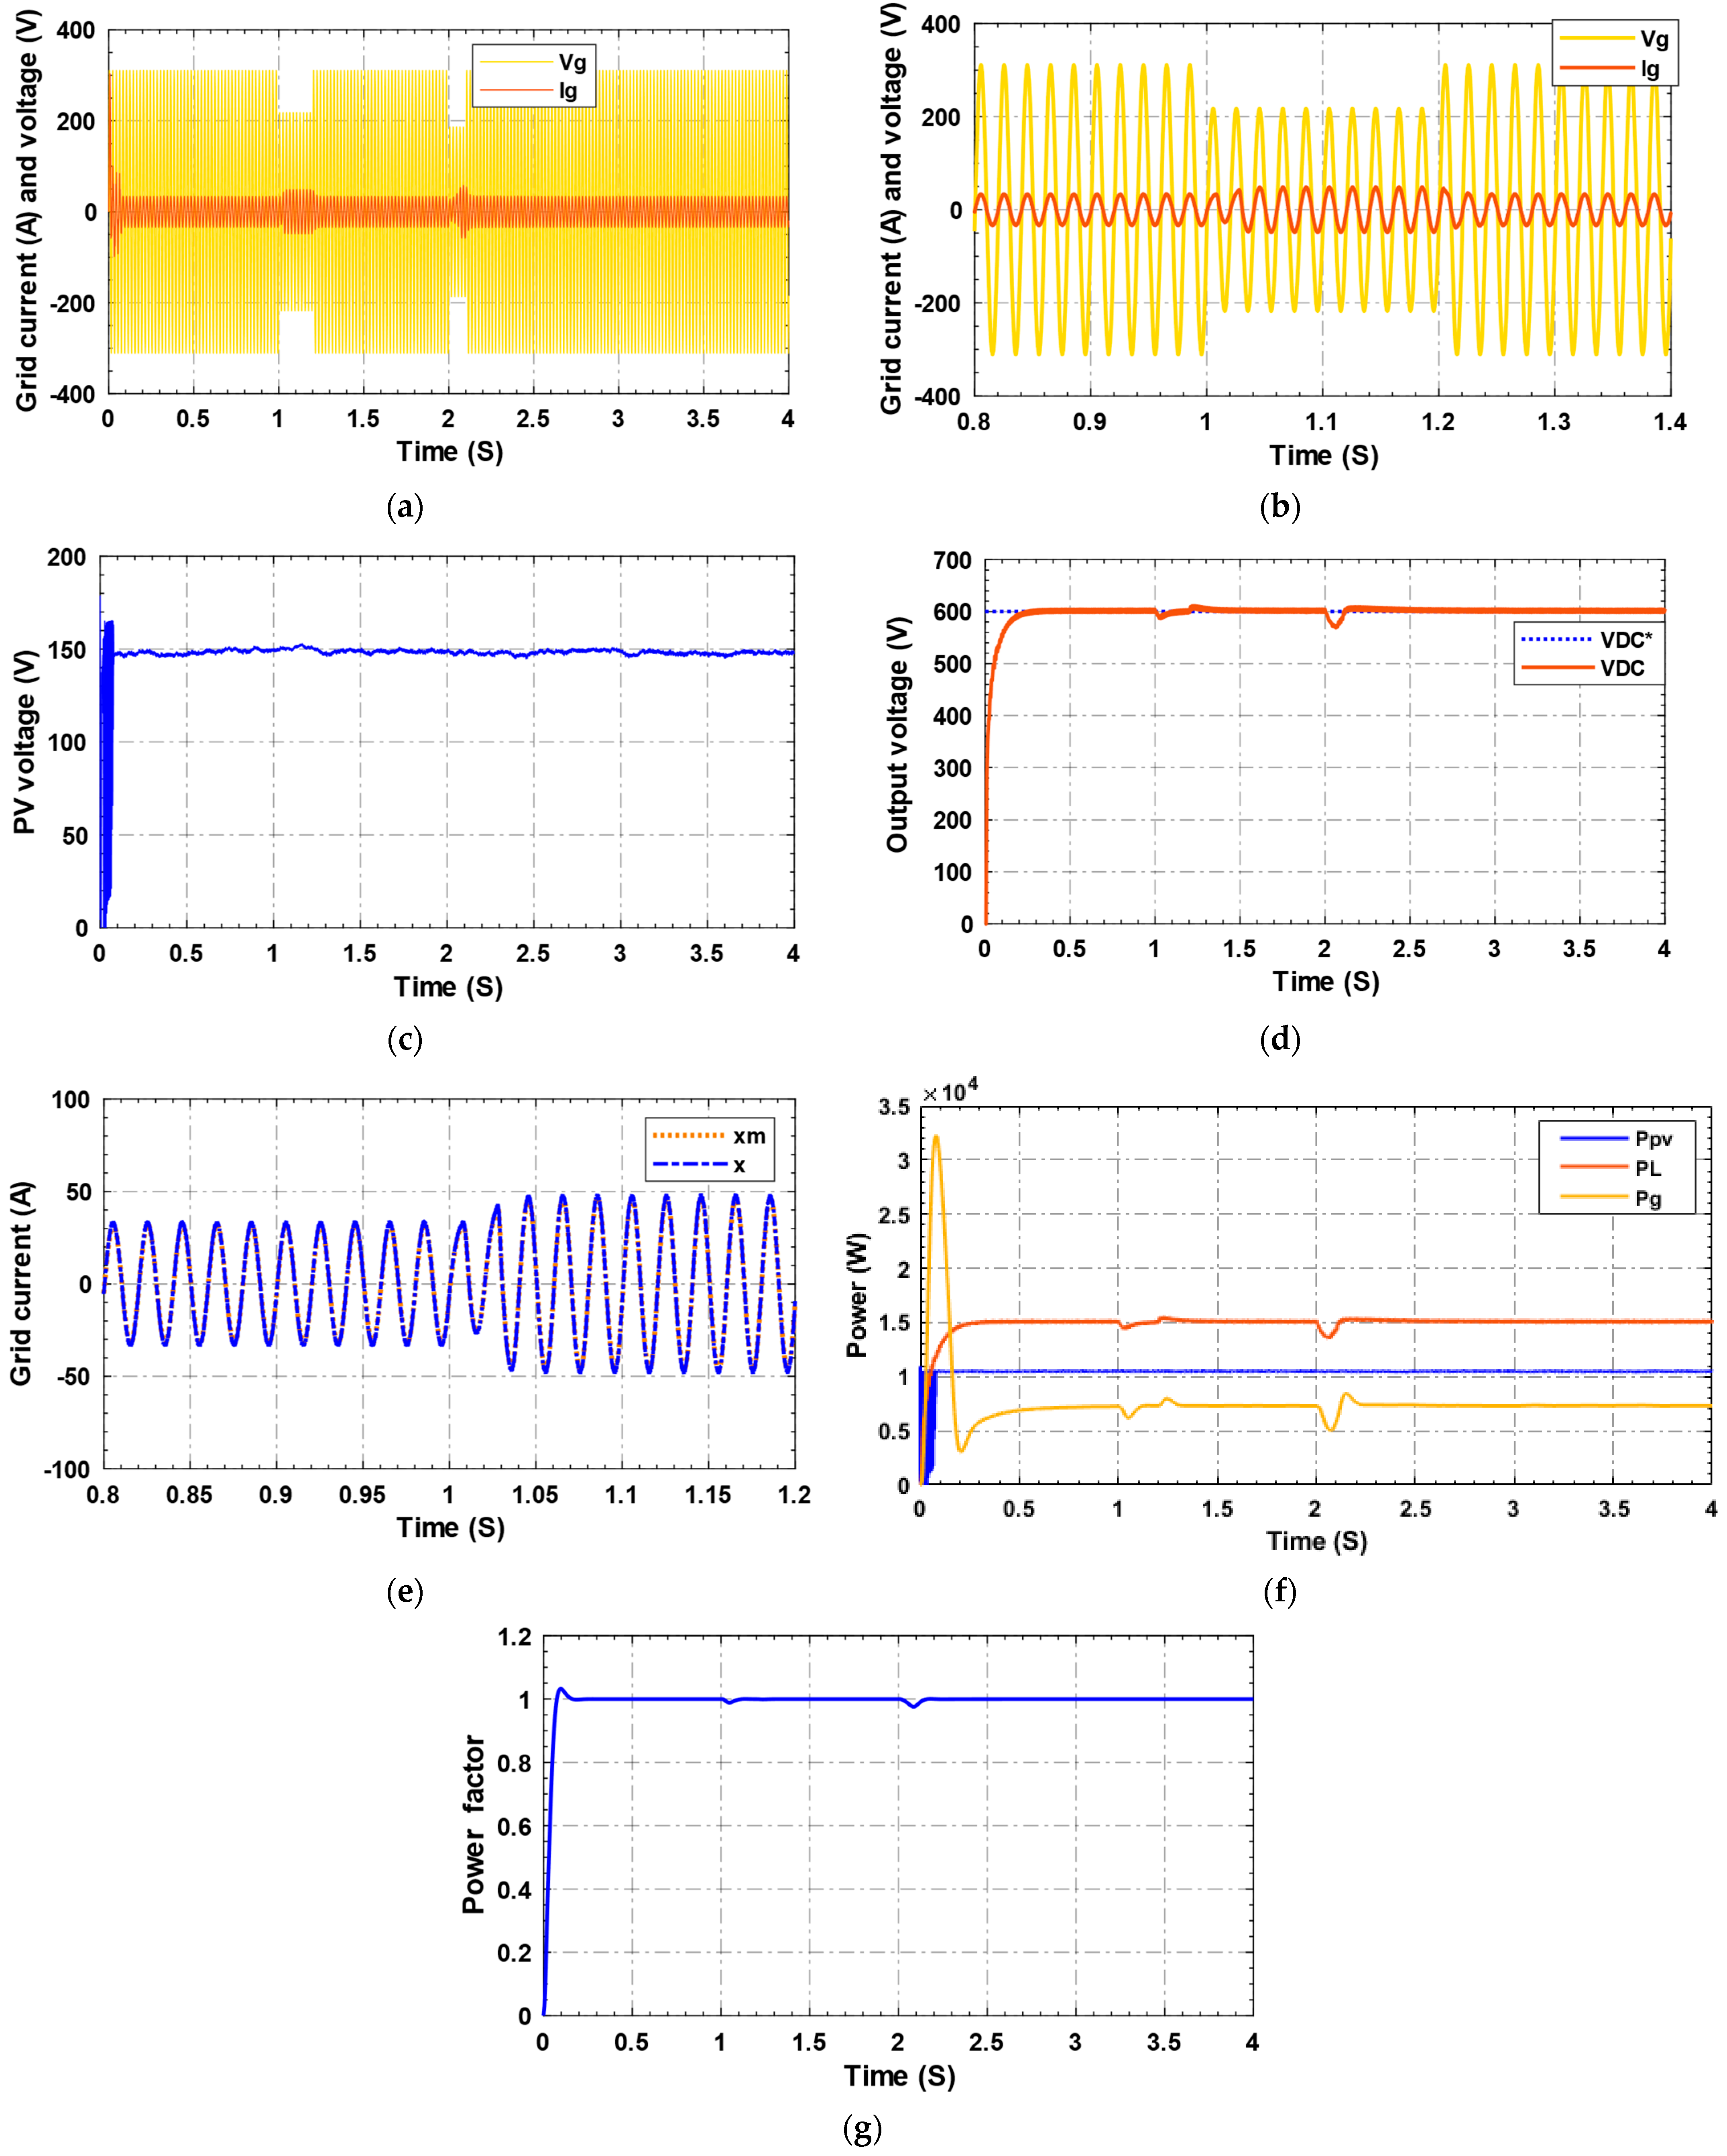
4. Simulation Results and Performance Evaluation

The simulation of a hybrid PV grid distillation system operating according to the strategy control presented in Figure 2 is implemented using the MATLAB/Simulink tools. The reference model used in the adaptive grid current control had the following parameters: a m 1 = 10 2 ,   b m 1 = 10 2 ,   a m 2 = 10 4 , and b m 2 = 10 4 . The electrical characteristics of the resistor load are 24 Ω/15 kW. A phase-locked loop (PLL) is used to determine the RMS of the grid voltage and the angle θ = ω . t . The simulation parameters are listed in Table 3.
The waveforms presented in Figure 9, Figure 10, Figure 11, Figure 12 and Figure 13 show the performance of the hybrid PV-grid system operating under the proposed control. The system performance evaluation is performed for changes in several factors, such as solar irradiation, resistor load, output voltage, and grid voltage.
Simulation result: change in the irradiation
The first test is conducted under the following conditions: V g = 311   V ,   V D C = 600   V and R = 24   . The irradiation profile used in this test is shown in Figure 9a is applied to the system. Figure 9b shows that the PV voltage is well regulated at its proper value of approximately 150 V which shows, according to the power curve (Figure 3), that the PV source is working at its maximum power. Figure 9c illustrates the output voltage is well regulated at its set value of 600 V in the presence of small deviations around this value. Figure 9d shows the grid voltage and current. It can be observed that the grid current increases each time the irradiation decreases, which is logical for a balance between production and satisfying the load power demand. Figure 9e shows the grid current and output reference model x m . It should be noted that the error between these currents is negligible, and that the grid current follows the reference. However, at the moment of the change in irradiation ( t = 1   s ) from 1000   W / m 2 to 800   W / m 2 , it is noted that during less than a quarter of the g grid current period, a small deformation is recorded, and the grid current then resumes its sinusoidal shape. This can be explained by the change in irradiation, which affects the reference current. Figure 9. where f represents the power involved in the system. It can be seen that each time the PV power decreases, the grid produces more power to satisfy the energy needs of the load. In addition, the difference between the production and consumption of power was recorded for all irradiation levels, which is explained by the switching losses in the power switches, as well as the Joule losses. Figure 9g shows that the power factor remained close to unity during the simulation. This clearly demonstrates that the grid current and voltage are in phase and that the power factor is close to unity.
Simulation result: load change
The tests are performed under the following conditions: V g = 311   V ,   V D C = 600   V and G = 1000   W / m 2 . In the second simulation test, the hybrid system is subjected to a load profile ( 24     ( t = 0   to   1   s ) ,   28     ( t = 1   s 2   s ) ,   32     ( t = 2   s 3   s ) ,   R = 20     ( t = 3   s to 4   s ) ). In Figure 10a, the PV voltage follows its reference near 150 V for an irradiation of 1000   W / m 2 . Figure 10b shows that the output voltage is regulated to 600   V . It is observed that the output voltage finds its reference after 0.2   s and remains there until the end of the simulation. Figure 10c shows the grid voltage and current. It can be observed that the grid current decreases with an increase in the load, which is explained by the decrease in the power demand of the load while the PV power remains constant. Figure 10d shows the grid current in phase with the grid voltage. In the time interval of 2   s < t < 3   s , the load is R = 32   and the grid current decreases, which shows that a large part of the energy requirement is supplied by the PV source. Figure 10e shows the grid current regulated to its reference value given by the reference model, according to the proposed adaptive control. At t = 1   s , which is an instant of load change from 24   to 28   , despite this change, the grid current remains at its reference value and maintains its sinusoidal shape. Figure 10f represents the power involved in the hybrid system under different load values. The need power of the load varies between 11.5   k W for R = 32 and 18   k W when R = 20 . Figure 10g shows the power factor; it is noted that this factor remains stable and unaffected by changes in the load.
Simulation result: change in the load voltage
The tests are performed under the following conditions: V g = 311   V ,   R = 24   , and G = 1000   W / m 2 . Figure 11a depicts the load voltage and its reference; the voltage reference is 600 V between 0 and 1 s, 650 V between 1 and 2 s, 700 V between 2 and 3 s and 600 V between 3 and 4 s. During the simulation, the voltage was in accordance with the reference value. The time required in a transient regime to adjust the voltage to its reference is 0.25 s. Similar to the previous simulations, as shown in Figure 11b shows the regulated PV voltage at its optimal value of approximately 150 V, It corresponds to the PV source at maximum power. Figure 11c shows the grid voltage and current. It should be noted that as the output voltage increases, the grid current increases, which is justified by the increase in the power delivered to the load. Figure 11d shows a magnified view of the current and grid voltages. It is found that the current is in phase with the voltage, which shows a power factor close to unity. Figure 11e illustrates the grid current regulated at its set point. Figure 11f shows the power at work for the hybrid system. It should be mentioned that because the irradiation is constant, so is the PV power. An increase in the load voltage translates into an increase in the power delivered by the grid in the measure of the satisfaction of the energy requirements of the load, as pointed out in previous studies.
Simulation result: change in the grid voltage
The tests are performed under the following conditions: V D C = 600   V ,   R = 24   , and G = 1000   W / m 2 . The hybrid system is subjected to a grid voltage profile. The grid voltage is characterized by sudden drops; the first drop is 30% at time t = 1 s to t = 1.2 s and the second is 40% from time t = 2 s to 2.1 s. In the absence of drops, the voltage and current are stable and in-phase (Figure 12a,b). When a voltage drop occurs, the grid current increases to compensate for the effect of the voltage drop. A deformation of the grid current is recorded during the instant of the voltage drop and at the instant of its return to its normal value. This deformation appeared during two periods of the grid current, after which the current took a sinusoidal form. The current deformation is explained by the change in reference, and the delay is justified by the presence of time constants that decelerate any sudden change in reference. The PV source operates at the maximum power, as shown in Figure 12c, which indicates that the PV voltage is well regulated at its reference near 150 V. Figure 12d shows the output voltage regulated at a reference of 600 V. It is noted that the influence of the grid voltage drop is more important on the output voltage when this drop is equal to 40%, although the duration is 0.1 s. We can see that when the voltage drop is 30% for 0.2 s, the voltage deviation does not exceed 10 V (1.6%) whereas this deviation reaches 25 V (4.16%) for a voltage drop of 40% for 0.1 s only, which shows the importance of the drop duration on the output voltage and also on the grid current. Similar to previous tests, the grid current followed its reference in the presence of a small deformation at the instant of the grid voltage sag. For example, at t = 1 s, this deformation lasted for less than one grid current period (Figure 12e). The power involved in the hybrid system is shown in Figure 12f. Note that the power supplied by the network remains constant despite some deviation at the instant of the voltage drops. This is explained by the stability of the load power, and the electricity produced by the photovoltaic generator confirmed this finding. In addition, as in the previous tests, the power factor is stable during the simulation time, except for small deviations at the instants of voltage sags, particularly when the drop is 40% of the grid voltage, which is considered a limit that must not be exceeded to maintain the correct operation of the hybrid system.
A comparison of THD for 2-level and 3-level control signal modulation is presented in Figure 13, assuming 600   W / m 2 of irradiance and 59   A of grid current amplitude. It is evident that 3-level modulation results in a significantly higher system current quality. In summary, 2-level modulation does not ensure compliance with this constraint since the THD is at or well above this limit in other circumstances. In contrast, 3-level modulation ensures that the norm requiring a distortion rate of less than 5% is mainly respected for the changes shown in Figure 9, Figure 10, Figure 11 and Figure 12.

5. Conclusions

In this paper, a PV grid system tailored for power supply in distillation applications is proposed. A section dedicated to rectifier modeling utilizing a nonlinear model is introduced. To simplify controller synthesis and address unknown parameters, MRAC is adopted and fuzzy logic control is employed for the QBC Converter. The rectifier control aims to synchronize the grid current with the voltage while maintaining the grid current distortion below the standard threshold (THD < 5%). This objective is realized through a 3-level PWM modulation technique. Furthermore, a fuzzy controller was employed to optimize the energy by maximizing the PV source power. Simulation results validate the proposed control strategy, meeting this study’s initial objectives and affirming the assumptions underlying the linearization of the AC–DC rectifier model. The proposed hybrid conversion structure offers several advantages, including the complementarity of the PV and grid sources and enhanced electrical energy production reliability. Moreover, leveraging PV sources yields a remarkable 70% energy gain, aligning with the commitment to nature-friendly energy sources and environmental preservation. Scaling up the distilled product output can be achieved through a three-phase AC–DC rectifier and increasing the solar panel power to meet the load energy demands.
In conclusion, our study contributes to advancing sustainable energy solutions, particularly for distillation processes. By integrating renewable energy sources and advanced control strategies, we advocate efficient, reliable, and environmentally conscious power systems. We appreciate the insightful feedback from the reviewers, which has enhanced the robustness and clarity of our findings.

Author Contributions

Methodology, H.A. (Hassan Abouobaida), B.A. and H.K.; Resources, H.A. (Hassan Abouobaida) and B.A.; Validation, H.A. (Hassan Abouobaida) and S.U.; Software, H.A. (Hassan Abouobaida), B.A. and S.U.; Formal analysis, H.A. (Hisham Alghamdi), S.U., Y.M. and H.K.; Data curation, Y.A.; Conceptualization, S.U. and H.A. (Hassan Abouobaida); Writing—original draft, H.A. (Hassan Abouobaida) and S.U.; Writing—review & editing, H.A. (Hisham Alghamdi), S.U., Y.M., B.A., H.K. and Y.A. All authors have read and agreed to the published version of the manuscript.

Funding

The authors extend their appreciation to the Deanship of Scientific Research at Northern Border University, Arar, KSA for funding this research work through the project number NBU-FFR-2024-2484-05.

Data Availability Statement

The original contributions presented in the study are included in the article, further inquiries can be directed to the corresponding author.

Conflicts of Interest

The authors declare no conflicts of interest.

Nomenclature

The nomenclature list for all the symbols and descriptions.
SymbolDescription
ACAlternating current
DCDirect current
V D C DC output voltage
V g Grid voltage
L 1 Filtering inductance on the AC side
r Parasitic resistance on the AC side
C 1 Capacitance on the DC side
R Resistive load
S 1 ,   S 2 ,   S 3 ,   S 4 Power switches in the single-phase bridge rectifier
V p AC voltage input to the rectifier
I D C 1 DC output of the rectifier
I g Grid current
PFPower factor
THDTotal harmonic distortion
P_PVPower from the PV source
DControl input variable for the rectifier
P D C Power delivered to the load
V P V Voltage of the PV array
I P V The current of the PV array
FLCFuzzy logic controller
MPPTMaximum power point tracking
QBCQuasi-Z-source boost converter
V P V m a x Maximum power voltage of the PV array
k 1 ,   k 2 ,   k 3 ,   k 4 Controller parameters for the MRAC
a 1 ,   a 2 Coefficients in the rectifier model equations
b 1 ,   b 2 Coefficients in the rectifier model equations
x 1 ,   x 2 State variables in the MRAC model
x m 1 ,   x m 2 State variables in the reference model
k ^ 1 ,   k ^ 2 ,   k ^ 3 ,   k ^ 4 Estimates of the controller parameters
k ~ 1 ,   k ~ 2 ,   k ~ 3 ,   k ~ 4   Parameter estimation errors
V Lyapunov function for MRAC
r 1 ,   r 2 Reference model inputs
P P V Power from the PV source
P D C Reference power delivered to the load
ω Grid current pulsation
f g Grid frequency
f ( P W M ) Pulse width modulation frequency
e 3 Error for the FLC MPPT
d e 3 Derivative of the error for the FLC MPPT
d α Derivative of the duty cycle for the FLC

References

  1. Aly, S.; Manzoor, H.; Simson, S.; Abotaleb, A.; Lawler, J.; Mabrouk, A.N. Pilot testing of a novel Multi Effect Distillation (MED) technology for seawater desalination. Desalination 2021, 519, 115221. [Google Scholar] [CrossRef]
  2. Chafidz, A.; Kerme, E.D.; Wazeer, I.; Khalid, Y.; Ajbar, A.; Al-Zahrani, S.M. Design and fabrication of a portable and hybrid solar-powered membrane distillation system. J. Clean. Prod. 2016, 133, 631–647. [Google Scholar] [CrossRef]
  3. Wei, M.; Xiang, J.; Ye, H.; Zheng, H.; Wang, K.; Chen, J. Using water-filling and air-releasing to design a natural vacuum solar desalination system. Sol. Energy 2021, 220, 598–607. [Google Scholar] [CrossRef]
  4. Rabie, M.; Ali, A.Y.; Abo-Zahhad, E.M.; Elqady, H.I.; Elkady, M.; Ookawara, S.; El-Shazly, A.; Salem, M.S.; Radwan, A. Thermal analysis of a hybrid high concentrator photovoltaic/membrane distillation system for isolated coastal regions. Sol. Energy 2021, 215, 220–239. [Google Scholar] [CrossRef]
  5. Abouelmahjoub, Y.; El Beid, S.; Abouobaida, H.; Chellakhi, A. Nonlinear Observation and Control of Series Active Power Filters in the Presence of Voltage Sags. Int. J. Photoenergy 2022, 2022, e7761031. [Google Scholar] [CrossRef]
  6. Mchaouar, Y.; Abouloifa, A.; Lachkar, I.; Katir, H.; Giri, F.; El Aroudi, A.; Taghzaoui, C. Singular perturbation theory for PWM AC/DC converters: Nonlinear cascade control design and stability analysis. Iran. J. Electr. Electron. Eng. 2022, 18, 2013. [Google Scholar] [CrossRef]
  7. Giri, F.; Abouloifa, A.; Lachkar, I.; Chaoui, F.Z. Formal Framework for Nonlinear Control of PWM AC/DC Boost Rectifiers—Controller Design and Average Performance Analysis. IEEE Trans. Control Syst. Technol. 2010, 18, 323–335. [Google Scholar] [CrossRef]
  8. Eren, S.; Pahlevani, M.; Bakhshai, A.; Jain, P. A Digital Current Control Technique for Grid-Connected AC/DC Converters Used for Energy Storage Systems. IEEE Trans. Power Electron. 2017, 32, 3970–3988. [Google Scholar] [CrossRef]
  9. Chen, H.-C.; Liao, J.-Y. Bidirectional Current Sensorless Control for the Full-Bridge AC/DC Converter With Considering Both Inductor Resistance and Conduction Voltages. IEEE Trans. Power Electron. 2014, 29, 2071–2082. [Google Scholar] [CrossRef]
  10. Sabzehgar, R.; Roshan, Y.M.; Fajri, P. Modelling and sliding-mode control of a single-phase single-stage converter with application to plug-in electric vehicles. IET Power Electron. 2019, 12, 620–626. [Google Scholar] [CrossRef]
  11. Chen, T.-C.; Ren, T.-J.; Ou, J.-C. Fixed switching frequency applied in single-phase boost AC to DC converter. Energy Convers. Manag. 2009, 50, 2659–2664. [Google Scholar] [CrossRef]
  12. Hossain, M.; Rahim, N.; Selvaraj, J.A. Recent progress and development on power DC-DC converter topology, control, design and applications: A review. Renew. Sustain. Energy Rev. 2018, 81, 205–230. [Google Scholar] [CrossRef]
  13. Martinez-Lopez, M.; Moreno-Valenzuela, J.; He, W. A robust nonlinear PI-type controller for the DC–DC buck–boost power converter. ISA Trans. 2022, 129, 687–700. [Google Scholar] [CrossRef]
  14. Anzehaee, M.M.; Hajihosseini, P.; Behnam, B. Presenting an effective and easy method for designing and tuning predictive controller for boost and buck-boost converters in Continuous Conduction Mode. Control Eng. Pract. 2021, 114, 104882. [Google Scholar] [CrossRef]
  15. Cordeiro, A.; Pires, V.F.; Foito, D.; Pires, A.; Martins, J. Three-level quadratic boost DC-DC converter associated to a SRM drive for water pumping photovoltaic powered systems. Sol. Energy 2020, 209, 42–56. [Google Scholar] [CrossRef]
  16. Pires, V.F.; Cordeiro, A.; Foito, D.; Silva, J.F. Control transition mode from voltage control to MPPT for PV generators in isolated DC microgrids. Int. J. Electr. Power Energy Syst. 2022, 137, 107876. [Google Scholar] [CrossRef]
  17. Ozdemir, S.; Altin, N.; Sefa, I. Fuzzy logic based MPPT controller for high conversion ratio quadratic boost converter. Int. J. Hydrogen Energy 2017, 42, 17748–17759. [Google Scholar] [CrossRef]
  18. Naik, B.; Mehta, A. Sliding mode controller with modified sliding function for DC-DC Buck Converter. ISA Trans. 2017, 70, 279–287. [Google Scholar] [CrossRef]
  19. Nandankar, P.V.; Bedekar, P.P.; Dhawas, P.V. Efficient DC-DC converter with optimized switching control: A comprehensive review. Sustain. Energy Technol. Assess. 2021, 48, 101670. [Google Scholar] [CrossRef]
  20. Karami, N.; Moubayed, N.; Outbib, R. General review and classification of different MPPT Techniques. Renew. Sustain. Energy Rev. 2017, 68, 1–18. [Google Scholar] [CrossRef]
  21. Mao, M.; Cui, L.; Zhang, Q.; Guo, K.; Zhou, L.; Huang, H. Classification and summarization of solar photovoltaic MPPT techniques: A review based on traditional and intelligent control strategies. Energy Rep. 2020, 6, 1312–1327. [Google Scholar] [CrossRef]
  22. Motahhir, S.; El Hammoumi, A.; El Ghzizal, A. The most used MPPT algorithms: Review and the suitable low-cost embedded board for each algorithm. J. Clean. Prod. 2020, 246, 118983. [Google Scholar] [CrossRef]
  23. Sousa, S.; Gusman, L.; Lopes, T.; Pereira, H.; Callegari, J. MPPT algorithm in single loop current-mode control applied to dc–dc converters with input current source characteristics. Int. J. Electr. Power Energy Syst. 2022, 138, 107909. [Google Scholar] [CrossRef]
  24. Yang, B.; Yu, T.; Shu, H.; Zhu, D.; An, N.; Sang, Y.; Jiang, L. Perturbation observer based fractional-order sliding-mode controller for MPPT of grid-connected PV inverters: Design and real-time implementation. Control Eng. Pract. 2018, 79, 105–125. [Google Scholar] [CrossRef]
  25. Hou, G.; Ke, Y.; Huang, C. A flexible constant power generation scheme for photovoltaic system by error-based active disturbance rejection control and perturb & observe. Energy 2021, 237, 121646. [Google Scholar] [CrossRef]
  26. Jately, V.; Azzopardi, B.; Joshi, J.; Venkateswaran, V.B.; Sharma, A.; Arora, S. Experimental Analysis of hill-climbing MPPT algorithms under low irradiance levels. Renew. Sustain. Energy Rev. 2021, 150, 111467. [Google Scholar] [CrossRef]
  27. Shahid, H.; Kamran, M.; Mehmood, Z.; Saleem, M.Y.; Mudassar, M.; Haider, K. Implementation of the novel temperature controller and incremental conductance MPPT algorithm for indoor photovoltaic system. Sol. Energy 2018, 163, 235–242. [Google Scholar] [CrossRef]
  28. Fathi, M.; Parian, J.A. Intelligent MPPT for photovoltaic panels using a novel fuzzy logic and artificial neural networks based on evolutionary algorithms. Energy Rep. 2021, 7, 1338–1348. [Google Scholar] [CrossRef]
  29. Miladi, R.; Frikha, N.; Gabsi, S. Modeling and energy analysis of a solar thermal vacuum membrane distillation coupled with a liquid ring vacuum pump. Renew. Energy 2021, 164, 1395–1407. [Google Scholar] [CrossRef]
  30. Gil, J.D.; Roca, L.; Zaragoza, G.; Berenguel, M. A feedback control system with reference governor for a solar membrane distillation pilot facility. Renew. Energy 2018, 120, 536–549. [Google Scholar] [CrossRef]
  31. Sferlazza, A.; Albea-Sanchez, C.; Garcia, G. A hybrid control strategy for quadratic boost converters with inductor currents estimation. Control Eng. Pract. 2020, 103, 104602. [Google Scholar] [CrossRef]
Figure 1. Power supply diagram for the distillation system.
Sustainability 16 07304 g001
Figure 2. Hybrid PV-grid conversion structure.
Sustainability 16 07304 g002
Figure 3. PV source characteristics: (a) current–voltage and (b) powervoltage.
Sustainability 16 07304 g003
Figure 4. Control strategy of the rectifier and QBC.
Sustainability 16 07304 g004
Figure 5. Proposed control strategy.
Sustainability 16 07304 g005
Figure 6. Components of a fuzzy controller.
Sustainability 16 07304 g006
Figure 7. Membership functions.
Sustainability 16 07304 g007
Figure 8. Fuzzy MPPT control.
Sustainability 16 07304 g008
Figure 9. Results of simulations, (a) irradiation, (b) PV voltage, (c) i voltage, (d) grid voltage and current, (e) grid current and reference model current, (f) power, and (g) power factor.
Sustainability 16 07304 g009
Figure 10. Simulations results, (a) PV voltage, (b) output voltage, (c) grid voltage and current, (d) zoom of the grid voltage and current (e) grid current and reference model current, (f) power, and (g) power factor.
Sustainability 16 07304 g010
Figure 11. Results of simulations, (a) Output voltage, (b) PV voltage, (c) grid voltage and current, (d) zoom of the grid voltage and current, (e) grid current and reference model current, (f) power, and (g) power factor.
Sustainability 16 07304 g011
Figure 12. Results of simulations, (a) grid voltage and current, (b) zoom of the grid voltage and current, (c) PV voltage, (d) output voltage, (e) grid current and reference model current, (f) power, and (g) power factor.
Sustainability 16 07304 g012
Figure 13. THD comparison between 2-L and 3-L PWM, G = 600   W m 2 ,   I g m a x = 59   A .
Sustainability 16 07304 g013
Table 1. The 3-level switching SPWM.
S 1 = S ¯ 2 S 3 = S ¯ 4 V p I D C 1
10000
201 V D C I g
310 V D C I g
41100
Table 2. Rule base.
Table 2. Rule base.
e 1 d e 1
NBNSZEPSPB
NBZEZENBNBNB
NSZEZENSNSNS
ZENSZEZEZEPS
PSPSPSPSZEZE
PBPBPBPBZEZE
Table 3. Simulation parameters.
AC–DC RectifierQBC
L15 mHPpv (max)10.5 kW
r0.1 ΩUpv (max)150 V
V g t 311 . sin ω t L24 mH
f g f(PWM)50–10 kHzL34 mH
R (load)24 ΩC21500 µF
C15000 µFC3100 µF
Disclaimer/Publisher’s Note: The statements, opinions and data contained in all publications are solely those of the individual author(s) and contributor(s) and not of MDPI and/or the editor(s). MDPI and/or the editor(s) disclaim responsibility for any injury to people or property resulting from any ideas, methods, instructions or products referred to in the content.

