Article

Experimental Study on Static and Dynamic Characteristics of Sand–Clay Mixtures with Different Mass Ratios

1
Research Institute of Emergency Science, Chinese Institute of Coal Science (CICS), Beijing 100013, China
2
Tian Di Science & Technology Co., Ltd., Beijing Technology Research Branch, Beijing 100013, China
*
Author to whom correspondence should be addressed.
Sustainability 2024, 16(17), 7343; https://doi.org/10.3390/su16177343
Submission received: 19 July 2024 / Revised: 19 August 2024 / Accepted: 23 August 2024 / Published: 26 August 2024

Abstract

:
The alteration of soil static and dynamic characteristics induced by clay content constitutes a crucial issue in the realm of disaster prevention and mitigation within geotechnical engineering. The static and dynamic characteristics of mixed soils with varying sand–clay contents were investigated through the design and implementation of static and dynamic triaxial tests. The relationship between clay content and soil resistance to liquefaction was investigated, with an analysis of the influence of clay content on soil strength and static liquefaction performance. Furthermore, the study examined the soil’s resistance to liquefaction under dynamic constitutive and cyclic loading conditions for soils with varying clay content. Results indicate that stress–strain curves for samples with varying clay content exhibit a consistent trend, with the lowest tangent modulus and peak strength observed in samples containing 30% clay. Increasing clay content diminishes soil’s resistance to liquefaction under static loading conditions. Higher confining pressures correspond to larger tangent moduli and peak deviating stresses in triaxial shear tests. Dynamic shear modulus decreases as clay content increases, whereas damping ratio decreases accordingly. Soil gradation significantly affects liquefaction-induced deformation, with the sample containing 30% clay experiencing the fastest increase in pore water pressure during testing failure, accompanied by fewer cyclic loading cycles until failure occurs. Improving soil gradation and adjusting the sand–clay ratio are beneficial for enhancing both soil strength and its resistance to liquefaction.

1. Introduction

Under the influence of seismic activity, traffic loads, and heavy loads, soil masses are susceptible to liquefaction-induced deformation leading to strength loss, collapse, sand flow, and other geological disasters. These events cause significant deformations and instabilities in surface roadbeds, foundations, slopes, as well as underground shallow-buried tunnels and corridors. Consequently, engineering disasters occur, resulting in substantial economic losses while posing threats to human lives and property safety. Numerous instances of liquefaction disasters have revealed that a considerable proportion of liquefied sands contain fine particles such as clay and silt. Therefore, investigating the static and dynamic characteristics of soils with varying clay content has become an imperative aspect in geotechnical engineering disaster prevention and mitigation studies.
The dynamic constitutive relation of soil is fundamental for characterizing the dynamic characteristics of soil and serves as a crucial basis for analyzing the nonlinear behavior and dynamic instability process of soil. Extensive research has been conducted by scholars [1,2,3,4,5,6,7,8,9,10] on the static and dynamic properties of coarse-grained soil, leading to the development of soil strengthening techniques aimed at improving engineering properties. Numerous studies have also investigated the dynamic properties of cement-improved soils [11,12,13,14]. Fedakar [15] investigated the deformation behavior of K-consolidated sand–clay mixtures through cyclic triaxial and hollow cylinder tests. Test results clearly indicate the necessity of considering the influence of principal stress rotation for a more accurate estimation of the deformation behavior of sand–clay mixtures under repetitive traffic loads. Kim’s [16] test results show that a unique relationship between cyclic shear strength and equivalent granular void ratio was observed for pure sand and sand–clay mixtures with a sand matrix. Lv [17] showed that static liquefaction is prone to be promoted by low initial relative density and confining pressure; even a small amount of clay particles can significantly increase the liquefaction susceptibility in loose sand–clay mixtures. Previous investigations have indicated that three key factors influencing liquefaction characteristics in submarine silt are clay content [18], effective confining pressure, and cyclic stress ratio [19]. Changes in clay content can affect particle cementation and lubrication, thereby altering the mechanical behavior of soils [20]. Wang’s study revealed that lower fine particle contents result in faster rise rates of dynamic pore pressure, while higher fine particle contents lead to slower rise rates [21]. Li examined the dynamics of pore pressure accumulation characteristics in silty soils mixed with clay, finding that dynamic pore pressures reached 60–80% of confining pressures while cumulative dynamic strains reached 5%, both serving as criteria for assessing liquefaction potential in silty soils [22]. Cheng demonstrated that higher initial consolidation ratios corresponded to lower pore pressure ratios during liquefaction failure events [23], whereas Song suggested that strain standards were more suitable than pore pressure standards for evaluating submarine silt’s liquefaction potential [24].
Currently, the relationship between liquefaction failure of sand–clay mixtures under static and dynamic loads and clay content remains unclear. Furthermore, there is a paucity of studies investigating the development pattern of liquefaction potential under static loading and limited reports on the variation in shear modulus and damping of sand–viscous mixed soil under dynamic loading. To gain a more accurate understanding of the static and dynamic characteristics of soil, we conducted triaxial tests on mixed soils with varying sand–clay contents. This study examines the correlation between clay content and soil resistance to liquefaction, analyzes the impact of clay content on soil strength and static liquefaction performance, as well as investigates soil resistance to liquefaction under dynamic constitutive behavior and cyclic loading for soils with different clay contents. The research findings hold significant reference value for improving soil gradation, enhancing soil strength, and increasing liquefaction resistance.

2. Sample Preparation and Test Method

2.1. Test Device and Test Procedure

The GDS vibration triaxial test system, as depicted in Figure 1, was utilized for experimental loading. It possessed a maximum confining pressure of 2 MPa, an axial force loading range from 0 to 10 kN, and a maximum loading frequency of 2 Hz. The prepared sample for the test had cylindrical dimensions with a diameter of 38 mm and height of 76 mm. This apparatus simultaneously fulfills the requirements for both triaxial shear testing and vibration triaxial testing.
The triaxial test consists of four stages: sample preparation, saturation, consolidation, and test loading stages. (1) To ensure uniform sample preparation, the soil sample is loaded in five layers with calculated quantities for loading and tamping. This ensures consistent loading height for each layer and scraped contact surfaces between layers. (2) The saturated sample undergoes vacuum saturation followed by reverse-pressure saturation. After being vacuumized and saturated in the saturator for over 12 h, the sample is subjected to reverse-pressure saturation in the loading container. Saturation requirements are considered met when the pore pressure coefficient B > 0.95. (3) Once the sample reaches a state of saturation, the drainage valve is kept open while consolidating under a predetermined effective confining pressure for 2 to 4 h. (4) Upon completion of sample consolidation, it is loaded according to the test plan.

2.2. Sample Preparation and Saturation

The soil sample is a mixture of clay and standard sand. The clay samples were collected from the surface soil of the North China Plain. The liquid limit, as determined by laboratory testing, was found to be 30.2%, while the plastic limit was measured at 21.3%. The standard sand used in this study is medium sand with a mass ratio exceeding 95%. Considering the significant differentiation and representativeness of clay content, four samples were prepared with varying proportions of clay mass: 20%, 30%, 40%, and 50%. The control density remained consistent throughout the sample preparation process, and the dry density of the sample was measured to be 1.73. Under normal circumstances, saturated soil is more susceptible to deformation and destruction; therefore, the test takes into account the saturation condition. Additionally, a moisture content of 10% is also considered in order to investigate unsaturated soil. For each sample containing 10% moisture content, water was added directly according to its moisture content before thorough mixing and preparation. In order to obtain saturated samples, an initial moisture content of 6% was targeted during preparation prior to vacuum saturation using the vacuum saturator.

2.3. Test Scheme

(1)
Triaxial shear test
The triaxial shear test is designed for 12 soil samples, comprising 4 unsaturated soil samples and 8 saturated soil samples. Table 1 presents the recorded working conditions. For samples with clay content of 20%, 30%, 40%, and 50%, two cases were considered, representing saturation and a moisture content of 10%, respectively. To investigate the impact of different confining pressures on the samples, specimens containing 20% and 40% clay were selected for testing and analysis. The confining pressure of the test was set at 20 kPa, 50 kPa, and 100 kPa, respectively, to account for variations in soil pressure at different depths. The loading rate applied during the tests was set at a constant value of 0.1 mm/min with a total loading time of 200 min.
(2)
Vibration triaxial test
The vibration triaxial test is designed to include 8 soil samples, comprising 4 step-loading dynamic triaxial tests and 4 cyclic loading dynamic triaxial tests. The test samples were all saturated samples. The details of the experimental conditions are presented in Table 2. The applied confining pressure during the test was maintained at 50 kPa with a loading frequency of 1 Hz. In the step loading test, each stage involved an increment of partial stress by 5 kPa, with a total of 10 cycles loaded for every stage until the cumulative axial strain reached 10%. On the other hand, in the cyclic loading test, continuous loading was conducted using a fixed bias stress until reaching an axial strain level of 10%.

3. Shear Mechanical Properties of Mixed Soil

According to the triaxial shear test of the sample, an analysis is conducted on the shear mechanical properties of samples with varying clay content. The strength characteristics under shear action are investigated through examination of the stress–strain curve, while the pore pressure–strain curve is utilized to study the static anti-liquefaction ability.

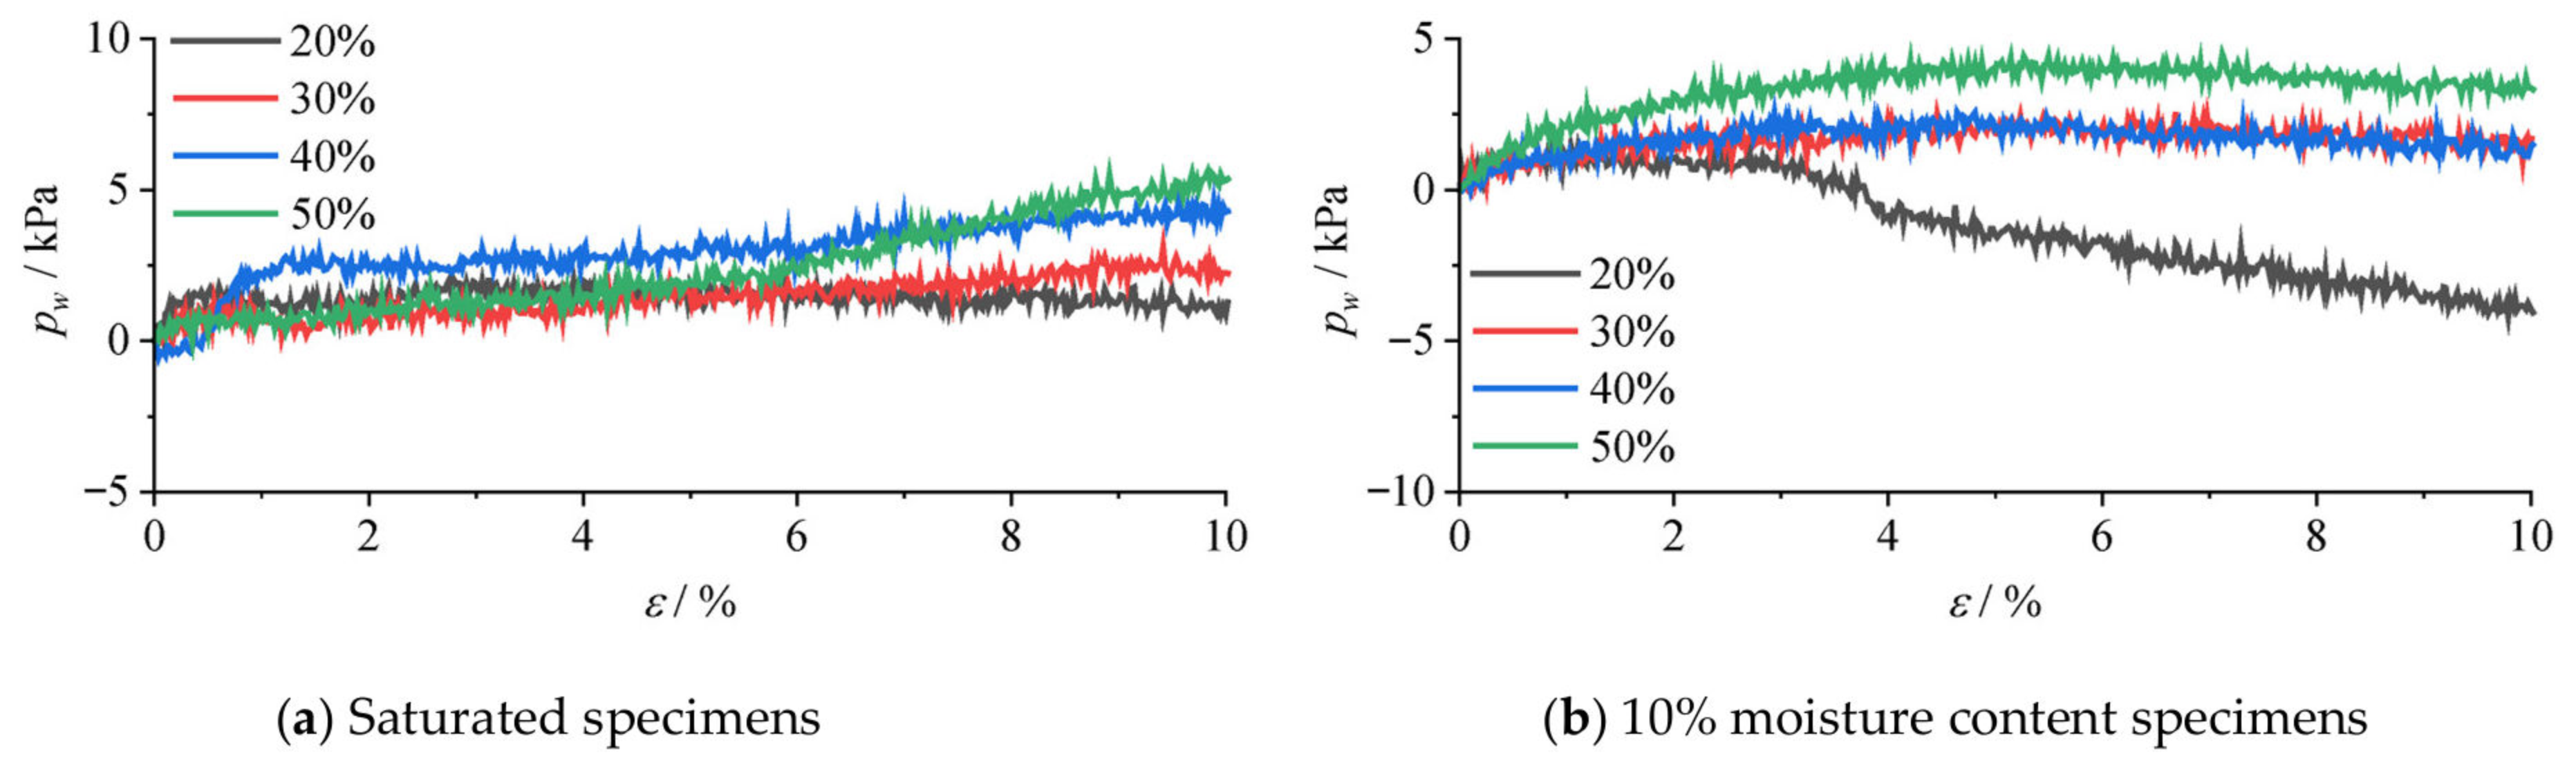
3.1. Shear Mechanical Properties of Samples with Different Clay Content

The deviator stress σ 1 σ 3 –strain ( ε ) curves of triaxial shear tests for samples with varying clay contents are presented in Figure 2. The shape trend of the deviator stress–strain curves is consistent across all samples, exhibiting three distinct stages. The initial stage (marked as ① in Figure 2) primarily involves elastic deformation, characterized by a linear curve. During this stage, the soil aggregate remains intact and occupies considerable space, resulting in resistance to shear deformation predominantly through elastic behavior. Subsequently, the second stage (marked as ② in Figure 2) is dominated by plastic deformation. In the third stage (marked as ③ in Figure 2), plastic damage becomes more prominent in the soil sample. Throughout the loading process, there is a gradual decrease in tangential modulus as strain increases due to diminishing interparticle frictional forces between particles. Consequently, the tangential modulus decreases accordingly. With an increase in clay content, there is an initial decline followed by an increase in the tangential modulus of stress–strain curves. Notably, samples with 30% clay content exhibit both the lowest tangential modulus and peak deviational stress following a similar pattern, as observed previously mentioned trends indicate that variations in clay content alter particle structure distribution within soils and subsequently modify contact frictional stresses between particles, leading to different strengths among samples.
The pore pressure ( p w )–strain ( ε ) curves of saturated samples under different clay content are presented in Figure 3. As the loading process advances, the pore water pressure increases with increasing strain and clay content. However, for samples with 10% moisture content, the pore water pressure decreases during the loading process for samples with 20% clay content, while it increases for other samples. In cases of low clay content, there are numerous pores between sand particles. During the loading process of unsaturated samples, changes occur in the distribution of water and clay particles, leading to a decrease in pore water pressure. With an increase in clay content proportion, both growth rate and peak value of pore water pressure gradually increase until reaching a peak value of 7.64 kPa for samples with 50% clay content. The rise in pore water pressure results in a reduction in soil effective stress, indicating that an increase in soil’s clay content diminishes its liquefaction resistance under static conditions.

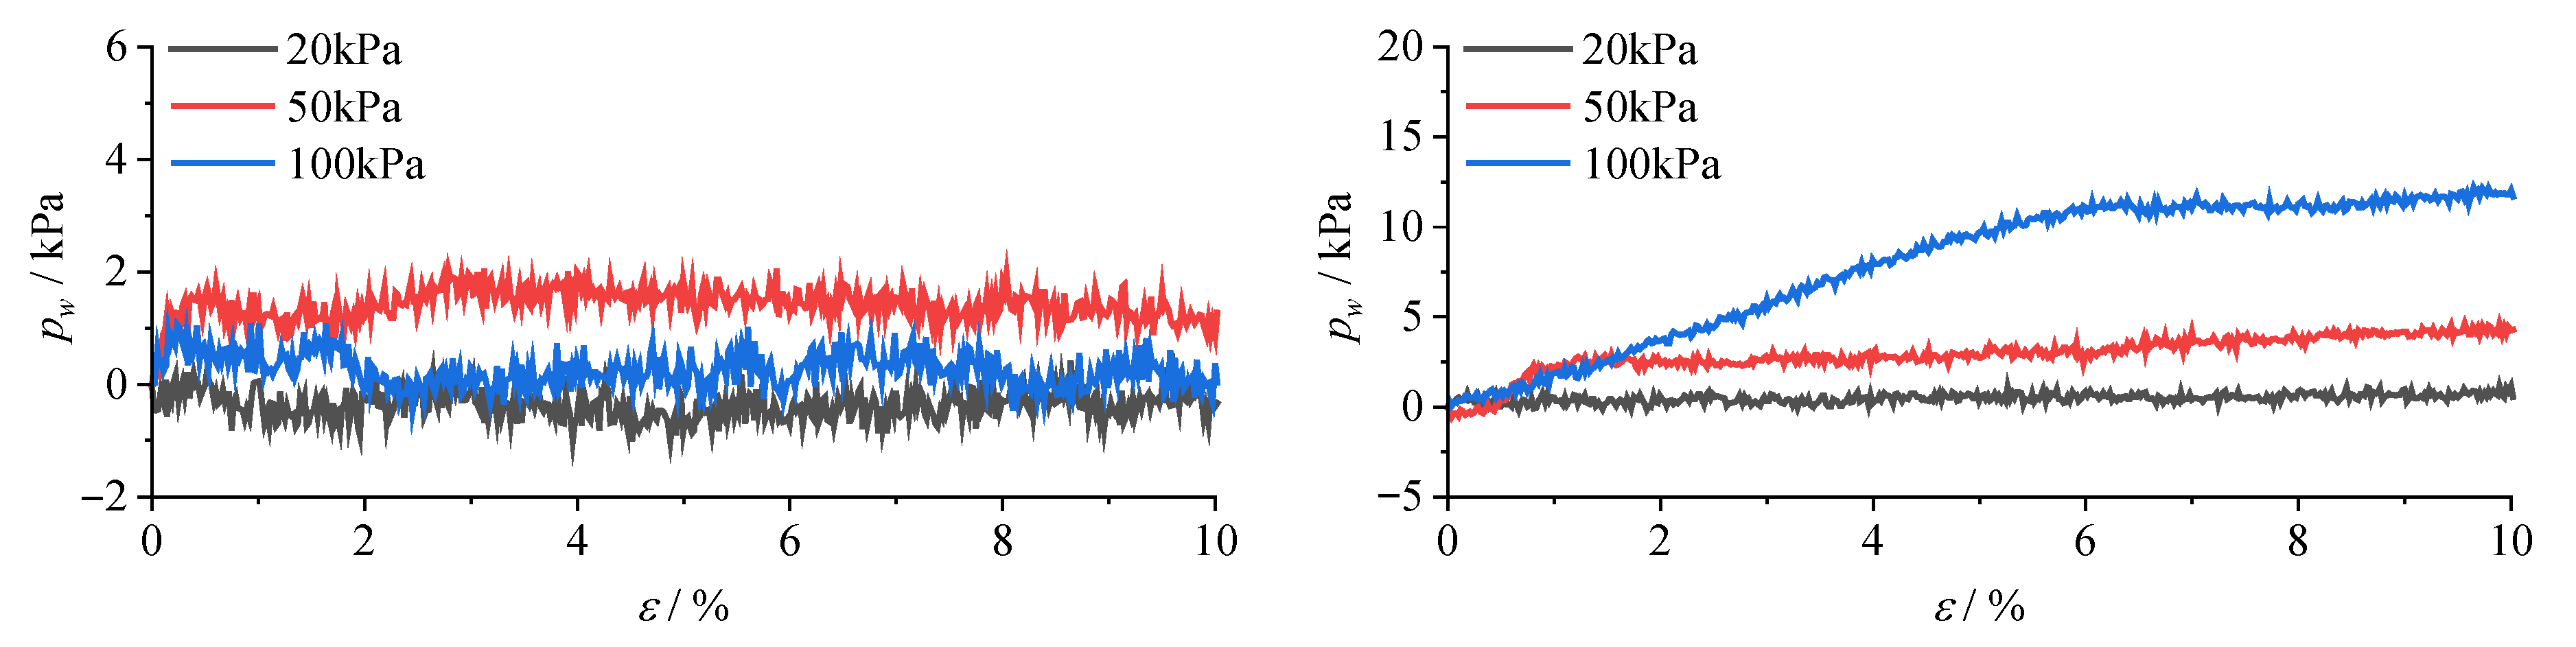
3.2. Influence of Confining Pressure on Sample Strength and Static Liquefaction Characteristics

The deviator stress–strain curves of saturated samples under different confining pressures are presented in Figure 4. It can be observed that the shape trend of stress–strain curves remains consistent for samples subjected to confining pressures of 20, 50, and 200 kPa. Additionally, the deviational stresses corresponding to the maximum axial strain at confining pressures of 20 kPa, 50 kPa, and 100 kPa are determined as 30 kPa, 100 kPa, and 200 kPa, respectively. For samples containing 20% clay content, an increase in confining pressure leads to a steeper slope of the stress–strain curve and higher peak deviational stress values. During the initial stage of strain, the deviational stress remains relatively constant for samples with 40% clay content before rapidly increasing. In the plastic deformation and failure stage, the tangential modulus of the sample increases proportionally with confining pressure.
The pore pressure–strain curves of samples with different confining pressures are presented in Figure 5. For the sample containing 20% clay, the pore water pressure remains relatively constant during the loading process, whereas for the sample with 40% clay content, there is a gradual increase in pore water pressure as loading progresses. Moreover, an increase in confining pressure leads to a faster rise in pore water pressure. Notably, under a confining pressure of 100 kPa, the peak pore water pressure can reach up to 12.9 kPa. When the clay content is low, sand particles predominantly control the properties due to their surrounding arrangement around almost all clay particles. Consequently, there exists significant interparticle spacing, facilitating rapid water flow and preventing substantial increases in pore water pressure. Conversely, at higher clay contents, clay particles fill gaps between sand particles, resulting in slower permeation of pore water under load and subsequent elevation of pore water pressure. Furthermore, greater contact pressures between particles occur with increased confining pressures, leading to tighter gaps and accelerated increments in pore water pressure.

4. The Dynamic and Liquefaction Characteristics of the Mixed Soil

According to the triaxial vibration test conducted on the samples, an analysis was performed on the dynamic characteristics of samples with varying clay content and their susceptibility to liquefaction under cyclic loading. The fractional loading test was employed to investigate the dynamic shear modulus and damping ratio of the samples, while a cyclic loading failure test was conducted to assess their resistance against liquefaction induced by dynamic loads.

4.1. Dynamic Shear Modulus and Damping Ratio of Sand–Viscous Mixed Soil

Under the influence of harmonic loading, the stress–strain relationship of soil exhibits nonlinearity, hysteresis, and deformation accumulation. During each loading cycle, the sample’s loading and unloading curves do not coincide, resulting in the formation of a hysteresis loop. This hysteresis curve effectively characterizes the stress–strain behavior of soil materials under cyclic loads and facilitates calculations for dynamic parameters such as shear modulus and damping ratio. The dynamic shear modulus reflects variations in the stress–strain curve (also known as the backbone curve) of soil subjected to vibrational loads, while the damping ratio quantifies energy dissipation within soil during cyclic loading.
The dynamic shear modulus and damping ratio of mixed soil with varying clay content were analyzed based on the test results obtained through fractional loading. Figure 6 illustrates the formation of dynamic shear modulus ( G d )–strain ( γ d ) and damping rate ( λ d )–strain ( γ d ) curves resulting from graded loading of mixed soil samples with different clay content. It is evident from the figure that the dynamic shear modulus decreases as the shear strain increases for samples with varying clay content, while the damping ratio initially increases and subsequently decreases.
The behavior of soil under dynamic loading typically involves three stages: elastic deformation, plastic deformation, and failure deformation. Within the range of shear strain from 0.01% to 1%, the transition from elastic to plastic deformation occurs in soil, leading to a rapid decrease in its dynamic shear modulus. When the shear strain exceeds 1%, the soil enters a stage of destruction and deformation, resulting in an extremely low dynamic shear modulus and loss of strength. Regarding damping ratio, within the range of shear strain from 0.01% to 0.1%, there is a gradual increase indicating that it rises with increasing eccentric stress during the elastic deformation stage; within the range of shear strain from 0.1% to 1%, as soil undergoes plastic deformation, the damping ratio tends to stabilize; when the shear strain exceeds 1%, there is a gradual decrease in damping ratio as this signifies structural damage and progressive loss of energy dissipation capacity.
According to Figure 6, it is evident that the dynamic shear modulus increases with an increase in clay content, indicating that augmenting the clay content in sandy soil enhances the dynamic shear modulus of the soil, thereby elevating its stiffness. Consequently, under identical loading conditions, minimal deformation occurs, which favors enhancing the foundation’s seismic capacity. However, as the clay content increases, the damping ratio decreases, signifying alterations in soil structure and a gradual decline in energy dissipation capability.

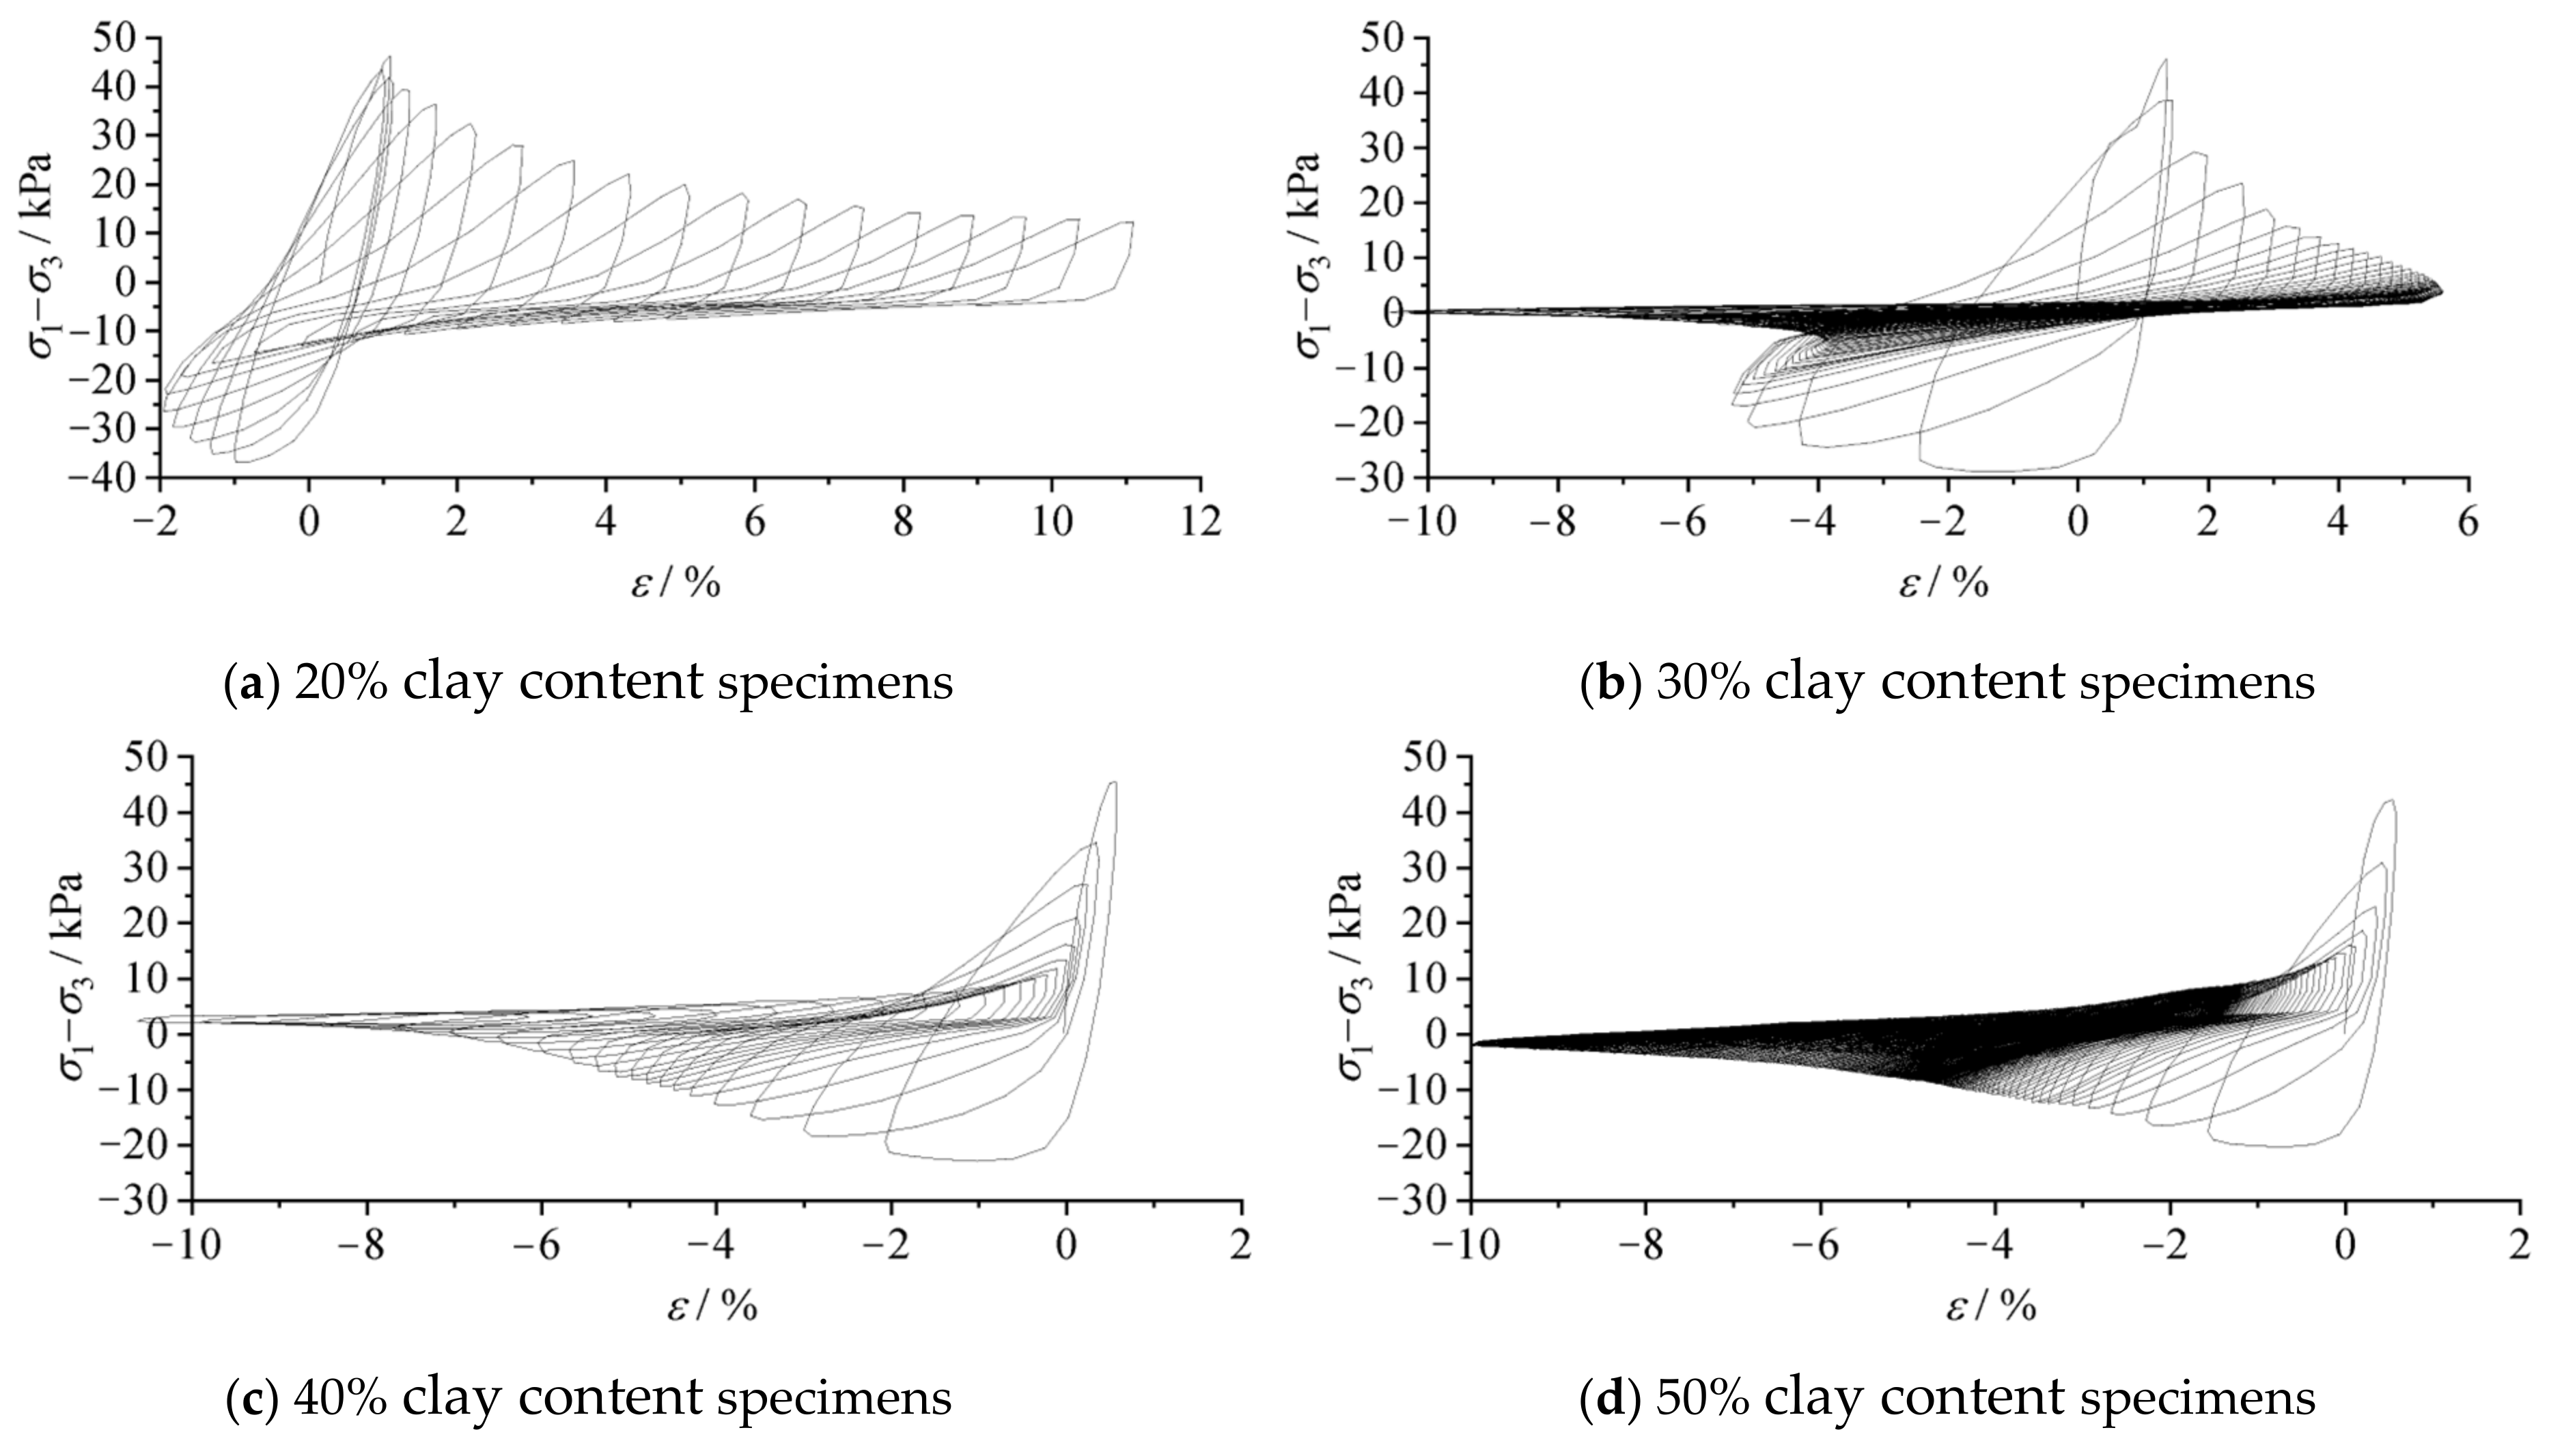
4.2. Hysteretic Curve of Liquefaction Process of Sand–Viscous Mixed Soil

The hysteresis curve of samples with varying clay contents during cyclic loading is presented in Figure 7. It can be observed from the figure that an increase in clay content alters the deformation and failure mode of soil under cyclic loading conditions. During the loading and unloading process, axial strain in samples containing 20% clay primarily exhibits compressive deformation, while samples with 40% and 50% clay predominantly display tensile deformation. Samples with 30% clay exhibit both compressive and tensile deformations. The hysteresis loops formed by samples with different clay contents exhibit significant variations. Based on the morphological characteristics of these loops, dissipated energy per cycle comprises energy dissipated through plastic deformation and viscoelastic deformation, each exhibiting distinct changes throughout the entire cyclic process. Energy dissipation due to plastic deformation corresponds to plastic strain generated within each cycle, where greater plastic strain results in higher dissipated energy from plastic deformation. When the clay content is either low or high, the dissipative energy associated with deformations increases as a function of cyclic loading cycles; however, for a clay content of 30%, there is a uniform decrease in energy dissipation rate which may lead to potential damage.

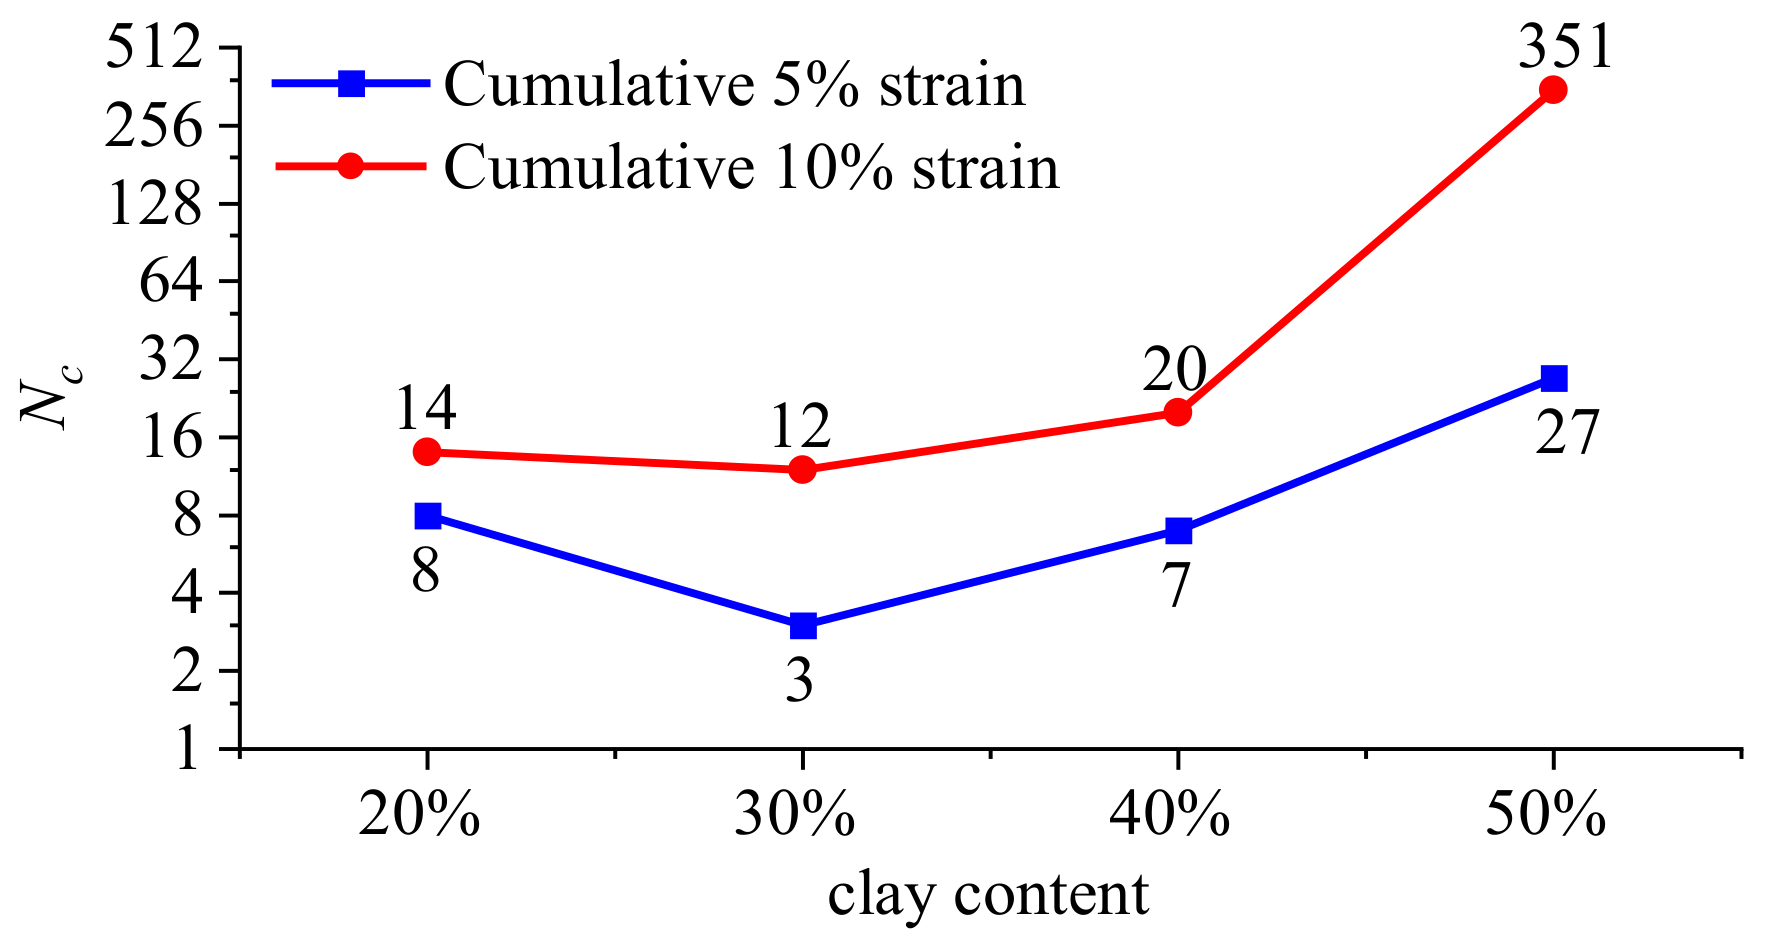
4.3. Liquefaction Resistance of Sand–Clay Mixture

In the dynamic failure criteria of soil, liquefaction failure of samples is typically determined based on the attainment of total strains reaching 5% or 10% [25]. Figure 8 illustrates the number of cyclic loading cycles ( N c ) for saturated samples with varying clay content at cumulative strain levels of 5% and 10% in the cyclic loading test. The results indicate that the number of cycles leading to sample failure initially decreases and then increases with increasing clay content. Notably, when the clay content reaches 30%, the sample exhibits the fewest cycles until failure, suggesting that a soil composition containing 30% clay is most susceptible to liquefaction under dynamic loads. Soil gradation significantly influences liquefaction-induced deformation. Enhancing soil gradation and adjusting sand–clay ratios are beneficial for improving soil strength and its resistance against liquefaction.
Figure 9 illustrates the variation curve of pore water pressure growth with loading time (number of cycles) for samples with different clay contents during cyclic loading. Based on the growth rate, the pore water pressure growth rate of samples with varying clay content is ranked as follows: 30% > 40% > 20% > 50%, from largest to smallest. These results indicate that the sample containing 30% clay experiences the fastest increase in pore water pressure and is most susceptible to liquefaction failure, which aligns with the law governing cyclic loading times during failure.
As presented in Table 3, the pore water pressure values of each sample were observed under cyclic loading conditions when cumulative 10% strain failure occurred. The pore water pressure values of samples with varying clay contents during liquefaction failure were consistently lower than the applied confining pressure, indicating that once the pore water pressure reached a certain threshold, the effective stress within the soil mass was lost and liquefaction ensued. Furthermore, it was observed that after failure, the pore water pressure tended to stabilize. Moreover, an increase in clay content resulted in a gradual elevation of the pore water pressure value at which strain failure reached 10%, suggesting that higher clay content enhances effective stress within the soil.
The hysteresis loop during cyclic loading was analyzed, as depicted in Figure 10, and the curve illustrating the variation in shear modulus ( G c ) for samples with different clay contents under cyclic loading was obtained. The findings indicate that after cyclic loading commences, the shear modulus experiences a rapid decline until failure ensues, leading to a loss of soil strength and ultimately approaching zero. The sample with a clay content of 30% exhibits the lowest shear modulus and soil strength, making it more susceptible to liquefaction failure. This observation is also consistent with the relationship between cyclic loading cycles and failure.
The comparison between the research findings of this paper and those of other scholars is presented in Table 4. The results indicate that the sample with a clay content of 30% exhibits the lowest liquefaction strength, shear modulus, highest damping ratio, and fastest rise rate of pore water pressure. These outcomes differ from previous studies due to variations in sand and clay properties chosen by different researchers, as well as differences in confining pressure and water conditions during testing. In this study, standard sand was selected along with alluvial plain clay from North China, which represents a certain extent of typicality. Consequently, these research findings hold significant reference value for soil gradation improvement, enhancement of soil strength, and resistance against liquefaction. Numerous factors exert influence on soil strength and liquefaction resistance, prompting the author to conduct further experimental research in order to obtain more scientifically robust conclusions.

5. Conclusions

In order to investigate the mechanical properties and liquefaction resistance of mixed soil with varying clay contents, we conducted triaxial shear tests and vibration triaxial tests. The key findings are as follows:
(1)
According to the results obtained from the triaxial shear test, it is observed that the sample with a clay content of 30% exhibits the lowest values for both tangential modulus and peak strength. However, an increase in clay content within the soil leads to a reduction in liquefaction resistance under static loading conditions. Increasing confining pressure in the triaxial shear tests resulted in higher tangential modulus and larger peak deviating stress values. For a clay content of 20%, there was no significant change in pore water pressure. However, at a clay content of 40%, higher confining pressures led to larger peak values of pore water pressure.
(2)
Based on the results of vibration triaxial testing, it is evident that the dynamic shear modulus of the sample decreases with increasing shear strain, while the damping ratio initially increases and then decreases. Moreover, the dynamic shear modulus decreases as clay content increases, whereas the damping ratio decreases with an increase in clay content. Among samples tested, those containing 30% clay content exhibited the most rapid increase in pore water pressure, the lowest shear modulus, and experienced fewer cyclic loading cycles until failure occurred. Enhancing soil gradation and adjusting the sand–clay ratio can effectively increase soil strength and enhance its resistance against liquefaction.
(3)
In this study, the sample containing 30% clay content exhibits the lowest liquefaction strength, shear modulus, and fastest rising rate of pore water pressure, as well as the highest damping ratio. It is important to note that soil strength and liquefaction resistance are influenced by various factors, necessitating further investigation into their combined effects.

Author Contributions

Conceptualization, J.Y.; data curation, Y.C.; funding acquisition, J.Y.; investigation, Y.C.; methodology, Y.C.; project administration, J.Y.; software, Y.C.; supervision, J.Y.; visualization, Y.C.; writing—original draft preparation, Y.C.; writing—review and editing, J.Y. All authors have read and agreed to the published version of the manuscript.

Funding

This research was funded by the Innovation and Entrepreneurship Science and Technology Project of China Coal Technology and Engineering Group (No. 2023-TD-ZD014-002) and the Innovation and Entrepreneurship Science and Technology Project of China Coal Technology and Engineering Group (No. 2022-2-MS003).

Institutional Review Board Statement

Not applicable.

Informed Consent Statement

Not applicable.

Data Availability Statement

The data that support the findings of this study are available from the corresponding author upon reasonable request.

Conflicts of Interest

Authors Ye Cheng and Jinghu Yang were employed by the company Research Institute of Emergency Science, Chinese Institute of Coal Science.

References

  1. Zhu, J.; Zhao, H.; Luo, Z.; Liu, H. Investigation of the mechanical behavior of soft clay under combined shield construction and ocean waves. Ocean. Eng. 2020, 206, 107250. [Google Scholar]
  2. Goodarzi, S.; Shahnazari, H. Strength enhancement of geotextile-reinforced carbonate sand. Geotext. Geomembr. 2019, 47, 128–139. [Google Scholar] [CrossRef]
  3. Rezvani, R. Shearing response of geotextile-reinforced calcareous soils using monotonic triaxial tests. Mar. Georesources Geotechnol. 2020, 38, 238–249. [Google Scholar] [CrossRef]
  4. Luo, Z.; Ding, X.; Ou, Q.; Fang, H. Bearing capacity and deformation behavior of rigid strip footings on coral sand slopes. Ocean Eng. 2023, 267, 113317. [Google Scholar] [CrossRef]
  5. Ghassemi-Golezani, K.; Farhangi-Abriz, S. Improving plant available water holding capacity of soil by solid and chemically modified biochars. Rhizosphere 2022, 21, 100469. [Google Scholar] [CrossRef]
  6. Juang, C.H.; Dijkstra, T.; Wasowski, J.; Meng, X. Loess geohazards research in China: Advances and challenges for mega engineering projects. Eng. Geol. 2019, 251, 1–10. [Google Scholar] [CrossRef]
  7. Shahnazari, H.; Rezvani, R. Effective parameters for the particle breakage of calcareous sands: An experimental study. Eng. Geol. 2013, 159, 98–105. [Google Scholar] [CrossRef]
  8. Salem, M.; Elmamlouk, H.; Agaiby, S. Static and cyclic behavior of North coast calcareous sand in Egypt. Soil Dyn. Earthq. Eng. 2013, 55, 83–91. [Google Scholar] [CrossRef]
  9. Wang, X.; Weng, Y.; Wei, H.; Meng, Q.; Hu, M. Particle obstruction and crushing of dredged calcareous soil in the Nansha Islands, South China Sea. Eng. Geol. 2019, 261, 105274. [Google Scholar] [CrossRef]
  10. Xiao, Y.; Liu, H.; Xiao, P.; Xiang, J. Fractal crushing of carbonate sands under impact loading. Geotech. Lett. 2016, 6, 199–204. [Google Scholar] [CrossRef]
  11. Li, W.; Lang, L.; Wang, D.; Wu, Y.; Li, F. Investigation on the dynamic shear modulus and damping ratio of steel slag sand mixtures. Constr. Build. Mater. 2018, 162, 170–180. [Google Scholar] [CrossRef]
  12. Ashiango, A.A.; Patra, N.R. Behavior of expansive soil treated with steel slag, rice husk ash, and lime. J. Mater. Civ. Eng. 2016, 28, 06016008. [Google Scholar] [CrossRef]
  13. Min, Y.; Wu, J.; Li, B.; Zhang, J. Dynamic shear modulus and damping ratio of the one-part geopolymer stabilized soft clay. Mater. Civ. Eng. 2022, 34, 04022120. [Google Scholar] [CrossRef]
  14. Yin, P.; Zou, M.; Wei, H.; Yang, K.; Zhang, Y.; Li, X.; Chen, Y.; Zhang, X. Dynamic characteristics and constitutive model of ferronickel slag clay under cyclic loading. China J. Highw. Transp. 2024, 37, 155–165. [Google Scholar]
  15. Fedakar, H.I.; Rutherford, C.J.; Cetin, B. Effect of principal stress rotation on deformation behavior of dense sand-clay mixtures. Road Mater. Pavement Des. 2022, 23, 2035–2056. [Google Scholar] [CrossRef]
  16. Kim, U.; Kim, D.; Zhuang, L. Influence of fines content on the undrained cyclic shear strength of sand-clay mixtures. Soil Dyn. Earthq. Eng. 2016, 83, 124–134. [Google Scholar] [CrossRef]
  17. Lü, X.; Xue, D.; Zhang, B.; Zhong, Q. Experimental studies and constitutive modeling of static liquefaction instability in sand-clay mixtures. Int. J. Geomech. 2022, 22, 0002472. [Google Scholar] [CrossRef]
  18. Zhang, Y.; Fan, L.; Wang, L.; Hou, G.L.; Gu, C.Q. Influence of clay content on compressive strength of silt. Subgrade Eng. 2022, 220, 44–48. [Google Scholar]
  19. Wang, Y.; Cao, T.; Gao, Y.; Shao, J. Experimental study on liquefaction characteristics of saturated silty soil at Yellow River Delta. J. Eng. Geol. 2018, 26, 451–458. [Google Scholar]
  20. Xu, G.; Liu, H.; Liu, J.; Yu, Y. Role of clay content in silty soil liquefaction. Mar. Geol. Quat. Geol. 2012, 32, 31–35. [Google Scholar] [CrossRef]
  21. Wang, G.X.; Jiro, K.; Jiro, T. Study on excess pore water pressures of sands mixed with clays under cyclic loading. Chin. J. Geotech. Eng. 2004, 26, 541–545. [Google Scholar]
  22. Li, S.; Sun, X.S.; Yao, M.L. Study of liquefaction evaluation used in indoor test of silt, silty sand mixed clay. Rock Soil Mech. 2006, 27, 360–364. [Google Scholar]
  23. Cheng, C. Research on Liquefaction Evaluation Criteria for Silty Soil in Yellow River Delta; Ocean University of China: Qingdao, China, 2007. [Google Scholar]
  24. Song, Y.; Sun, Y.; Song, B.; Dong, L.; Du, X. Comparative study on the liquefaction properties of seabed silt under wave loading in the Huanghe River Delta. Haiyang Xuebao 2021, 43, 129–138. [Google Scholar]
  25. Liu, Y. Fundamentals of Soil Dynamics; Tsinghua University Press: Beijing, China, 2019. [Google Scholar]
  26. Liu, X.Z.; Chen, G.X. Experimental study on influence of clay particle content on liquefaction of Nanjing fine sand. Earthq. Eng. Eng. Vib. 2003, 23, 150–155. [Google Scholar]
Figure 1. GDS vibration triaxial test system.
Sustainability 16 07343 g001
Figure 2. Stress–strain curves of different clay content specimens.
Sustainability 16 07343 g002
Figure 3. Pore pressure–strain curves of different clay content specimens.
Sustainability 16 07343 g003
Figure 4. Stress–strain curves of different confining pressures specimens.
Sustainability 16 07343 g004
Figure 5. Pore pressure–strain curves of different confining pressures specimens.
Sustainability 16 07343 g005
Figure 6. Shear modulus and damping ratio of different clay content specimens.
Sustainability 16 07343 g006
Figure 7. Cyclic loading hysteresis curve.
Sustainability 16 07343 g007
Figure 8. Cyclic loading number when the specimen is damaged.
Sustainability 16 07343 g008
Figure 9. Pore water pressure during cyclic loading.
Sustainability 16 07343 g009
Figure 10. Shear modulus during cyclic loading.
Sustainability 16 07343 g010
Table 1. Triaxial shear test cases.
Case NumberClay ContentMoisture ContentConfining Pressure
T120%saturated50 kPa
T230%saturated50 kPa
T340%saturated50 kPa
T450%saturated50 kPa
T520%10%50 kPa
T630%10%50 kPa
T740%10%50 kPa
T850%10%50 kPa
T920%saturated20 kPa
T1020%saturated100 kPa
T1140%saturated20 kPa
T1240%saturated100 kPa
Table 2. Vibration triaxial test cases.
Case NumberClay ContentConfining PressureCyclic Stress Ratio
V1310%50 kPaStep loading
V1420%50 kPa
V1530%50 kPa
V1640%50 kPa
V1710%50 kPa1
V1820%50 kPa1
V1930%50 kPa1
V2040%50 kPa1
Table 3. Pore water pressure value at the time of damage.
Clay Content20%30%40%50%
Pore pressure at 10% strain30.69 kPa34.90 kPa36.14 kPa44.21 kPa
Table 4. Comparison of test results.
Clay ContentLiquefaction StrengthModulusDampingPore Pressure
Results of this paper20~50%30% minimum30% minimum30% maximum30% fastest
Reference [18]0~30%6% minimumconsistent//
Reference [19]50~80%increases with the increase in particle size//decreases with the increase in powder particles
Reference [20]3~21%9% minimum//decreases with the increase in powder particles
Reference [21]0~78%///decreases with the increase in powder particles
Reference [26]5~15%10% minimum///
Disclaimer/Publisher’s Note: The statements, opinions and data contained in all publications are solely those of the individual author(s) and contributor(s) and not of MDPI and/or the editor(s). MDPI and/or the editor(s) disclaim responsibility for any injury to people or property resulting from any ideas, methods, instructions or products referred to in the content.

