Article

The Influence of Three-Dimensional Building Morphology on PM2.5 Concentrations in the Yangtze River Delta

by
Jing Zhang
1,†,
Wenjian Zhu
1,†,
Dubin Dong
1,
Yuan Ren
1,
Wenhao Hu
2,
Xinjie Jin
3,
Zhengxuan He
1,
Jian Chen
1,
Xiaoai Jin
1,* and
Tianhuan Zhou
4,*
1
State Key Laboratory of Subtropical Silviculture, Zhejiang A&F University, Hangzhou 311300, China
2
School of Landscape Architecture and Architecture, Zhejiang A&F University, Hangzhou 311300, China
3
College of Life and Environmental Sciences, Wenzhou University, Wenzhou 325035, China
4
Zhejiang Forest Resource Monitoring Center, Hangzhou 310020, China
*
Authors to whom correspondence should be addressed.
These authors contributed equally to this work.
Sustainability 2024, 16(17), 7360; https://doi.org/10.3390/su16177360
Submission received: 3 June 2024 / Revised: 23 August 2024 / Accepted: 24 August 2024 / Published: 27 August 2024

Abstract

:
The rapid urbanization of urban areas in China has brought about great variation in the layout of cities and serious air pollution. Recently, the focus has been directed toward understanding the role of urban morphology in the generation and spread of atmospheric pollution, particularly in PM2.5 emissions. However, there have been limited investigations into the impact of three-dimensional (3D) features on changes in PM2.5 concentrations. By analyzing a wealth of data on building structures based on a mixed linear model and variance partition analysis in the Yangtze River Delta throughout 2018, this study sought to examine the associations between PM2.5 concentrations and urban building form, and further compared the contributions of two-dimensional (2D) and 3D building features. The findings revealed that both 2D and 3D building forms played an important role in PM2.5 concentrations. Notably, the greater contribution of 3D building forms on PM2.5 concentrations was observed, especially during the summer, where they accounted for 20% compared to 7% for 2D forms. In particular, the building height range emerged as a crucial local factor affecting PM2.5 concentrations, contributing up to 12%. Moreover, taller buildings with more variability in height were found to aid in the dispersion of pollution. These results underscore the substantial contribution of 3D building morphology to PM2.5 pollution, contrasting with previous studies. Furthermore, compact buildings were linked to lower pollution levels, and an urban landscape characterized by polycentric urban structures and lower fragmentation was deemed more favorable for sustainable urban development. This study is significant in investigating the contribution of 3D morphology to PM2.5 and its importance for pollution dispersion mechanisms. It suggests the adoption of a polycentric urban form with a broader range of building heights in urban planning for local governments in the Yangtze River Delta.

1. Introduction

China has experienced rapid urbanization, especially in fast-growing cities, not only contributing to scientific and economic progress but also leading to severe air pollution. PM2.5 concentrations, the primary air pollutant in most areas of China, may have negative impacts on human health [1,2]. In addition, haze frequently occurs in most urban areas of China, which seriously affects people’s travel [3]. Today, most people around the world live in high-density urban environments with increasing human hazards caused by urban air pollution [4,5].
PM2.5 distribution showed significant spatial heterogeneity in urban agglomerations, though the factors that cause this heterogeneity remain poorly understood [6,7,8,9]. This is mainly because the formation and diffusion processes of pollutants are very complex and jointly affected by multiple factors (e.g., meteorological conditions, socioeconomic factors, and urban morphology). Extensive research has highlighted the effect of meteorological conditions on fine-mode particulate matter, demonstrating that the high humidity and low-temperature conditions contribute to the hygroscopic growth of aerosol particles and the gas–particle transformation process, thus exacerbating air pollution [10]. In addition, cities’ landscape composition and configuration impact PM2.5 pollution significantly. In terms of the spatial configuration of the landscape, researchers used the landscape pattern index to quantitatively describe the two-dimensional characteristics of the urban landscape, such as scale, shape, and aggregation [11,12]. In regions characterized by heavy industrial and transportation activities, there is a tendency for higher PM2.5 concentrations due to increased emissions of particulate matter pollution [13,14,15]. Urban forests can reduce particulate matter pollution by effectively absorbing pollutants through leaves [15]. Water bodies in cities reduce air temperature, increase air humidity, and capture deposited particulate matter, thus reducing the concentration of atmospheric particulate matter [16,17]. Subsequently, an increasing number of researchers have devoted their work to studying air pollution and urban morphology. A large number of studies have investigated the correlation between urban form and PM2.5 concentrations, indicating that cities with higher levels of fragmentation will have higher PM2.5 emissions [18,19].
However, it is difficult to comprehensively describe the changes in urban ecological processes by studies only at the two-dimensional level [20]. Rapid urbanization has led to a more pronounced three-dimensional (3D) spatial character of urban landscapes. The high building density and high building height make the interactions between the building landscape and the environment more complex [21]. Therefore, obtaining three-dimensional information on cities and exploring the relationship between these features and air pollution are crucial for PM2.5 pollution treatment. With the development of remote sensing technology, researchers can rapidly obtain multi-temporal 3D surface information. In recent years, studies of 3D urban morphology have gradually become more common [22]. Due to the pervasive urban heat island effect, researchers have focused on the relationship between the three-dimensional urban form and the urban thermal environment [23,24,25,26]. Tian et al. found that urban 3D morphology was more critical than 2D morphology in predicting temperature [23]. Moreover, the varied building heights and diverse building morphology play a crucial role in reducing PM2.5 pollution, which has a positive impact on our environment and air quality [27,28]. After analyzing high-resolution remote sensing and building data, it was found that the 3D morphology indicators have a greater impact on surface temperature in industrial areas [25].
In addition, the urban form can affect the microclimate of a region to a certain extent. The size of the city, building density, building height, and other factors will affect the temperature, wind speed, and humidity, thus affecting the spread of pollutants [29,30]. However, there are relatively few studies related to urban morphology and air pollution. Although studies have been conducted to analyze the relationship between air pollution and urban three-dimensional landscapes, the research scales have mostly focused on the neighborhood scale and explored the influence of street canyon morphology on pollutant dispersion [31,32]. At the urban scale, researches on the association between building morphology and heavy haze are still focused on the two-dimensional level, and studies on the effect of three-dimensional landscapes on fine-mode particulate matter are relatively few [19,33]. In addition, the extent to which three-dimensional indicators can affect the accumulation of particulate matter is still not fully studied. Thus, clarifying the association and interaction between building morphology and PM2.5 concentrations is not only conducive to dealing with PM2.5 pollution problems but also necessary for the planning of urban agglomerations.
The Yangtze River Delta urban agglomeration stands as one of the renowned estuary regions in China and has experienced rapid urbanization, especially in the fast-growing cities, which contributes to scientific and economic progress but leads to severe air pollution. It covers Jiangsu, Zhejiang, Shanghai, and Anhui, including 41 cities. The heterogeneity of urban building heights affects the urban microclimate and may impact the diffusion of pollutants. Hence, this study aims to examine how PM2.5 levels respond to 2D and 3D factors in various cities across the Yangtze River Delta. Additionally, we will investigate the seasonal fluctuations of this correlation.
Our specific research objectives are (1) to investigate the association between the urban 2D and 3D landscapes and PM2.5 concentrations in the Yangtze River Delta urban agglomeration and (2) to reveal the importance of 2D and 3D indicators on PM2.5 pollution and further to explain the seasonal variation.

2. Materials and Methods

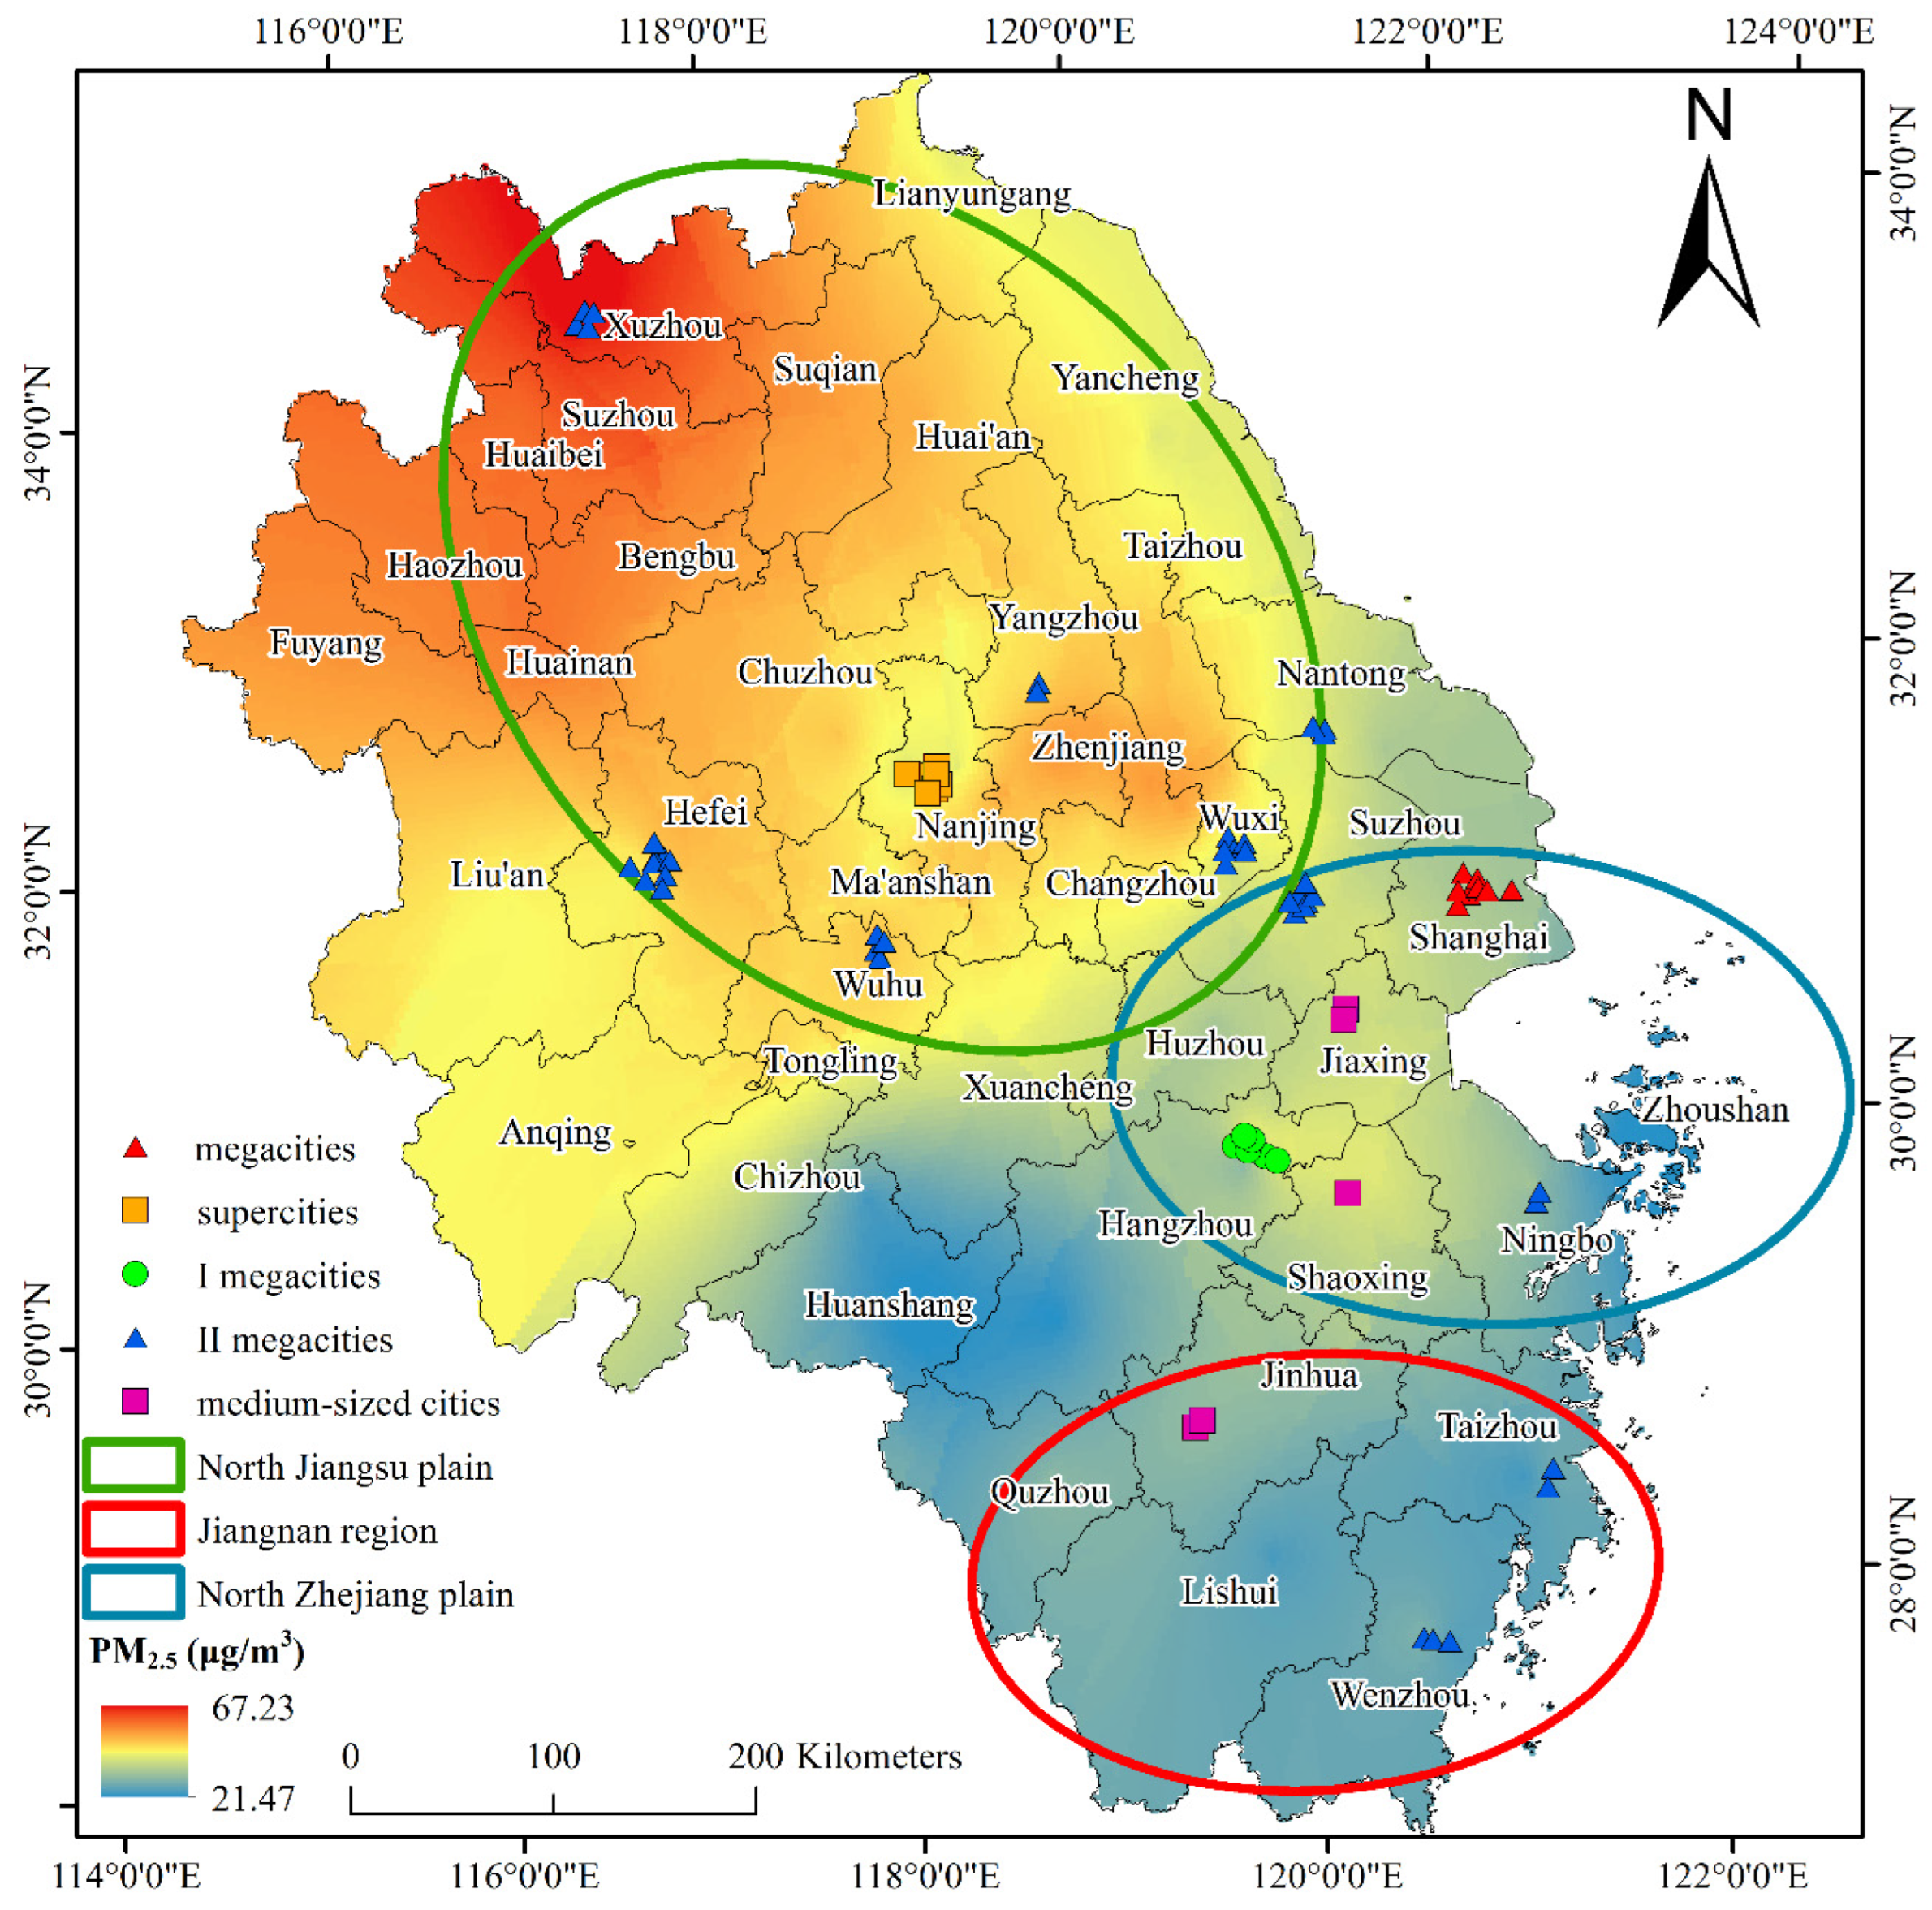
2.1. The Study Area and Monitoring Stations

The Yangtze River Delta stands as one of the renowned estuary regions in China and has experienced rapid urbanization, especially in the fast-growing cities, which contributes to scientific and economic progress but leads to severe air pollution. It covers Jiangsu, Zhejiang, Shanghai, and Anhui, including 41 cities (Figure 1). The accelerated urbanization in the Yangtze River Delta in the past two decades has led to massive emissions of anthropogenic aerosol particles, resulting in frequent heavy-haze events [34]. Figure 1 displays the distribution of monitoring stations in this study, and the color represents the average PM2.5 concentrations in the Yangtze River Delta in 2018. The obvious regional characteristics in PM2.5 concentrations were observed. Generally, the northern part of the Yangtze River Delta is more polluted than the southern part, especially in the northern part of Jiangsu Province, such as Xuzhou and Suzhou. In addition, the area of built-up land increased significantly from 2000 to 2017 [35]. Thus, these areas have experienced various landscape structure changes in 2D and 3D and are ideal for studying the relationship between building morphology and air pollution. In this study, we collected data on fine-mode particulate matter in 70 representative urban monitoring stations and the 2D and 3D building morphology data in these stations to explore the importance of building morphology in air pollution in the Yangtze River Delta.

2.2. The PM2.5 Concentration Data

PM2.5 concentration data in the 70 urban monitoring stations were obtained from the national urban air quality real-time release platform in this study. Due to the failure of the instrument resulting in missing or abnormal data at some moments, the original PM2.5 concentrations data were pre-processed according to the Chinese National Ambient Air Quality Standard (GB3095-2012 [36]), and the specific steps were as follows: (1) the abnormal concentration values of PM2.5 hourly average concentrations less than 0 and greater than 1000 μg/m3 were excluded; (2) among the missing data, the concentration for one hour is replaced by the average values of the two adjacent hours before and after; for data missing 2–4 h in a row, the missing values are supplemented by equidistant interpolation; and (3) any hourly concentrations missing for more than 4 h in a row are rejected, and the daily average PM2.5 concentrations for that day are considered invalid. Finally, we used the method of Kriging interpolation to estimate the PM2.5 distribution based on the pollutant data from 70 representative urban monitoring stations in this study [37].
Considering the different meteorological conditions and levels of urbanization at the 70 sites, we classify the sites. The 70 representative urban monitoring stations can be segmented into three climatic zones: the North Jiangsu Plain (green circle), the North Zhejiang Plain (red circle), and the Jiangnan area (blue circle, [38]. According to the standards of city size, the cities in the Yangtze River Delta can be divided into five categories: mega-cities (red triangle, population >10 million), supercities (yellow square, population: 5–10 million), type I mega-cities (green circle, population: 3–5 million), type II mega-cities (blue triangle, population: 1–3 million), and medium-sized cities (rose red square, population: 0.5–1 million).

2.3. The 2D and 3D Building Morphology

Acquiring building data is crucial for describing 2D and 3D urban building structures. We used a web scraper to obtain the building data for cities in the Yangtze River Delta urban agglomeration from Baidu Maps. This method has been used by researchers to quickly obtain information on the location, footprint, and height of buildings and to conduct city-scale and neighborhood-scale studies [39,40].
In certain areas, the building attribute information may not be available on Baidu Maps. To address this issue, we utilized high-resolution imagery from Google Maps to outline the absent buildings and used a comparative analysis of building shadows against known building heights to estimate the missing buildings’ heights. Furthermore, we cross-referenced the data with Baidu Street View maps to ensure precision. Ultimately, we obtained data for approximately 695,500 buildings. Following the addition of the missing data, random sampling was used to assess the accuracy, yielding overall accuracy values exceeding 90% for both building footprints and heights in each city. Throughout this study, it was assumed that there were no significant alterations to the 2D and 3D structures of the city’s buildings within a year.
In this study, the construction is categorized into four types: low-level (floors < 3), multi-level (floors 4–6), middle-level (floors 7–9), and high-level (floors > 10). Using ArcGIS software 10.3, we created buffer zones with radii of 100, 300, 500, 1000, 2000, 3000, 4000, and 5000 m at the center of each monitoring station and then extracted the building data in each buffer zone [13]. In this study, we chose eight landscape indices as 2D morphological building morphology indicators. The definitions and formulas of the 2D morphology indicators we selected are presented in Table 1. The definition of building patches is the area covered by buildings. The criteria for selecting building patches refer to spaces where people can live, work, study, entertain, store items, or carry out other activities. These indices reflected the area, shape, and aggregation characteristics of urban buildings.
Several studies have demonstrated that urban form in 3D building morphology has a significant influence on air quality [41,42,43]. Therefore, we chose six 3D morphological indicators: average building height (AH), building height density (BHD), building volume density (BVD), highest building index (HBI), building otherness (BO), and building height range (BHR). These indices represent the height and volume characteristics of the building. Table 2 presents the 3D building morphology indicators along with their definitions and formulas. A standard floor height of 3 m was adopted for calculating the 3D indices [44].

2.4. Statistical Analysis

At first, all variables were tested for normality using SPSS software 27.0.1, and eventually, PM2.5 concentrations were found to conform to a normal distribution. The purpose of the correlation analysis in this study was to preliminarily screen out the variables with a high degree of correlation with PM2.5 so as to facilitate the subsequent multivariate regression analysis and then screen out the optimal model. Secondly, we conducted a bivariate correlation analysis to estimate the selected indicators and PM2.5 concentrations. For variables that followed a normal distribution, we computed Pearson correlation coefficients. Meanwhile, for variables that did not adhere to a normal distribution, we calculated Spearman correlation coefficients. This helped us identify the factors in each category with the highest correlation with PM2.5 concentrations.
Next, we treated city size and climate zoning as a random factor (mixed-effect models). Then, we chose the best subset of predictor variables by all-subsets regression based on the corrected Akaike information criterion (AICc). In our analysis, we aimed to mitigate overfitting by conducting a covariance test. Those variables with variance inflation factor (VIF) values exceeding 5 were excluded to minimize the influence on the prediction model’s accuracy. Subsequently, after obtaining the AICc values for each model, we ranked them based on AICc. Then, we computed ΔAICc by subtracting the AICc value of each model from the smallest AICc value. ΔAICc reflects the absolute difference in model results according to the AIC value. If the ΔAICc of the model is smaller than 2, then we clarify them to be the optimal solutions with the same goodness of fit. For these models, the final models can be derived by applying model averaging [45].
The proportion of each variable’s contribution (e.g., R2) to the model reflects its relative importance [46]. Therefore, we used a variance partitioning analysis to explore the effect of 3D morphology on the accumulation of pollutants. There are two types of R2 for the mixed linear model: marginal R2, which is explained by fixed effects, and conditional R2, which is explained by both fixed effects and random effects. In our study, meteorological conditions and city size were used as random factors and 2D and 3D indicators of buildings were used as fixed factors. Variance partitioning analysis allows the R2 decomposition of the fixed effects in the mixed linear model to calculate the individual contribution of each explanatory variable.
In this study, we used the R software 4.0.5 to carry out the statistical analyses. All-subsets regression was implemented using the “MuMIn” package, and variance partitioning was implemented using the “glmm.hp” packages.

3. Results

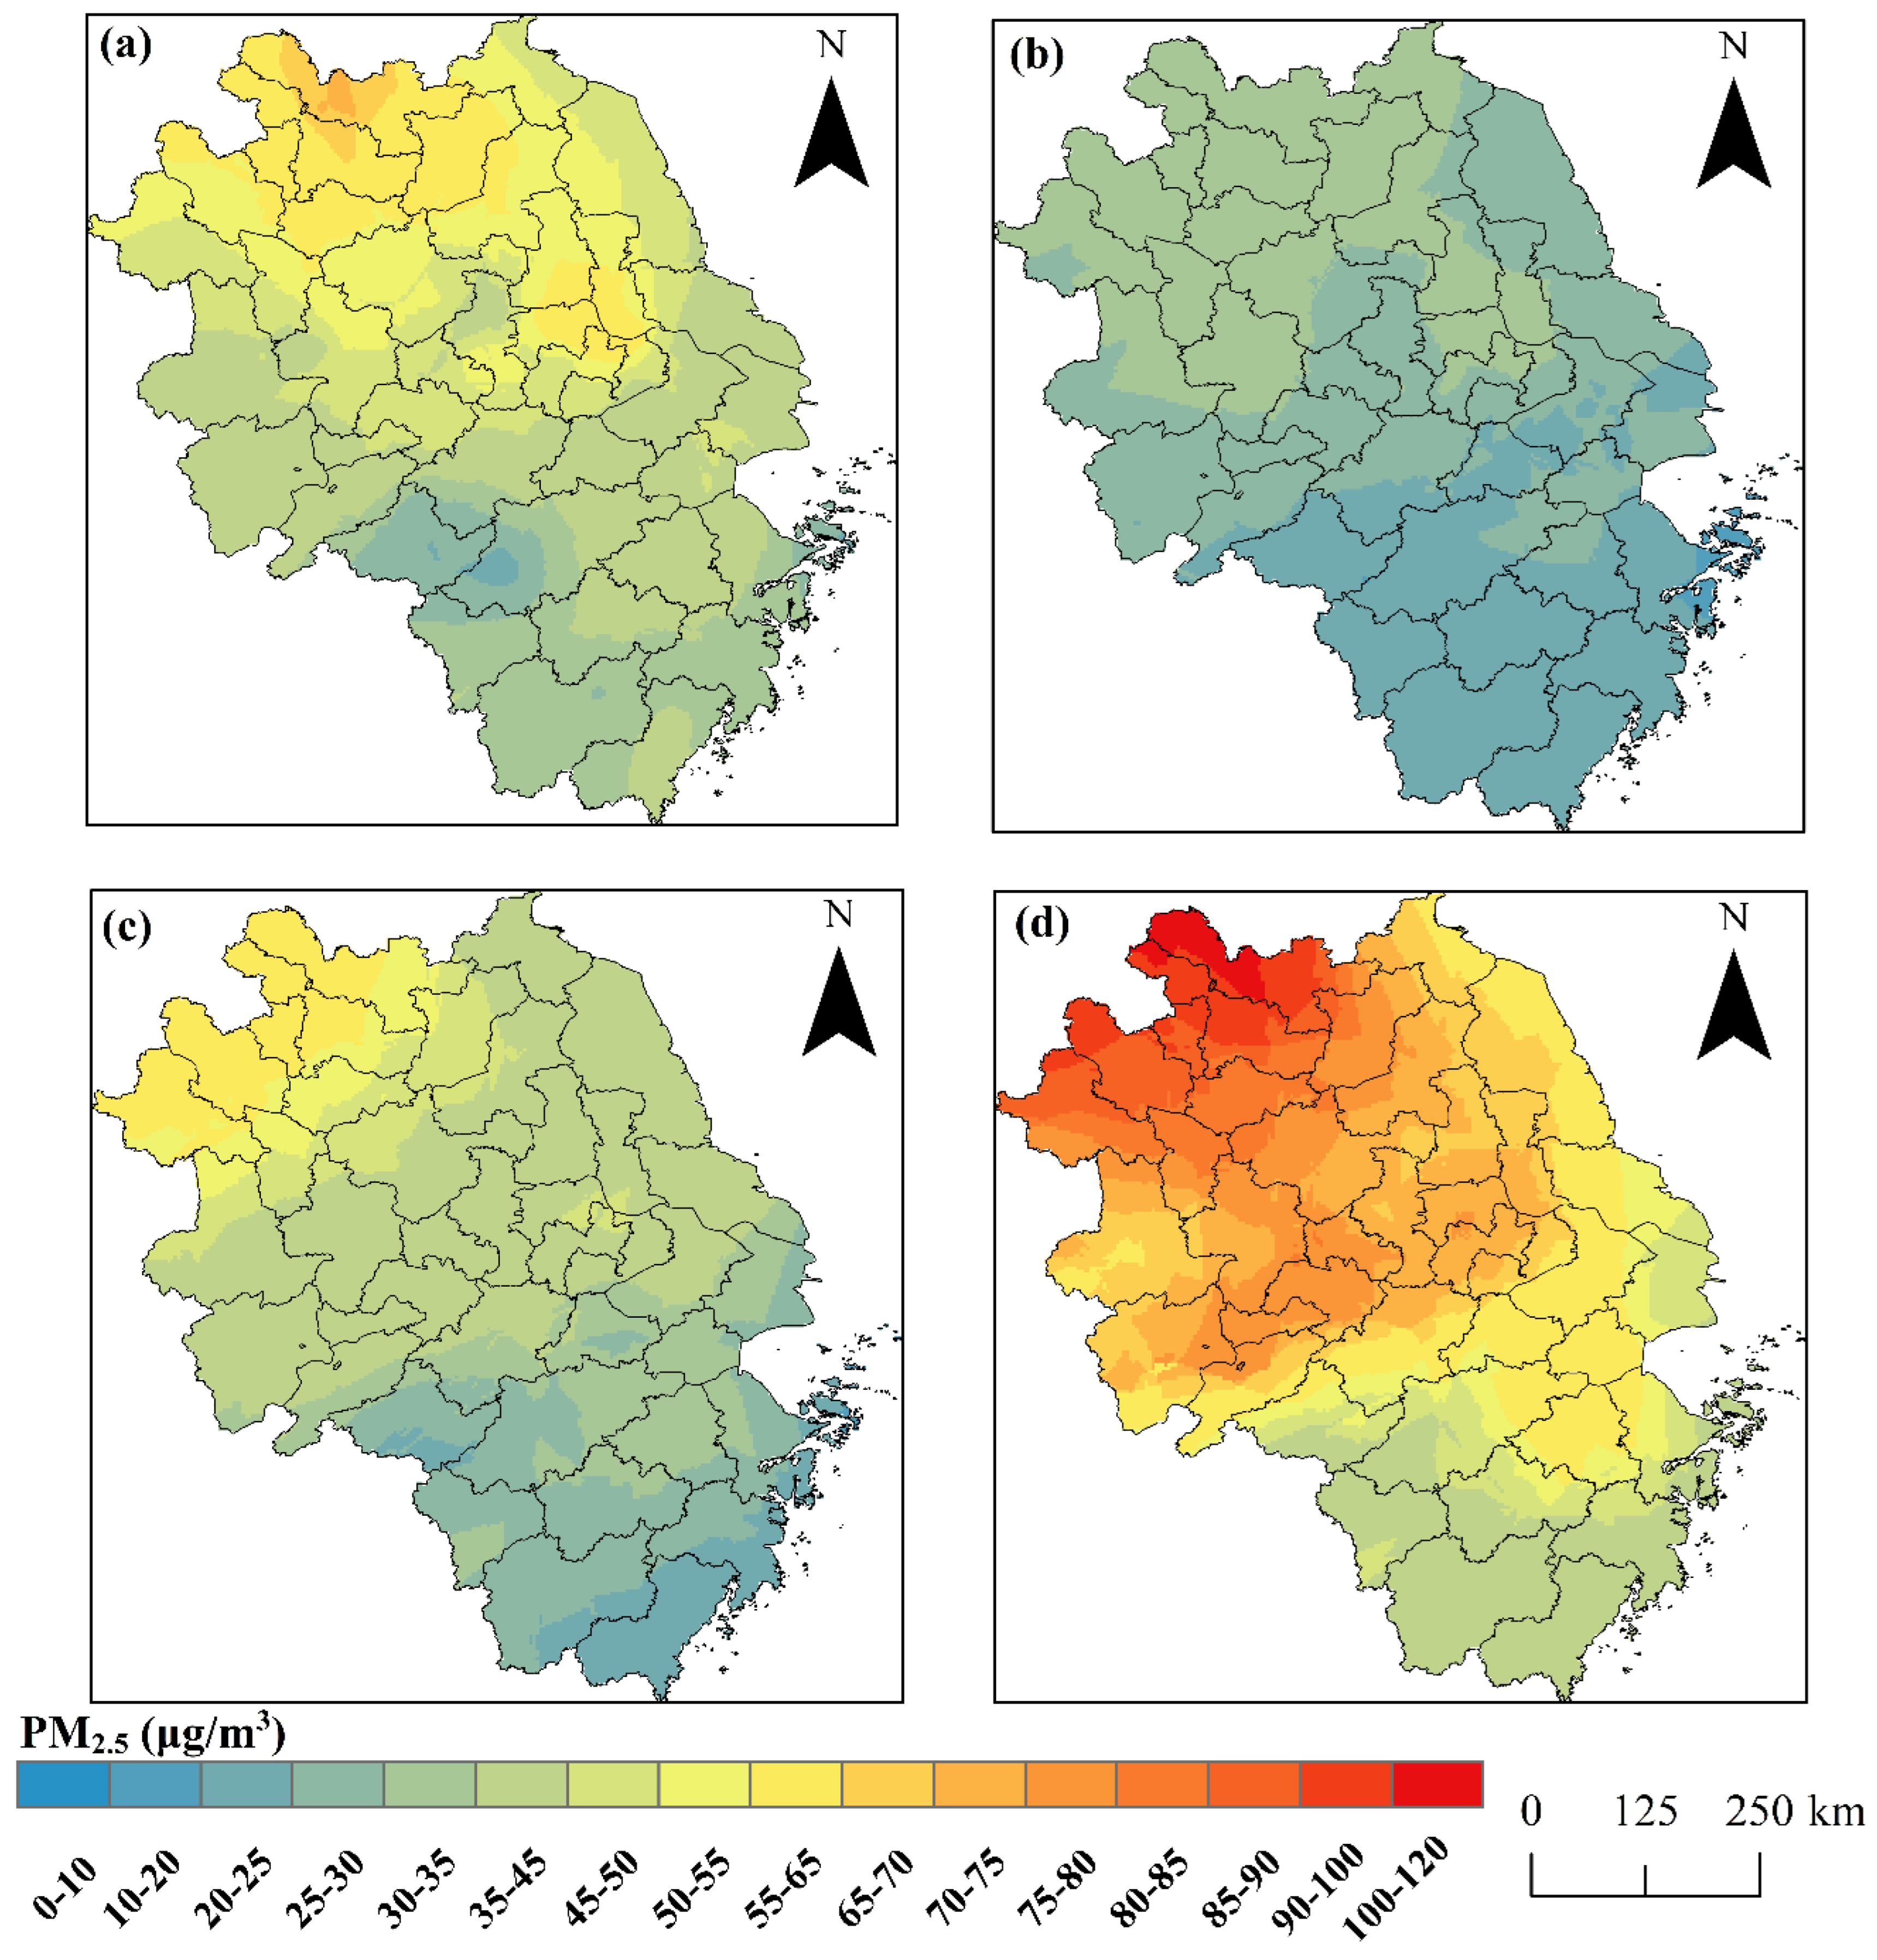
3.1. The Spatial Characteristics of PM2.5 Concentrations and Building Structures

The annual average concentration of PM2.5 based on 70 monitoring sites is 43.4 ± 8.3 μg/m3, which was higher than the regulatory limit of ambient air quality (35 μg/m3). There was significant seasonal variation, with the highest PM2.5 concentration in winter (64.4 ± 15.7 μg/m3) followed by a decrease in spring (45.1 ± 8.1 μg/m3), autumn (37.4 ± 8.4 μg/m3), and summer (27.2 ± 4.0 μg/m3). The interpolation results for different seasons are shown in Figure 2. Overall, the strong regional disparities in particulate matter concentrations were noted within the urban agglomeration. The spatial analysis revealed elevated concentrations in the northern region and comparatively lower concentrations in the south. The PM2.5 concentrations in the northwest of the study area were higher than in other regions all year round, and the pollution was most severe in winter. Furthermore, PM2.5 pollution in the northwest of the study area spread to the central region, resulting in regional pollution. In contrast, PM2.5 concentrations in the southeast were low all year round.
Some of the 2D and 3D indices for different cities within 5000 m are shown in Table 3. In general, the building coverage ranged from 11.26% to 19.58%. Cities in the southeastern part of the study area, such as Shanghai and Suzhou, were more developed and thus had higher building coverages of 19.58% and 18.78%, respectively. Xuzhou, located in the northwest, was dominated by buildings with smaller areas, and the higher patch density indicated that Xuzhou has a high number of buildings with a dense distribution.
Regarding the 3D structure of buildings, developed cities have higher building heights, as Shanghai has the highest average building height (17.36 m), and the building height variation reaches 228.38 m. The average building heights in the relatively slow-growing cities, such as Xuzhou and Nantong, were 8.74 m and 9.88 m, respectively, indicating the lower building heights in medium-level urban agglomerations and that the buildings are mainly low-rise buildings.

3.2. The Impact of 2D and 3D Building Characteristics on PM2.5 Concentrations

Tables S1–S5 show the correlation coefficients between the 2D/3D building morphology indicators and PM2.5 concentrations in 2018 and different seasons, respectively. The final regression model for fine-mode particulate matter with 2D and 3D landscape indicators is shown in Table 4. Most of the independent variables were significantly correlated with PM2.5 concentrations within small buffers. In addition, the results of the regression analysis between fine-mode particulate matter and 2D and 3D landscapes annually and in different seasons are shown in Tables S9 and S10, respectively. The relative importance of 2D and 3D landscape structures to fine-mode particulate matter both exhibit strong seasonality.
The final regression model for PM2.5 concentrations with 2D and 3D building morphology is shown in Table 4. The final model contained four to five predictor variables with VIF values less than five for all variables, indicating low multicollinearity among predictor variables. The model for annual PM2.5 concentrations revealed the negative correlation between PM2.5 concentrations and CONTAG, suggesting that lower concentrations of fine-mode particulate matter existed with taller urban building clustering. For the 3D landscape, PM2.5 concentrations were negatively correlated with BHR, indicating the presence of lower PM2.5 concentrations in patches with greater variation in building height. In addition, PM2.5 pollution could hold a positive reaction to the highest building index within 100 m. The regression models for PM2.5 concentrations in small and large cities are shown in Table S11. A significant increase in Rc2 was observed both in small and large cities, and the conditional R2 in large cities (Rc2 = 0.64) was higher than that in small cities (Rc2 = 0.47).
The variables included in the model were relatively consistent across seasons. The MPS, CONTAG, BHR, and HBI were the most frequent variables in the model. Among them, PM2.5 levels generally showed a negative correlation with CONTAG within 1000 m, but in summer, PM2.5 concentrations responded more strongly to CONTAG within 3000 m. Similarly, the negative correlation between PM2.5 pollution and BHR was also observed within 100 m in autumn, but this spatial range increased to 3000 m in summer. In addition, the negative correlation between BHD and fine-mode particulate matter suggests the presence of lower concentrations of pollutants with higher building heights.

3.3. The Relative Contribution of Building Morphology on PM2.5 Concentrations

We used variance partition analysis (VPA) to evaluate the relative contribution of 2D and 3D morphological indices of buildings to PM2.5 concentrations at different time periods. Figure 3 shows the contribution of 2D and 3D building morphology to fine-mode particulate matter. The total contribution of 2D and 3D building morphology to variations in concentration was 0.24 on average, with slightly different total explanations for the different seasonal models (Figure 3). Overall, the 3D indicators contributed more to PM2.5 concentrations, demonstrating the importance of 3D building morphology on air pollution.
The relative contribution of landscape morphology variables to PM2.5 concentration differed more significantly across seasons. The contribution of 2D landscapes to PM2.5 pollution (23%) was greater than that of 3D landscapes (8%) in the spring. In summer, autumn, and winter, the contribution of 3D landscapes to PM2.5 concentrations was greater than that of 2D landscapes, and with the highest relative contribution of 3D landscapes of 8% in summer. In terms of indicators, BHR explained the most variation in PM2.5 concentrations in summer, while HBI explained the most variation in PM2.5 concentrations in winter, with little difference in summer and autumn.

4. Discussion

4.1. The Relationship between PM2.5 Concentrations and Urban 2D/3D Morphology

Accelerated urban expansion can directly affect PM2.5 concentrations through higher emissions from industry, traffic, and residential activities [29,40]. Thus, the cities in the Yangtze River Delta were divided into large cities (>3 million) and small and medium-sized cities (<3 million) based on the standards of city size. Based on the findings, it was evident that the shape and structure of landscapes significantly impacted the levels of PM2.5 in major urban centers more than in smaller and medium-sized cities. This phenomenon was attributed to the heightened emissions linked to the expansion of urban areas (Table S11). The rise in concentration of particulate matter is likely caused by the increased commute time and distance in small cities. Additionally, the expansion of urban areas can worsen the urban heat island effect, leading to higher urban temperatures. This, coupled with urban–rural wind circulation patterns, can cause the accumulation of air pollutants above the city, further exacerbating air pollution. Thus, we set the city size and climate zone as random factors to eliminate their influence to a certain extent, considering the influence of city size and meteorology conditions on PM2.5 pollution, and then the conditional R2 could be derived from the multiple linear regression model. A significant increase in R2 was observed annually and across all seasons, especially in autumn, where R2 ranged from 0.21 to 0.70, indicating that the urban 2D and 3D morphology had a strong influence on the change in particulate matter in the urban agglomeration. The dominant 2D and 3D shape factors in the Yangtze River Delta were urban shape (MSI), contagion index (CONTAG), and building height range (BHR). Our analysis using regression modeling revealed a significant negative relationship between BHR and PM2.5 concentrations. This finding aligns with existing research, demonstrating that greater discrepancies in building height can indirectly alleviate air pollution [47]. The height of buildings will change the atmospheric circulation conditions within the city. If the buildings within the urban agglomeration are planned and distributed in a staggered manner, the wind speed of buildings along the wind direction would also increase notably while enhancing the diffusion conditions and thus improving the air quality of urban agglomerations. The BHR reflects the vertical layout of the building, and increased BHR means that more solar energy is absorbed, which then increases the urban temperature [46,48]. Thus, the larger building height range is beneficial to reduce air pollution by enhancing turbulence and convection within the boundary layer. However, the uniform building heights trap heat within the densely built areas and adversely affect ventilation [49]. The building shade can improve the thermal environment in some areas, leading to an increase in the temperature difference, especially in summer when solar radiation is intense. Moreover, when buildings are constructed with increased height, they contribute to intervalley warming. This can result in a temperature difference between the building’s surface and the ground, which in turn facilitates the movement of air vertically and horizontally. As a result, this airflow helps to reduce concentrations of pollutants [47]. In general, the 3D building morphology significantly affects the dissipation of particulate matter. Due to the limited availability of urban land, urban planning should pay special regard to the optimization of the 3D landscape of buildings to maximize the effect of buildings on microclimate and air quality improvement.
CONTAG showed a negative correlation with fine-mode particulate matter, suggesting that more compact buildings could help get rid of air pollutants in the urban agglomeration. It is probable that the presence of dispersed urban developments contributes to extended travel distances, limited access to public transportation, and escalated reliance on private vehicles, ultimately leading to higher transportation emissions. At the neighborhood scale, a dispersed urban form could lead to more significant traffic pollution. In addition, residents in suburban areas prefer larger homes, resulting in higher concentrations of secondary organic species by catering. On the contrary, the compact urban form can contribute to the potential traffic demand and so as to reduce vehicle emissions [50]. Our results are consistent with most previous papers, but some research also presents different perspectives. The compact urban form can also create a canyon effect within the buildings in a staggered manner, leading to the trapping and buildup of particulate matter. While dense buildings can effectively reduce transportation emissions by shortening commuting distances and improving the accessibility to public transportation, at the same time, they may also cause the capture of particulate matter. Li and Zhou claimed that The air quality in smaller, decentralized, and polycentric cities is superior to that of more compact and larger cities [51]. The primary advantage of a polycentric urban form is its ability to encourage the availability of public transportation, as well as accelerate the deposition and diffusion of fine-mode particulate matter. Furthermore, the PM2.5 concentrations also showed a stronger negative correlation with MSI, indicating that the unique form of the terrain played a crucial role in reducing air pollution. This is likely because more spatially dispersed and fragmented cities potentially increase the mixing of urban and forest lands at the urban scale [11]. The presence of vegetation helps to enhance the purification of air pollutants and optimize the microclimate in stagged buildings, thereby facilitating the rapid removal of fine-mode particulate matter and ultimately reducing air pollution. Hence, the centralized urban form with high urban irregularity, large building height range, and a balanced arrangement of green spaces is more conducive to the diffusion and elimination of pollutants.
Although urban contagion, patch shape, and building height index were negatively related to concentrations of fine-mode particulate matter all year round, the dimension of the correlation varied fairly in the Yangtze River Delta. The correlation between levels of pollutants and urban morphology was strongest in autumn, followed by summer, but that was weakest in the winter. Moreover, the response of fine-mode particulate matter to 2D and 3D building landscapes was generally consistent across seasons, but the dominant factors were different. The 2D landscape contributed more to concentrations of fine-mode particulate matter than the 3D building morphology in spring. The PSSD showed a positive correlation with fine-mode particulate matter in the spring. At a small scale (100 m buffer) with a larger PSSD, there are buildings with more variable footprints; larger buildings tend to accommodate a larger population. Increased human activity results in more energy consumption, leading to more pollutant emissions [52]. Buildings with higher average heights create larger shadows, thus reducing the latent heat exchange of the ground [53]. Additionally, air convection would be enhanced by high-level buildings with increased urban surface roughness [25]. This may be due to the improved thermal environment and enhanced air convection, allowing better dispersion of air pollutants.
However, the urban 3D indicators had a greater effect on PM2.5 concentrations in the other three seasons than that in spring. Specifically, the following three metrics, CONTAG, BHR, and HBI, were the most important factors in the prediction of PM2.5 concentrations in the Yangtze River Delta. In summer, the BHR and CONTAG showed a negative relationship with PM2.5 concentrations. Simultaneously, HBI was positively correlated with PM2.5 concentrations, with a larger buffer zone (500 m) than other seasons (100 m), which could be caused by the lower pollutant emissions and better meteorology conditions in summer. Generally, the more high-rise buildings in a small radius, the greater the pollutant emissions from human activities. In addition, compact high-rise buildings block the wind and reduce the ventilation rate of the city, thus allowing the accumulation of air pollutants [54].
In winter, the MSI5000 was negatively correlated with fine-mode particulate matter, indicating that building forms with messy shapes are beneficial for reducing air pollutants. A negative correlation between PM2.5 concentrations and urban shape complexity was investigated due to the reduction in vegetation coverage [55]. Complex building shapes could improve airflow near the ground, promoting PM2.5 concentration dispersion. In areas with complex building shapes, the buildings might be spaced out more, allowing for better ventilation and more sunlight. However, Gao et al. showed a positive effect of complex urban shapes on fine-mode particulate matter, which is likely because intricate road planning contributes to longer commuting distances and an increased likelihood of transportation congestion compared to simpler road planning. Consequently, this could result in higher pollution emissions. Therefore, a single-shaped urban form is not conducive to PM2.5 concentration dispersion, and a polycentric urban structure is more beneficial for sustainable urban development.

4.2. Relative Importance of Urban 2D/3D Morphology on PM2.5 Concentrations

This research aimed to compare the importance of the architectural structure of buildings in 2D and 3D landscapes. The relationship of fine-mode particulate matter showed seasonal variation with both urban 2D and 3D morphology of buildings. The 2D morphology metrics contributed most to the pollutant accumulation in spring, while the 3D morphology metrics contributed most in the other three seasons, especially in summer in the Yangtze River Delta. It is worth noting that the 2D morphology of buildings explained very little concentrations of fine-mode particulate matter in summer, indicating that PM2.5 concentrations were likely regulated by different factors in this season. PM2.5 concentrations showed the strongest response to the 3D urban form in summer. This is likely because the relatively lower emission and light pollution in summer lead to the decrease in PM2.5 concentrations due to the 3D building morphology, such as the building height range (BHR) and the highest building index (HBI) tend to be more apparent. Light pollution can negatively affect the environment in particular ways. It interacts with the air itself, changing its chemistry, which can increase PM2.5 emissions and then reduce air quality. Specifically, artificial light at night can alter the aerosol chemical composition, such as the nitrate radical (NO3) content, which reacts with volatile organic materials that would otherwise become ozone molecules and smog, enhancing the formation of secondary pollutants [33,56,57]. In addition, light pollution can affect local microclimates by raising temperatures and affecting humidity levels, which can influence the dispersion of PM2.5 pollution. Furthermore, the building morphology is strongly related to the air convection and turbulence conditions and the ventilation of the city [58]. It could be the reason for the more robust variation in fine-mode particulate matter with urban structure in the summer.
Moreover, we observed the contribution of HBI to the change in concentrations of fine-mode particulate matter is highest in winter, with little difference in other seasons. This suggests a minor impact of 2D urban form on pollution removal, and the meteorological effect on PM2.5 concentration is quite different between winter and other seasons. It is well known that meteorological conditions affect the accumulation and dispersion of air pollutants [59,60]. The monsoon climates play an important role in the Yangtze River Delta region, and thus, humid sea breeze and dry land breeze dominate in the summer and winter, respectively. This could comprehensively lead to strong convective activities in the boundary layer, which facilitates the dispersion of air pollutants and promotes air transport in urban areas in summer and winter [61]. Meanwhile, the precipitation would be enhanced due to the sufficient water vapor provided by the monsoon, which then favors the deposition of particulate matter in summer [62]. Consequently, the larger the building height range, the more conducive to air circulation, which helps to remove pollutants. On the other hand, the greater the temperature difference between the ground and the building surface, the more favorable it is for the development of the boundary layer, which leads to the formation of rainfall. Furthermore, our results showed that the PM2.5 concentrations are mainly affected by the 2D morphology, while HBI has no contribution to it in spring. Air pollution holds the strongest correlation with 2D urban morphology in spring [10,28,57]. We speculate that the meteorology condition is similar in spring and winter, and this may be caused by the higher vegetation coverage in spring compared to autumn and winter.
Previous research has highlighted the importance of increasing vegetation cover to improve its ability to absorb fine-mode particulate matter and decrease pollution levels. Furthermore, it is recommended that urban planning prioritize the integration of green spaces alongside construction lands to effectively get rid of air pollutants [28,63]. Thus, the urban planning department should focus on the urban form characterized by a larger building height range, lower fragmentation, and higher vegetation coverage in the Yangtze River Delta.

4.3. Limitations

Although we have revealed the relationship between urban 2D/3D morphology and PM2.5 concentrations in this study, there are some limitations. Firstly, many important variables were not taken into account in this study due to the inability to match the spatial resolution of the data, mainly including meteorological conditions, socioeconomic status, land use, and landscape morphological indicators. These variables can be obtained from the government statistical yearbook (gross domestic product, GDP), the land use dataset (http://data.ess.tsinghua.edu.cn/, accessed on 25 March 2024), and the Shuttle Radar Topography Mission, respectively. For instance, meteorological conditions affect the formation, transportation, and dispersion of fine-mode particulate matter [59,60]. Additionally, the landscape metrics and the socioeconomic status of the city impact the type and level of pollution. Land use plays an important role in influencing air pollution, and the mixed use of green spaces and construction lands was suggested to lighten pollution [28]. Thus, failure to consider these control variables in the model would cause certain uncertainty in the results. It could effectively improve the model’s prediction accuracy to incorporate more influence variables in future studies. Secondly, the relationship between urban form and PM2.5 concentrations is related to the size of the city [29,64]. The pollutant data used in this study were obtained from fixed monitoring stations, which cannot represent the pollutant levels of the whole urban area. Therefore, PM2.5 concentration data with higher precision and broader coverage are needed to conduct similar studies in cities of different sizes compared to our findings. Finally, there could be a nonlinear relationship between fine-mode particulate matter and urban morphology [65]. Linear regression is challenging for gaining insight into the relationship between fine-mode particulate matter and building morphology, which requires machine learning, a technique for solving multi-dimensional and complex nonlinear relationships, for further research. Thus, this study serves as a preliminary exploration to demonstrate the potential of this technique.

5. Conclusions

In a comprehensive investigation into the connection between urban morphology and PM2.5 concentrations, we aimed to enhance our comprehension of the behavior of PM2.5 concentrations. Our exploration delved into the interplay of air pollution with urban 2D and 3D morphology using mixed-effects models and variance partition analysis in the Yangtze River Delta. However, many important variables (e.g., meteorological conditions, socioeconomic status, land use, and landscape morphological indicators) were not controlled in this study. The findings indicated that 2D indicators (23%) contributed more to PM2.5 concentrations than 3D indicators (8%) in the spring, indicating the importance of 2D building morphology on PM2.5 pollution. However, 3D building morphology played a moderating role in PM2.5 concentrations, especially during the summer, where they accounted for 20% compared to 7% for 2D forms and explained the highest variations in PM2.5 concentrations. Notably, CONTAG, BHR, and HBI emerged as the most influential predictors of PM2.5 concentrations. Specifically, the BHR showed a great negative correlation with pollution levels and contributed up to 12% in summer, indicating the presence of lower PM2.5 concentrations in areas with greater variation in building height. Similar to previous studies, these results revealed that the building morphology, including compactness, building height, and height difference, plays an important role in fine-mode particulate matter by influencing transportation emissions, thermal environments, and residential activities [30,58]. The compact urban form can contribute to the potential traffic demand and so as to reduce vehicle emissions. However, dense buildings could cause an urban canyon effect, and these issues are of less importance when the building morphology is taller buildings with more variability in height, which helps disperse pollution. Overall, a more compact urban form combined with taller buildings and a greater variance in building heights appeared to be favored to foster better dispersion of air pollutants. Thus, our study provides some new insights for evaluating the impact of building morphology on PM2.5 concentrations, with potential applications in managing urban air pollution through the lens of 3D urban morphology in the Yangtze River Delta.

Supplementary Materials

The following supporting information can be downloaded at https://www.mdpi.com/article/10.3390/su16177360/s1, Table S1: The correlation coefficients between the 2D/3D building morphology indicators and PM2.5 concentrations in 2018.; Table S2: The correlation coefficients between the 2D/3D building morphology indicators and PM2.5 concentrations in spring; Table S3: The correlation coefficients between the 2D/3D building morphology indicators and PM2.5 concentrations in summer; Table S4: The correlation coefficients between the 2D/3D building morphology indicators and PM2.5 concentrations in autumn; Table S5: The correlation coefficients between the 2D/3D building morphology indicators and PM2.5 concentrations in winter; Table S6: Descriptive statistics of 2D building indicators; Table S7: Descriptive statistics of 3D building indicators; Table S8: The 2D and 3D indicators within 5000 m in different cities; Table S9: The results of regression analysis of PM2.5 concentrations and two-dimensional landscape; Table S10: The results of regression analysis of PM2.5 concentrations and three-dimensional landscape; Table S11: The regression model for PM2.5 concentrations in small and large cities.

Author Contributions

Methodology, W.Z. and X.J. (Xinjie Jin); Validation, W.Z., D.D. and W.H.; Formal analysis, J.Z.; Writing—original draft, J.Z. and Z.H.; Writing—review & editing, Y.R., X.J. (Xiaoai Jin) and T.Z.; Project administration, J.C.; Funding acquisition, J.C. All authors have read and agreed to the published version of the manuscript.

Funding

This research received funding from the National Natural Science Foundation of China (41471442).

Institutional Review Board Statement

Not applicable.

Informed Consent Statement

Not applicable.

Data Availability Statement

Data are contained within the article, further inquiries can be directed to the corresponding authors.

Conflicts of Interest

The authors declare that they have no known competing financial interests or personal relationships that could have appeared to influence the work reported in this paper.

References

  1. Wang, J.; Hu, Z.; Chen, Y.; Chen, Z.; Xu, S. Contamination characteristics and possible sources of PM10 and PM2.5 in different functional areas of Shanghai, China. Atmos. Environ. 2013, 68, 221–229. [Google Scholar] [CrossRef]
  2. Yang, H.; Chen, W.; Liang, Z. Impact of Land Use on PM2.5 Pollution in a Representative City of Middle China. Int. J. Environ. Res. Public Health 2017, 14, 462. [Google Scholar] [CrossRef] [PubMed]
  3. Huang, R.J.; Zhang, Y.; Bozzetti, C.; Ho, K.F.; Cao, J.J.; Han, Y.; Daellenbach, K.R.; Slowik, J.G.; Platt, S.M.; Canonaco, F.; et al. High secondary aerosol contribution to particulate pollution during haze events in China. Nature 2014, 514, 218–222. [Google Scholar] [CrossRef]
  4. Jin, L.; Berman, J.D.; Warren, J.L.; Levy, J.I.; Thurston, G.; Zhang, Y.; Xu, X.; Wang, S.; Zhang, Y.; Bell, M.L. A land use regression model of nitrogen dioxide and fine particulate matter in a complex urban core in Lanzhou, China. Environ. Res. 2019, 177, 108597. [Google Scholar] [CrossRef]
  5. Xia, S.; Liu, X.; Liu, Q.; Zhou, Y.; Yang, Y. Heterogeneity and the determinants of PM2.5 in the Yangtze River Economic Belt. Sci. Rep. 2022, 12, 4189. [Google Scholar] [CrossRef]
  6. Yuan, C.; Ng, E.; Norford, L.K. Improving air quality in high-density cities by understanding the relationship between air pollutant dispersion and urban morphologies. Build. Environ. 2014, 71, 245–258. [Google Scholar] [CrossRef] [PubMed]
  7. Wu, T.; Zhou, L.; Jiang, G.; Meadows, M.E.; Zhang, J.; Pu, L.; Wu, C.; Xie, X. Modelling Spatial Heterogeneity in the Effects of Natural and Socioeconomic Factors, and Their Interactions, on Atmospheric PM2.5 Concentrations in China from 2000–2015. Remote Sens. 2021, 13, 2152. [Google Scholar] [CrossRef]
  8. Zhang, D.; Zhou, C.; He, B.-J. Spatial and temporal heterogeneity of urban land area and PM2.5 concentration in China. Urban Clim. 2022, 45, 101268. [Google Scholar] [CrossRef]
  9. Miao, C.; Yu, S.; Hu, Y.; Bu, R.; Qi, L.; He, X.; Chen, W. How the morphology of urban street canyons affects suspended particulate matter concentration at the pedestrian level: An in-situ investigation. Sustain. Cities Soc. 2020, 55, 102042. [Google Scholar] [CrossRef]
  10. Jin, X.; Li, Z.; Wu, T.; Wang, Y.; Su, T.; Ren, R.; Wu, H.; Zhang, D.; Li, S.; Cribb, M. Differentiating the contributions of particle concentration, humidity, and hygroscopicity to aerosol light scattering at three sites in China. J. Geophys. Res. Atmos. 2022, 127, e2022JD036891. [Google Scholar] [CrossRef]
  11. McCarty, J.; Kaza, N. Urban form and air quality in the United States. Landsc. Urban Plan. 2015, 139, 168–179. [Google Scholar] [CrossRef]
  12. Lu, C.; Liu, Y. Effects of China’s urban form on urban air quality. Urban Stud. 2016, 53, 2607–2623. [Google Scholar] [CrossRef]
  13. Han, L.; Zhao, J.; Gao, Y.; Gu, Z.; Xin, K.; Zhang, J. Spatial distribution characteristics of PM2.5 and PM10 in Xi’an City predicted by land use regression models. Sustain. Cities Soc. 2020, 61, 102329. [Google Scholar] [CrossRef]
  14. Räsänen, J.V.; Holopainen, T.; Joutsensaari, J.; Ndam, C.; Pasanen, P.; Rinnan, Å.; Kivimäenpää, M. Effects of species-specific leaf characteristics and reduced water availability on fine particle capture efficiency of trees. Environ. Pollut. 2013, 183, 64–70. [Google Scholar] [CrossRef] [PubMed]
  15. Beckett, K.P.; Freer-Smith, P.H.; Taylor, G. Urban woodlands: Their role in reducing the effects of particulate pollution. Environ. Pollut. 1998, 99, 347–360. [Google Scholar] [CrossRef]
  16. Xin, K.; Zhao, J.; Ma, X.; Han, L.; Liu, Y.; Zhang, J.; Gao, Y. Effect of urban underlying surface on PM2.5 vertical distribution based on UAV in Xi’an, China. Environ. Monit. Assess. 2021, 193, 312. [Google Scholar] [CrossRef] [PubMed]
  17. Fan, C.; Tian, L.; Zhou, L.; Hou, D.; Song, Y.; Qiao, X.; Li, J. Examining the impacts of urban form on air pollutant emissions: Evidence from China. J. Environ. Manag. 2018, 212, 405–414. [Google Scholar] [CrossRef]
  18. Yang, S.; Wu, H.; Chen, J.; Lin, X.; Lu, T. Optimization of PM2.5 Estimation Using Landscape Pattern Information and Land Use Regression Model in Zhejiang, China. Atmosphere 2018, 9, 47. [Google Scholar] [CrossRef]
  19. Lee, C. Impacts of multi-scale urban form on PM2.5 concentrations using continuous surface estimates with high-resolution in U.S. metropolitan areas. Landsc. Urban Plan. 2020, 204, 103935. [Google Scholar] [CrossRef]
  20. Uuemaa, E.; Mander, Ü.; Marja, R. Trends in the use of landscape spatial metrics as landscape indicators: A review. Ecol. Indic. 2013, 28, 100–106. [Google Scholar] [CrossRef]
  21. White, R.; Uljee, I.; Engelen, G. Integrated modelling of population, employment and land-use change with a multiple activity-based variable grid cellular automaton. Int. J. Geogr. Inf. Sci. 2012, 26, 1251–1280. [Google Scholar] [CrossRef]
  22. Edussuriya, P.; Chan, A.; Ye, A. Urban morphology and air quality in dense residential environments in Hong Kong. Part I: District-level analysis. Atmos. Environ. 2011, 45, 4789–4803. [Google Scholar] [CrossRef]
  23. Tian, Y.; Zhou, W.; Qian, Y.; Zheng, Z.; Yan, J. The effect of urban 2D and 3D morphology on air temperature in residential neighborhoods. Landsc. Ecol. 2019, 34, 1161–1178. [Google Scholar] [CrossRef]
  24. Tong, S.; Wong, N.H.; Jusuf, S.K.; Tan, C.L.; Wong, H.F.; Ignatius, M.; Tan, E. Study on correlation between air temperature and urban morphology parameters in built environment in northern China. Build. Environ. 2018, 127, 239–249. [Google Scholar] [CrossRef]
  25. Huang, X.; Wang, Y. Investigating the effects of 3D urban morphology on the surface urban heat island effect in urban functional zones by using high-resolution remote sensing data: A case study of Wuhan, Central China. ISPRS J. Photogramm. Remote Sens. 2019, 152, 119–131. [Google Scholar] [CrossRef]
  26. Wang, M.; Xu, H. The impact of building height on urban thermal environment in summer: A case study of Chinese megacities. PLoS ONE 2021, 16, e0247786. [Google Scholar] [CrossRef]
  27. Ke, B.; Hu, W.; Huang, D.; Zhang, J.; Lin, X.; Li, C.; Jin, X.; Chen, J. Three-dimensional building morphology impacts on PM2.5 distribution in urban landscape settings in Zhejiang, China. Sci. Total Environ. 2022, 826, 154094. [Google Scholar] [CrossRef]
  28. Zhang, J.; Chen, J.; Zhu, W.; Ren, Y.; Cui, J.; Jin, X. Impact of urban space on PM2. 5 distribution: A multiscale and seasonal study in the Yangtze River Delta urban agglomeration. J. Environ. Manag. 2024, 363, 121287. [Google Scholar] [CrossRef]
  29. Shi, K.; Wang, H.; Yang, Q.; Wang, L.; Sun, X.; Li, Y. Exploring the relationships between urban forms and fine particulate (PM2.5) concentration in China: A multi-perspective study. J. Clean. Prod. 2019, 231, 990–1004. [Google Scholar] [CrossRef]
  30. Guo, L.; Luo, J.; Yuan, M.; Huang, Y.; Shen, H.; Li, T. The influence of urban planning factors on PM2.5 pollution exposure and implications: A case study in China based on remote sensing, LBS, and GIS data. Sci. Total Environ. 2019, 659, 1585–1596. [Google Scholar] [CrossRef]
  31. Mei, S.-J.; Luo, Z.; Zhao, F.-Y.; Wang, H.-Q. Street canyon ventilation and airborne pollutant dispersion: 2-D versus 3-D CFD simulations. Sustain. Cities Soc. 2019, 50, 101700. [Google Scholar] [CrossRef]
  32. Niu, H.; Wang, B.; Liu, B.; Liu, Y.; Liu, J.; Wang, Z. Numerical simulations of the effect of building configurations and wind direction on fine particulate matters dispersion in a street canyon. Environ. Fluid Mech. 2017, 18, 829–847. [Google Scholar] [CrossRef]
  33. Fan, Y.; Wang, Q.; Yin, S.; Li, Y. Effect of city shape on urban wind patterns and convective heat transfer in calm and stable background conditions. Build. Environ. 2019, 162, 106288. [Google Scholar] [CrossRef]
  34. Wang, J.; Wang, S.; Voorhees, A.S.; Zhao, B.; Jang, C.; Jiang, J.; Fu, J.S.; Ding, D.; Zhu, Y.; Hao, J. Assessment of short-term PM2.5-related mortality due to different emission sources in the Yangtze River Delta, China. Atmos. Environ. 2015, 123, 440–448. [Google Scholar] [CrossRef]
  35. Lu, D.; Mao, W.; Yang, D.; Zhao, J.; Xu, J. Effects of land use and landscape pattern on PM2.5 in Yangtze River Delta, China. Atmos. Pollut. Res. 2018, 9, 705–713. [Google Scholar] [CrossRef]
  36. GB 3095-2012; Ambient Air Quality Standards. Ministry of Environmental Protection: Beijing, China, 2012.
  37. Rivest, M.; Marcotte, D.; Pasquier, P. Sparse data integration for the interpolation of concentration measurements using kriging in natural coordinates. J. Hydrol. 2012, 416–417, 72–82. [Google Scholar] [CrossRef]
  38. Zheng, J.; Yin, Y.; Li, B. A New Scheme for Climate Regionalization in China. Acta Geogr. Sin. 2010, 65, 3–12. [Google Scholar]
  39. Xu, X.; Ou, J.; Liu, P.; Liu, X.; Zhang, H. Investigating the impacts of three-dimensional spatial structures on CO2 emissions at the urban scale. Sci. Total Environ. 2021, 762, 143096. [Google Scholar] [CrossRef]
  40. Wang, Y.; Sheng, S.; Xiao, H. The cooling effect of hybrid land-use patterns and their marginal effects at the neighborhood scale. Urban For. Urban Green. 2021, 59, 127015. [Google Scholar] [CrossRef]
  41. Cao, Q.; Luan, Q.; Liu, Y.; Wang, R. The effects of 2D and 3D building morphology on urban environments: A multi-scale analysis in the Beijing metropolitan region. Build. Environ. 2021, 192, 107635. [Google Scholar] [CrossRef]
  42. Shi, T.; Hu, Y.; Liu, M.; Li, C.; Zhang, C.; Liu, C. Land use regression modelling of PM2.5 spatial variations in different seasons in urban areas. Sci. Total Environ. 2020, 743, 140744. [Google Scholar] [CrossRef] [PubMed]
  43. Liu, M.; Hu, Y.-M.; Li, C.-L. Landscape metrics for three-dimensional urban building pattern recognition. Appl. Geogr. 2017, 87, 66–72. [Google Scholar] [CrossRef]
  44. Sun, F.; Liu, M.; Wang, Y.; Wang, H.; Che, Y. The effects of 3D architectural patterns on the urban surface temperature at a neighborhood scale: Relative contributions and marginal effects. J. Clean. Prod. 2020, 258, 120706. [Google Scholar] [CrossRef]
  45. Burnham, K.; Anderson, D. Model Selection and Multimodel Inference; Springer: New York, NY, USA, 2002. [Google Scholar]
  46. Johnson, J.W.; Lebreton, J.M. History and Use of Relative Importance Indices in Organizational Research. Organ. Res. Methods 2004, 7, 238–257. [Google Scholar] [CrossRef]
  47. Yang, L.; Li, Y. Thermal conditions and ventilation in an ideal city model of Hong Kong. Energy Build. 2011, 43, 1139–1148. [Google Scholar] [CrossRef]
  48. Yang, X.; Li, Y. The impact of building density and building height heterogeneity on average urban albedo and street surface temperature. Build. Environ. 2015, 90, 146–156. [Google Scholar] [CrossRef]
  49. Allegrini, J. A wind tunnel study on three-dimensional buoyant flows in street canyons with different roof shapes and building lengths. Build. Environ. 2018, 143, 71–88. [Google Scholar] [CrossRef]
  50. Loo, B.P.Y.; Chow, A.S.Y. Spatial Restructuring to Facilitate Shorter Commuting. Urban Stud. 2010, 48, 1681–1694. [Google Scholar] [CrossRef]
  51. Li, F.; Zhou, T. Effects of urban form on air quality in China: An analysis based on the spatial autoregressive model. Cities 2019, 89, 130–140. [Google Scholar] [CrossRef]
  52. Perini, K.; Magliocco, A. Effects of vegetation, urban density, building height, and atmospheric conditions on local temperatures and thermal comfort. Urban For. Urban Green. 2014, 13, 495–506. [Google Scholar] [CrossRef]
  53. Karagulian, F.; Belis, C.A.; Dora, C.F.C.; Prüss-Ustün, A.M.; Bonjour, S.; Adair-Rohani, H.; Amann, M. Contributions to cities’ ambient particulate matter (PM): A systematic review of local source contributions at global level. Atmos. Environ. 2015, 120, 475–483. [Google Scholar] [CrossRef]
  54. Peng, L.; Liu, J.-P.; Wang, Y.; Chan, P.-w.; Lee, T.-c.; Peng, F.; Wong, M.-s.; Li, Y. Wind weakening in a dense high-rise city due to over nearly five decades of urbanization. Build. Environ. 2018, 138, 207–220. [Google Scholar] [CrossRef]
  55. She, Q.; Peng, X.; Xu, Q.; Long, L.; Wei, N.; Liu, M.; Jia, W.; Zhou, T.; Han, J.; Xiang, W. Air quality and its response to satellite-derived urban form in the Yangtze River Delta, China. Ecol. Indic. 2017, 75, 297–306. [Google Scholar] [CrossRef]
  56. Park, C.; Ha, J.; Lee, S. Association between Three-Dimensional Built Environment and Urban Air Temperature: Seasonal and Temporal Differences. Sustainability 2017, 9, 1338. [Google Scholar] [CrossRef]
  57. Yan, H.; Wang, K.; Lin, T.; Zhang, G.; Sun, C.; Hu, X.; Ye, H. The Challenge of the Urban Compact Form: Three-Dimensional Index Construction and Urban Land Surface Temperature Impacts. Remote Sens. 2021, 13, 1067. [Google Scholar] [CrossRef]
  58. Gao, G.; Pueppke, S.G.; Tao, Q.; Wei, J.; Ou, W.; Tao, Y. Effect of urban form on PM2.5 concentrations in urban agglomerations of China: Insights from different urbanization levels and seasons. J. Environ. Manag. 2023, 327, 116953. [Google Scholar] [CrossRef]
  59. Li, M.; Wang, L.; Liu, J.; Gao, W.; Song, T.; Sun, Y.; Li, L.; Li, X.; Wang, Y.; Liu, L.; et al. Exploring the regional pollution characteristics and meteorological formation mechanism of PM2.5 in North China during 2013–2017. Environ. Int. 2020, 134, 105283. [Google Scholar] [CrossRef]
  60. Zhang, X.; Xu, X.; Ding, Y.; Liu, Y.; Zhang, H.; Wang, Y.; Zhong, J. The impact of meteorological changes from 2013 to 2017 on PM2.5 mass reduction in key regions in China. Sci. China Earth Sci. 2019, 62, 1885–1902. [Google Scholar] [CrossRef]
  61. Mei, S.-J.; Hu, J.-T.; Liu, D.; Zhao, F.-Y.; Li, Y.; Wang, Y.; Wang, H.-Q. Wind driven natural ventilation in the idealized building block arrays with multiple urban morphologies and unique package building density. Energy Build. 2017, 155, 324–338. [Google Scholar] [CrossRef]
  62. Jiang, N.; Dirks, K.N.; Luo, K. Effects of local, synoptic and large-scale climate conditions on daily nitrogen dioxide concentrations in Auckland, New Zealand. Int. J. Climatol. 2014, 34, 1883–1897. [Google Scholar] [CrossRef]
  63. Cai, L.; Zhuang, M.; Ren, Y. A landscape scale study in Southeast China investigating the effects of varied green space types on atmospheric PM2.5 in mid-winter. Urban For. Urban Green. 2020, 49, 126607. [Google Scholar] [CrossRef]
  64. Tao, Y.; Zhang, Z.; Ou, W.; Guo, J.; Pueppke, S.G. How does urban form influence PM2.5 concentrations: Insights from 350 different-sized cities in the rapidly urbanizing Yangtze River Delta region of China, 1998–2015. Cities 2020, 98, 102581. [Google Scholar] [CrossRef]
  65. Zhou, W.; Wu, X.; Ding, S.; Ji, X.; Pan, W. Predictions and mitigation strategies of PM2.5 concentration in the Yangtze River Delta of China based on a novel nonlinear seasonal grey model. Environ. Pollut. 2021, 276, 116614. [Google Scholar] [CrossRef] [PubMed]
Figure 1. The distribution of monitoring stations in the study area with the average PM2.5 concentrations in 2018.
Sustainability 16 07360 g001
Figure 2. The distribution of PM2.5 concentrations in the Yangtze River Delta in spring (a), summer (b), autumn (c), and winter (d).
Sustainability 16 07360 g002
Figure 3. The contribution of 2D and 3D building features to PM2.5 concentration. The legend without shading represents the 2D building features and the legend with shading represents the 2D building features.
Sustainability 16 07360 g003
Table 1. Summary of the 2D building morphology indicators used in this study.
Metrics (Abbreviation)DefinitionFormula (Unit)
Patch density (PD)The density of building patches in the buffer PD = n A × 10,000   ( n / ha )
Percentage of patch (PLAND)Percentage coverage of buildings in the buffer PLAND = i = 1 n a i A × 100   ( % )
Largest patch index (LPI)The proportion of the area of the largest building within the buffer LPI = i = 1 n max ( a i ) A   ( % )
Mean patch size (MPS)Average size of building patches within the buffer MPS = i = 1 n a i n   ( ha )
Patch size standard deviation (PSSD)Variability in the size of building patches within the buffer PSSD = i = 1 n ( a i a ) 2 n
Mean shape index (MSI)The mean value of the shape index of the building patches within the buffer. M S I = 1 n i = 1 n p i 4 × a i
Contagion index (CONTAG)Degree of agglomeration of different building types CONTAG = 1 + j = 1 m k = 1 m P j g jk k = 1 m g jk · ln P j g jk k = 1 m g jk 2 ln m
Building density (BD)The density of buildings within the buffer BD = i = 1 n a i A
Notes: n = the number of patches; A = the buffer area; ai = the patch area of building i; a ¯ represents the average area of building patches; pi represents the perimeter of building patch i; Pj = the proportion of the landscape occupied by patch type j; gjk = the number of adjacencies between pixels of patch types j and k based on the double-count method; m = the number of patch types present in the landscape.
Table 2. Summary of the 3D building morphology indicators used in this study.
Metrics (Abbreviation)DefinitionFormula
Average building height (AH)Mean building height within the buffer AH = i = 1 n H i N
Building height density (BHD)The building height on unit area within the buffer BHD = i = 1 n H i A
Building volume density (BVD)The congestion of buildings in 3D space within the buffer BVD = i = 1 n V i max ( H i ) × A
Highest building index (HBI)The proportion of height of the tallest building in the buffer HBI = H max i = 1 n H i
Building otherness (BO)Coefficient of variation in building height within the buffer BO = 1 n i = 1 n ( H i AH ) 2 AH
Building height range (BHR)The range of building heights within the buffer BHR = H max H min
Notes: Hi = the height of building i; N = the number of buildings; ai = the area of building i; A = the buffer area; Vi = the volume of building i; Hmax = the height of the tallest building; Hmin = the height of the lowest building.
Table 3. The 2D and 3D indicators within 5000 m in different cities.
CityPDPLANDMPSAHBHRBO
Hangzhou1.7215.140.0915.45129.001.03
Hefei1.6215.590.1218.09114.671.31
Jiaxing1.6216.150.0812.3297.501.25
Jinhua2.0415.930.0712.62117.001.29
Nanjing2.7816.160.0612.5193.861.10
Nantong3.8015.810.059.88167.001.20
Ningbo1.6517.370.1016.01139.501.48
Shanghai2.8319.580.0717.36228.380.84
Shaoxing1.9413.560.0710.4287.001.33
Suzhou2.9418.780.0710.49146.631.03
Taizhou1.6913.530.0813.96177.001.53
Wenzhou2.0115.670.0813.76175.001.14
Wuxi3.0316.600.0611.36141.001.44
Wuhu1.5111.260.0813.75120.001.03
Xuzhou3.1115.520.058.74166.000.98
Yangzhou2.1419.590.0910.8094.501.43
Table 4. Summary of the final regression model for PM2.5 concentrations.
TimeVariablesEstimateSEtpResult
AnnualIntercept80.7118.534.36<0.001 *** R m 2 0.16
R c 2 0.61
BHR100−0.080.03−2.680.009 **
HBI10022.156.883.220.002 **
CONTAG1000−0.110.06−2.000.049 *
MSI5000−21.0912.37−1.710.093
SpringIntercept59.015.6810.40<0.001 *** R m 2 0.30
R c 2 0.50
BD100−7.585.46−1.390.169
BHD300−417.84155.74−2.680.009 **
CONTAG1000−0.130.06−2.090.041 *
MPS5000−4.051.51−2.690.009 **
PSSD1004.592.152.140.037 *
SummerIntercept40.635.906.88<0.001 *** R m 2 0.26
R c 2 0.58
BHR3000−0.030.01−4.48<0.001 ***
CONTAG3000−0.160.07−2.250.028 *
HBI500169.6941.454.09<0.001 ***
PSSD1001.361.021.330.189
MPS500−1.670.63−2.640.011 *
AutumnIntercept60.3717.933.370.015 * R m 2 0.21
R c 2 0.70
MPS2000−5.811.56−3.73<0.001 ***
BHR100−0.080.03−2.940.005 **
HBI10026.646.284.24<0.001 ***
LPI1000.100.052.210.032 *
MSI5000−20.8911.88−1.760.131
WinterIntercept156.4855.682.810.008 ** R m 2 0.27
R c 2 0.43
BHR5000−0.040.03−1.500.138
CONTAG1000−0.270.13−2.010.049 *
HBI10060.9716.343.73<0.001 ***
LPI1000.150.121.250.217
MSI5000−62.0436.83−1.680.099
R m 2 = marginal R2, R c 2 = conditional R2. ***, **, and * indicate the 1%, 5%, and 10% significance levels, respectively.
Disclaimer/Publisher’s Note: The statements, opinions and data contained in all publications are solely those of the individual author(s) and contributor(s) and not of MDPI and/or the editor(s). MDPI and/or the editor(s) disclaim responsibility for any injury to people or property resulting from any ideas, methods, instructions or products referred to in the content.

