Abstract
This study investigates the hydration behavior of cementitious materials incorporating fly ash, limestone and calcined clay (LC2), and seawater, aiming to understand the individual and synergistic effects of these components on hydration kinetics. The motivation behind this research lies in the growing interest in enhancing the performance and sustainability of cement-based materials by incorporating supplementary materials and utilizing seawater. To achieve this, the hydration process was meticulously examined using electrochemical impedance spectroscopy (EIS). An innovative equivalent circuit model was developed to analyze the results. The experimental data indicated that, with ongoing hydration, the diameter of the impedance arc in the high-frequency range gradually increases. A noteworthy observation is that increasing the proportion of fly ash and LC2 in the cement paste leads to a corresponding enlargement of the high-frequency arc, indicating a significant influence of these supplementary materials on the hydration process. Additionally, LC2 was found to be more effective in accelerating the hydration process compared to fly ash.
1. Introduction
The hydration of cement, a critical process dictating the formation of the solid matrix in concrete and determining its ultimate mechanical properties and durability, has long been the subject of extensive research [1,2,3,4,5,6]. Understanding this complex chemical reaction is essential for optimizing concrete mix designs, ensuring construction quality, and prolonging the service life of infrastructures [7]. Simultaneously, the global imperative to mitigate climate change has intensified efforts to reduce the substantial carbon footprint associated with the cement industry, which is responsible for around 8% of global anthropogenic CO2 emissions [8,9,10,11,12]. Hence, the exploration of alternative binders and sustainable raw materials, alongside innovative production and utilization methods, holds significant promise in driving down the sector’s greenhouse gas emissions.
In this context, the utilization of industrial by-products like fly ash and novel admixtures such as LC2 as partial replacements for Portland cement has gained considerable traction [13,14]. Fly ash, a coal combustion residue rich in silica and alumina, exhibits pozzolanic properties that enable it to react with the calcium hydroxide generated during cement hydration, which results in the formation of additional calcium silicate hydrate (C-S-H) gel and contributes to enhanced mechanical strength, reduced permeability, and improved durability [15,16]. Moreover, the use of fly ash reduces the demand for virgin cement, thereby curtailing energy-intensive clinker production and associated CO2 emissions [17]. Similarly, LC2, a hypothetical novel admixture, is postulated to offer distinct advantages such as accelerated or retarded hydration, improved workability, enhanced mechanical properties, or increased durability, all of which can contribute to a more sustainable and efficient concrete production process [18].
Another area of interest lies in the substitution of freshwater with seawater in the hydration process [19]. Despite the challenges posed by seawater’s elevated salinity and aggressive ionic composition, which can potentially disrupt the cement hydration process and compromise concrete durability, various studies have shown that seawater can be used for mixing and curing concrete under specific conditions [19,20]. Not only does this strategy alleviate pressure on freshwater resources, particularly in arid coastal regions, but it also offers a potential avenue for reducing the environmental footprint of concrete production by eliminating the energy-intensive desalination process often required for using seawater in construction [21].
Electrochemical impedance spectroscopy (EIS) has emerged as a crucial, non-invasive method for examining the hydration processes of cementitious materials and assessing the impact of various additives and substitutions [22]. EIS provides real-time monitoring of the electrical properties of the material, which are closely related to its microstructure, pore solution chemistry, and ionic transport dynamics [23,24,25]. By analyzing the frequency-dependent complex impedance spectra, researchers can extract valuable information on hydration kinetics, microstructural evolution, and the material’s response to aggressive agents like chloride ions. Recent research has effectively utilized EIS to explore how fly ash and seawater exposure impact cementitious systems, uncovering their influence on factors like charge transfer resistance, double-layer capacitance, and diffusion coefficients [26]. However, the influence of fly ash, LC2, and seawater on EIS is unknown. Additionally, there is little research on the suitable equivalent circuit model of seawater-based concrete.
Building on this research, the current study employs EIS to thoroughly explore how substituting seawater for freshwater and partially replacing cement with fly ash and/or LC2 affect the hydration behavior of cement, both individually and in combination. This knowledge will be invaluable for the design of environmentally friendly concrete mixtures, particularly for coastal infrastructure projects where the use of seawater and the need for enhanced durability are paramount. Ultimately, this work supports the broader objective of decarbonizing the cement industry and promoting a circular economy by harnessing waste materials and alternative resources in concrete production.
2. Experiments and Methods
In this study, P.O 42.5 grade Portland cement was used, which satisfactorily conforms to the specifications outlined in the GB 175-2007 [27] standard. The seawater was sourced from the Southern Chinese Sea, ensuring its regional authenticity. The fly ash incorporated was procured from the Mawan powder facility and classified as F subclass II in strict adherence to the stipulations laid down by the GB/T 1596-2017 [28] standard. This guarantees its suitability for use in the intended application. The calcined clay component was derived through the thermal processing of kaolin clay at a temperature range of 700–800 °C, an industrial-scale experimental production carried out in Maoming, China. This specific treatment imparts the desired properties to the clay for its integration into the final mix. Lastly, the gypsum incorporated is of the dihydrate variety, characterized by its chemical purity. Notably, when determining the mixing ratios, the inherent moisture content of the gypsum was meticulously taken into account, thereby ensuring precision and consistency in the final product composition. In addition, the particle size of the above raw materials is shown in Figure 1, and the chemical composition of cement, calcined clay, and fly ash is shown in Table 1.
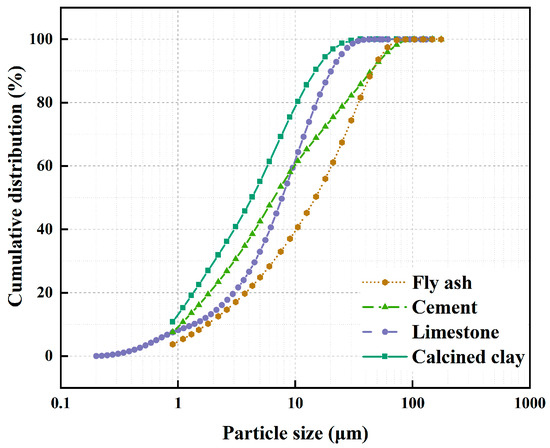
Figure 1.
Cumulative particle size distribution for raw materials.

Table 1.
Chemical composition of cement, calcined clay, and fly ash (mass, %).
Table 2 presents the respective proportions of raw materials incorporated in the prepared samples. The water/cement ratios were 0.5. A total of six distinct mix ratios were examined in this study, namely PW, SW, SW-FA-25, SW-FA-45, SW-LC2-25, and SW-LC2-45. For each of these mix configurations, a set of 4 samples (curing for 1, 3, 7, 28 days) were fabricated to undergo EIS. The fabrication process began with meticulous blending of the various raw materials with water until a uniform consistency was achieved. Subsequently, the homogeneous mixture was poured into steel molds measuring 40 mm × 40 mm × 160 mm, ensuring even distribution throughout the mold cavity. The specimens were then cured in a regulated environment, maintaining a constant temperature of 20 °C and a relative humidity of 95%. This curing period spanned 28 days, allowing sufficient time for the samples to develop their intended mechanical and physical properties.
Table 2.
Experimental mix ratios (unit: Kg/m3).
EIS Testing
It is theoretically postulated that upon the application of an alternating current (AC) stimulus, the resulting electrochemical behavior of a steady-state electrochemical system can be effectively quantified via EIS techniques, as per reference. An electrochemical system typically comprises electrodes, functioning as electrical conduits, and an electrolyte, serving as the ionic conductor in its dissolved state. These components, when integrated, collectively operate as a dual electron–ion conducting entity. For the assessment of the samples across diverse hydration stages, an EIS measurement apparatus—specifically, the PARSTAT 4000+ system was employed.
EIS measurements were conducted at room temperature, spanning a frequency range from 100 Hz to 1 MHz, with a perturbation amplitude of 10 mV. The current range extended up to 1 mA, and each cycle comprised 50 data points. The most critical behaviors, such as the bulk response of the cement and the interaction between cement and electrodes, were observed within the frequency range of 1 MHz to 0.01 Hz. These measurements were performed in triplicate to ensure reliability.
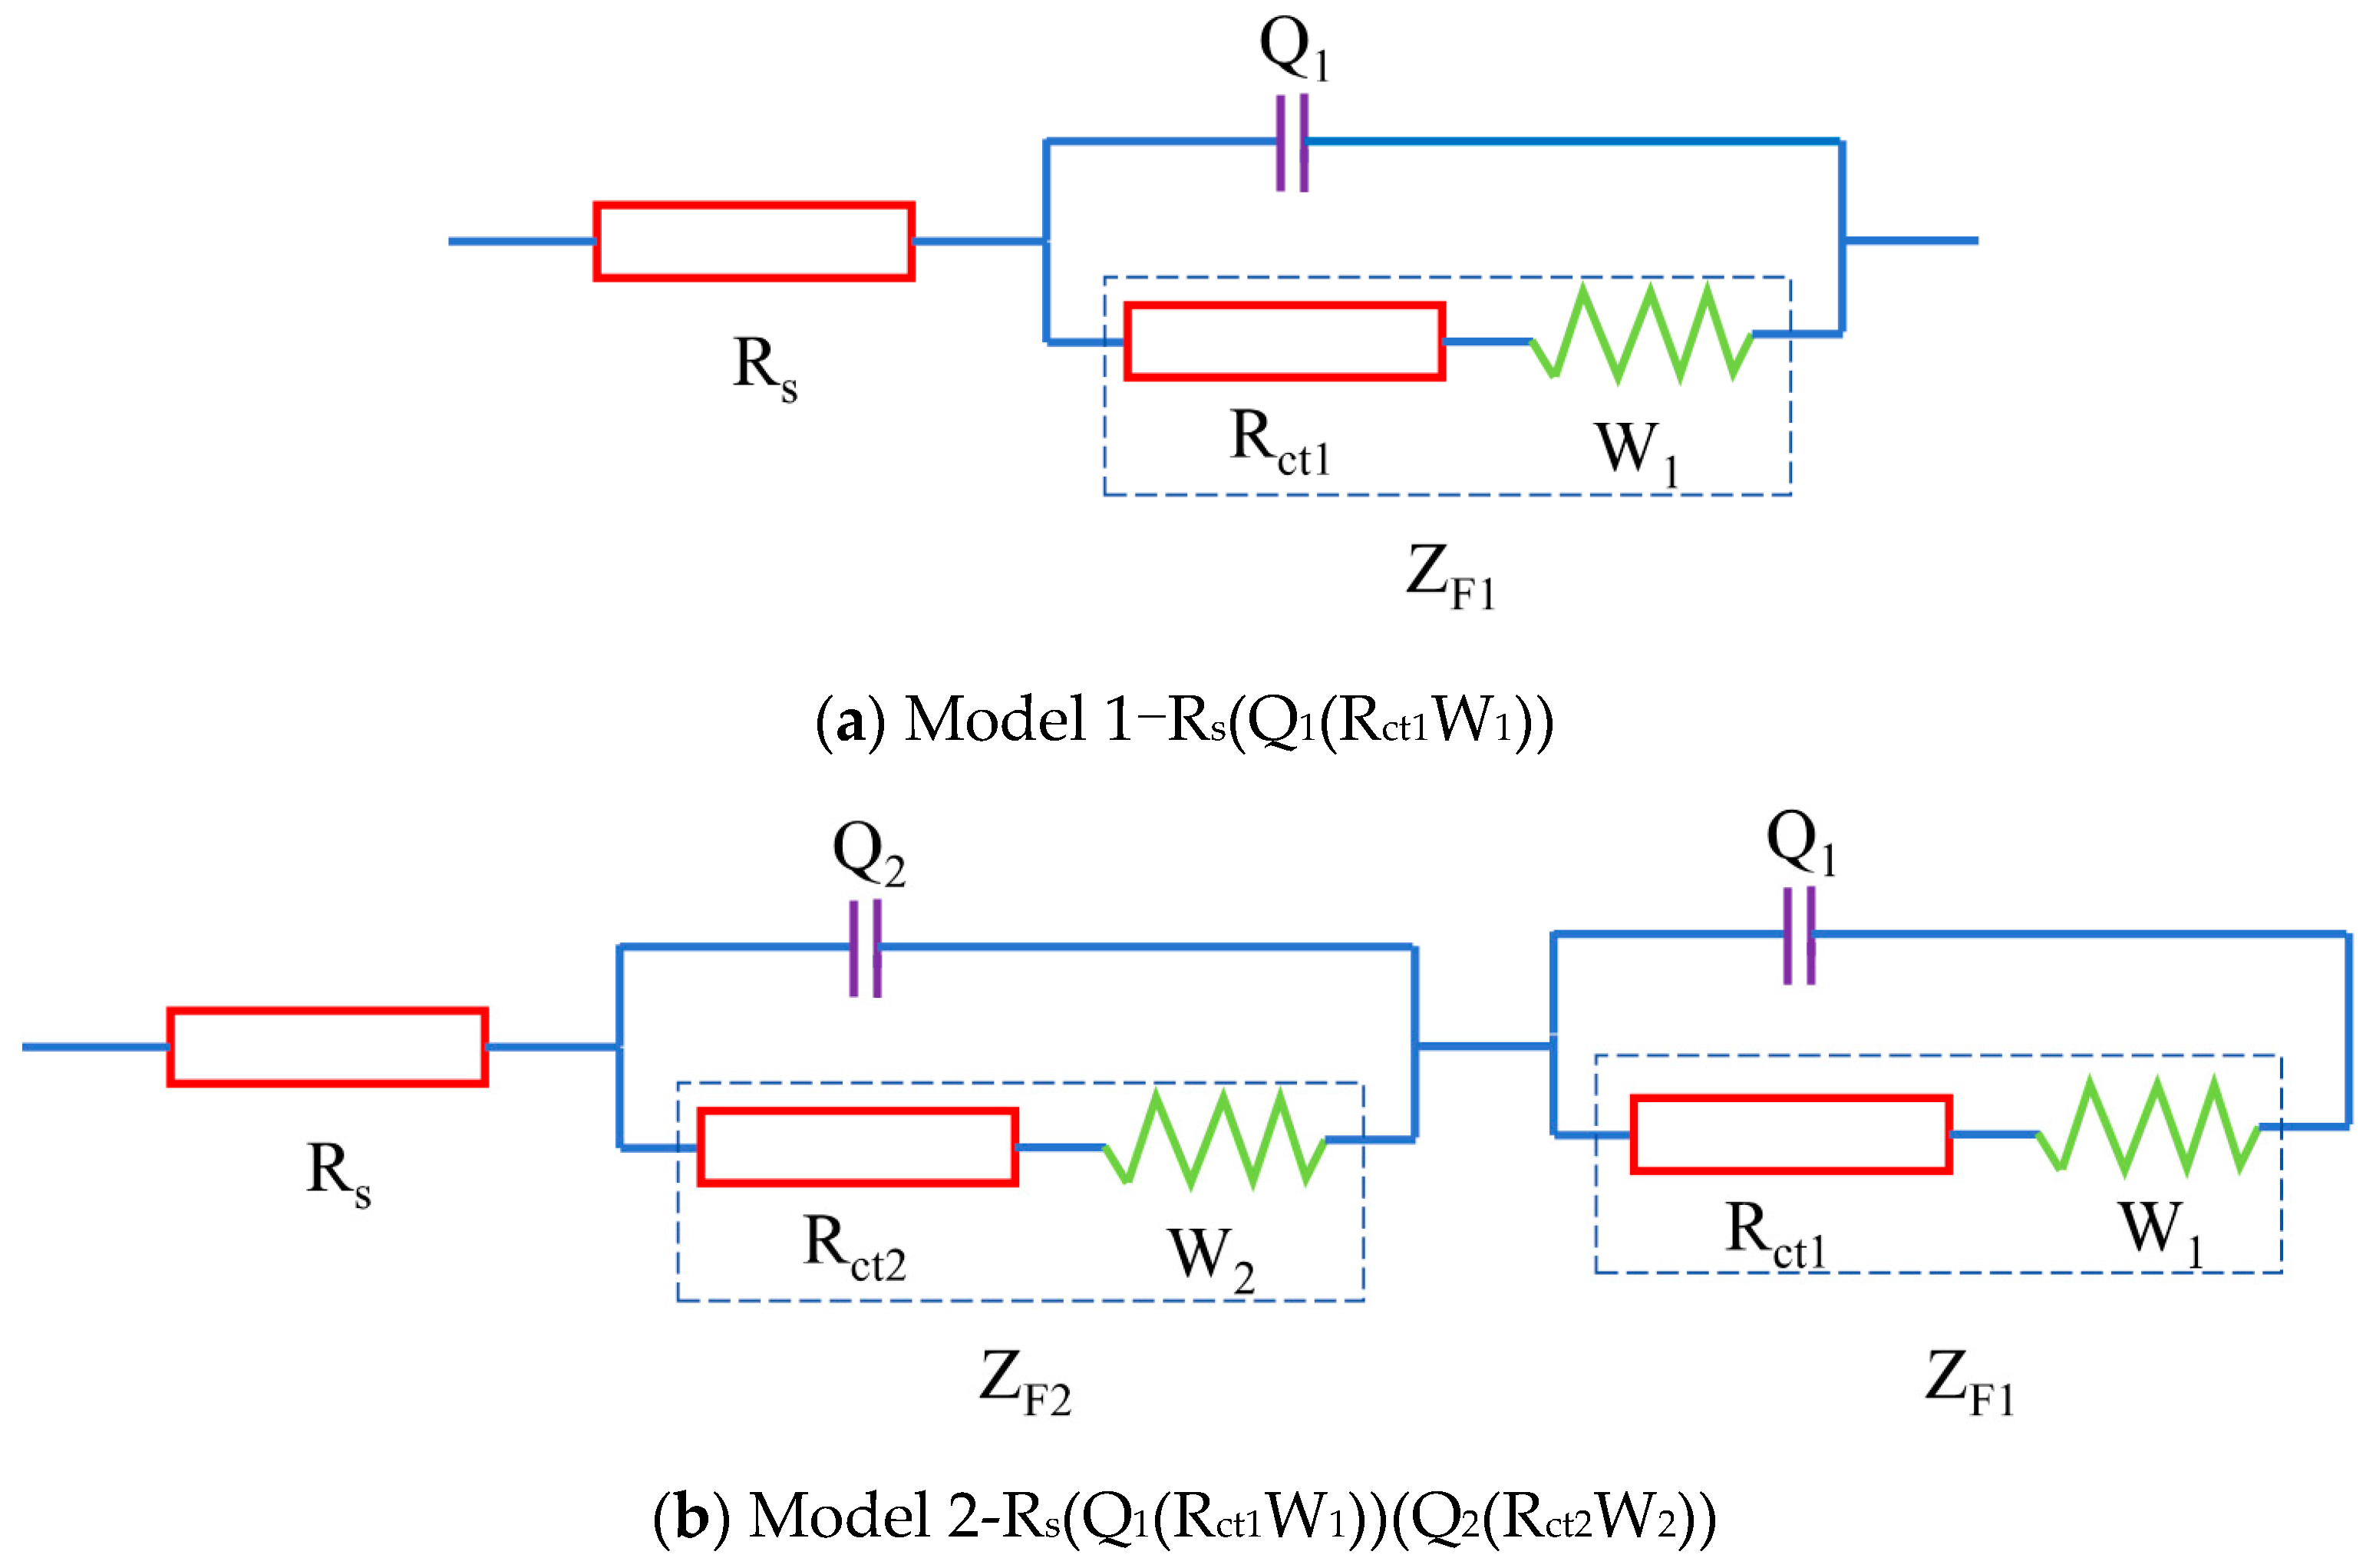
The electrochemical perspective generally involves an empirical system comprising electrodes and an electrolyte, the latter typically existing in solution form. This complex system can be abstracted into a simplified equivalent circuit, exemplified by the Randles circuit model [29] depicted in Figure 2a. This circuit can be represented using a Circuit Description Code (CDC) as Model 1 in the context of the ideal electrochemical system depicted in Figure 2a. In this ideal electrochemical setup, Rs denotes the resistance of the electrolyte solution, Q1 denotes the double-layer capacitance at the electrode–electrolyte interface, Rct1 signifies the charge transfer resistance between the electrodes and the electrolyte, W1 represents the Warburg resistance related to charge diffusion, and ZF1 = Rct1 + W1 reflects the impedance of the Faraday process between the electrodes and the electrolyte [30]. In the ideal electrochemical system shown in Figure 2b, the parameters are characterized as follows: Rs signifies the resistance of the pore electrolyte, Q1 corresponds to the double-layer capacitance at the interface between the electrodes and the blended cement, Rct1 represents the resistance to charge transfer at this interface, and W1 reflects the Warburg resistance linked to charge diffusion. New parameters introduced include Q2, which stands for the double-layer capacitance at the solid–liquid interfaces within the fly ash, LC2, and seawater cement systems; Rct2, which indicates the charge transfer resistance between these solid–liquid phases; and W2, which accounts for the Warburg resistance associated with charge diffusion processes within these systems. Additionally, ZF1 = Rct1 + W1 continues to characterize the impedance of the Faraday process occurring between the fly ash, LC2, and seawater cement and the electrodes, while ZF2 = Rct2 + W2 represents the impedance of the Faraday process occurring internally within the fly ash, LC2, and seawater cement [26].
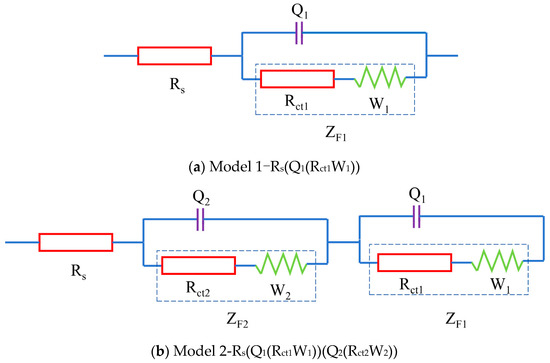
Figure 2.
Equivalent circuit models.
Although utilizing the Randles circuit to fit impedance spectra offers a convenient means of extracting quantitative electrochemical data encapsulated in the circuit elements, it assumes a single-component electrolyte and restricts electrochemical reactions solely to the electrode surfaces. However, the electrochemical scenario in fly ash, LC2, and seawater cement materials is significantly more intricate. Crucially, a notable charge transfer process takes place at the interface between solid phases, like CSH, and liquid phases, such as the pore electrolyte. Hence, when investigating fly ash, LC2, and seawater cement materials via EIS, it is imperative to consider not only the surface charge reactions on electrodes but also the charge interactions occurring at the solid–liquid interface. Additionally, the charge diffusion process within the pore electrolyte needs to be considered.
To tackle these complexities, a novel equivalent circuit model was devised to elucidate carbonation behavior. This model consists of three main elements: the electrical resistance of the pore electrolyte, electrochemical reactions occurring at solid–liquid interfaces, and the electrochemical interactions between the sample and the testing electrodes. The schematic representation of this equivalent circuit is illustrated in Figure 2b. It is designated as Model 2 using the Circuit Description Code (CDC), with the physical significance of each circuit component explained in detail in Figure 2b.
The impedance of Model 2 is constituted by three series-connected elements: the resistance of the pore electrolyte (Rs), the impedance associated with the interaction between the blended cement and the electrodes (ZF1/()), and the related to the solid–liquid double phase (ZF2/()). Therefore, the overall impedance Z of Model 2 can be mathematically expressed by Equation (1)
Due to , the Equation (1) turns to:
In this context, W1 and W2 are, respectively, defined as and , where denotes the electrical conductivity of the electrodes, represents the electrical conductivity of the supplementary cementitious materials, and is the angular frequency. Incorporating these expressions for W1 and W2 into Equation (2), the real component (Zr) and the imaginary component (Zi) of Z can be mathematically articulated through Equation (3) and Equation (4), respectively.
Under circumstances where the frequency assumes exceedingly high values ( → ∞), or equivalently, when exceeds , the following equation was obtained:
Then, the following equation was obtained:
The equation describes a semi-circular arc located in the first quadrant of the coordinate plane. As the frequency decreases to very low levels (→ ∞), the following equation was obtained:
Then, the following equation of a straight line was obtained:
3. Result and Analysis
The utilization of an equivalent circuit model has proven efficacious in tracking the hydration progression of OPC-based cement incorporating fly ash, LC2, and seawater. In the present study, this model is further employed to explore the hydration characteristics of blended cement incorporating fly ash, LC2, and seawater.
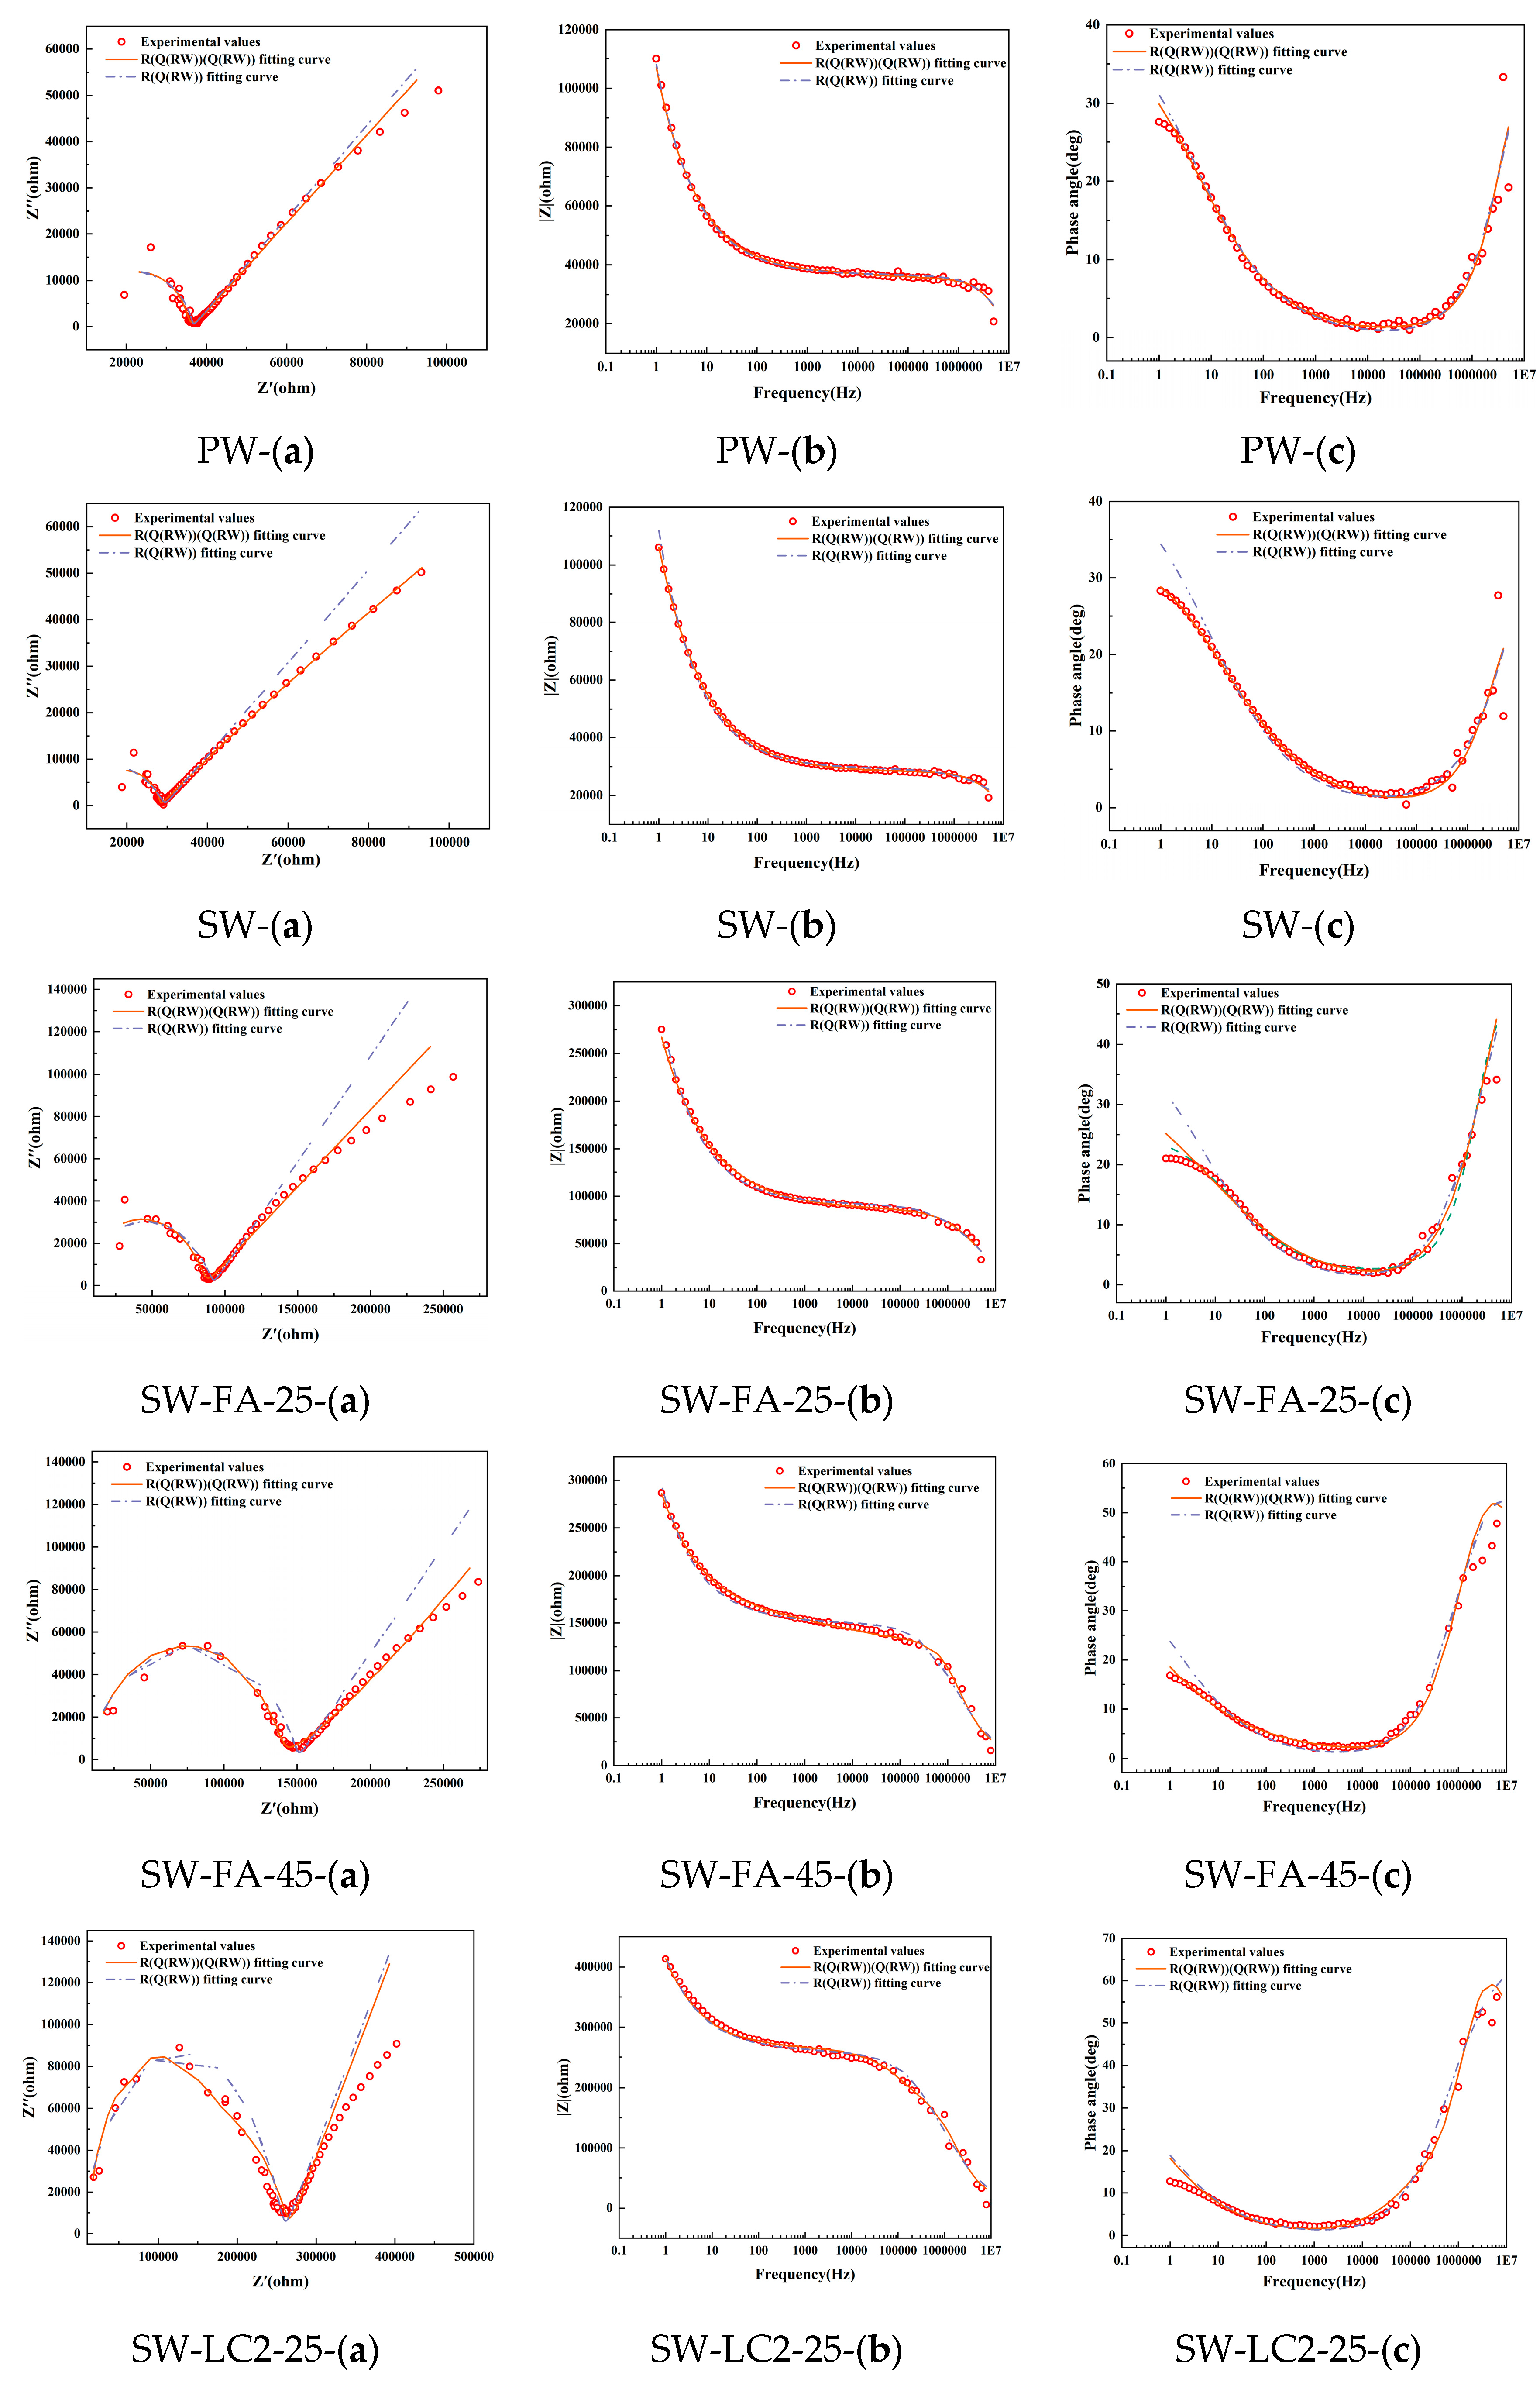
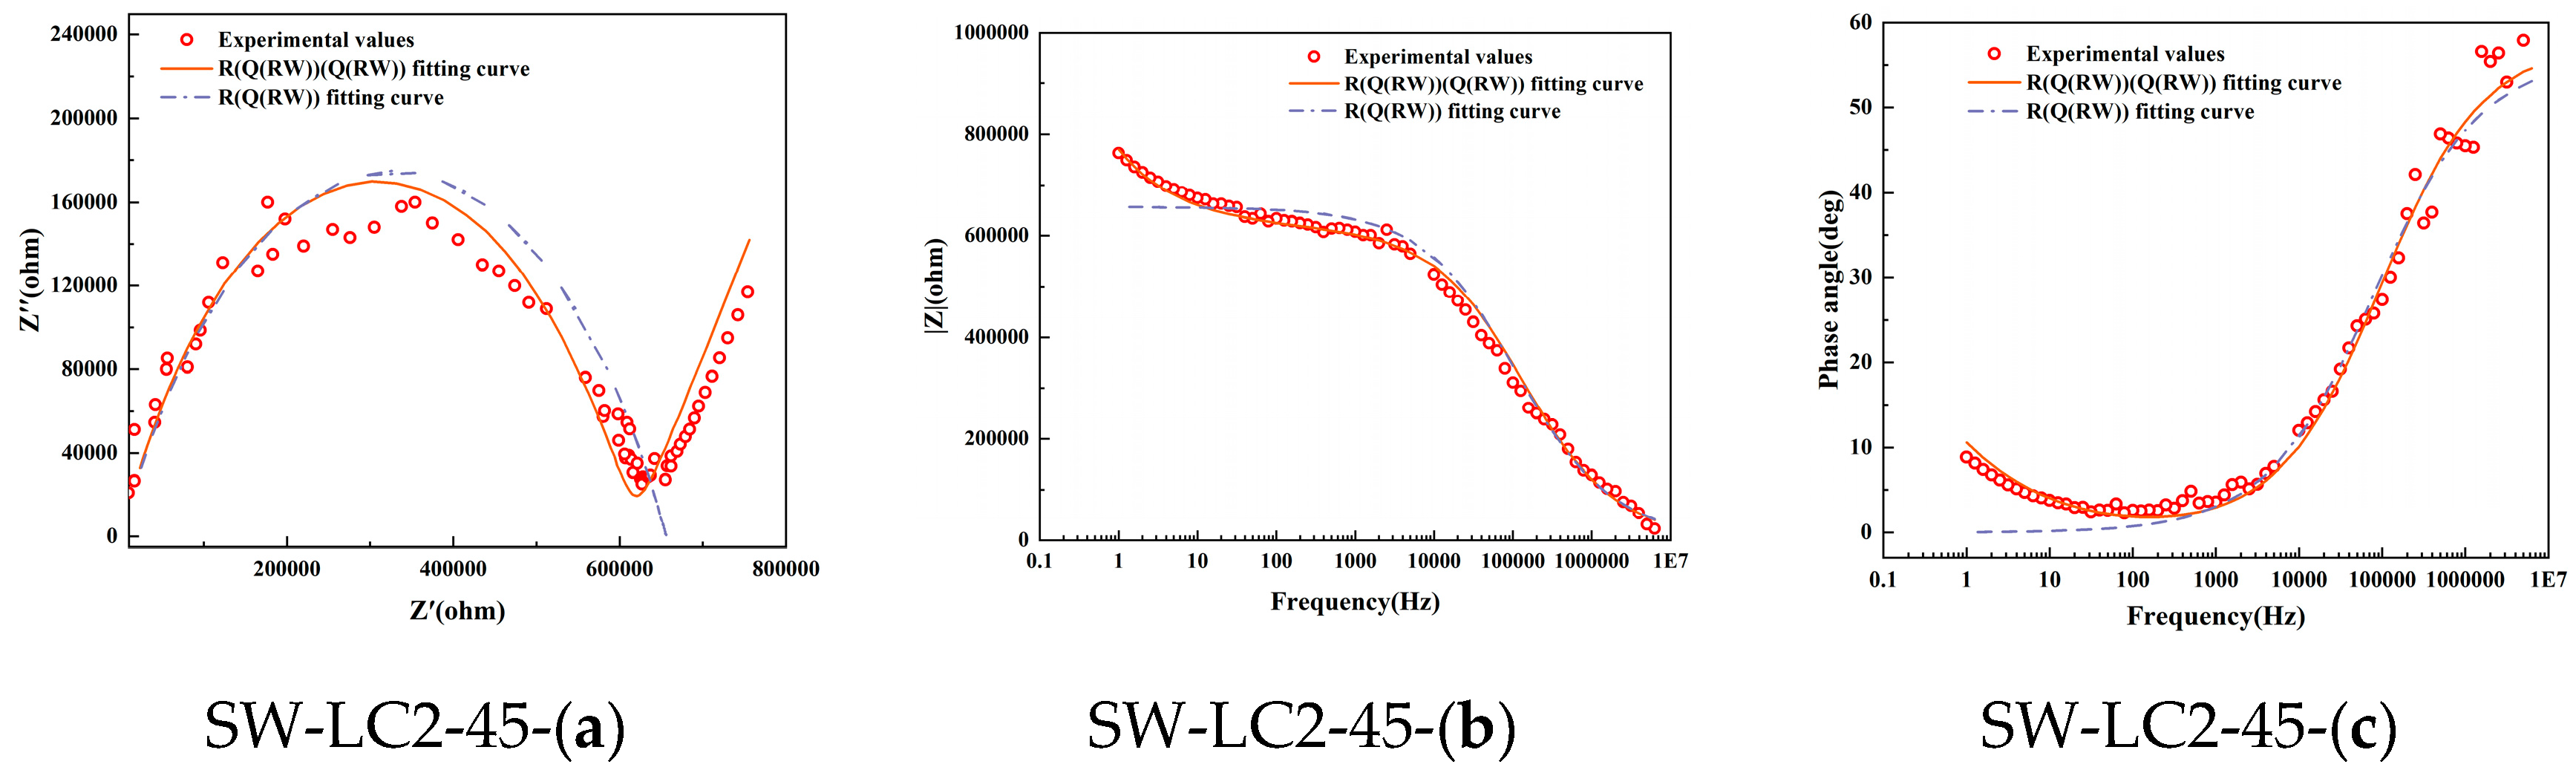
Figure 3 shows the Nyquist, Bode, and phase angle plots derived from EIS on samples following 28 days, along with the corresponding fitting outcomes based on two models: Model 1 and Model 2. It becomes apparent that Model 1 fails to adequately align with the experimental data, particularly in the low-frequency domain. This pronounced discrepancy between the Rs(Q1(Rct1W1)) model predictions and the actual test results underscores its unsuitability for analyzing the hydration processes in seawater, fly ash, and LC2 cementitious materials.
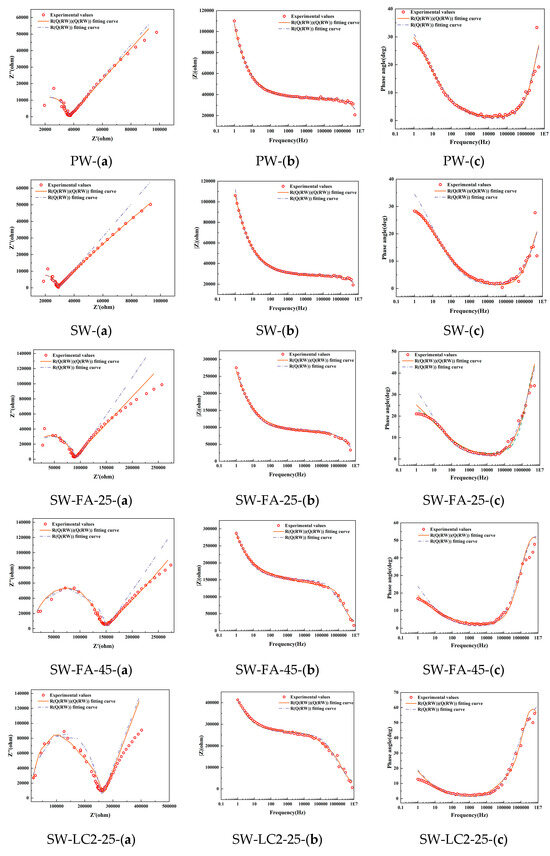
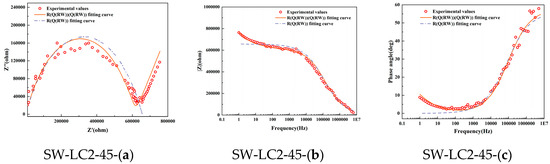
Figure 3.
Electrochemical impedance measurement of different mix ratio samples at 28 days: (a) Nyquist locus; (b) Bode locus; (c) angle locus.
Conversely, Model 2 exhibits a commendable level of agreement with the experimental Nyquist curve, thereby demonstrating its superior fitness for the task. Seawater, fly ash, and LC2-blended cement, being a multiphase material composed of solid constituents such as calcium hydroxide, CSH-gels, and CAH-gels, and liquid phases like the pore solution, experiences complex ion dynamics under an applied electrical field. These encompass the charge transfer at the interface between solid and liquid phases, along with the diffusion of charge through the pore solution.
After comparison to Model 1, the novel Model 2, which captures the complex charge interactions taking place at the solid–liquid interface, emerges as a more dependable and precise tool for assessing the hydration behavior of seawater, fly ash, and LC2-containing cementitious composites.
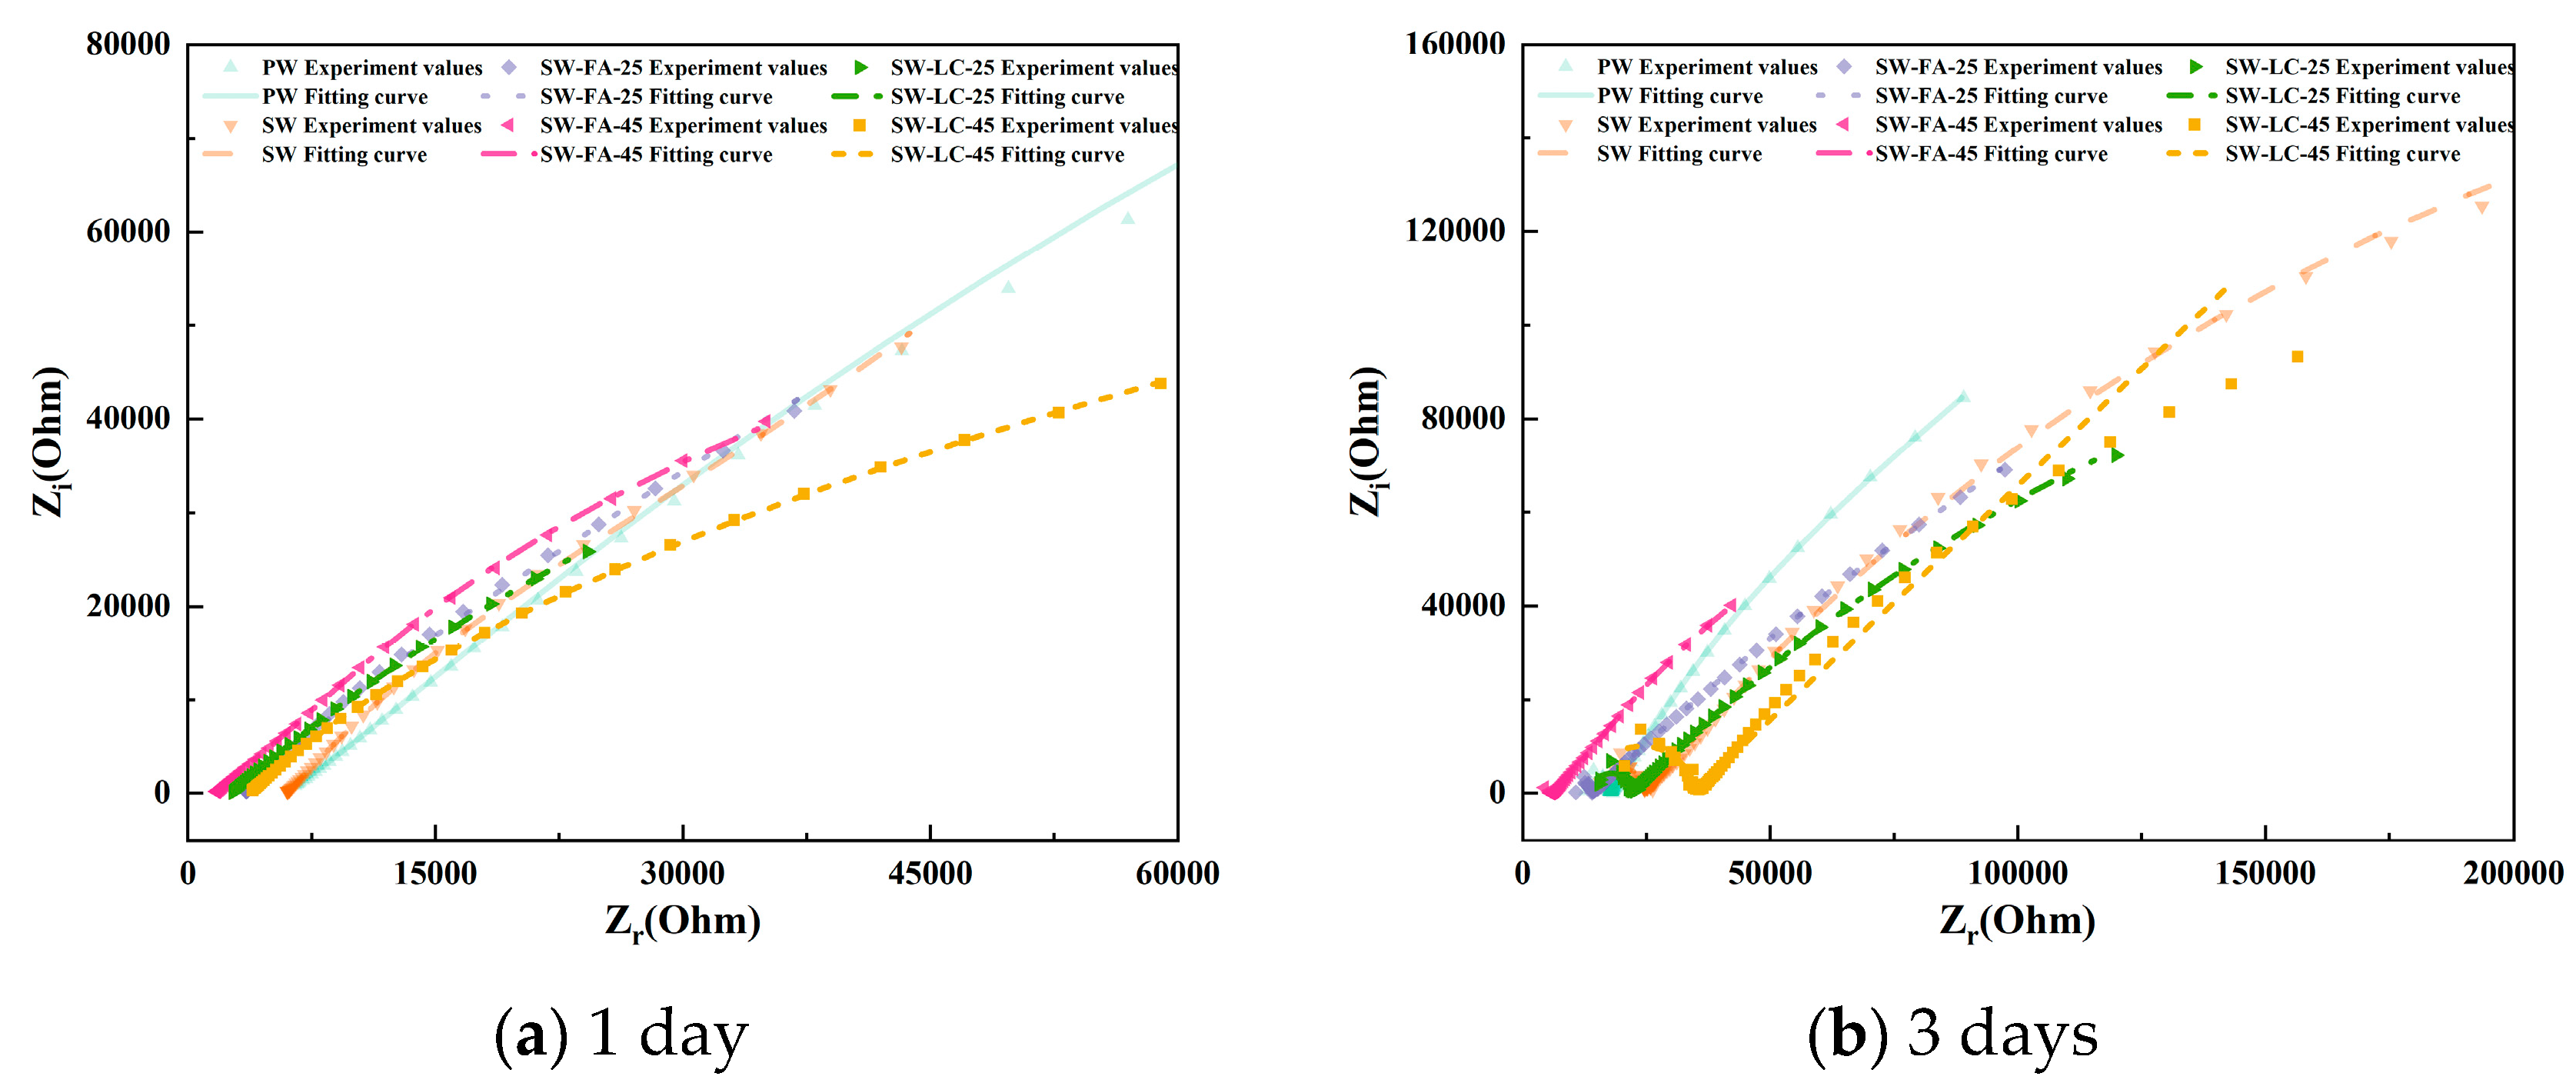
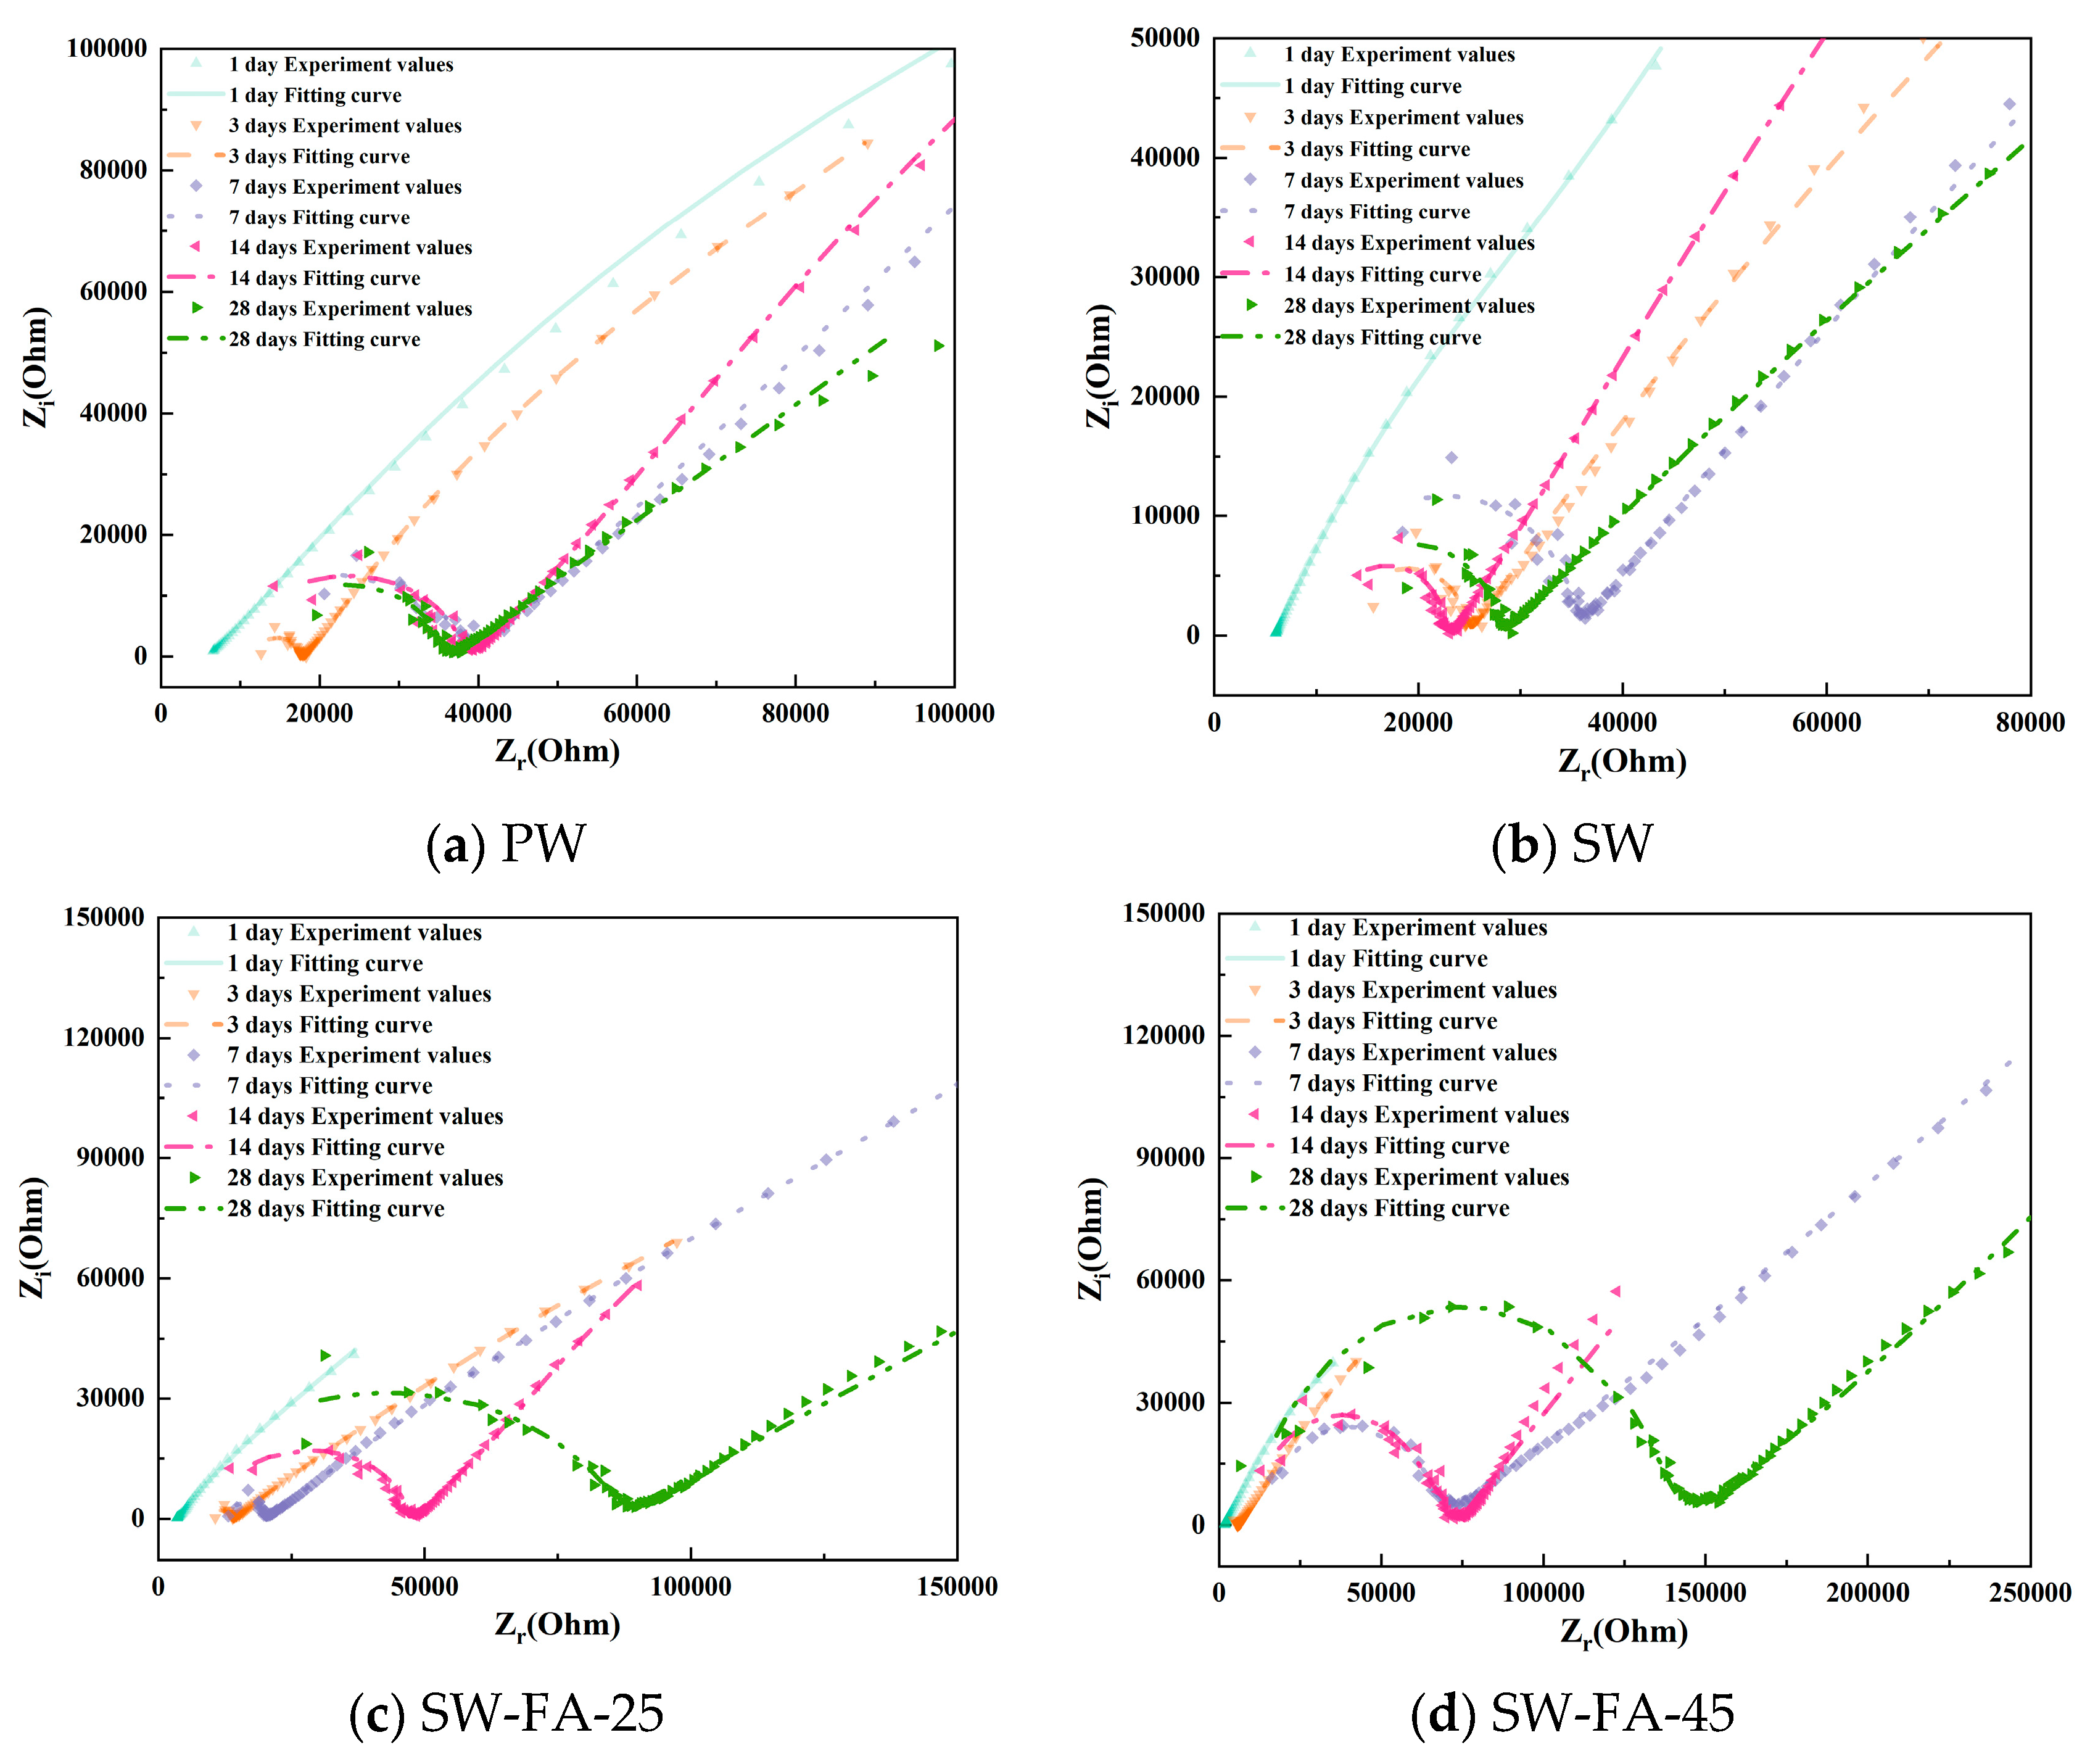
Figure 4 presents the EIS results as Nyquist plots, including both the imaginary part (Z″) and the real part (Z′) of the impedance. The distinctive characteristics evident in the Nyquist plots at different hydration stages serve as useful indicators of the ongoing hydration process.
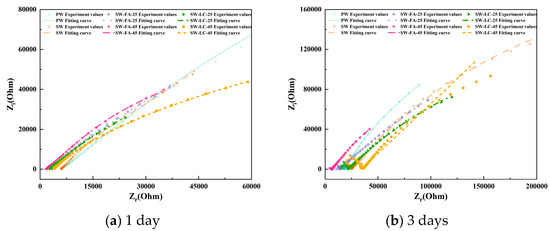
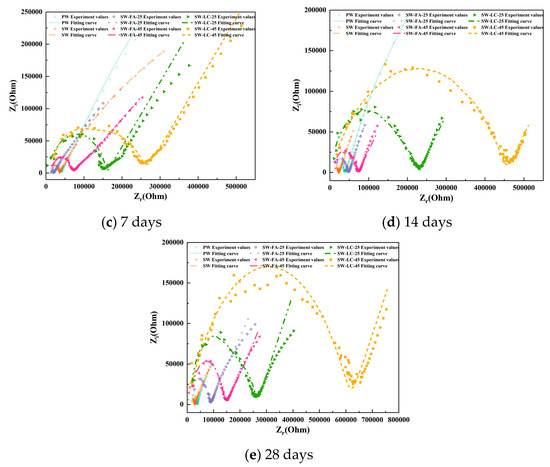
Figure 4.
The Nyquist plots for cement paste specimens at various curing durations.
Focusing on the Nyquist plots for blended cement containing varying fly ash and LC2 contents after 1 day of hydration (Figure 4a), the impedance curve primarily appears as a straight line in the high-frequency region, lacking a semicircle, which suggests the absence of significant electrochemical reactions within the cement matrix. It is generally accepted that such reactions occur only on the rough surfaces of hydrated calcium silicate gel and necessitate a significant buildup of the gel. Consequently, after just one day of hydration, the C3S and C2S remain largely unreacted, yielding only a minimal quantity of hydrated calcium silicate gel insufficient for substantial electrochemical activity [31].
As the cement hydration advances, the C3S and C2S hydration degrees steadily rise, leading to a buildup of hydrated CSH gel within the material. This, in turn, enables normal electrochemical reactions to commence and initiates the development of a continuous pore network within the blended cement [32]. At the 3-day hydration mark, the impedance curves start transitioning towards quasi-Randles profiles, albeit without clear curve traits. Fly ash and LC2 were observed to notably accelerate cement hydration compared to other supplementary materials. This acceleration is reflected by a pronounced curve in the high-frequency region and a linear segment in the low-frequency region, with an inclination angle of less than 45°.
Upon reaching 7 and 14 days of hydration, the impedance curves exhibit hallmark features of quasi-Randles curves. The high-frequency range now displays a more pronounced curvature than at the 3-day stage, while the low-frequency range continues to present a linear segment, albeit with a reduced inclination angle compared to earlier hydration periods. Moreover, the impedance plot shape exhibits marked variations with changes in fly ash and LC2 content. For any given hydration period, a higher fly ash and LC2 content corresponds to a more defined high-frequency curve. Unlike other SCMs, fly ash and LC2-infused blended cement demonstrate quasi-Randles characteristics at this juncture, suggesting that fly ash and LC2 promote cement hydration and foster increased production of hydration products.
Figure 4 shows the Nyquist plots of blended cement after 28 days of hydration. Compared with the impedance curves at 14 days, the high-frequency region maintains its general shape, with only slight changes in the position and diameter of the semicircle. Meanwhile, the low-frequency region still presents as a straight line but with a reduced slope. These observations stem from the fact that the hydration process has reached a stable state, culminating in the establishment of a fully developed and interconnected capillary network within the cementitious matrix [32].
At high frequencies, the impedance curves of blended cement containing fly ash and LC2 show greater completeness compared to those without these additives. Notably, the curves corresponding to fly ash and LC2 contents of 45% demonstrate a trend toward convergence [24]. Conversely, in the low-frequency region, an increase in Fly ash and LC2 content is accompanied by a decline in the straight line’s slope, signifying densification of the cement material’s microstructure and a concomitant hindrance to ion diffusion [23].
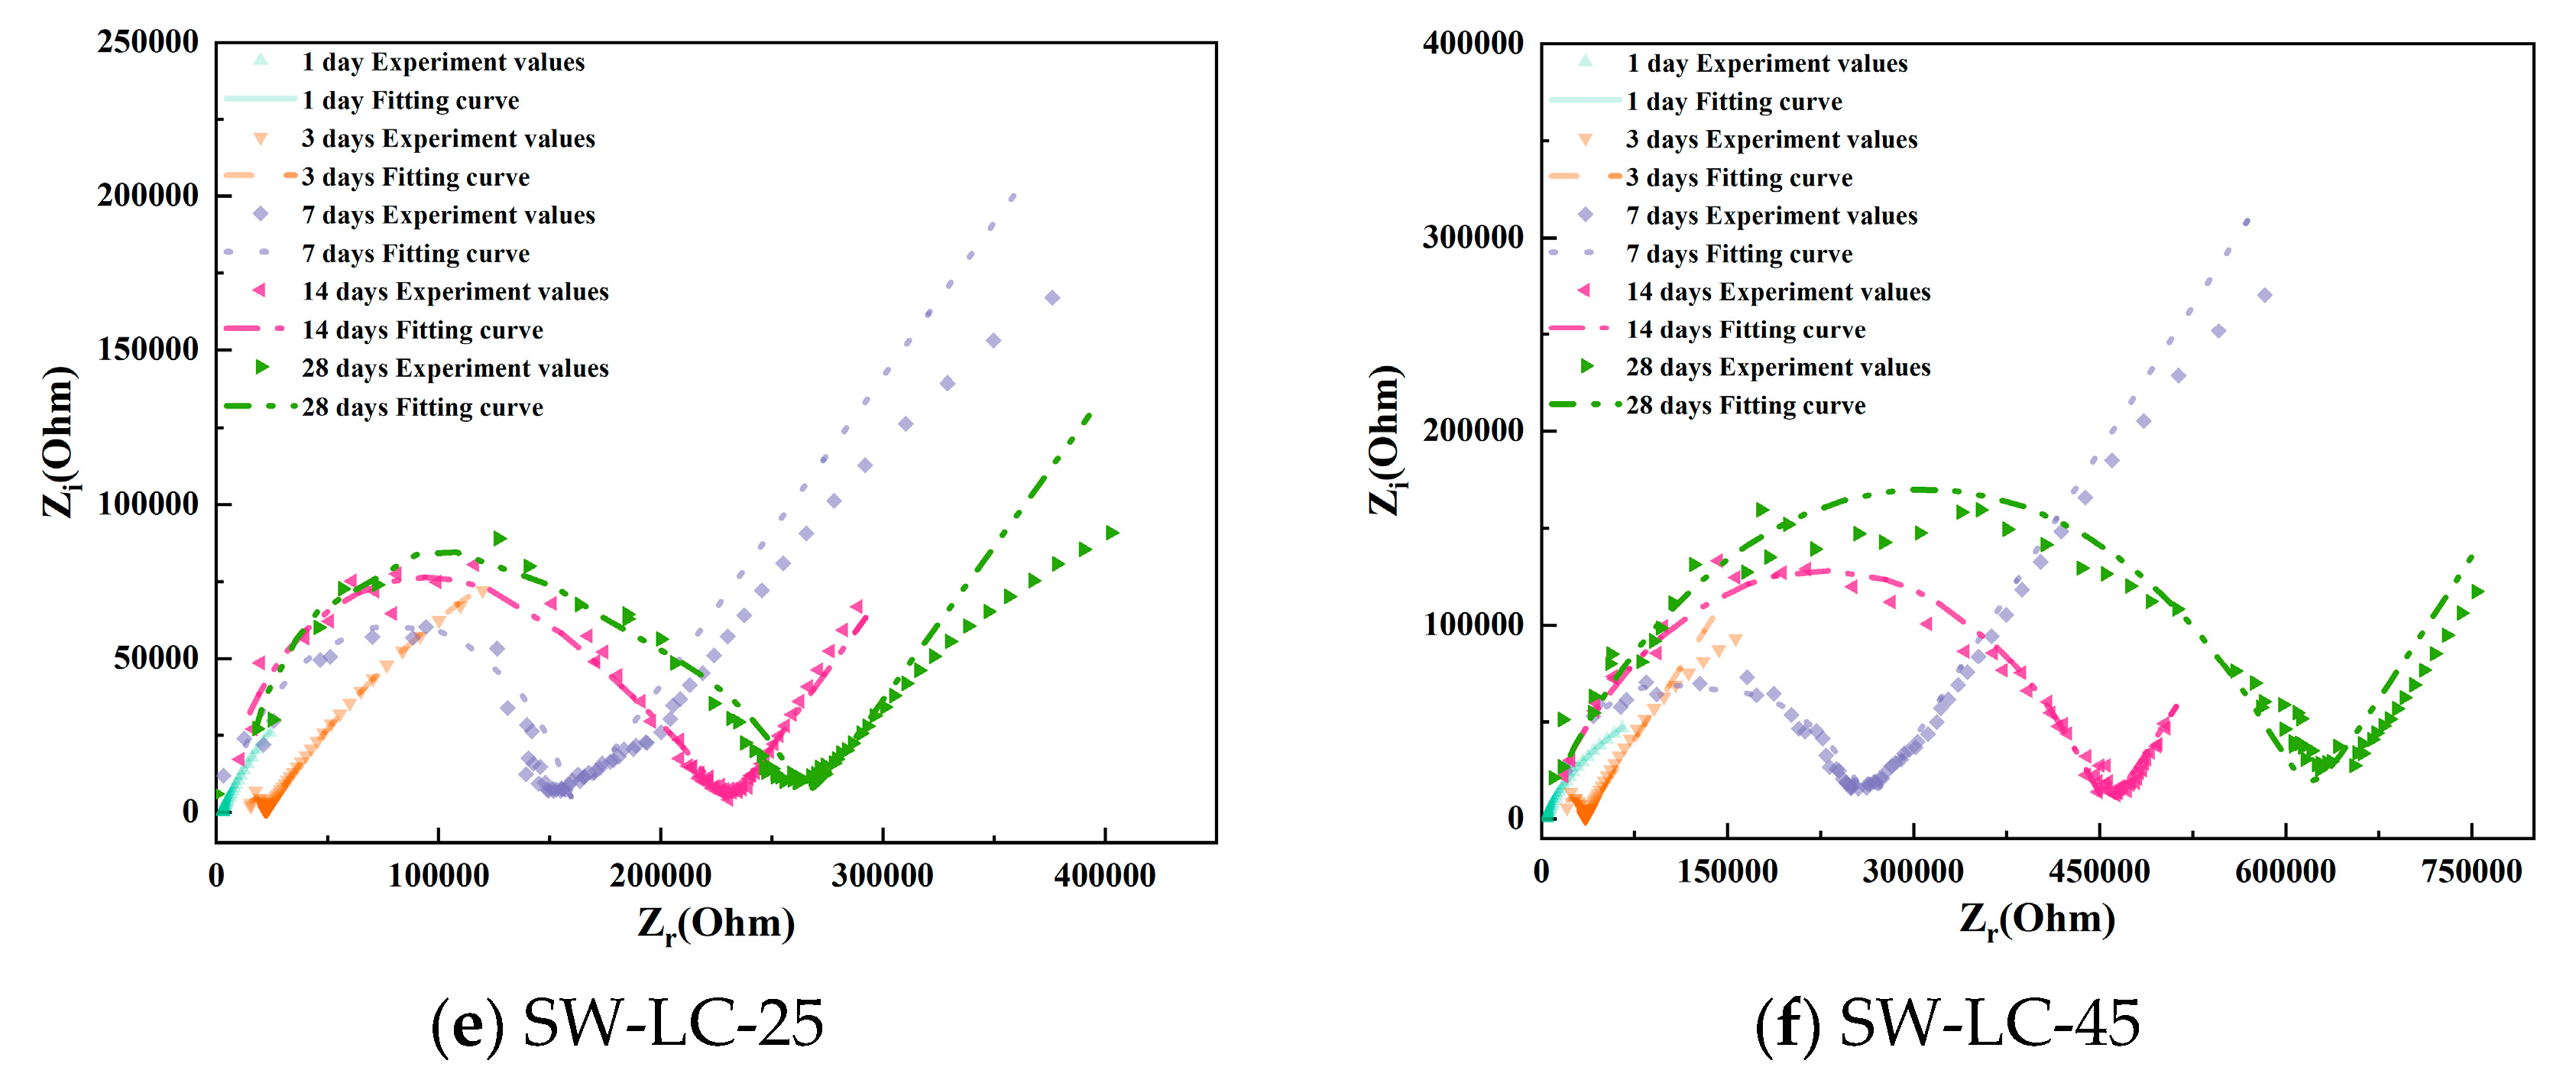
To better observe the hydration evolution process, Figure 5 shows the Nyquist plots of cement paste specimens with varying mix ratios. As the curing time increases, the high-frequency domain exhibits enhanced completeness due to the hydration degree of cement increases. In addition, as the curing time increases, the low-frequency domain exhibits that the lines are becoming increasingly shorter. However, between the different mix ratio samples, the cement pastes incorporating LC, fly ash, and seawater accelerate, forming the completeness curve in the high-frequency domain, meaning that the SCMs (LC2 and fly ash) and seawater accelerate the hydration process.
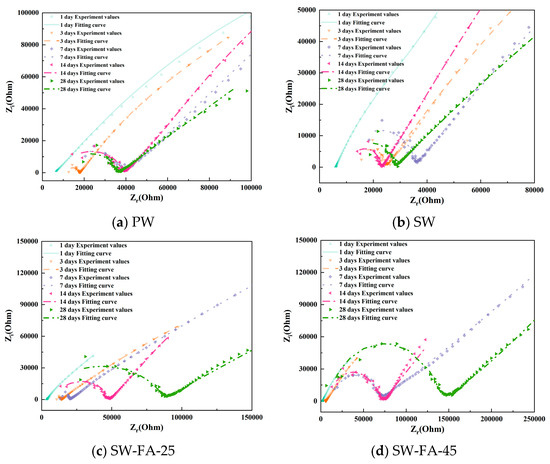
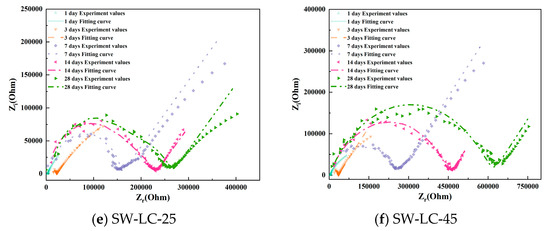
Figure 5.
The Nyquist plots of cement paste specimens with varying mix ratios.
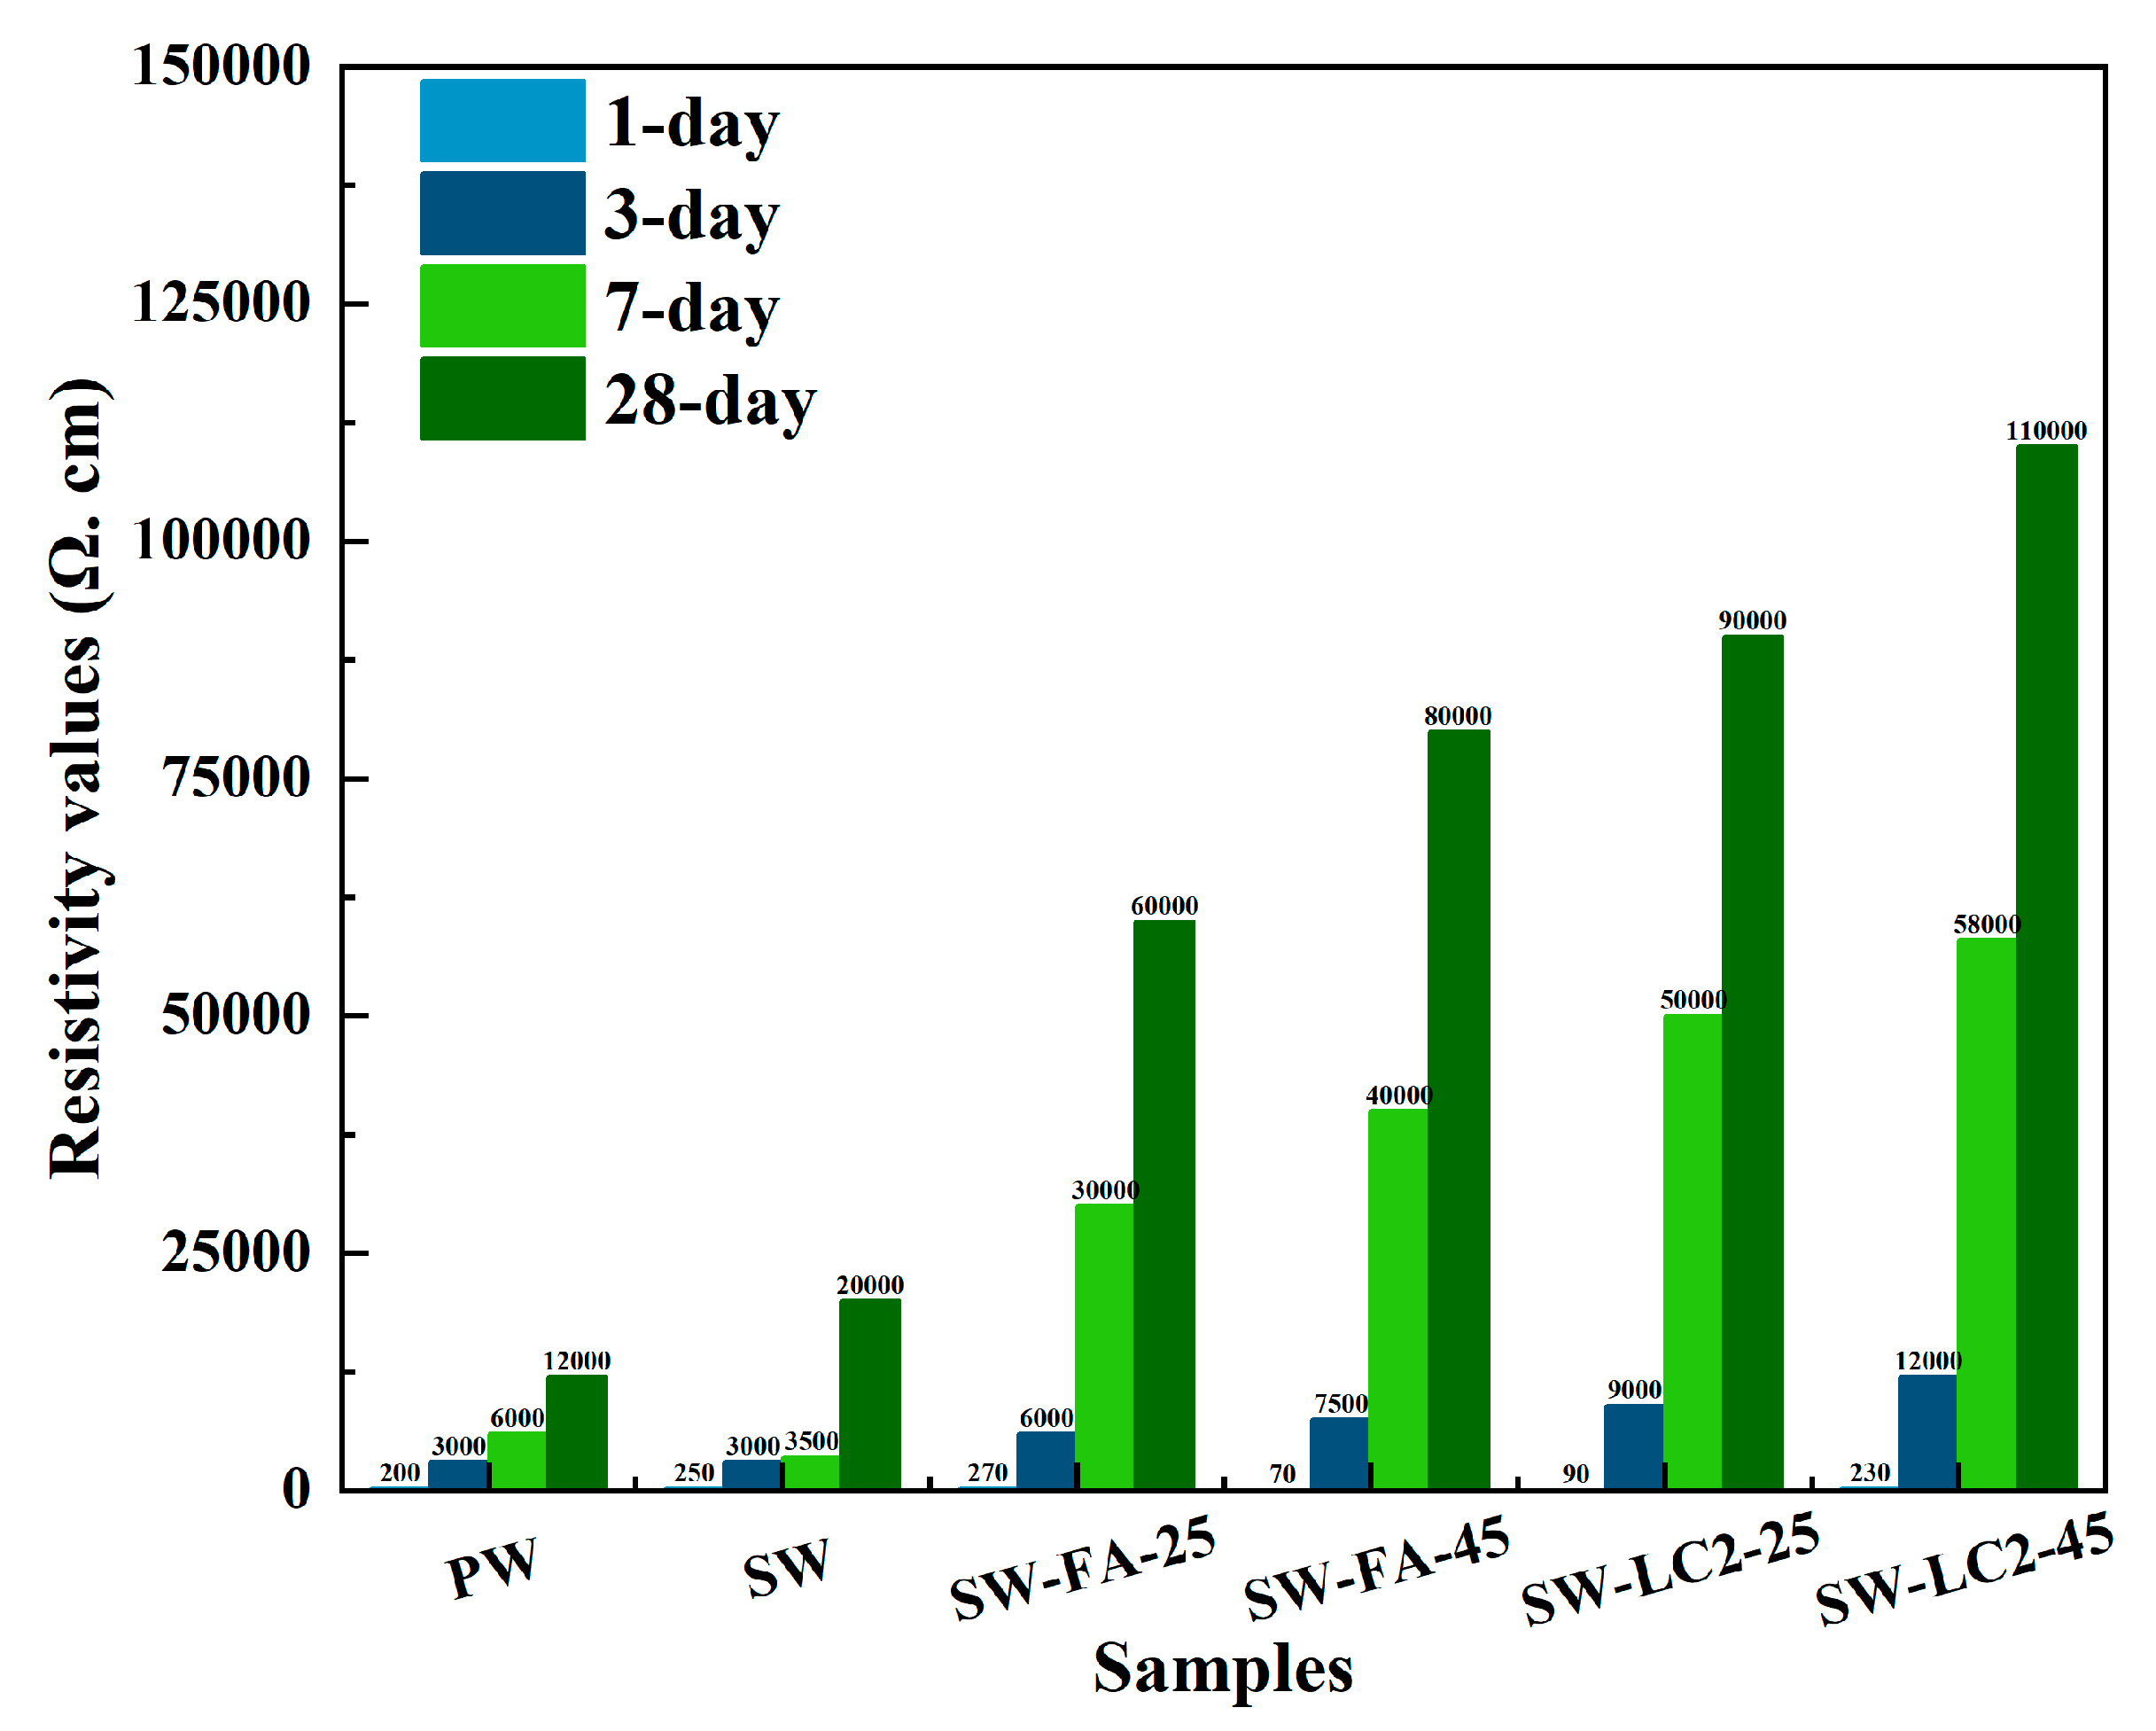
The surface resistivity values of all samples are summarised in Figure 6. In the cement paste, the resistivity values of cement are increased from 12,000 to 80,000 Ω. cm. In addition, the resistivity values of samples with different mix ratios increased as the curing time progressed. The hydration process results in an increase in surface resistivity values due to the improvement of pore structure.
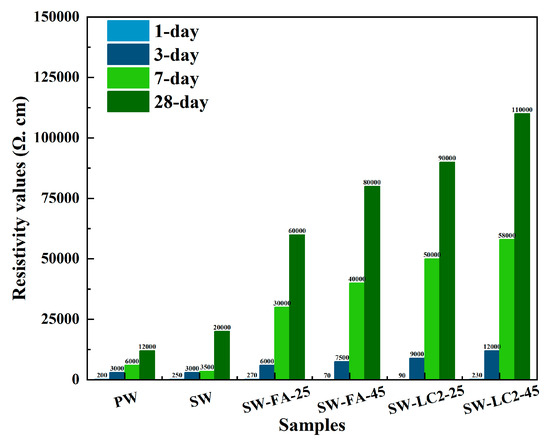
Figure 6.
Summary of resistivity values (Ω. cm) of cement at 1–28 days.
When comparing PW and SW, the SW had a higher surface resistivity of 28 days but a lower surface resistivity of 1–7 days due to the abundant dissolved salt in seawater; increasing the pore solution concentration reduces the surface resistivity in the early stage of hydration. However, as hydration progresses, elevated ionic activity enhances the chemical reactions between cement particles and water molecules, thereby accelerating the formation of hydration products like calcium silicate hydrate and calcium aluminate hydrate; this promotes the overall hydration process, and then the pore structure is more compact.
When comparing SW, SW-FA-25, and SW-FA-45, the SW-FA-45 had the highest surface resistivity due to the fact that fly ash can promote cement hydration in cement-based materials in many ways by virtue of its active Si-Al composition, pozzolanic effect, morphological advantages, and micro-aggregate filling. Additionally, improving the pore structure increases the surface resistivity. Also, incorporating more fly ash into cement will have a more apparent effect on accelerating the hydration process and impacting pore structure.
When comparing SW, SW-LC2-25, and SW- LC2-45, incorporating LC2 into cement accelerates hydration and improves pore structure due to calcined limestone clay directly participating in and promoting cement hydration by providing active Si and Al sources, exerting pozzolanic effect and improving slurry structure and pore filling.
4. Conclusions
The present work examines the experimental design utilizing electrochemical impedance spectroscopy (EIS) to investigate the hydration process of a cementitious composite incorporating fly ash, LC2, and seawater. Upon analysis of the study outcomes, several inferences may be drawn:
- Guided by the distinctive electrochemical attributes of the fly ash, LC2, and seawater cement materials hydration process, a groundbreaking EC Model 2 was devised for monitoring the progression of cement hydration.
- Analysis of the novel EC model reveals that the combination of LC2, fly ash, and seawater creates a synergistic effect that significantly accelerates the hydration process. Notably, increasing the content of LC2 and fly ash enhances this acceleration, suggesting that precise adjustments in their proportions can be strategically used to tailor the hydration kinetics for specific performance requirements in cementitious materials.
- When seawater is used to replace freshwater in cement mixtures, the incorporation of LC2 (limestone and calcined clay) has been shown to more effectively accelerate the hydration process and enhance the pore structure of the cement more effectively than the use of fly ash. This superior performance of LC2 can be attributed to its unique chemical and mineralogical composition, which reacts more rapidly with the available ions in seawater, resulting in the development of more compact hydration products. These products fill the capillary pores more effectively, reducing porosity and resulting in a more refined microstructure. In contrast, while fly ash also contributes to hydration, its slower reactivity and less pronounced effect on pore structure make LC2 a more advantageous additive when optimizing for early strength and durability, particularly in environments where seawater is utilized.
Author Contributions
Methodology, L.C.; Software, L.C. and J.L.; Investigation, F.G.; Writing—original draft, F.G. and L.C.; Writing—review & editing, L.C., J.L. and J.Z.; Visualization, L.C. and J.Z.; Project administration, F.G. and J.L. All authors have read and agreed to the published version of the manuscript.
Funding
The work described in this paper was fully supported by grants Key-Area Research and Development Program of Guangdong Province (2019B111107002), National Natural Science Foundation of China (52178234) and Guangdong Provincial Key Laboratory of Durability for Marine Civil Engineering (SZU) (2020B1212060074).
Informed Consent Statement
Not applicable.
Data Availability Statement
The data will be made available upon request.
Conflicts of Interest
Author Fangsheng Gao is employed by Shenzhen Antuoshan Concrete Co., Ltd. The remaining authors declare that the research was conducted in the absence of any commercial or financial relationships that could be construed as a potential conflict of interest.
References
- Bahhou, A.; Taha, Y.; Hakkou, R.; Benzaazoua, M.; Tagnit-Hamou, A. Assessment of hydration, strength, and microstructure of three different grades of calcined marls derived from phosphate by-products. J. Build. Eng. 2024, 84, 108640. [Google Scholar] [CrossRef]
- Liu, S.; Wang, Y.; Wu, A.; Shi, D.; Yang, S.; Ruan, Z.; Song, X.; Zhang, M. Early mechanical strength, hydration mechanism and leaching behavior of alkali-activated slag/fly ash paste filling materials. J. Build. Eng. 2024, 84, 108481. [Google Scholar] [CrossRef]
- Ming, X.; Si, W.; Yu, Q.; Sun, Z.; Qiu, G.; Cao, M.; Li, Y.; Li, Z. Molecular insight into the initial hydration of tricalcium aluminate. Nat. Commun. 2024, 15, 2929. [Google Scholar] [CrossRef]
- Yang, J.; Chen, C.; Chen, S.; Ren, Y.; Lu, J. Resource utilization of drinking water treatment aluminum sludge in green cementing materials: Hydration characteristics and hydration kinetics. J. Environ. Sci. 2024, 144, 236–248. [Google Scholar] [CrossRef]
- Zhang, C.; Song, W.; Taheri, A.; Fu, J.; Zhao, T.; Tan, Y. Hydration mechanism and mechanical-thermal correlation of cemented paste backfill under different curing temperatures. J. Build. Eng. 2024, 85, 108691. [Google Scholar] [CrossRef]
- Zheng, H.; Duan, Y.; Li, M.; Hou, D.; Wang, P.; Chen, J.; Li, S. Reaction molecular dynamics study of calcium alumino-silicate hydrate gel in the hydration deposition process at the calcium silicate hydrate interface: The influence of Al/Si. J. Build. Eng. 2024, 86, 108823. [Google Scholar] [CrossRef]
- Leng, D.; Fu, Q.; Ge, Y.; He, C.; Lv, Y.; Li, X. Effect of K+ Diffusion on Hydration of Magnesium Potassium Phosphate Cement with Different Mg/P Ratios: Experiments and Molecular Dynamics Simulation Calculations. Materials 2024, 17, 1151. [Google Scholar] [CrossRef] [PubMed]
- Jiang, K.; Yu, H.; Sun, Z.; Lei, Z.; Li, K.; Wang, L. Zero-Emission Cement Plants with Advanced Amine-Based CO2 Capture. Environ. Sci. Technol. 2024, 58, 6978–6987. [Google Scholar] [CrossRef]
- Liao, G.; Wang, D.; Wang, W.; He, Y. Microstructure, strength development mechanism, and CO2 emission analyses of alkali-activated fly ash-slag mortars. J. Clean. Prod. 2024, 442, 141116. [Google Scholar] [CrossRef]
- Pehl, M.; Schreyer, F.; Luderer, G. Modelling long-term industry energy demand and CO2 emissions in the system context using REMIND (version 3.1.0). Geosci. Model Dev. 2024, 17, 2015–2038. [Google Scholar] [CrossRef]
- Lazorenko, G.; Kravchenko, E.; Kasprzhitskii, A.; Fini, E.H. An evaluation of the environmental impact and energy efficiency of producing geopolymer mortar with plastic aggregates. Resour. Conserv. Recycl. Adv. 2024, 22, 200216. [Google Scholar] [CrossRef]
- Kravchenko, E.; Lu, W.; Sauerwein, M.; Wong, A.H.K. Life cycle assessment of waste materials in deep cement mixing for land reclamation in Hong Kong. Environ. Impact Assess. Rev. 2024, 105, 107398. [Google Scholar] [CrossRef]
- Gao, Y.; Zhu, Z.; Zhu, J.; Hu, X. Study on the mechanical properties and water stability of steel slag-fly ash geopolymer for base Stabilisation. Int. J. Pavement Eng. 2024, 25, 2308168. [Google Scholar] [CrossRef]
- Kampala, A.; Suebsuk, J.; Sakdinakorn, R.; Arngbunta, A.; Chindaprasirt, P. Coal-biomass fly ash as cement replacement in loess stabilisation for road materials. Int. J. Pavement Eng. 2024, 25, 2296956. [Google Scholar] [CrossRef]
- Xu, W.; Niu, X.; Zhu, Y. Deformation behavior and damage evaluation of fly ash-slag based geopolymer concrete under cyclic tension. J. Build. Eng. 2024, 86, 108664. [Google Scholar] [CrossRef]
- Liu, J.; Xing, F.; Dong, B.; Ma, H.; Pan, D. Study on Surface Permeability of Concrete under Immersion. Materials 2014, 7, 876–886. [Google Scholar] [CrossRef] [PubMed]
- Zhang, Y.; Zhu, X.; Shah, S.P. Reinforcing efficiency of nanomaterials on mechanical and interfacial characteristics of green concrete incorporating fly ash cenosphere. J. Clean. Prod. 2024, 447, 141531. [Google Scholar] [CrossRef]
- Zhang, W.; Zheng, C.; Li, Z.; Jin, H.; Liu, J.; Zhu, J.; Liu, W.; Xing, F. Investigation on mechanical properties improvement of seawater engineered cementitious composites (ECC) using FA/LC2. Constr. Build. Mater. 2022, 345, 128271. [Google Scholar] [CrossRef]
- Govindarajan, D.; Gopalakrishnan, R. Magnetic susceptibility measurements on metakaolin admixtured cement hydrated with ground water and sea water. Int. J. Miner. Metall. Mater. 2009, 16, 349–354. [Google Scholar] [CrossRef]
- Xiong, L.; Liu, C. Dynamic mechanical properties of cement mortar after corroded by sea water. Chin. J. Rock Mech. Eng. 2013, 32, 2481–2488. [Google Scholar]
- Etxeberria, M.; Gonzalez-Corominas, A. Properties of Plain Concrete Produced Employing Recycled Aggregates and Sea Water. Int. J. Civ. Eng. 2018, 16, 993–1003. [Google Scholar] [CrossRef]
- Sosa Gallardo, A.F.; Provis, J.L. Electrochemical cell design and impedance spectroscopy of cement hydration. J. Mater. Sci. 2021, 56, 1203–1220. [Google Scholar] [CrossRef]
- Fang, Q.; Li, S. Electrochemical Impedance Spectroscopy Study on Hydration Feature of Calcium Sulfoaluminate Cements. Int. J. Electrochem. Sci. 2019, 14, 5042–5050. [Google Scholar] [CrossRef]
- Li, C.; Fan, Y.; Li, Q. Performance of Cement Paste with Metakaolin Based on Electrochemical Impedance Spectroscopy. J. Build. Mater. 2020, 23, 755–762. [Google Scholar]
- Song, G.L. Equivalent circuit model for AC electrochemical impedance spectroscopy of concrete. Cem. Concr. Res. 2000, 30, 1723–1730. [Google Scholar] [CrossRef]
- Dong, B.; Qiu, Q.; Gu, Z.; Xiang, J.; Huang, C.; Fang, Y.; Xing, F.; Liu, W. Characterization of carbonation behavior of fly ash blended cement materials by the electrochemical impedance spectroscopy method. Cem. Concr. Compos. 2016, 65, 118–127. [Google Scholar] [CrossRef]
- GB175-2007; Common Portland Cement. General Administration of Quality Supervision, Inspection and Quarantine of the People’s Republic of China. National Standardization Administration of China: Beijing, China; Standards Press of China: Beijing, China, 2007.
- GB1596-2017; Fly Ash Used for Cememt and Concrete. General Administration of Quality Supervision, Inspection and Quarantine of the People’s Republic of China. National Standardization Administration of China: Beijing, China, 2017.
- Randle, J.E.B. Kinetics of Rapid Electrode Reactions. Faraday Soc. 1947, 1, 11–19. [Google Scholar] [CrossRef]
- Ping, X.; Ping, G.; Xu, Z.Z.; Beaudoin, J.J. A rationalized ac impedance model for microstructural characterization of hydrating cement systems. Cem. Concr. Res. 1993, 23, 359–367. [Google Scholar]
- Double, D.D.; Hellawell, A.; Perry, S.J. Hydration of portland-cement. Proc. R. Soc. Lond. Ser. A-Math. Phys. Eng. Sci. 1978, 359, 435. [Google Scholar] [CrossRef]
- Wei, X.; Xiao, L.; Li, Z. Electrical Measurement to Assess Hydration Process and the Porosity Formation. J. Wuhan Univ. Technol.-Mater. Sci. Ed. 2008, 23, 761–766. [Google Scholar] [CrossRef]


Disclaimer/Publisher’s Note: The statements, opinions and data contained in all publications are solely those of the individual author(s) and contributor(s) and not of MDPI and/or the editor(s). MDPI and/or the editor(s) disclaim responsibility for any injury to people or property resulting from any ideas, methods, instructions or products referred to in the content. |
© 2024 by the authors. Licensee MDPI, Basel, Switzerland. This article is an open access article distributed under the terms and conditions of the Creative Commons Attribution (CC BY) license (https://creativecommons.org/licenses/by/4.0/).