Abstract
The Giant Panda National Park (GPNP) and its surrounding areas constitute a comprehensive ecosystem aimed at protecting the natural habitat of giant pandas, maintaining biodiversity, and ensuring ecological balance. Investigating the spatial correlation between landscape pattern indices and ecological sensitivity (ES) in this area is a crucial step in the construction of ecological civilization and contributes significantly to ecological conservation, restoration, and environmental management. This study utilized Geographic Information Systems (GIS) and Fragstats software to select nine ecological evaluation factors and four landscape pattern indices to comprehensively evaluate the ES and landscape patterns of the GPNP and its surrounding areas. This study discovered that the ecological sensitivity of the GPNP is substantially higher than that of the neighboring areas, with the northern Qionglai Mountain area and the western Minshan area showing the highest concentrations of exceptionally high sensitivity. Highly sensitive areas account for 35.22% of the study region, concentrated in areas within the national park, except the Qinling area, as well as the western and southern surrounding areas. The distribution of moderately sensitive areas is more uniform, while low and insensitive areas are found primarily in the northern and eastern areas, along with the national park’s environs. Patch density (PD) within the GPNP is lower than in surrounding areas, with higher PD in the northern and central parts. The landscape division index (DIVISION) decreases from west to east, and the landscape disturbance index (LDI) is significantly lower within the national park than in surrounding areas, with small areas of high LDI in the entire study region. Moran’s index analysis of the GPNP and its surrounding areas shows that ecological sensitivity is positively correlated with landscape pattern indices (PD, SPLIT, DIVISION, and LDI), with the strongest correlation between DIVISION and ecological sensitivity. Spatially, the internal areas of the national park have lower landscape pattern indices but higher ecological sensitivity, while the eastern region exhibits severe landscape fragmentation. Major clusters of high and low values are found around the Qionglai-Daxiangling area, indicating that these areas of high ecological sensitivity have complex landscape structures, numerous habitat edges, and significant impacts on biodiversity and ecological processes. Overall, the areas surrounding the GPNP exhibit lower ecological sensitivity levels and higher landscape fragmentation, emphasizing the need for focused ecological protection in the northern part of the QLS region and the western part of the MS region. Additionally, attention should be given to the impact of landscape fragmentation in the surrounding areas in the interior of the GPNP. These results provide scientific evidence for the sustainable development of the GPNP and its surrounding areas.
1. Introduction
The GPNP has effectively restored habitats for rare species and enhanced ecosystem integrity and connectivity by integrating protected areas and constructing ecological corridors [1,2,3]. Ecological sensitivity in nature reserves and national parks describes how sensitive the ecosystem is to human and natural disturbances, indicating the possibility of issues developing and the possible effects of outside disturbances in the national park and its environs [4,5]. Landscape pattern indices are quantitative measures of landscape structural characteristics, helping to understand and assess the spatial organization of landscapes and their impact on ecological processes [6,7]. In the process of building a national park system, changes in ES and the landscape pattern index intuitively reflect the level of regional ecological health and the protection status of wildlife habitats [8,9]. It is essential to comprehend the dynamic features of these changes in landscape structure in order to improve habitat restoration and protect the overall integrity of ecosystems within national parks. Our research objective is to provide policymakers at the local, regional, and national levels with valuable and optimal information on national park protected areas, which is also the most important issue in the national park protection system [10,11,12,13]. Effective communication of this information is crucial for maintaining ecosystem services and biodiversity, as well as promoting human well-being [14].
Landscape pattern indices are quantitative metrics used to describe and analyze the spatial distribution, shape, and size of various patch kinds within a landscape, demonstrating the landscape’s diversity and fragmentation [14]. Analyzing landscape pattern indices in the GPNP and its surrounding areas helps assess ecosystem integrity and biodiversity, providing a scientific basis for conservation planning and management. Existing studies on landscape pattern indices often focus on national parks. For instance, He et al. analyzed forest resources and DEM data of Yabuli Forest Park using GIS technology and Fragstats software to study landscape composition, patch features, and geographical distribution in 2014, finding that topography and human activities significantly influenced landscape distribution and characteristics [15]. Jung et al. used landscape pattern indices and GIS analysis to reveal forest fragmentation issues in the Nakdong River Basin, highlighting the need for new forest management policies to improve forest ecosystem sustainability and connectivity [16]. Li et al. analyzed landscape types and pattern indices in the Yellow River Delta between 2005 and 2018, emphasizing the importance of optimizing the development of unused areas for the sustainability of land resources and economic development [17].
Ecological sensitivity refers to an ecosystem’s ability to respond to external disturbances or changes, including its adaptability and resilience to climate change, pollution, and other disruptions, reflecting the ecosystem’s vulnerability [4,5]. Previous studies on ecological sensitivity, such as that by Yilmaz, F. C. et al., evaluated the ecological sensitivity of Denizli Province using GIS and the Analytic Hierarchy Process (AHP), identifying the impact of natural and cultural factors on sensitivity and proposing a balance in spatial planning and conservation utilization based on sensitivity levels [18]. Zheng, Yu, et al. used GIS and AHP methods to quantify the visual and ecological sensitivity of Fujian Tianzhushan National Forest Park, identify functional zoning, provide scientific decision support for multi-purpose planning, and develop urban forest parks sustainably [19]. This study uses nine indicators—elevation, slope, aspect, vegetation index, water buffer distance, temperature, land use, road buffer distance, and giant panda trace density—to calculate the spatial distribution characteristics of ES in the GPNP and its surrounding areas.
While existing studies have investigated landscape patterns and ecological sensitivity in other national parks or nature reserves, there has been a lack of exploration into the spatial correlation between landscape pattern evolution and ecological sensitivity in the Giant Panda National Park (GPNP) and its surrounding areas. Additionally, there has been insufficient attention to the comprehensive landscape pattern analysis of the linkage zones outside the protected areas. Investigating the spatial correlation between landscape pattern indices and ecological sensitivity in the GPNP and its surrounding areas provides a theoretical foundation for the sustainable development of giant panda habitats and landscape pattern optimization. Therefore, this study focuses on the GPNP and its surrounding areas, using ArcGIS 10.8, Fragstats, and GeoDa 1.18 software to analyze the spatial correlation between landscape pattern indices and ecological sensitivity. The main objectives of this study are as follows: (1) Investigating the spatial distribution characteristics of ecological sensitivity in the GPNP and its surrounding areas provides a robust foundation for subsequent environmental protection policies and the construction of ecological corridors within the park. (2) Conducting an in-depth study of the landscape fragmentation patterns in the GPNP and its surrounding areas allows for effective exploration of spatial variations in landscape fragmentation within the study region. (3) Analyzing the correlation between landscape fragmentation indices and ecological sensitivity offers a comprehensive understanding of the relationship between landscape pattern changes and the ecological environment, providing a more scientific and rational basis for future development of the GPNP.
2. Materials and Methods
2.1. Research Area
The GPNP is situated in western China and comprises the Baishuijiang area in Gansu Province, the Qinling area in Shaanxi Province, the Qionglai Mountains, the Minshan, the Daxiangling, and the Xiaoxiangling areas in Sichuan Province, with a total surface area of 27,134 square kilometers [20,21]. The establishment of the GPNP is meant to promote the integrity and connectivity of ecosystems and enhance biodiversity conservation by protecting giant pandas and their habitats. Geologically, the GPNP and its surrounding areas are situated at the junction of the Songpan-Ganzi fold system in the Tethys-Tibetan Geosyncline region and the Qinling fold system in the Kunlun-Qinling Geosyncline region. The terrain features high mountains, deep valleys, significant elevation differences, and rugged surfaces, making it one of the most complex topographical regions globally. Geographical coordinates range between 102°11′10″ E to 108°30′52″ E and 28°51′03″ N to 34°10′07″ N. The GPNP and its surrounding areas lie in a mid-latitude zone, transitioning from a continental north subtropical to a warm temperate monsoon climate. The complex terrain and mountain ranges create various microclimates. There is an average annual temperature range of 12–16 °C and 500–1200 mm of precipitation. With a 72.07% forest coverage rate, the GPNP has 19,556 square kilometers of forest land. Furthermore, being crucial for giant panda research and protection, the official establishment of the GPNP offers a fresh approach to the conservation of biodiversity worldwide. Additionally, it seeks to promote local economic development and improve residents’ living standards. In this study, the research area includes the GPNP and its surrounding regions. The surrounding area of the GPNP is defined as the adjacent cities neighboring the park. In Figure 1, the study area is depicted.
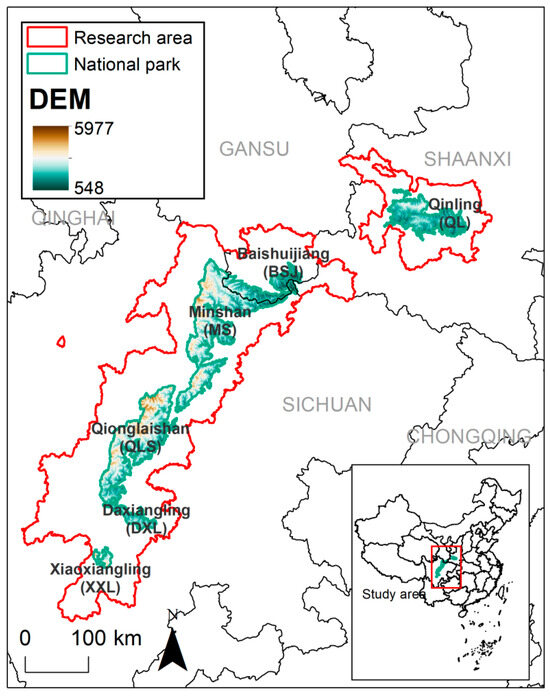
Figure 1.
Research area.
2.2. Data Sources
The geographic data foundation for this study includes provincial boundaries, roads, and other information sourced from the National Science and Technology Infrastructure of China (http://www.geodata.cn (accessed on 9 May 2024)) [22]. Elevation data with a resolution of 30 m was obtained from the Geospatial Data Cloud (https://www.gscloud.cn/ (accessed on 9 May 2024)) [23]. Using this elevation data, we extracted raster layers for slope and aspect factors via ArcGIS software. Land use data, also with a 30 m resolution, were sourced from the Data Center for Resources and Environmental Sciences of the Chinese Academy of Sciences [24]. Giant panda occurrence data within the study area were obtained from the Global Biodiversity Information Facility (https://www.gbif.org/ (accessed on 10 May 2024)) [25]. The Normalized Difference Vegetation Index (NDVI) data were sourced from NASA MOD13A2 (https://www.nasa.gov (accessed on 10 May 2024)) [26]. Temperature data were obtained from the United States Geological Survey and Google Earth Engine (https://earthengine.google.com/ (accessed on 10 May 2024), https://www.usgs.gov/ (accessed on 10 May 2024)) [27].
2.3. Methods
2.3.1. Calculation of the Ecological Sensitivity of the GPNP
In the methods section of this study, we developed an ecological sensitivity index (ESI) assessment framework to assess the ES of the GPNP and its surrounding areas. This assessment framework comprehensively considers multiple dimensions, including geological landforms, surface water systems, surface vegetation, animal trace sensitivity, and human activities [28,29,30]. The classification criteria were established based on a thorough analysis of previous literature, selection of the natural break method, and final expert collective evaluation to ensure the scientific validity and applicability of the assessment results, as detailed in Table 1 [28,29,30]. Geological landform evaluation factors included elevation and slope, and the classification criteria reflected the extent of terrain impact on ecological processes. Assessment of surface water systems categorized sensitivity levels based on water buffer distances, highlighting the importance of water environments to ecosystems. Surface vegetation evaluation utilized indicators such as NDVI values and temperature to assess vegetation coverage and growth conditions. Animal trace sensitivity evaluation was determined by giant panda trace density, emphasizing the importance of biodiversity conservation. Human activity impacts were measured through land use types and road buffer distances, revealing potential human impacts on ecosystems.

Table 1.
Ecological sensitivity assessment index grading for GPNP and its surrounding areas.
In this study, the weight allocation for ESI was determined using the Analytic Hierarchy Process (AHP), a mathematical method that determines weights by comparing the importance of assessment factors pairwise [31,32,33]. The Analytic Hierarchy Process (AHP) determines the relative importance between different levels by constructing a judgment matrix and calculating the weight vector. In this study, we developed an AHP model to assign weight proportions to ecological evaluation factors. The main steps involved are as follows: creating and distributing the AHP questionnaire; collecting the completed questionnaires and using the evaluation system to derive the judgment matrix for each level; and applying the geometric mean method to calculate the weight of each factor. The specific calculation process is detailed below:
Construct the judgment matrix.
In this formula, represents the importance of the -th element relative to the -th element. Since A is a positive reciprocal matrix, .
Weight calculation involves computing the geometric mean of each element in the judgment matrix A. In this formula, represents the geometric mean of the -th element.
Normalize the geometric means to obtain the weight vector , where represents the weight of the -th element.
Using eigenvalue decomposition, calculate the maximum eigenvalue () of the judgment matrix A.
Consistency check.
In this formula, CI is the Consistency Index, CR is the Consistency Ratio, and RI is the Random Consistency Index, determined based on the matrix order n. If CR ≤ 0.1 or CI = 0, the consistency of the judgment matrix is considered acceptable.
Finally, by multiplying and summing the scores of each evaluation factor by their weights, we derived a comprehensive ESI formula to reflect the region’s overall ecological sensitivity, as follows:
where represents the score determined for each evaluation factor based on its corresponding classification criteria, and denotes the weight of each evaluation factor. By summing the scores of all evaluation factors, each weighted according to its importance, a composite measure was derived that provided a comprehensive representation of the ecological sensitivity of the area.
2.3.2. Calculation of Landscape Fragmentation in the GPNP
In this study, a grid-based approach was employed to quantify landscape fragmentation in the GPNP and its surrounding areas. In this study, a grid-based GIS approach was used with grid cells as the evaluation units. Following previous research [34,35], a grid size of 2 to 5 times the average patch area was suggested as a reference. Based on the actual conditions of the study area and the workload, a 5 km × 5 km square grid was ultimately selected through expert discussion and encoded accordingly. Subsequently, the Fragstats software was utilized to calculate the splitting index (SPLIT), the patch density (PD) index, and the division index (DIVISION) [36,37,38]. These indices, respectively, reflect landscape homogeneity, the degree of separation between patches, and the dominance of specific landscape types. To integrate these indices, weights were assigned based on previous literature; PD, SPLIT, and DIVISION have respective weights of 0.5, 0.3, and 0.2 [39]. By applying weighted summation, a comprehensive index of landscape fragmentation was derived, providing a holistic assessment of the landscape fragmentation status in the study area [39]. To enhance the spatial continuity and accuracy of landscape data, Kriging interpolation was applied to interpolate landscape data within the grid cells. Kriging interpolation effectively mitigates data incompleteness and measurement errors, thereby improving the accuracy of landscape fragmentation analysis. The detailed calculations are shown in Table 2.
Table 2.
Calculation formula and explanation of landscape pattern index for GPNP and its surrounding areas.
2.3.3. Spatial Autocorrelation Analysis
In this study, we employed bivariate spatial autocorrelation analysis to investigate the spatial relationships between the ecological sensitivity index (ESI) and landscape fragmentation indices, including the splitting index (SPLIT), patch density (PD), and division index (DIVISION). This analysis intends to illuminate the spatial relationships and clustering patterns of these indices, providing vital insights into the spatial variability of ecological processes and patterns of landscape within the studied area [40,41,42]. Moran’s I index was utilized to quantify the spatial autocorrelation of each index, while local Moran’s I analysis was conducted to identify areas with significant spatial clustering of high or low values. By calculating Local Indicators of Spatial Association (LISA) values, we identified High-High (H-H) and Low-Low (L-L) spatial clusters, indicative of spatial aggregation effects related to ecological processes or anthropogenic activities. Additionally, we identified High-Low (H-L) and Low-High (L-H) spatial outliers, potentially indicating ecological transition zones or areas affected by human interventions. Through bivariate spatial autocorrelation analysis of the ESI and landscape structure indices, we expect to identify spatial coupling relationships between ES zones and specific landscape pattern characteristics. This is crucial for optimizing ecological conservation strategies and guiding land use planning and management. These discoveries will help us better understand the spatial distribution patterns of ecological processes and provide a scientific foundation for biodiversity conservation and ecosystem service maintenance.
3. Results
3.1. Individual Ecological Sensitivity
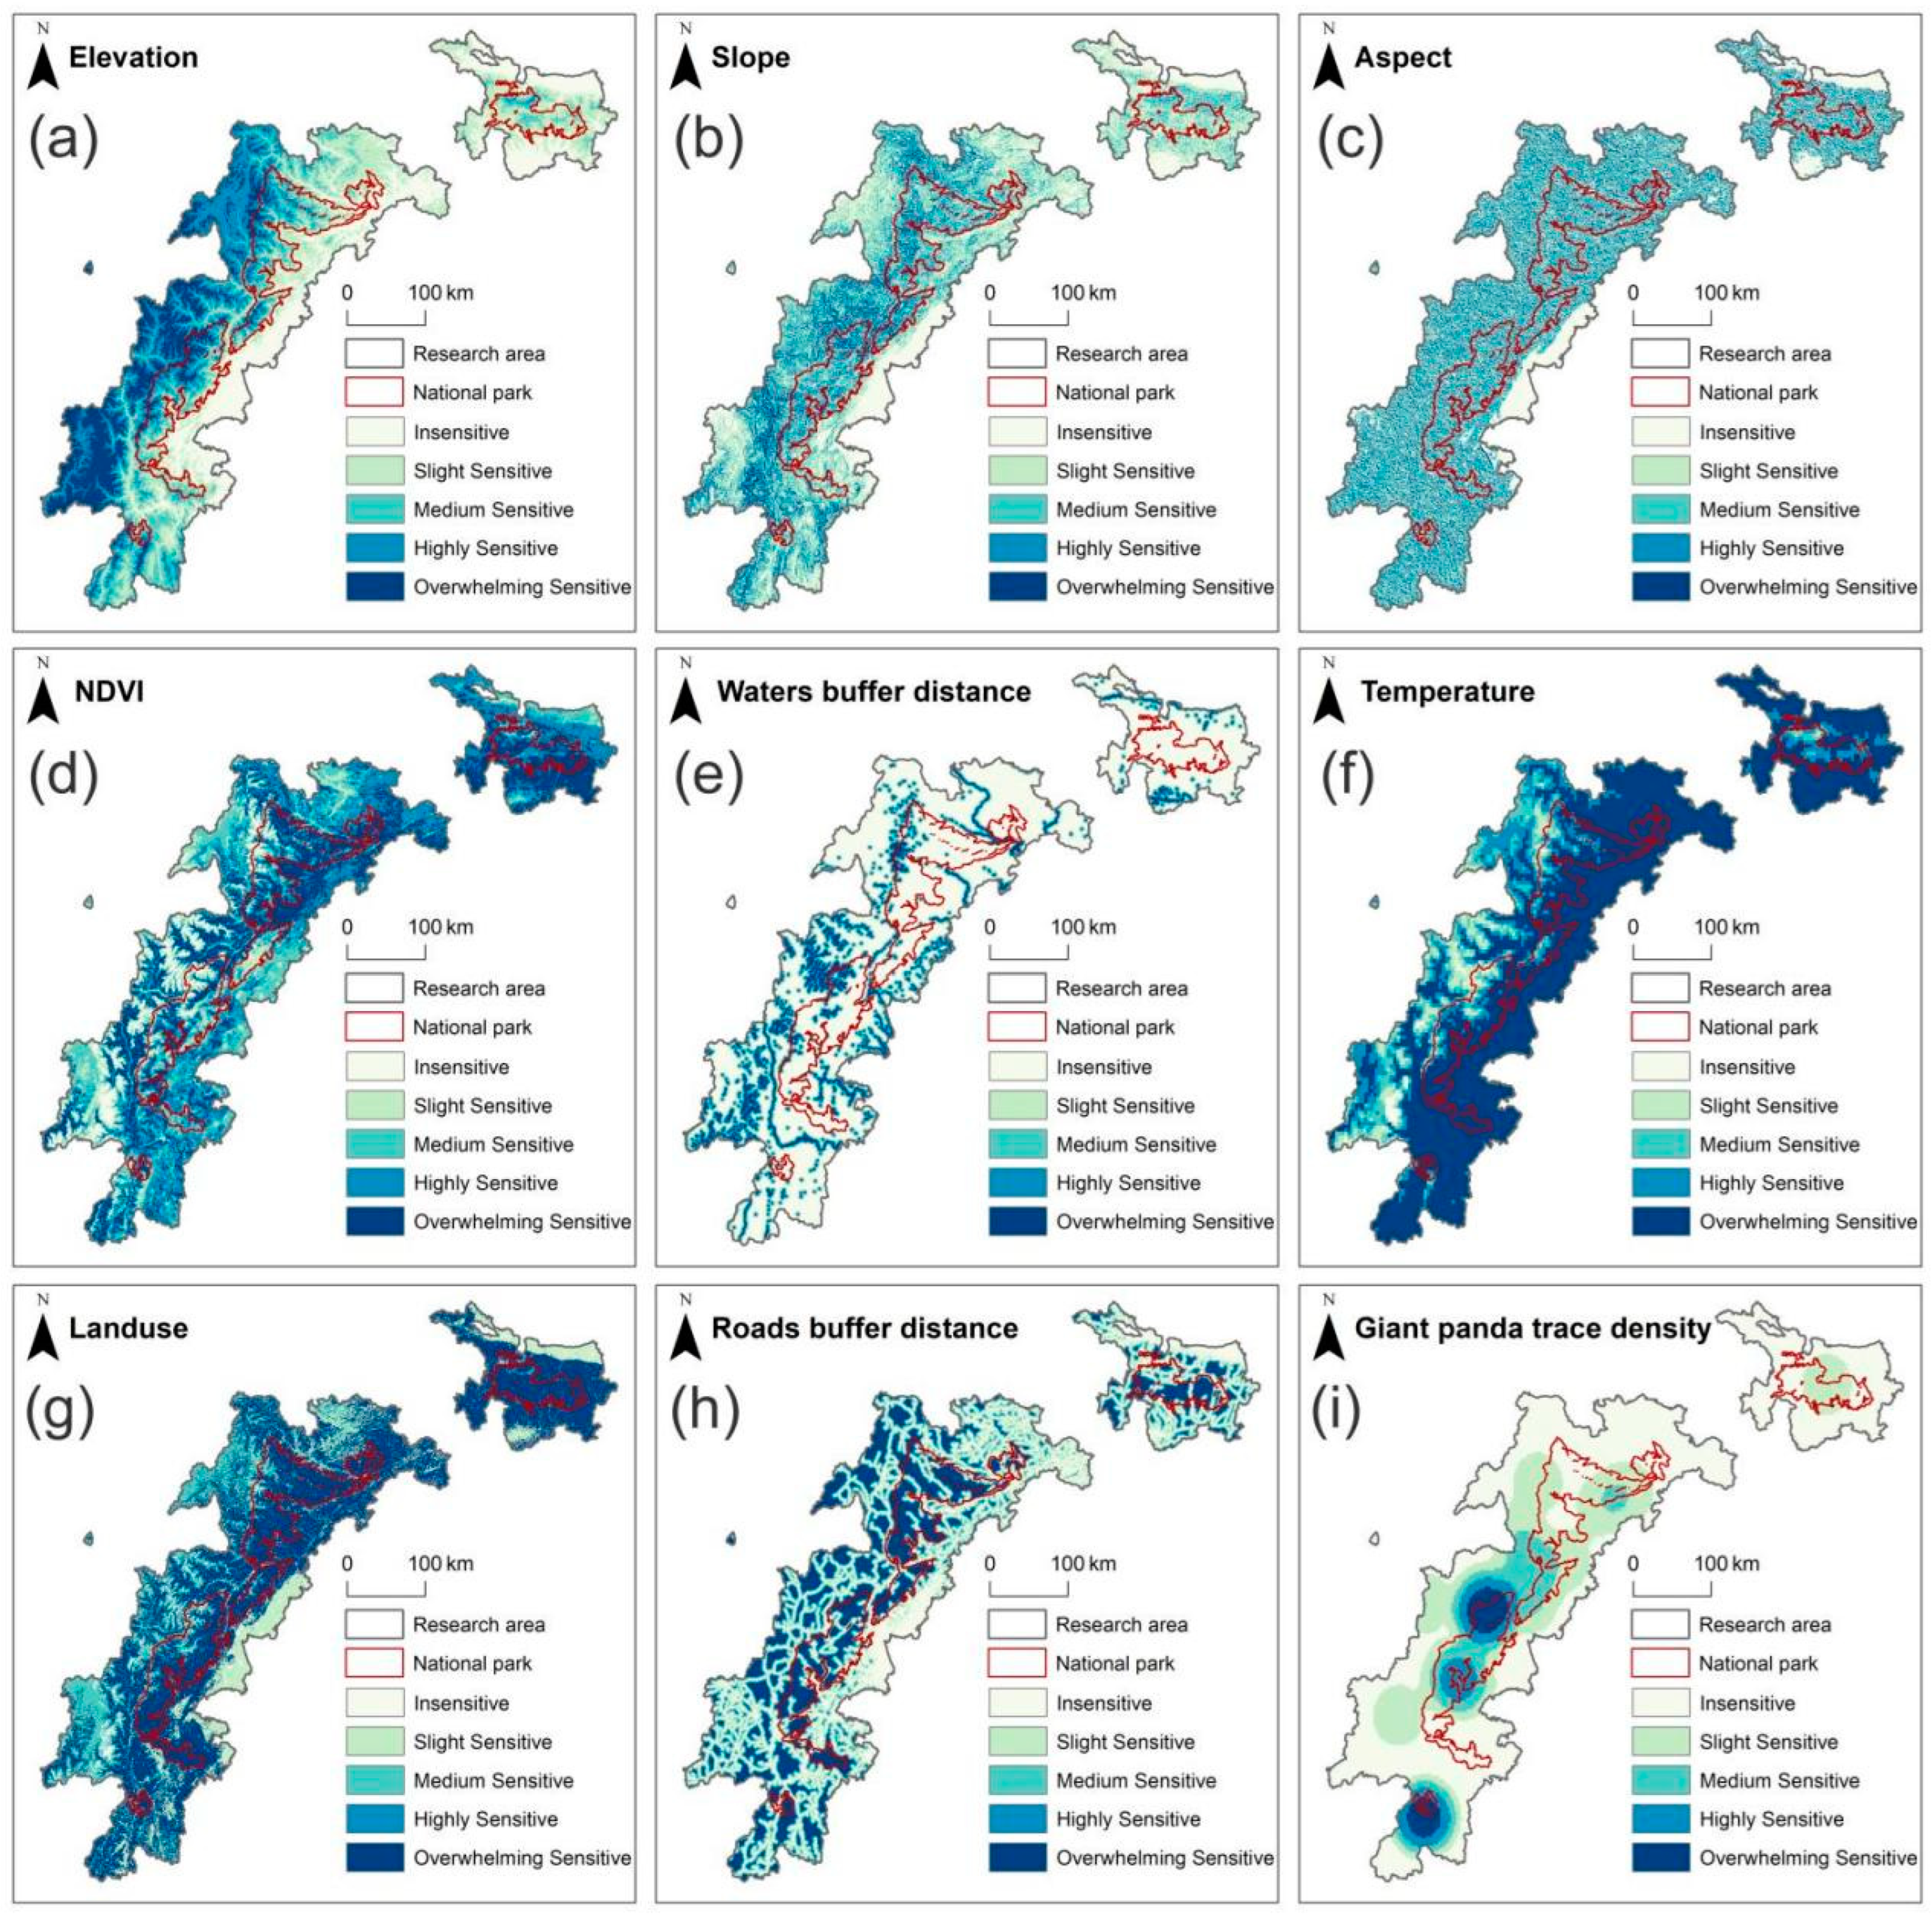
The terrain of the GPNP and its surrounding areas is predominantly mountainous, with significant variations in elevation. Using GIS software, we classified the ecological sensitivity index of the GPNP and its surrounding regions into five levels: insensitive, slightly sensitive, sensitive, highly sensitive, and overwhelming sensitive. Evaluation factors for sensitivity include elevation sensitivity, slope sensitivity, aspect sensitivity, vegetation sensitivity, water resource sensitivity, temperature sensitivity, land use sensitivity, road sensitivity, and animal trace sensitivity, as depicted in Figure 2.
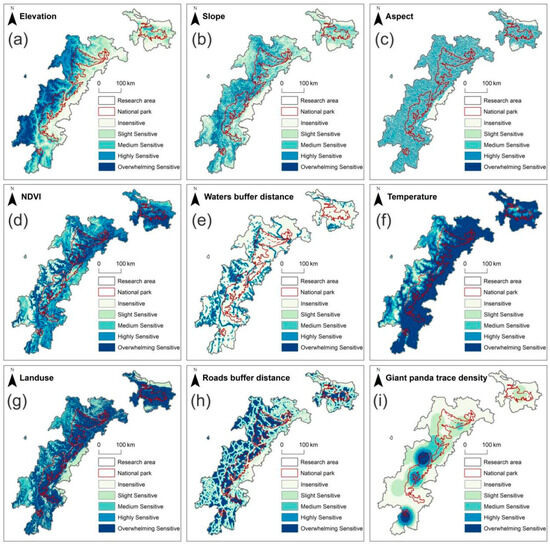
Figure 2.
Single ecological sensitivity. (a), Elevation ecological sensitivity; (b), Slope ecological sensitivity; (c), Aspect ecological sensitivity; (d), NDVI ecological sensitivity; (e), Water body ecological sensitivity; (f), Temperature ecological sensitivity; (g), Landuse ecological sensitivity; (h), Roads buffer distance ecological sensitivity; (i), Giant panda trace density ecological sensitivity.
The elevation sensitivity analysis (as shown in Figure 2a) indicates a sensitivity gradient decreasing from the overwhelming sensitive areas in the west to the insensitive areas in the east. Figure 2b displays the slope sensitivity analysis, where the western regions of the GPNP and its surroundings are predominantly classified as highly sensitive and medium sensitive, while the eastern regions are mainly insensitive and slightly sensitive. Figure 2d presents the vegetation sensitivity analysis, highlighting predominantly high and overwhelming sensitivity zones. The vegetation coverage sensitivity in the northeastern part of the study area is primarily classified as overwhelming sensitive. Figure 2e shows the water buffer distance sensitivity analysis, with higher sensitivity in the peripheral areas compared to the park’s interior. Specifically, the Qinling area within the park is mainly characterized as insensitive. Figure 2g depicts the land use sensitivity analysis, where vegetation predominance within the park results in sensitivity levels that are primarily classified as overwhelming sensitive. Figure 2h shows the road buffer distance sensitivity analysis, with the northwest and southwest regions of the study area being concentrated zones of overwhelming sensitive areas, while the study area has far fewer roads than other locations. Figure 2i depicts the sensitivity analysis of giant panda tracks, which are frequently found in the center and southern portions of the research area, namely the QLS, MS southern area, XXL area, and surrounding regions, with relatively fewer sightings in other areas.
3.2. Ecological Sensitivity
The comprehensive sensitivity analysis results are depicted in Figure 3 and Table 3. Overall, the ecological sensitivity levels within the national park are substantially higher than those in its surroundings. Within the national park, regions of overwhelming sensitivity are mostly centered in the northern part of the QLS area (1639 km2) and the western part of the MS area (1118 km2). In the surrounding areas of the national park, zones of overwhelming sensitivity are mainly concentrated in the western regions with relatively intact vegetation ecology. Specifically, the total area of overwhelming sensitivity within the national park is 2930 km2, representing 10.97% of the national park’s total area. Furthermore, the area classified as highly sensitive within the study region totals 9410 km2 (35.22%). Among these, within the national park, highly sensitive areas are predominantly situated in areas other than the QL area (600 km2), totaling 8792.28 km2. Surrounding the national park, highly sensitive areas are centered in the western and southern regions. The total area classified as moderately sensitive within the study region is 35,592 km2 (28.79%) evenly distributed across the study area. Within the national park, the area classified as moderately sensitive is 9560 km2, representing 35.78% of the national park’s total area. Areas classified as low-sensitivity cover 4277 km2 (16.01%), concentrated in the northern and eastern regions of the national park. Within the national park, low-sensitivity areas are primarily concentrated in the QLS area (1031 km2), QL area (1352 km2), and MS area (1115.01 km2). Areas classified as insensitive cover 542 km2 (2.03%), primarily located in the eastern part of the study area, with a small proportion within the national park.
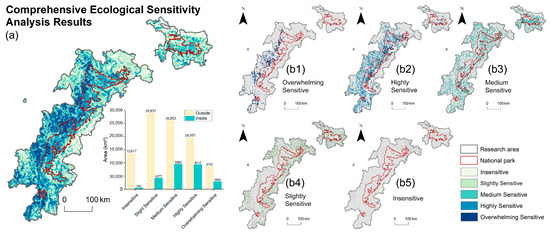
Figure 3.
Comprehensive ecological sensitivity analysis results. (a), Integrated ecological sensitivity; (b1), Overwhelming sensitive; (b2), Highly sensitive; (b3), Medium sensitive; (b4), Slightly sensitive; (b5), Insensitive.
Table 3.
Results of ecological sensitivity assessment.
3.3. Results of Landscape Pattern Indices Calculation
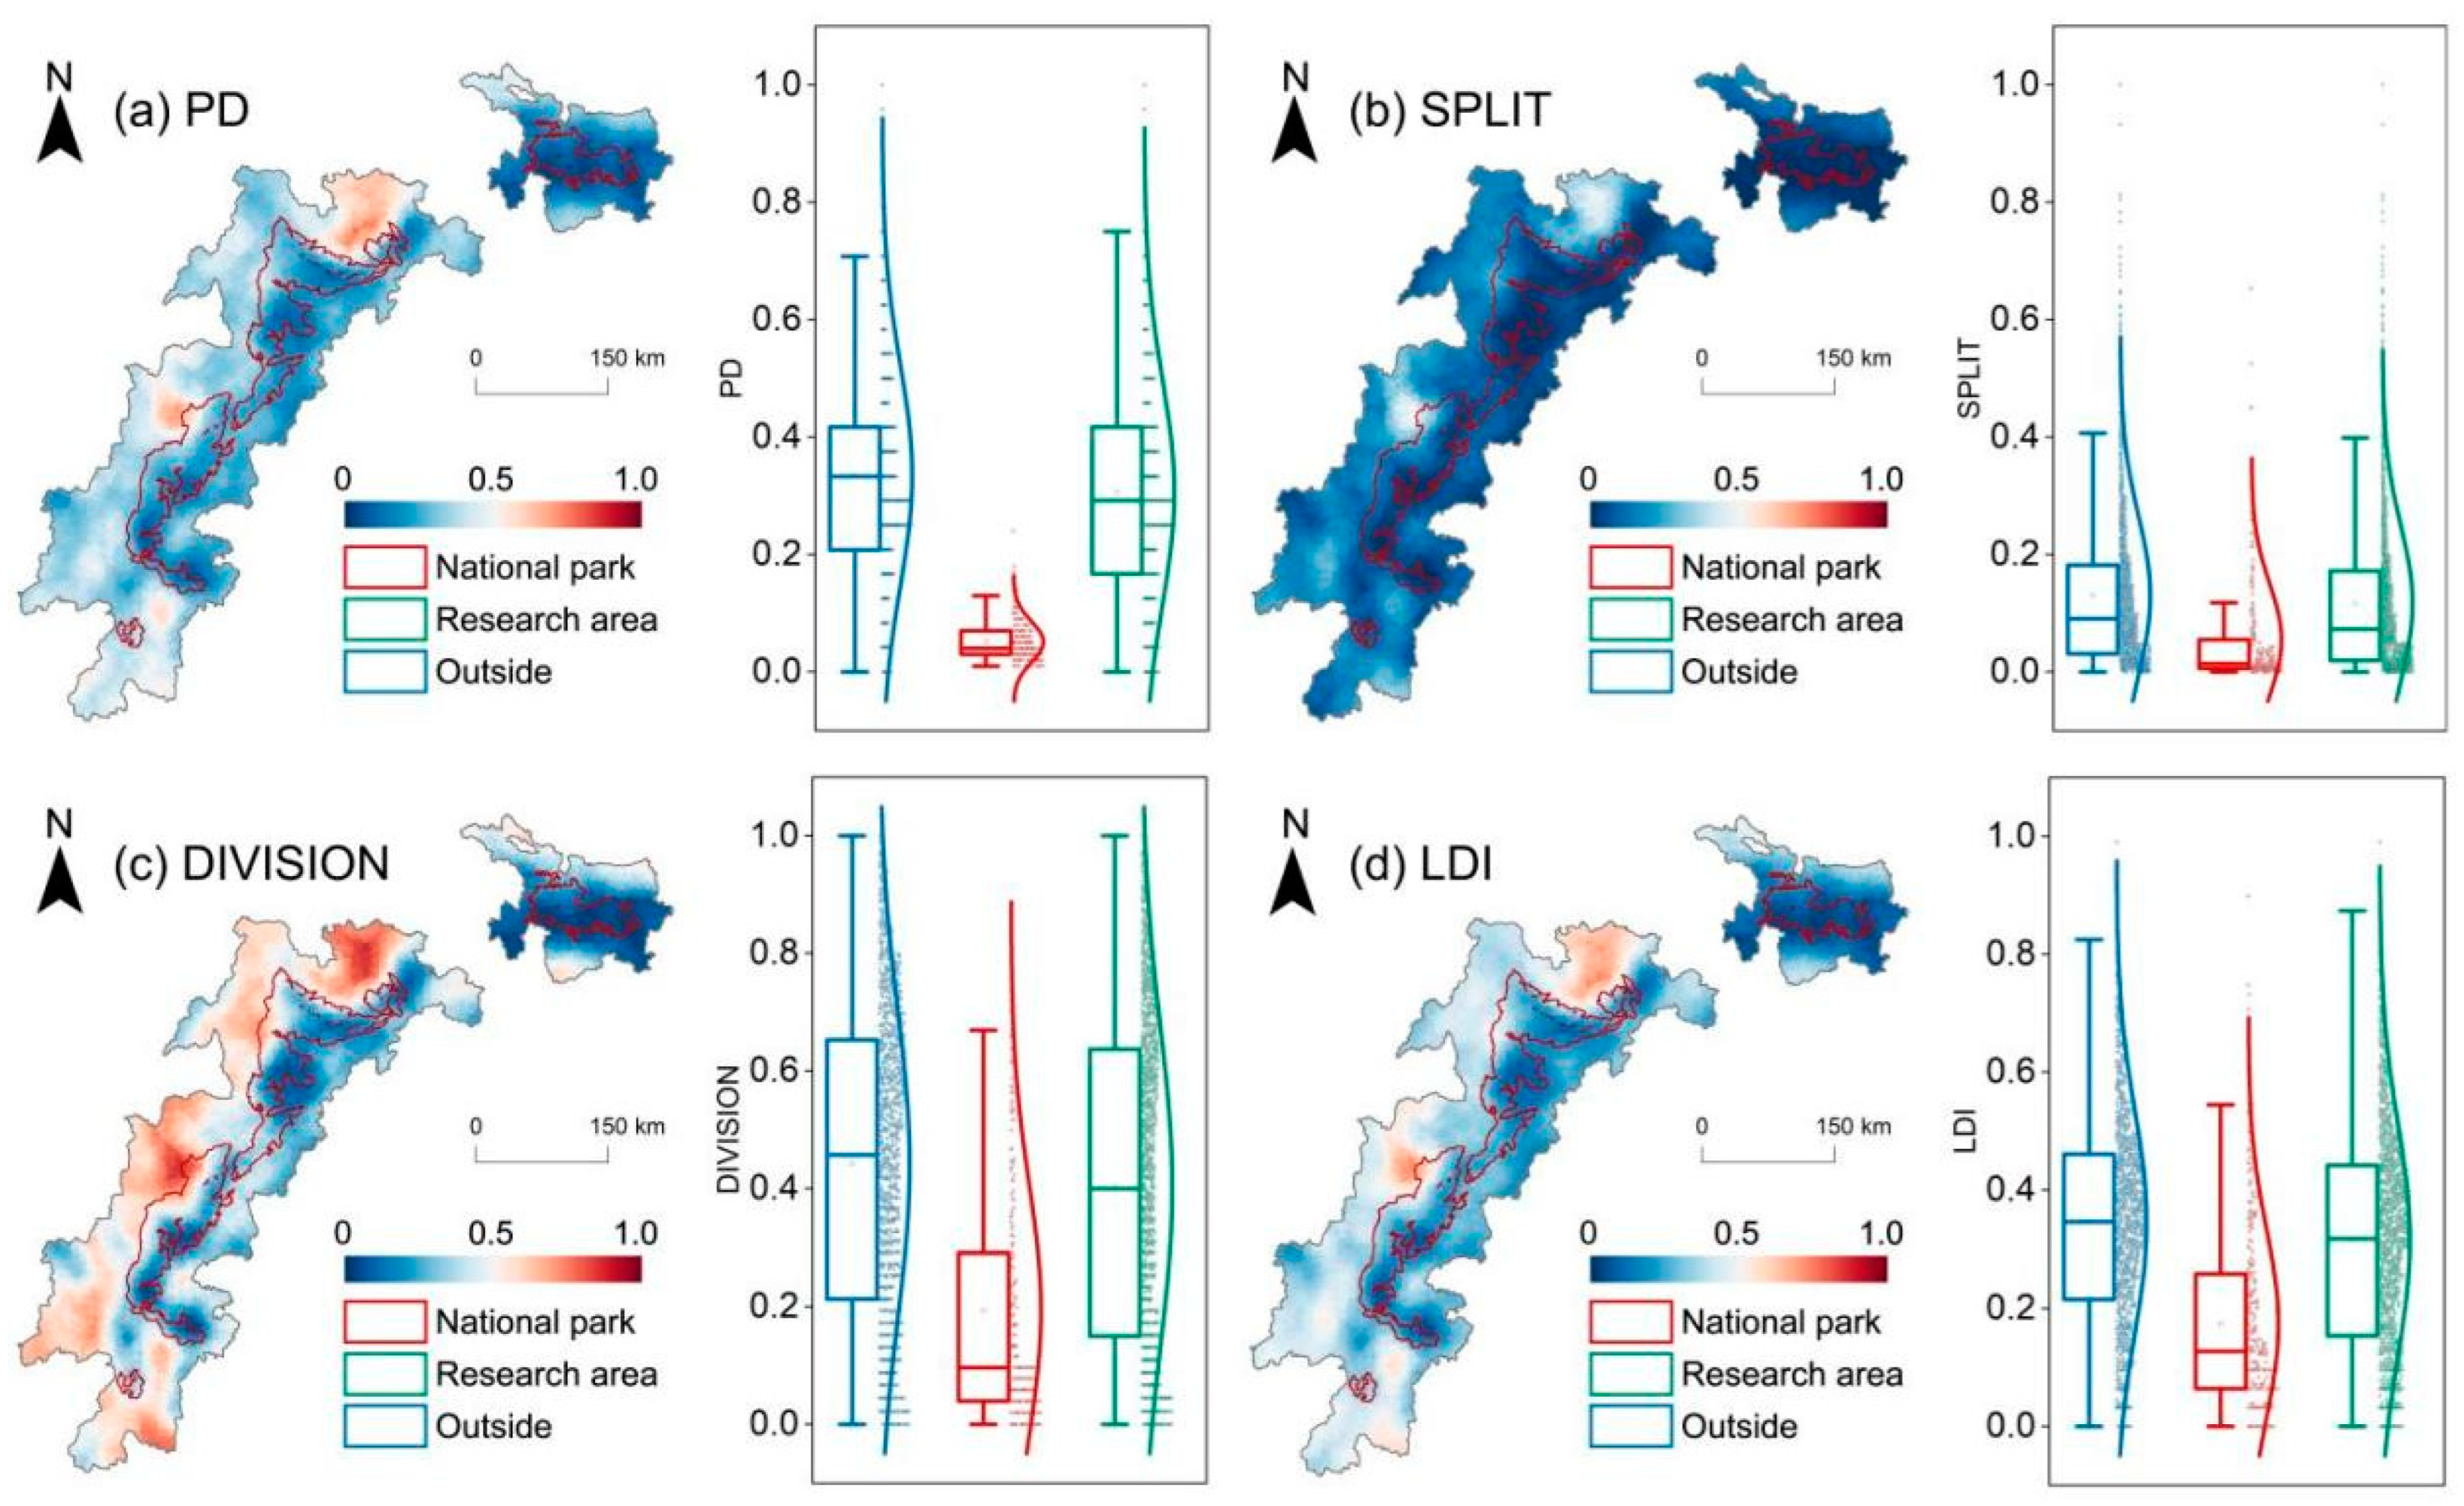
The landscape pattern indices calculation results for the GPNP are shown in Figure 4. This study reveals that patch density (PD) within the park is significantly lower compared to the surrounding areas. Specifically, the northern and central regions of the park exhibit higher PD values than those in other areas. The landscape splitting index (SPLIT) within the park is lower than that in the surrounding regions, with higher SPLIT values observed in the northern Bai Shui Jiang area and the western regions of the Qionglai-Daxiangling area. The landscape division index (DIVISION) demonstrates a declining pattern from the western to the eastern regions of the park. Moreover, the landscape disturbance index (LDI) within the park is notably lower than in the surrounding areas, with smaller areas of high LDI observed throughout the research region.
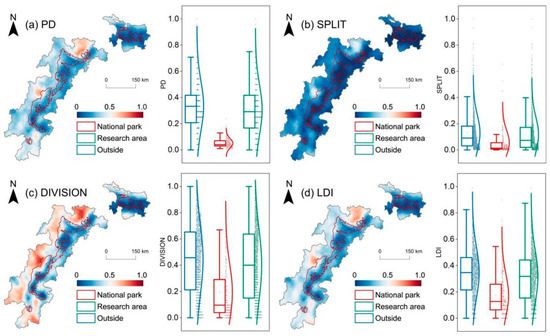
Figure 4.
Landscape pattern distribution in the GPNP and its surrounding areas. (a), Patch density (PD) in GPNP and its surrounding areas; (b), Landscape splitting index (SPLIT) index (SPLIT) in GPNP and its surrounding areas; (c), Landscape division index (DIVISION) in GPNP and its surrounding areas; (d), Landscape disturbance index (LDI) in GPNP and its surrounding areas.
3.4. Spatial Autocorrelation
We conducted Moran’s I analysis on the ecological sensitivity index (ESI) and landscape pattern indices (PD, SPLIT, DIVISION, LDI) of the GPNP and its surrounding areas, as shown in Table 4. The findings reveal a positive correlation between ecological sensitivity and PD, SPLIT, DIVISION, and LDI. Specifically, the Moran’s I values are 0.047 for PD and ESI, 0.074 for SPLIT and ESI, 0.082 for DIVISION and ESI, and 0.067 for LDI and ESI. Based on these findings, the strength of correlation ranks as follows in terms of average absolute values of Moran’s I with ecological sensitivity: DIVISION > SPLIT > LDI > PD, suggesting that DIVISION exhibits the strongest correlation with ecological sensitivity, while PD shows the weakest correlation.
Table 4.
Global Moran’s I values of landscape pattern index.
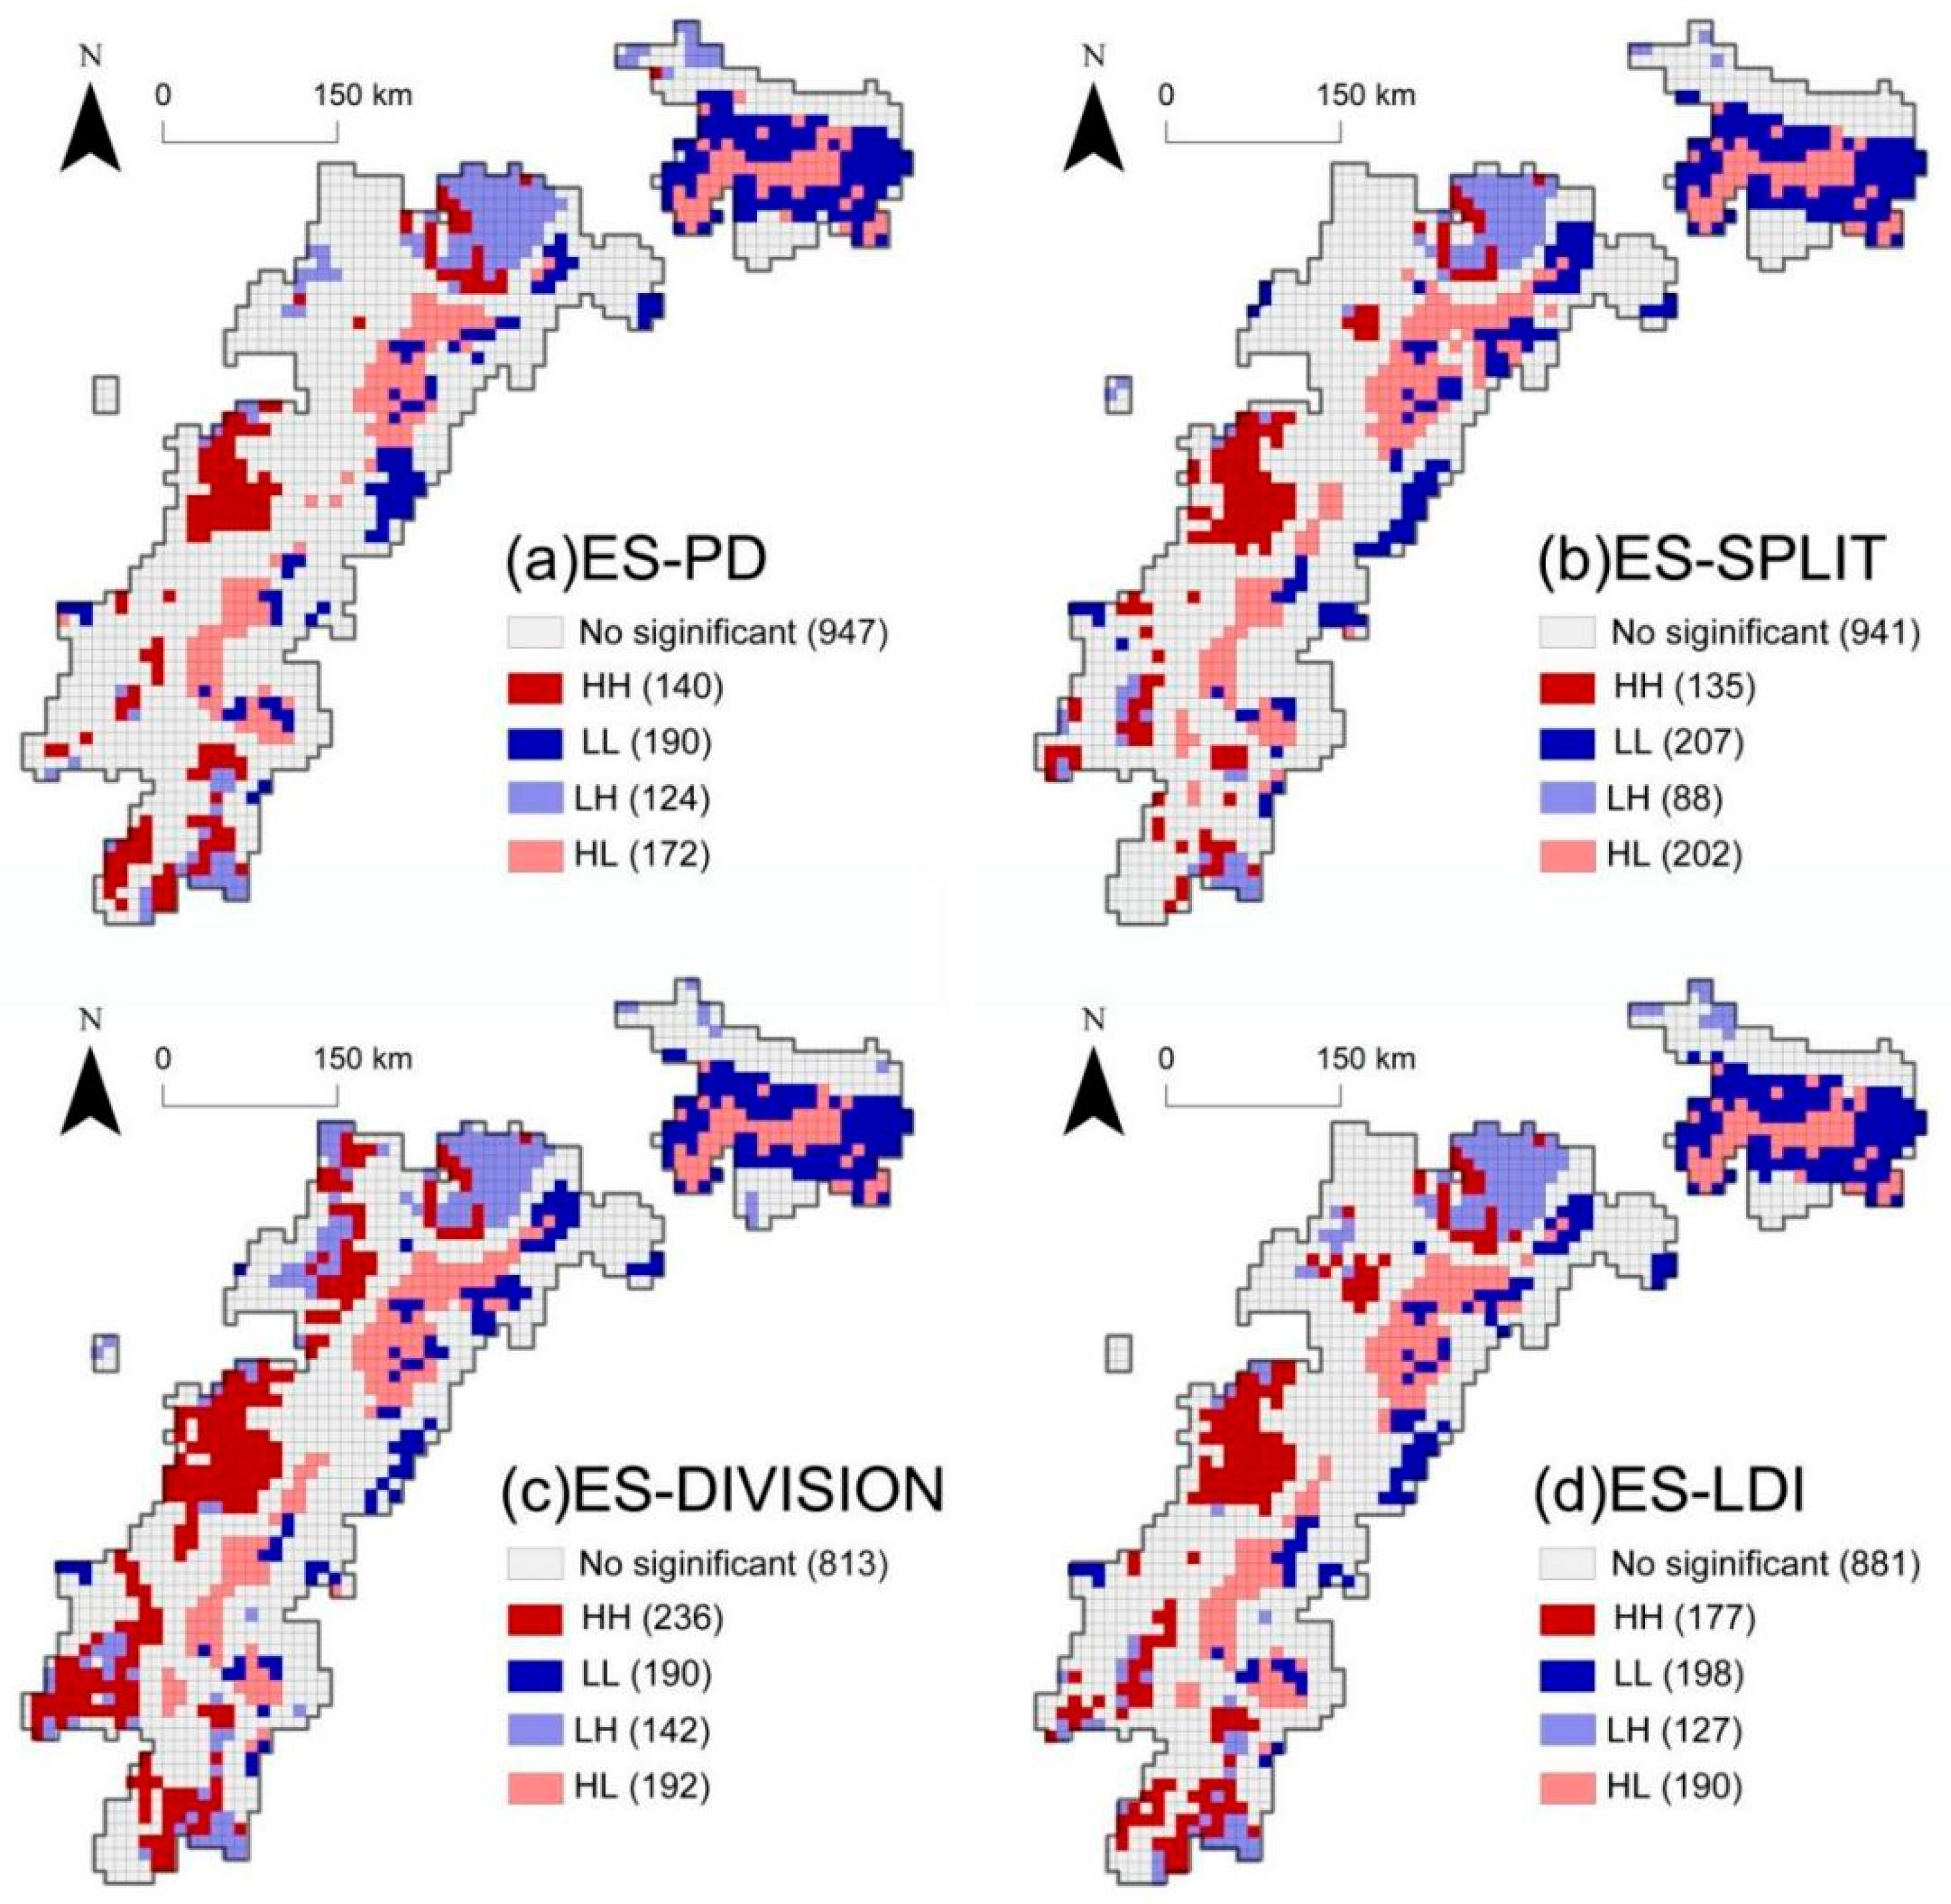
As shown in Figure 5, the GPNP and its surrounding areas exhibit similar spatial correlation characteristics between the landscape pattern indices and ecological sensitivity. Within the park boundaries, the overall pattern shows Low-Low (LL) and Low-High (LH) relationships, indicating lower landscape pattern indices but higher ecological sensitivity. The eastern region of the park displays LL correlation, suggesting pronounced human activities leading to significant landscape fragmentation in these areas. The QL area of the GPNP is characterized primarily by High-Low (HL) and LL relationships, indicating lower ecological sensitivity and either simplified landscape patterns or severe landscape fragmentation. Indices such as the splitting index (SPLIT), Number of Patches (NP), landscape division index (DIVISION), and landscape disturbance index (LDI) exhibit similar clustering patterns with the ecological sensitivity index. The western and southern edges of the Qionglai Mountains and Xiaoxiangling regions are characterized by high and low clustering zones, indicating that these areas with high ecological sensitivity are characterized by longer total edge lengths and a greater number of patches. In addition, the density of patches and edges is also high, indicating that the landscape structure of these areas is complex and that there are many habitat edge areas, which are important factors affecting biodiversity and ecological processes.
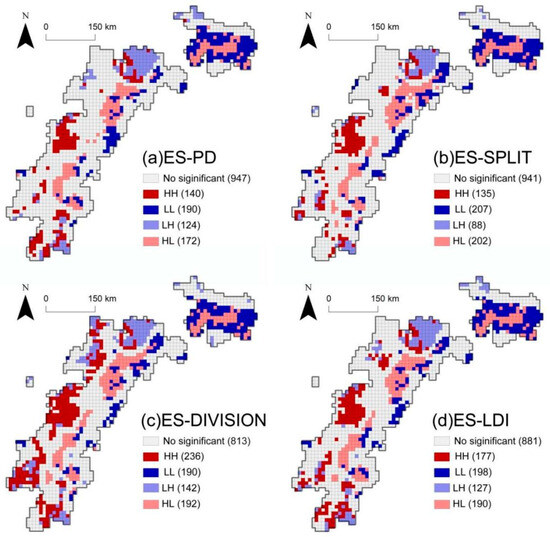
Figure 5.
LISA plot of landscape pattern and ecological sensitivity in GPNP and its surrounding areas. (a), LISA plot of patch density (PD) and ecological sensitivity in GPNP and its surrounding areas; (b), LISA plot of Landscape landscape splitting index (SPLIT) and ecological sensitivity in GPNP and its surrounding areas; (c), LISA plot of landscape division index (DIVISION)and ecological sensitivity in GPNP and its surrounding areas; (d), LISA plot of landscape disturbance index (LDI) and ecological sensitivity in GPNP and its surrounding areas.
4. Discussion
To investigate the spatial correlation between landscape pattern indices and ecological sensitivity in the GPNP and its surrounding areas in China, we used multivariate analysis to delve into the complex interactions inside the GPNP system and their multifaceted impacts on ecological and socioeconomic development. This study utilized GIS, Fragstats 4.2, GeoDa, and other software tools to assess the ecologically sensitive regions within and around the GPNP and how these regions influence the overall stability and functionality of landscape patterns. Landscape pattern indices, including patch density (PD), splitting index (SPLIT), landscape division index (DIVISION), and landscape disturbance index (LDI), were analyzed for the GPNP and its surrounding areas. Ecological sensitivity within the study area was computed using GIS software, integrating evaluations from nine sensitivity assessment factors to derive comprehensive sensitivity results for the GPNP and its periphery.
The ecological sensitivity within the Giant Panda National Park (GPNP) is significantly higher than in the surrounding areas, underscoring the critical importance of understanding ecosystem vulnerability in this region from an ecological sensitivity perspective, as well as the role of GPNP policies in biodiversity conservation. The areas of extremely high sensitivity are predominantly concentrated in the northern part of the Qionglai Mountains (QLS) and the western part of the Minshan (MS), where the ecological conditions are crucial to the overall health and stability of the ecosystem. This finding highlights the need to focus conservation efforts particularly on the northern QLS and western MS areas to prevent ecological degradation and biodiversity loss. The extremely high sensitivity zones account for 10.97% of the national park’s total area, while high sensitivity zones cover 35.22%, indicating that much of the study area is ecologically vulnerable. Within the national park, high sensitivity zones are primarily distributed outside the Qinling region, covering a total area of 8792.28 km2. From the perspective of landscape pattern indices and landscape ecology, the complex landscape structure and functions in the areas surrounding the GPNP have significant impacts on the internal ecological processes. Therefore, establishing ecological corridors and implementing conservation measures are key to protecting the highly sensitive areas within the GPNP and restoring ecological connectivity and biotic communities in the fragmented landscapes surrounding the park. Overall, this study of ecological sensitivity within the GPNP provides a comprehensive framework for understanding and implementing more effective ecological protection and management strategies, ensuring that these critical regions continue to provide essential services and support to both humans and the natural world.
The ecological sensitivity in the QL region and its surroundings is the lowest within the study area. Internally, the QL region exhibits a spatial distribution of ecological sensitivity characterized by higher values in the south and lower values in the north. Additionally, based on landscape pattern index results, the QL region shows good landscape connectivity, benefiting from its diverse topography and significant altitude variations in Shaanxi Province. This diversity supports the formation of different ecosystem types, enhancing biodiversity and landscape connectivity [43]. Analyzing land use sensitivity assessment factors in the QL region reveals significant human disturbances, such as agricultural expansion and tourism development, in the Qinling Mountains area. These activities can impact habitat selection for giant pandas. Relevant authorities can raise awareness about ecological conservation through environmental protection campaigns, establish core conservation areas, and restrict or prohibit human activities to minimize environmental disturbances [44].
The positive correlation between the ESI and landscape pattern indices (PD, SPLIT, DIVISION, and LDI) reveals the spatial structure and ecological dynamics of the GPNP and its surrounding areas. As landscape fragmentation and complexity increase, indicated by higher values of these indices, ecological sensitivity also rises. This finding underscores the significant impact of landscape structure on ecological processes and habitat integrity. Moran’s I analysis shows that the correlation between DIVISION and ESI is the strongest, followed by SPLIT, LDI, and PD. The strong correlation between DIVISION and ESI suggests that highly fragmented landscapes are more ecologically sensitive, likely due to enhanced edge effects, habitat loss, and patch isolation. The increase in landscape division directly affects habitat connectivity and ecological flow. Highly fragmented landscapes lead to greater isolation of habitat patches, which in turn restricts species movement and gene flow. This habitat isolation effect makes species more vulnerable to external pressures, such as climate change or human disturbance, thereby increasing ecosystem fragility. The correlations between SPLIT and LDI with ESI indicate that landscape complexity and dominance are also closely related to ecological sensitivity. While complex landscape structures can enhance ecosystem diversity and functional diversity, potentially boosting ecosystem resilience, overly complex landscapes may lead to uneven resource distribution, thereby increasing ecosystem vulnerability.
This study also observes that as elevation decreases from west to east in the GPNP and its surrounding areas, landscape fragmentation, the dominance index, and the disturbance index also decrease. Ecological sensitivity exhibits a decreasing trend from west to east in the study area. Regions with high ecological sensitivity and complex landscape patterns spatially coincide, indicating greater ecological vulnerability and more complex landscape structures. Lower-altitude areas have experienced more land conversion activities, such as deforestation and land reclamation, leading to habitat loss and fragmentation [45]. To protect the natural habitat of giant pandas, efforts should be directed towards promoting afforestation and land restoration within the panda habitat areas through the phased implementation of land conversion from agricultural to forested land.
Although this study provides a comprehensive analysis of landscape fragmentation and ecological sensitivity in the GPNP and its surrounding areas, it only considered three landscape pattern indices—SPLIT, PD, and DIVISION. This limitation might raise concerns regarding future landscape and ecological management of the GPNP. Therefore, we recommend that future research in this area should explore the study region using a multi-scale approach and consider a broader range of landscape pattern indices for a more detailed investigation.
5. Conclusions
As one of China’s first established national parks, the Giant Panda National Park (GPNP) holds a crucial position in the construction of ecological civilization. Analyzing the landscape pattern and ecological sensitivity of this park is a key step in achieving effective ecological protection. This study focuses on the GPNP and its surrounding areas, incorporating factors such as topography, climate, vegetation cover, animal activity patterns, landscape resources, hydrological conditions, and human activities. We developed an ecological sensitivity evaluation model for the national park.
The ecological sensitivity in the GPNP is significantly higher than in the surrounding areas, with regions of extreme sensitivity primarily concentrated in the northern section of the QLS area and the western section of the MS area. High-sensitivity areas make up 35.22% of the research area, mainly located within the national park, except for the QL area, as well as in the western and southern surrounding regions. Medium-sensitivity areas are evenly distributed, while low-sensitivity and insensitive areas are primarily found in the northern and eastern parts of the GPNP and its surroundings.
The patch density (PD) in the GPNP is lower than in the surrounding areas, with higher PD in the northern and central regions. The splitting index (SPLIT) is lower in the park than in the surrounding areas, except for the northern part of the Baishuijiang area and the western part of the Qionglai Mountain-Daxiaoxiangling area, where SPLIT is higher. The landscape division index (DIVISION) decreases from west to east, and the landscape disturbance index (LDI) is significantly lower in the park compared to the surrounding areas, with high LDI areas being relatively small throughout the study area.
Moran’s I analyses of the GPNP and its surrounding areas show a positive association between ecological sensitivity and landscape pattern indices (PD, SPLIT, DIVISION, LDI). The correlation is strongest between DIVISION and ecological sensitivity and weakest between PD and ecological sensitivity. Spatial correlation features reveal that internal regions of the park exhibit low landscape pattern indices but high ecological sensitivity, while the eastern regions show severe landscape fragmentation. The primary high-low clustering areas occur around the Qionglai Mountain-Daxiaoxiangling area, indicating that these regions of high ecological sensitivity have complex landscape structures with numerous habitat edges, significantly impacting biodiversity and ecological processes.
Based on these findings, this study offers the following specific recommendations to policymakers, conservationists, and environmental managers to promote the sustainable development of the GPNP and its surrounding areas: Establish No-Build Zones; implement no-build policies in high ecological sensitivity areas within the GPNP, such as the northern Qionglai Mountain and the western Minshan regions. Prohibit all industrial and residential development to protect natural ecosystems and maintain biodiversity and ecological balance. Support Ecological Corridor Restoration; promote and support targeted ecological corridor restoration projects, especially in areas with high DIVISION values. For instance, reforest areas where ecological corridors have been fragmented to restore natural habitat connectivity, enhancing species migration and gene flow. Create Vegetation Buffer Zones; establish vegetation buffer zones in high sensitivity areas to mitigate edge effects. Develop detailed management plans, including restrictions on human activities, monitoring of ecological changes, and regular assessment of the effectiveness of the buffer zones.
Author Contributions
Conceptualization: H.X., F.L. and J.L.; Data curation: H.X. and J.L.; Formal analysis: H.X. and F.L.; Funding acquisition: H.X., F.L. and J.L.; Investigation: H.X. and J.L.; Methodology: H.X., F.L. and J.L.; Project administration: H.X. and J.L.; Resources: H.X. and J.L.; Software: H.X. and J.L.; Supervision: H.X.; Visualization: H.X. and J.L.; Writing—original draft: H.X.; Writing—review and editing: H.X., J.L. and F.L. All authors have read and agreed to the published version of the manuscript.
Funding
This research received no funding.
Institutional Review Board Statement
Not applicable.
Informed Consent Statement
Not applicable.
Data Availability Statement
The original contributions presented in the study are included in the article material, further inquiries can be directed to the corresponding authors.
Conflicts of Interest
The authors declare no conflicts of interest.
References
- Li, S.; Feng, J.; Li, B.V. The Giant Panda National Park: Experiences and lessons learned from the pilot. Biodivers. Sci. 2021, 29, 307. [Google Scholar] [CrossRef]
- Huang, Q.; Fei, Y.; Yang, H.; Gu, X.; Songer, M. Giant Panda National Park, a step towards streamlining protected areas and cohesive conservation management in China. Glob. Ecol. Conserv. 2020, 22, e00947. [Google Scholar] [CrossRef]
- Xu, D.; Cong, L.; Wall, G. Tourists’ spatio-temporal behaviour and concerns in park tourism: Giant Panda National Park, Sichuan, China. Asia Pac. J. Tour. Res. 2019, 24, 924–943. [Google Scholar] [CrossRef]
- Jia, Q.; Jiao, L.; Lian, X.; Wang, W. Linking supply-demand balance of ecosystem services to identify ecological security patterns in urban agglomerations. Sustain. Cities Soc. 2023, 92, 104497. [Google Scholar] [CrossRef]
- Liu, Y.; Wang, L.; Lu, Y.; Zou, Q.; Yang, L.; He, Y.; Li, Q. Identification and optimization methods for delineating ecological red lines in Sichuan Province of southwest China. Ecol. Indic. 2023, 146, 109786. [Google Scholar] [CrossRef]
- Xiong, Y.; Mo, S.; Wu, H.; Qu, X.; Liu, Y.; Zhou, L. Influence of human activities and climate change on wetland landscape pattern—A review. Sci. Total Environ. 2023, 879, 163112. [Google Scholar] [CrossRef]
- Hu, C.; Wu, W.; Zhou, X.; Wang, Z. Spatiotemporal changes in landscape patterns in karst mountainous regions based on the optimal landscape scale: A case study of Guiyang City in Guizhou Province, China. Ecol. Indic. 2023, 150, 110211. [Google Scholar] [CrossRef]
- Shu, H.; Xiao, C.; Ma, T.; Sang, W. Ecological health assessment of chinese national parks based on landscape pattern: A case study in shennongjia national park. Int. J. Environ. Res. Public Health 2021, 18, 11487. [Google Scholar] [CrossRef]
- Han, D.; Xu, X.; Qiao, Z.; Wang, F.; Cai, H.; An, H.; Han, W. The roles of surrounding 2D/3D landscapes in park cooling effect: Analysis from extreme hot and normal weather perspectives. Build. Environ. 2023, 231, 110053. [Google Scholar] [CrossRef]
- Shaker, R.R.; Mackay, B.R. Hidden patterns of sustainable development in Asia with underlying global change correlations. Ecol. Indic. 2021, 131, 108227. [Google Scholar] [CrossRef]
- Shaker, R.R.; Yakubov, A.D.; Nick, S.M.; Vennie-Vollrath, E.; Ehlinger, T.J.; Wayne Forsythe, K. Predicting aquatic invasion in Adirondack lakes: A spatial analysis of lake and landscape characteristics. Ecosphere 2017, 8, e01723. [Google Scholar] [CrossRef]
- Shaker, R.R.; Aversa, J.; Papp, V.; Serre, B.M.; Mackay, B.R. Showcasing relationships between neighborhood design and wellbeing Toronto indicators. Sustainability 2020, 12, 997. [Google Scholar] [CrossRef]
- Kubacka, M.; Żywica, P.; Subirós, J.V.; Subirós, S.; Macias, A. How do the surrounding areas of national parks work in the context of landscape fragmentation? A case study of 159 protected areas selected in 11 EU countries. Land Use Policy 2022, 113, 105910. [Google Scholar] [CrossRef]
- O’Neill, R.V.; Krummel, J.R.; Gardner, R.H.; Sugihara, G.; Jackson, B.; DeAngelis, D.L.; Graham, R.L. Indices of landscape pattern. Landsc. Ecol. 1988, 1, 153–162. [Google Scholar] [CrossRef]
- He, X.; Bo, Y.; Du, J.; Li, K.; Wang, H.; Zhao, Z. Landscape pattern analysis based on GIS technology and index analysis. Clust. Comput. 2019, 22 (Suppl. S3), 5749–5762. [Google Scholar] [CrossRef]
- Jung, S.G.; Oh, J.H.; Park, K.H. A temporal structure analysis of forest landscape patterns using landscape indices in the Nakdong river basin. J. Korean Assoc. Geogr. Inf. Stud. 2005, 8, 145–156. [Google Scholar]
- Li, L.; Li, X.; Niu, B.; Zhang, Z. A Study on the Dynamics of Landscape Patterns in the Yellow River Delta Region. Water 2023, 15, 819. [Google Scholar] [CrossRef]
- Yilmaz, F.C.; Zengin, M.; Tekin Cure, C. Determination of ecologically sensitive areas in Denizli province using geographic information systems (GIS) and analytical hierarchy process (AHP). Environ. Monit. Assess. 2020, 192, 589. [Google Scholar] [CrossRef]
- Zheng, Y.; Lan, S.; Chen, W.Y.; Chen, X.; Xu, X.; Chen, Y.; Dong, J. Visual sensitivity versus ecological sensitivity: An application of GIS in urban forest park planning. Urban For. Urban Green. 2019, 41, 139–149. [Google Scholar] [CrossRef]
- Jia, H.; Luo, P.; Yang, H.; Luo, C.; Li, H.; Wu, S.; Cheng, Y.; Huang, Y.; Xie, W. Exploring the relationship between forest scenic beauty with color index and ecological integrity: Case study of Jiuzhaigou and Giant Panda National Park in Sichuan, China. Forests 2022, 13, 1883. [Google Scholar] [CrossRef]
- Song, X.; Jiang, Y.; Zhao, L.; Jin, L.; Yan, C.; Liao, W. Predicting the Potential Distribution of the Szechwan Rat Snake (Euprepiophis perlacea) and Its Response to Climate Change in the Yingjing Area of the Giant Panda National Park. Animals 2023, 13, 3828. [Google Scholar] [CrossRef] [PubMed]
- National Earth System Science Data Center. National Science & Technology Infrastructure of China. Available online: http://www.geodata.cn (accessed on 20 May 2024).
- The Data Set Is Provided by Geospatial Data Cloud Site, Computer Network Information Center, Chinese Academy of Sciences. Available online: http://www.gscloud.cn (accessed on 20 May 2024).
- Jiang, R.; Xie, C.; Man, Z.; Afshari, A.; Che, S. LCZ method is more effective than traditional LUCC method in interpreting the relationship between urban landscape and atmospheric particles. In Science of The Total Environment; Elsevier: Amsterdam, The Netherlands, 2023; Volume 869, p. 161677. ISSN 0048-9697. [Google Scholar]
- GBIF.org GBIF Occurrence Download. Available online: https://techdocs.gbif.org/en/openapi/v1/occurrence#/download (accessed on 23 June 2024).
- Didan, K. MOD13A2 MODIS/Terra Vegetation Indices 16-Day L3 Global 1 km SIN Grid V006 [Data Set]. NASA EOSDIS Land Processes DAAC. Available online: https://ladsweb.modaps.eosdis.nasa.gov/missions-and-measurements/products/MOD13A2 (accessed on 23 June 2024).
- Abatzoglou, J.T.; Dobrowski, S.Z.; Parks, S.A.; Hegewisch, K.C. TerraClimate, a highresolution global dataset of monthly climate and climatic water balance from 1958–2015. Sci. Data 2018, 5, 170191. [Google Scholar] [CrossRef]
- Xu, Y.; Liu, R.; Xue, C.; Xia, Z. Ecological sensitivity evaluation and explanatory power analysis of the Giant Panda National Park in China. Ecol. Indic. 2023, 146, 109792. [Google Scholar] [CrossRef]
- Li, C.; Fu, B.; Wang, S.; Stringer, L.C.; Zhou, W.; Ren, Z.; Maestre, F.T. Climate-driven ecological thresholds in China’s drylands modulated by grazing. Nat. Sustain. 2023, 6, 1363–1372. [Google Scholar] [CrossRef]
- Michler, T.; Aschenbrand, E. Tourist landscape preferences and conflicts over natural disturbance events in National Parks. In The Case of the Bavarian Forest National Park//Landscape Conflicts; Springer Fachmedien Wiesbaden: Wiesbaden, Germany, 2024; pp. 153–174. [Google Scholar]
- Feng, H.; Zhang, X.; Nan, Y.; Zhang, D.; Sun, Y. Ecological sensitivity assessment and spatial pattern analysis of land resources in Tumen River Basin, China. Appl. Sci. 2023, 13, 4197. [Google Scholar] [CrossRef]
- Luo, Q.; Bao, Y.; Wang, Z.; Chen, X.; Wei, W.; Fang, Z. Vulnerability assessment of urban remnant mountain ecosystems based on ecological sensitivity and ecosystem services. Ecol. Indic. 2023, 151, 110314. [Google Scholar] [CrossRef]
- Li, J.; Peng, X.; Li, C.; Luo, Q.; Peng, S.; Tang, H.; Tang, R. Renovation of Traditional Residential Buildings in Lijiang Based on AHP-QFD Methodology: A Case Study of the Wenzhi Village. Buildings 2023, 13, 2055. [Google Scholar] [CrossRef]
- Wang, Q.; Zhang, P.; Chang, Y.; Li, G.; Chen, Z.; Zhang, X.; Zhou, Z. Landscape pattern evolution and ecological risk assessment of the Yellow River Basin based on optimal scale. Ecol. Indic. 2024, 158, 111381. [Google Scholar] [CrossRef]
- Shirani, K.; Solhi, S.; Pasandi, M. Automatic landform recognition, extraction, and classification using kernel pattern modeling. J. Geovis. Spat. Anal. 2023, 7, 2. [Google Scholar] [CrossRef]
- Cheng, X.; Song, J.; Yan, J. Influences of landscape pattern on water quality at multiple scales in an agricultural basin of western China. Environ. Pollut. 2023, 319, 120986. [Google Scholar] [CrossRef]
- Xue, S.; Ma, B.; Wang, C.; Li, Z. Identifying key landscape pattern indices influencing the NPP: A case study of the upper and middle reaches of the Yellow River. Ecol. Model. 2023, 484, 110457. [Google Scholar] [CrossRef]
- Lyu, Y.; Chen, H.; Cheng, Z.; He, Y.; Zheng, X. Identifying the impacts of land use landscape pattern and climate changes on streamflow from past to future. J. Environ. Manag. 2023, 345, 118910. [Google Scholar] [CrossRef] [PubMed]
- Jin, W.; Dong, Z.; Bian, Z.; Zhang, X.; Wei, Z. Spatiotemporal variations in the impacts of small-to medium-scale mines agglomeration scale on landscape pattern and ecological risk in the watershed in a semi-arid ecologically fragile area. Ecol. Indic. 2024, 166, 112319. [Google Scholar] [CrossRef]
- Legendre, P. Spatial autocorrelation: Trouble or new paradigm? Ecology 1993, 74, 1659–1673. [Google Scholar] [CrossRef]
- Dormann, C.F.; McPherson, J.M.; Araújo, M.B.; Bivand, R.; Bolliger, J.; Carl, G.; Wilson, R. Methods to account for spatial autocorrelation in the analysis of species distributional data: A review. Ecography 2007, 30, 609–628. [Google Scholar] [CrossRef]
- Liu, T.; Peng, X.; Li, J. Evaluation of Ecological Sensitivity and Spatial Correlation Analysis of Landscape Patterns in Sanjiangyuan National Park. Sustainability 2024, 16, 5294. [Google Scholar] [CrossRef]
- Shi, J.; Liang, X.; Wei, Z.; Li, H. Spatial–temporal heterogeneity in the influence of landscape patterns on trade-offs/synergies among ecosystem services: A case study of the Loess Plateau of northern Shaanxi. Environ. Sci. Pollut. Res. 2024, 31, 6144–6159. [Google Scholar] [CrossRef]
- Chen, X.; Yu, L.; Du, Z.; Xu, Y.; Zhao, J.; Zhao, H.; Zhang, G.; Peng, D.; Gong, P. Distribution of ecological restoration projects associated with land use and land cover change in China and their ecological impacts. Sci. Total Environ. 2022, 825, 153938. [Google Scholar] [CrossRef]
- Qiu, L.; Han, H.; Zhou, H.; Zhang, Z.; Yang, X.; Gu, X.; Zhang, W.; Wei, W.; Dai, Q. Disturbance control can effectively restore the habitat of the giant panda (Ailuropoda melanoleuca). Biol. Conserv. 2019, 238, 108233. [Google Scholar] [CrossRef]


Disclaimer/Publisher’s Note: The statements, opinions and data contained in all publications are solely those of the individual author(s) and contributor(s) and not of MDPI and/or the editor(s). MDPI and/or the editor(s) disclaim responsibility for any injury to people or property resulting from any ideas, methods, instructions or products referred to in the content. |
© 2024 by the authors. Licensee MDPI, Basel, Switzerland. This article is an open access article distributed under the terms and conditions of the Creative Commons Attribution (CC BY) license (https://creativecommons.org/licenses/by/4.0/).