Article

Analysis of Taxi Demand and Traffic Influencing Factors in Urban Core Area Based on Data Field Theory and GWR Model: A Case Study of Beijing

1
School of Architecture and Urban Planning, Beijing University of Civil Engineering and Architecture, Beijing 100044, China
2
Beijing Jiaotong University, Beijing 100044, China
3
Development Strategy Institute for Building Materials Industry, Beijing 100035, China
4
College of Applied Arts and Science, Beijing Union University, Beijing 100088, China
*
Author to whom correspondence should be addressed.
Sustainability 2024, 16(17), 7386; https://doi.org/10.3390/su16177386
Submission received: 18 June 2024 / Revised: 31 July 2024 / Accepted: 21 August 2024 / Published: 27 August 2024
(This article belongs to the Special Issue Sustainable Traffic and Mobility)

Abstract

:
Urban transportation constitutes a complex and dynamic system influenced by various factors, including population density, infrastructure, economic activities, and individual travel behavior. Taxis, as a widespread mode of transportation in many cities, play a crucial role in meeting the transportation needs of urban residents. By using data field theory and the Geographically Weighted Regression (GWR) modeling method, this study explored the complex relationship between taxi demand and traffic-related factors in urban core areas and revealed the potential factors affecting taxi starting and landing points. This research reveals that during the morning peak hours (7:00–9:00), at locations such as long-distance bus terminals, bus stations, parking areas, train stations, and bike-sharing points, taxi demand significantly increases, particularly in the central and southeastern regions of the urban core. Conversely, demand is lower in high-density intersection areas. Additionally, proximity to train stations is positively correlated with higher taxi demand, likely related to the needs of long-distance travelers. During the evening peak hours (17:00–19:00), the taxi demand pattern resembles that of the morning peak, with long-distance bus terminals, bus stations, and parking and bike sharing areas remaining key areas of demand. Notably, parking areas frequently serve as pick-up points for passengers during this time, possibly associated with evening activities and entertainment. Moreover, taxi demand remains high around train stations. In summary, this study enhances our understanding of the dynamics of urban taxi demand and its relationship with various transportation-related influencing factors within the core urban areas. The proposed grid partitioning and GWR modeling methods provide valuable insights for urban transportation planners, taxi service providers, and policymakers, facilitating service optimization and improved urban mobility.

1. Introduction

Urban transportation constitutes a complex and dynamic system, shaped by diverse factors such as population density, infrastructure, economic activities, and individual travel behavior [1]. As an integral facet of modern urban infrastructure, transportation systems wield a profound influence on the daily lives and economic activities of city residents [2]. The advent of big data and advanced spatial analysis techniques in recent years has opened new avenues for researchers and policymakers to gain a more profound understanding of the intricate patterns and driving factors of urban mobility [3]. Taxis, among the various urban transportation modes, assume a pivotal role in central urban areas, offering a convenient, on-demand travel option [4]. Globally prevalent, taxis play a crucial role in meeting the transportation needs of urban residents [5]. Considering that urban core areas are hubs for commerce and administration with high population densities, they function as the economic and social centers of cities. Consequently, comprehending the spatial and temporal dynamics of taxi demand becomes imperative for optimizing transportation services, mitigating traffic congestion, and enhancing overall urban life quality [6,7]. This study explores the nuanced relationship between taxi demand and Point of Interest (POI) categories within metropolitan urban areas. Utilizing spatial data theory and Geographically Weighted Regression (GWR) modeling, our objective is to unveil the underlying factors influencing taxi pickups and drop-offs. By enriching our comprehension of taxi demand dynamics, this research provides valuable insights for urban transportation planners, taxi service providers, and policymakers.
Taxis serve as a vital component in many urban centers, complementing public transportation systems and catering to essential mobility needs in underserved areas, thus becoming a crucial travel mode for both tourists and residents. Nevertheless, optimizing taxi services to align with the requirements of urban populations necessitates a profound understanding of taxi demand patterns [8]. Historically, taxi services relied on traditional hailing or dispatching methods, often lacking real-time access to passenger demand data [9]. However, recent years have witnessed a transformation in the taxi industry landscape, marked by the rise of ride-hailing platforms and the availability of extensive geospatial data. These advancements offer unprecedented opportunities for more effective analysis and responses to the dynamic changes in taxi demand [10]. A plethora of studies aim to comprehend the spatiotemporal distribution and variations in taxi demand, often utilizing modeling techniques with historical taxi trip data, encompassing information on pickup and drop-off locations, to predict future demand [11,12,13]. Research underscores that taxi demand is influenced by diverse factors, including time, location, weather conditions, and special events [14,15,16]. Notably, studies reveal a significant surge in taxi demand on rainy or cold days [17]. The development of such models equips taxi service providers with tools to better align with citizens’ needs, diminish idle time, and enhance driver earnings.
Taxis wield a substantial impact on urban mobility, especially during peak hours and special events. Some research focuses on the potential of taxis to alleviate traffic congestion [18]. For instance, taxis can introduce ride-sharing services, thereby reducing the number of private vehicles on the road and mitigating traffic congestion [19]. Additionally, taxis offer last-mile solutions, transporting passengers to public transit stations and promoting multimodal transportation [20]. Understanding the factors influencing taxi travel in the urban core area is crucial for several reasons. Firstly, these central areas grapple with severe urban congestion and traffic management challenges, with taxis serving as a vital component of the urban transportation ecosystem. Secondly, taxi usage patterns provide insights into the transportation preferences and behaviors of urban residents, offering a window into the dynamics of urban life. Thirdly, the efficient operation of taxi services significantly contributes to the overall efficiency of urban transportation, influencing environmental sustainability and economic productivity.
Peak hours, both in the morning and evening, are typically the busiest and most congested periods in urban transportation systems [21]. During the morning, people are usually commuting to work or school, and in the evening, they return home or engage in social activities. Both of these time periods result in increased travel demand, particularly for taxis [22]. Taxis are often preferred by passengers during peak hours because they typically offer a faster mode of transportation. During the morning rush hour, taxi demand tends to concentrate on routes from residential areas to commercial, office, or industrial districts [23]. Commuters often favor taxis, as they provide a quicker way to commute to work, avoiding the traffic congestion and parking issues associated with driving [24]. During the evening rush hour, taxi demand typically exhibits a different pattern, with people returning from work to their homes or heading to social venues. Demand during this period tends to be more widespread, encompassing commercial areas, city centers, entertainment districts, and residential neighborhoods [25,26]. In addition to daily commuting peak hours, cities may also host special events such as sports games, concerts, festivals, and more, which can lead to a sharp increase in taxi demand [27,28]. Taxis often become the preferred mode of transportation for attendees of these events.
Furthermore, the concept of Points of Interest (POIs) adds another layer of complexity to understanding urban mobility patterns [29]. POIs encompass a wide range of locations, including but not limited to transit hubs, business districts, educational institutions, entertainment venues, and recreational areas [30]. These locations can significantly influence travel behavior and taxi demand. Therefore, conducting an in-depth exploration of the interaction between taxi demand and various categories of POIs in urban environments is a crucial research task. Through a comprehensive analysis of these factors, we can gain a more holistic understanding of peak demand patterns for urban taxis, providing more targeted decision support for urban transportation planners, taxi service providers, and policymakers [31].
Shared bicycles serve as a mode of transportation that fulfills a similar role to taxis yet exhibits substantial differences in usage scenarios [32]. The integration of taxis and shared bicycles has gradually emerged as a focal point in the field of urban transportation. This domain extensively explores the synergistic effects between these two modes of transportation, elucidating their collaborative relationship in urban travel. Researchers employ methodologies such as big data analysis [33], geographic information systems [34], and spatial statistics to delve into the nuanced patterns of variation under specific timeframes [35], geographical regions, and diverse event influences. The advancements in research not only broaden our understanding of multimodal interactions in urban travel but also provide theoretical underpinnings for enhancing urban traffic efficiency, improving travel experiences, and promoting sustainable urban development [36].
Expanding on the existing literature, this paper introduces a grid partitioning methodology rooted in data field theory, wherein the influence range of trajectory points serves as a fundamental consideration. This innovative approach facilitates the subdivision of the study area into multiple smaller regions, thereby enabling a more granular analysis and nuanced comprehension of the spatial distribution of taxi demand. Subsequent to this, the study employs the GWR method to meticulously explore the differential impacts of various traffic-related factors on taxi trips. Through the application of this method, we can scrutinize the localized effects of diverse factors on taxi demand across different locations and time intervals, thereby furnishing a more comprehensive understanding of the intricate nature of taxi demand.
This research conducts a comparative analysis of the results between weekday morning and evening peak periods and the other two periods (departure and arrival). This comparative approach aims to augment our comprehension of the spatiotemporal characteristics inherent in taxi demand. Such detailed analyses contribute significantly to providing more accurate data support for guiding urban transportation planning initiatives and optimizing taxi services.
The subsequent sections of this manuscript are structured as follows: Section 2 provides an introduction to the designated study area and outlines the primary data sources employed. Following this, Section 3 furnishes a comprehensive overview of the research methodology, encompassing the grid partitioning process, data collection procedures, and the implementation of GWR analysis for modeling taxi demand. Section 4 is dedicated to presenting the research findings, featuring spatial visualizations and offering insights into the nuanced relationship between taxi demand and diverse POI categories across distinct time intervals. Moving forward, Section 5 consolidates the key research findings, delving into their implications for urban transportation planning, taxi service providers, and policymakers. Section 6 accentuates the contributions of this study to the realm of urban transportation, outlining potential avenues for future research while also addressing the limitations inherent in the current study.

2. Study Area and Data
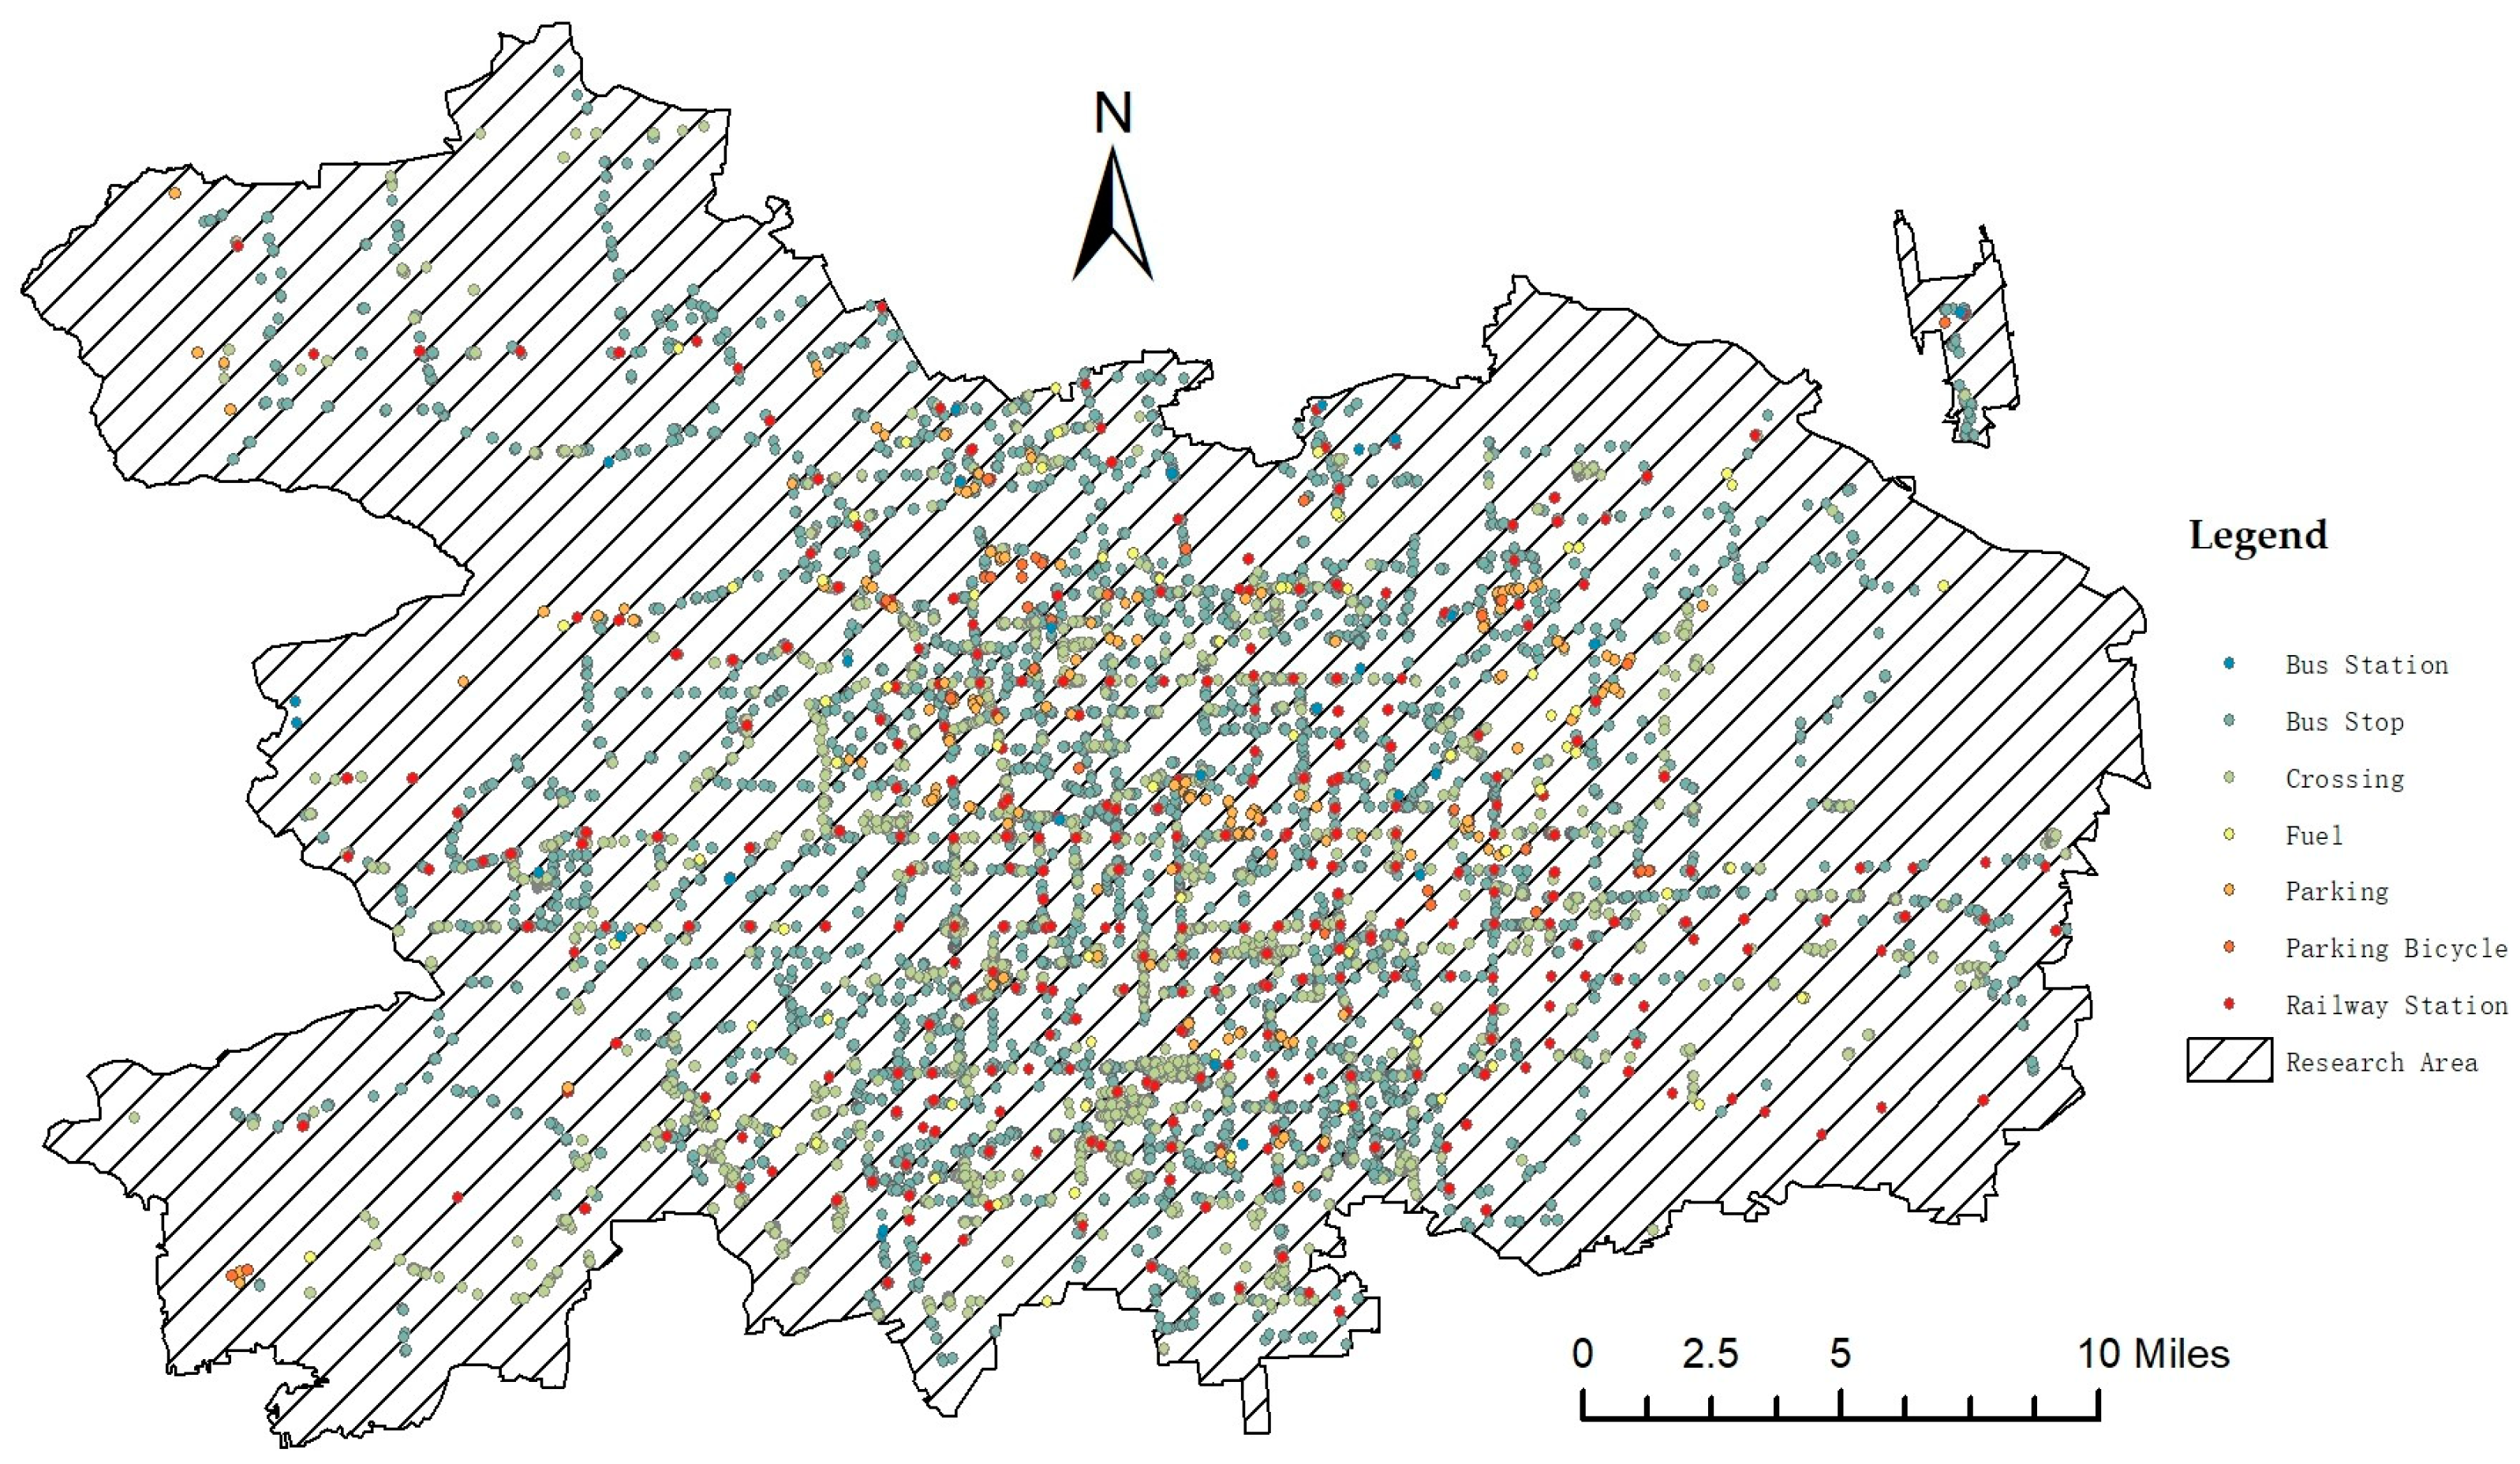
2.1. Study Area

This study focuses on a thorough analysis of the central urban area in Beijing, which includes a diverse range of districts such as Dongcheng, Xicheng, Haidian, Fengtai, Shijingshan, and Chaoyang (Figure 1) [37,38]. Commonly referred to as the city’s core, this region is distinguished by a high population density, accounting for approximately 60% of Beijing’s total residents, and housing nearly 70% of its industrial establishments [39]. Its strategic location and economic importance make it a hub of activity, leading to considerable pedestrian congestion, especially during peak hours. Beyond the bustling pedestrian environment, the presence of shared bicycle systems significantly influences the transportation dynamics within this area.

2.2. Data Sources

This study primarily utilizes two major categories of data: taxi OD data and POI data, in addition to administrative district data.
(1) Taxi Origin-Destination (OD) Data: the taxi OD data utilized in this study are derived from the central district of Beijing and were collected on typical workdays, specifically on 21 December 2021. Collaborative efforts with enterprises facilitated the acquisition of these taxi OD data. On the day of data collection, the study area experienced clear weather conditions and moderate temperatures. The data collection intervals coincide with the morning and evening peak hours of workdays, precisely defined as 07:00 to 09:00 and 17:00 to 19:00, respectively. As a result, data are collected within four specific time segments each day: 07:00 to 09:00 and 17:00 to 19:00. Each data record comprises attributes such as the data collection timestamp, taxi ID number, starting point longitude and latitude, and destination point longitude and latitude. In total, there are 3,600,000 records (Table 1).
(2) Shared Bike Data: the bike-sharing data utilized in this study are sourced from the central district of Beijing, collected on the same date as the taxi data, specifically on 21 December 2021. The bike-sharing data used in this research are obtained through collaboration with enterprises. The data collection time aligns with the taxi data: from 7:00 to 9:00 in the morning and from 5:00 to 7:00 in the evening. The data collection intervals are ten minutes. Each data record includes a timestamp, bike-sharing ID number, and the longitude and latitude at the time of collection. In total, there are 370,000 records (Table 2). The consecutive records collected from the same bike-sharing ID are associated to obtain OD flows. O and D points within the time intervals of 7:00–9:00 and 5:00–7:00 are extracted separately to correspond to the taxi data for the respective time and status.
(3) POI Data: the continuous evolution of electronic mapping and location services has led to the ongoing enrichment and refinement of POIs. POIs include spatial information attributes such as longitude, latitude, and address, along with additional informational attributes like names and categories (Table 3). They serve as valuable indicators of the distribution of various facilities and establishments. The POIs utilized in this study comprise attributes related to long-distance bus stations, bus stops, intersections, gas stations, car parking lots, shared bicycle parking areas, and railway stations. The spatial distribution of these POIs is visually depicted in Figure 2, which provides an overview of POI types and their explanations. The data for the aforementioned content can be accessed from the OpenStreetMap website (https://openstreetmap.org), URL (accessed on 10 May 2024).

3. Methodology

3.1. Data Field Theory

The data field theory is based on the field theory in physics [40]. Its core idea is to analogize the interaction forces between particles in the physical world to the mutual influences between data objects in the data space [41]. Specifically, in a physical field, each material particle experiences forces from other particles, forming a virtual field around it. In the data field theory, data objects (i.e., particles) collectively interact within the data space, generating a data field [42]. The data field is defined by a field strength function and a potential function. The field strength function quantifies the intensity of each data object within the data field, while the potential function describes the potential value of each data object in the field. These potential values are calculated based on the collective influence of neighboring data objects and are used to generate equipotential surfaces or contour lines [43]. These equipotential surfaces help identify clustered regions in the data space, thereby revealing the distribution characteristics of data objects [39]. Compared to traditional clustering algorithms such as K-means or hierarchical clustering, data field theory has significant advantages in handling high-dimensional data and complex data structures [44]. It can more naturally describe the mutual relationships between data objects and provide more intuitive clustering results through the visualization of equipotential surfaces.
In accordance with the principles of data field theory, within a spatial domain, there exists a dataset P  = { x 1 ,   x 2 ,   , x n } , comprising n data objects. These data objects are conceptualized as particles with mass, where n represents the total count of data objects. The computation of the potential value for each data object in the spatial domain is governed by Equation (1):
φ P i = j = 1 n m j × d i j σ k
Within this context, φ P i denotes the potential value of data object i , while m j signifies the mass attributed to data object j when treated as a particle. The term d i j represents the distance between data objects x i and x j . The parameter σ serves as the influence factor, governing the degree of interaction forces, with its value range spanning from (0, +∞). Furthermore, k denotes the distance exponent, which, in this study, is set at 2 to signify the extent of interaction between objects. In a gravitational field, potential values exhibit attenuation as the distance between data objects increases. However, when the distance exceeds 2 3 σ , the attenuation rate experiences a rapid escalation. As σ approaches infinity, all data objects coalesce into a single class, demonstrating exceptionally strong mutual interactions. Conversely, when σ tends toward zero, each data object becomes an independent class with no interdependence among them. In the theory of data fields, the value of 2 3 σ serves as the neighborhood radius for data objects, with only those within this radius exerting mutual interactions; data objects beyond this radius are considered unaffected. The concept of potential entropy is commonly employed to quantify the potential value distribution within the data field. The optimal influence factor, σ , which minimizes the potential entropy, is determined using Equation (2):
H = i = 1 n Ψ i z ln Ψ i z
In this study, the distance of influence between data points is determined by the minimum potential entropy value. This minimum potential entropy value serves as the grid cell size when partitioning the grid network.

3.2. Geographically Weighted Regression Methods

The Geographically Weighted Regression (GWR) model, which represents an advancement beyond conventional regression models, integrates the geographical coordinates of individual independent variables as influential covariates [45]. It employs a distance attenuation function to calculate weighted coefficients, factoring in the spatial proximity of each variable to a particular location. Subsequently, these weighted coefficients are incorporated into a weight function to quantify and evaluate the localized impacts of independent variables across diverse spatial coordinates. Notably, the GWR model is esteemed for its augmented fitting performance and enjoys widespread adoption in the realm of spatial analysis [46,47]. The mathematical expression for Geographically Weighted Regression is represented as Equation (3):
Y i = β o u i , v i + j = 1 p ρ j u i , v i X i j + ε i
In the equation presented, Y i represents the dependent variable, β o u i , v i stands for the spatial geographic position function, where u i , v i denotes the latitude and longitude coordinates of the regional sample point. Additionally, X i j denotes the regression fitting parameter for the j -th explanatory variable at the location of sample point i , corresponding to the explanatory variables.

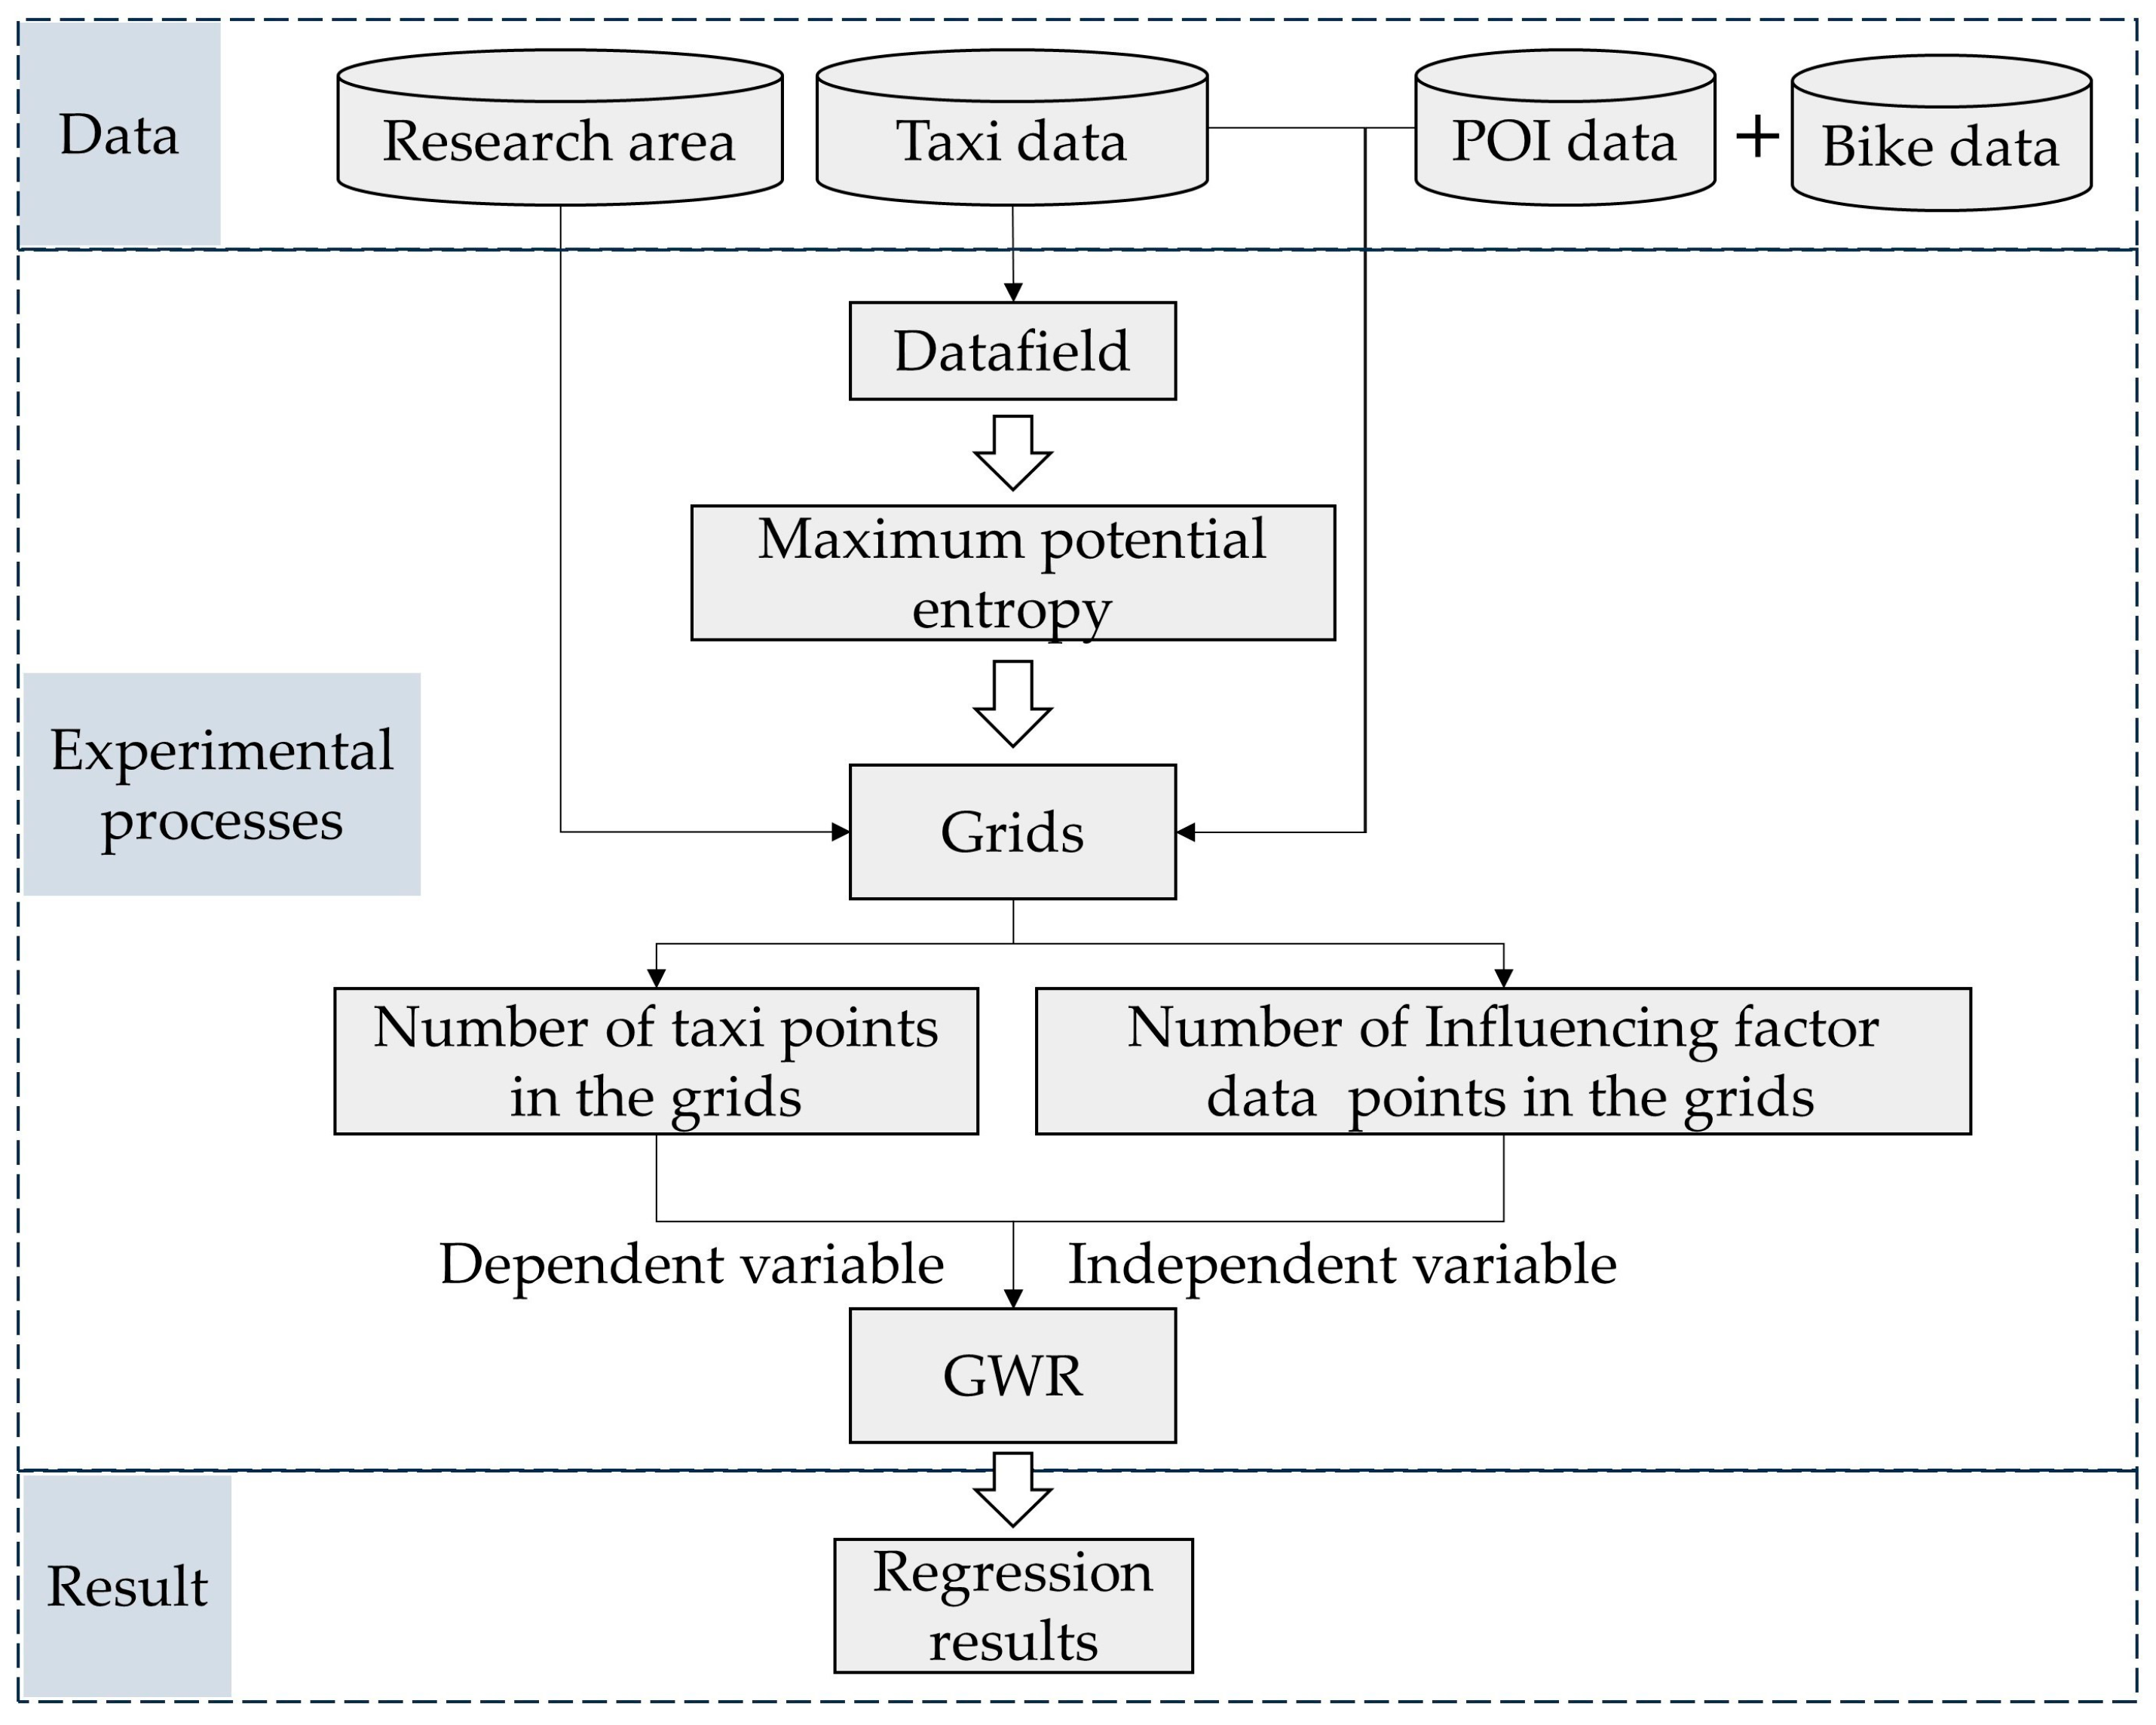
3.3. Technical Approach

The technical workflow of this study unfolds as follows. Initially, the computation of data fields commences based on the trajectory points extracted from the taxi dataset, encompassing both origin and destination points. This process involves iteratively calculating potential entropy values, with the distance parameter σ adjusted in each iteration to minimize the overall potential value. The resulting optimal σ value is then utilized as the grid size for establishing a comprehensive grid system covering the entire research area. Following this, distinct spatial intersections occur between the POI data and the taxi dataset, employing the established grid system. This step facilitates the quantification of each POI data category’s count within individual grid cells. Significantly, within each grid cell, the number of taxi trajectory points serves as the dependent variable, while the count of various POI data categories within the same grid cell acts as the independent variables. Among these factors, bike-sharing, as a first-mile and last-mile solution, is also considered an important influencing factor based on its OD points [48]. For scrutinizing the relationship between these variables and taxi trajectory points, a GWR model is applied. The GWR model, offering spatially varying regression analysis, yields insights into the diverse extents of influence for each considered factor. The structured grid system, defined by its grid cell dimensions, establishes a systematic framework for investigating spatial interactions, contributing to a more profound understanding of the factors shaping taxi travel within the urban core areas. It introduces a spatially segmented approach to the analysis, enabling more localized and context-specific insights into the dynamics of urban taxi transportation.
Emphasizing a departure from conventional research methodologies, it is noteworthy that this approach begins by leveraging the principles of data field theory to estimate the influence range linked to each data point [49]. Following this, the application of Geographically Weighted Regression facilitates the regression analysis. Notably, this distinctive methodology places significant emphasis on the consideration of the influence range among data points as a pivotal factor. Such an approach markedly improves the capacity of research outcomes to encapsulate the spatial characteristics inherent in spatiotemporal data. A visual representation of the technical workflow is provided in Figure 3.

4. Results

4.1. Analysis of Potential Entropy Calculation Results

Initiating the algorithmic procedure, the first step involves the computation of the data field. All taxi OD points are aggregated to commence this process. Following the principles of data field theory, potential entropy calculations are executed to determine the optimal distance parameter, σ . This necessitates iterative adjustments to the distance parameter’s value while concurrently computing the potential entropy of the data field. The outcome is the generation of a potential entropy distribution map, visually represented in Figure 4. Notably, the analysis yields a minimum potential entropy value of 8.197. At this stage, the value of the distance parameter σ is established as 1.5, with the unit of measurement in kilometers. The optimal value for the distance parameter is thus determined to be 1500 m. The selection of a 1.5 km distance coefficient is informed by the spatial characteristics and dynamics of the taxi data, coupled with the features of the research area. Opting for this coefficient signifies the significance of impact or interaction within a 1.5 km radius from each taxi OD point with other data points or features. This aligns with the operational context of taxis, predominantly serving urban core areas where passengers typically choose taxis within relatively close proximity.
In accordance with the outcomes of the potential entropy calculations, a grid system with grid cells having a side length of 1.5 km has been established to comprehensively encompass the entire study area. The results of this grid partitioning are illustrated in Figure 5, depicting the comprehensive spatial coverage achieved through the grid network.

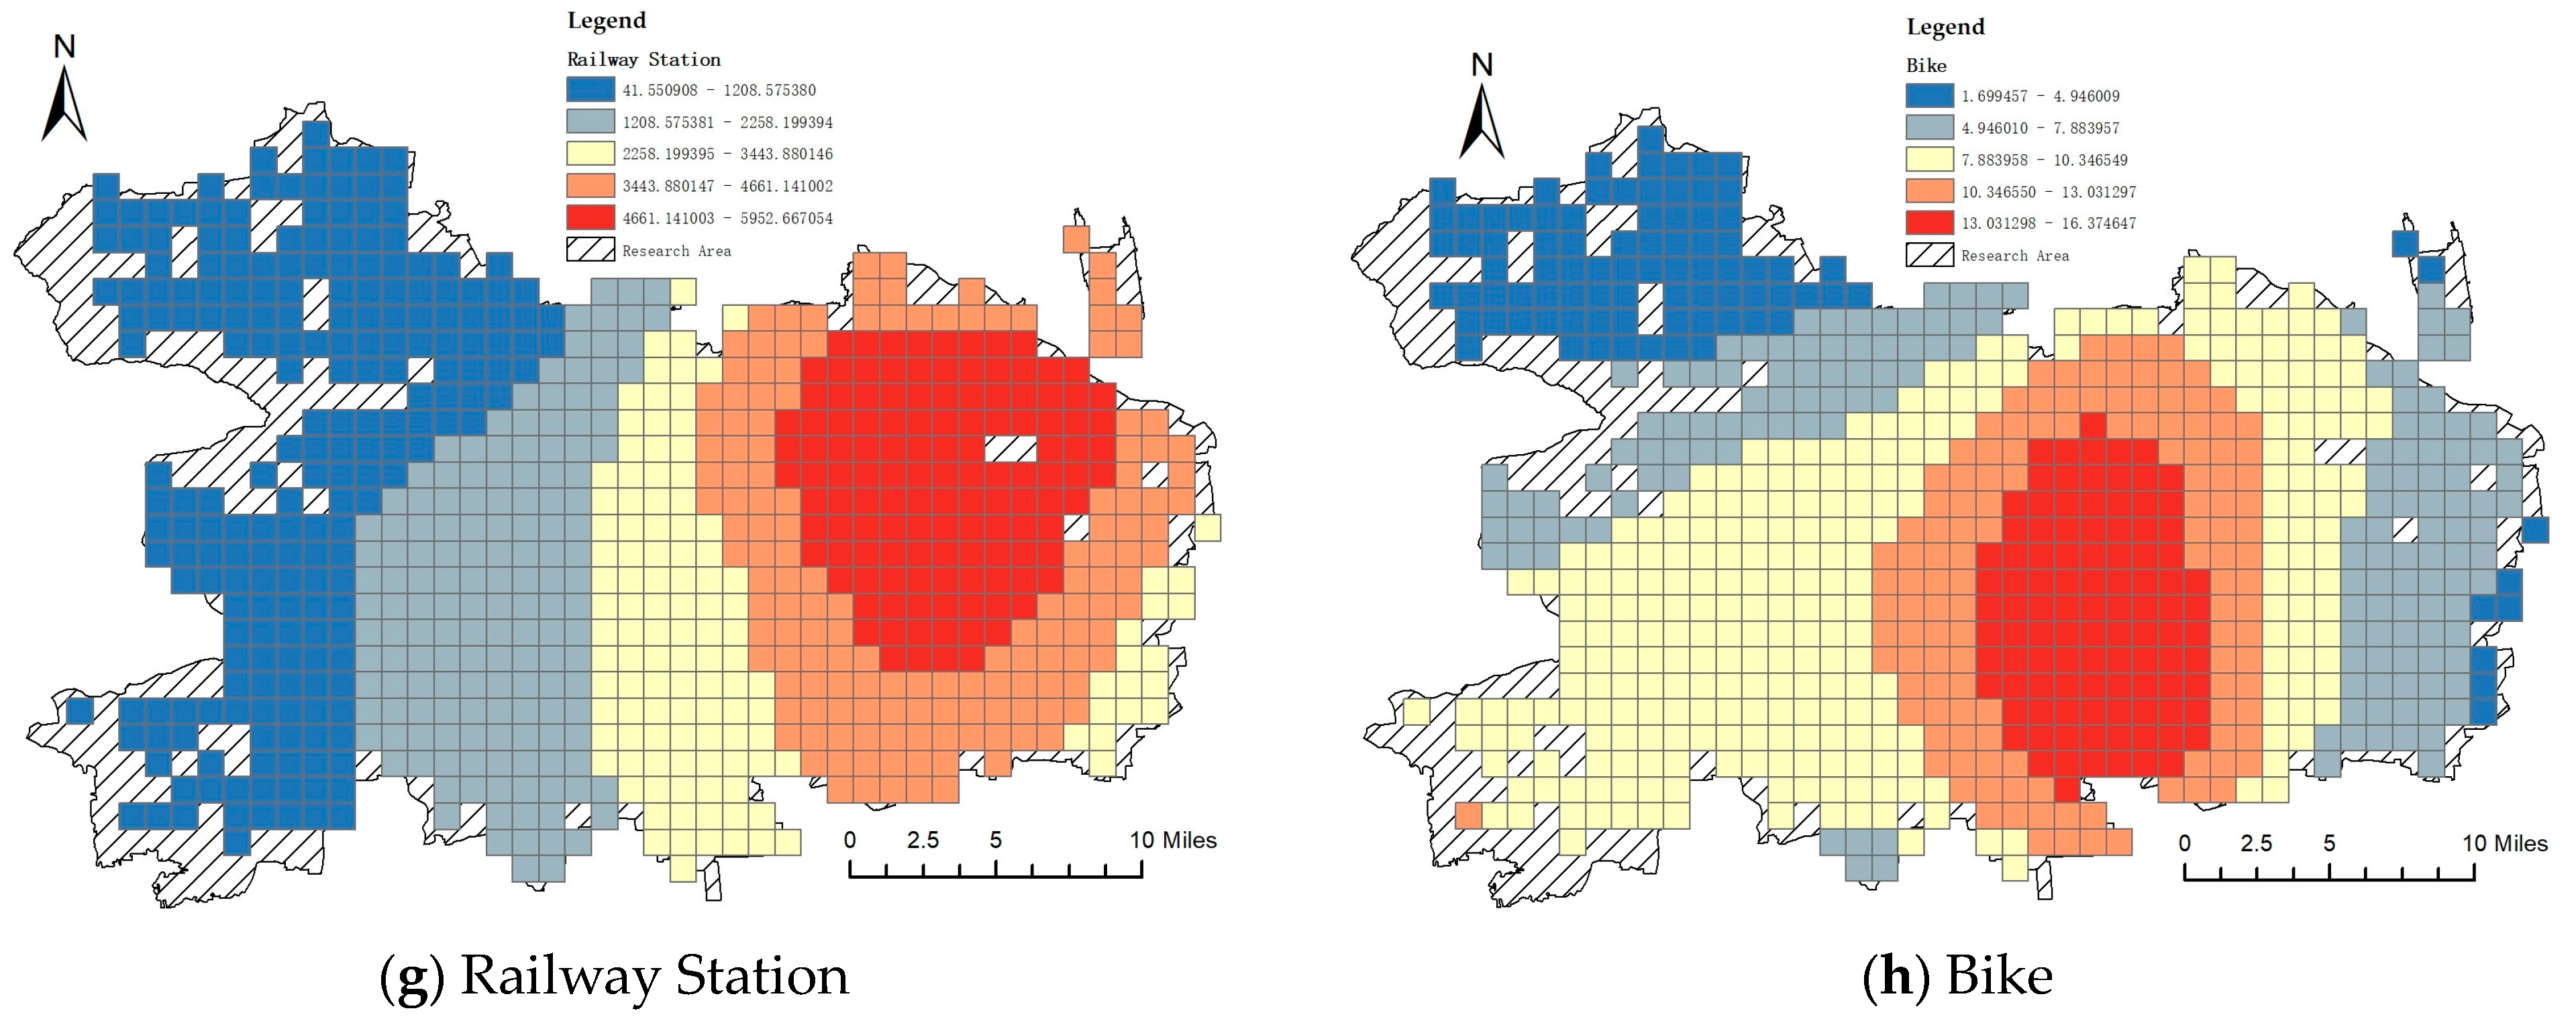
4.2. Geographically Weighted Regression Analysis

Following grid partitioning, the computation of taxi OD trajectory points in each grid cell for distinct time intervals is executed. Subsequently, the count of various influencing factor data points categories within each grid cell is also determined. Using the geometric center of each grid cell as coordinate parameters, the count of taxi OD trajectory points within each grid cell is considered as the dependent variable, and the count of different influencing factor data points categories as the independent variables. GWR is employed for regression analysis. This process is separately conducted for both origin and arrival types during the 7:00–9:00 and 17:00–19:00 time intervals, resulting in four sets of regression results. Each set of results undergoes spatial visualization and categorization based on the natural breaks method. The results are illustrated in Figure 6, Figure 7, Figure 8 and Figure 9. The figures reflect the results of the GWR regression, represented by regression coefficients. A positive coefficient indicates a positive influence of the factor on taxi usage, while a negative coefficient indicates a negative influence. The magnitude of the coefficient reflects the strength of the influence. In Figure 6, Figure 7, Figure 8 and Figure 9, the spatial visualization results for each type of influencing factor are presented. Specifically, subfigure (a) represents Bus Station, (b) represents Bus Stop, (c) represents Crossing, (d) represents Fuel, (e) represents Parking, (f) represents Parking Bicycle, (g) represents Railway Station, and (h) represents Bike.
The GWR results for the 7:00–9:00 time period regarding the origin points are illustrated in Figure 6. Visualizations of different influencing factor data points categories are presented as follows:
(1) Bus Station Visualization (Figure 6a): the majority of areas demonstrate positive values, signifying a favorable impact of long-distance bus stations on taxi pick-up demands. The outcomes showcase a step-like distribution, with elevated positive values primarily concentrated in the southeastern sector of the study area, notably in the southern region of Chaoyang District. Conversely, regions with negative values are positioned in the northwest part of the study area, aligning with the central area of Haidian District.
(2) Bus Stop Visualization (Figure 6b): favorable values are evident throughout all regions, indicating an overall positive correlation between bus stops and taxis. The outcomes exhibit a circular distribution pattern, with the most substantial positive values concentrated in the southern region of Chaoyang District, aligning with the observations in the Bus Station visualization.
(3) Crossing Visualization (Figure 6c): the majority of regions exhibit negative values, signifying a decrease in taxi demand within areas characterized by a substantial number of road crossings. Interestingly, the most elevated positive values are situated in the northwest section of the study area, corresponding to the central region of Haidian District.
(4) Fuel Visualization (Figure 6d): most regions display negative values, forming a circular distribution pattern. Notably, negative values are conspicuous in the central part of the study area, with occasional positive values scattered toward the periphery.
(5) Parking Visualization (Figure 6e): the majority of regions display positive values, manifesting a distinct circular pattern. The coefficients progressively increase from the lowest point at the center of the study area outward, with the central core areas of Beijing, specifically Dongcheng and Xicheng Districts, exhibiting the highest positive values.
(6) Parking Bicycle Visualization (Figure 6f): the distribution of positive and negative values mirrors the Parking Visualization. The western side of the study area is predominantly characterized by negative values, whereas the eastern side, particularly in the southern part of Chaoyang District, exhibits a noticeable surge in positive values.
(7) Railway Station Visualization (Figure 6g): positive values are evident across all regions, suggesting a pronounced affinity between taxi services and subway stations. The outcomes follow a step-like progression, gradually diminishing from east to west. The central area of Chaoyang District displays the highest positive values, implying a proclivity for taxi utilization near subway stations in this locale.
(8) Bike (Figure 6h): all regions exhibit positive values, indicating areas with dense bike-sharing activities often experience higher demand for taxi services. It is noteworthy that regions with higher positive values are concentrated in the central area of the study region, forming an elliptical pattern. This central area comprises Dongcheng District and Xicheng District, serving as the core functional zone of Beijing. The positive influence gradually diminishes from the central position towards both sides. The minimum positive values are observed at the left a€nd right edges of the region.
The GWR results for destination points during the 7:00–9:00 time period are depicted in Figure 7. For the sake of clarity, segments with zero regression results have been excluded from this visualization. The visualized outcomes for various influencing factor data points categories are elaborated as follows:
(1) Bus Station Visualization (Figure 7a): the Bus Station visualization for destination points is akin to that of origin points (Figure 7a), albeit with fewer negative values.
(2) Bus Stop Visualization (Figure 7b): in contrast to origin points, the Bus Stop visualization for destination points exhibits more pronounced positive values (Figure 7b) while maintaining similarities in other features.
(3) Crossing Visualization (Figure 7c): the Crossing visualization for destination points bears resemblance to that of origin points, albeit with slightly fewer negative values (Figure 7c).
(4) Fuel Visualization (Figure 7d): the Fuel visualization results closely resemble those observed for origin points (Figure 7d), featuring more extensive and prominent negative regions.
(5) Parking Visualization (Figure 7e): the Parking visualization outcomes for destination points are similar to those for origin points (Figure 7e). However, it is noteworthy that all results for destination points are positive, indicating that parking areas often serve as passengers’ destinations.
(6) Parking Bicycle, Railway Station, and Bike Visualizations (Figure 7f–h): the visualizations for Parking Bicycle, Railway Station, and Bike categories concerning destination points are largely similar to those observed for origin points (Figure 6f–h).
In summary, the geographically weighted regression results for destination points during the 7:00–9:00 time frame share similarities with origin points in various influencing factor data points categories, with distinctions in the magnitude and distribution of positive and negative values.
The GWR outcomes for origin points during the 17:00–19:00 time interval are illustrated in Figure 8. For the sake of clarity, segments with zero regression results have been excluded from this visualization. The results are visualized for various influencing factor data points categories, including Bus Station, Crossing, Fuel, Parking Bicycle, and Bike (Figure 8a,c,d,f,h). Additionally, the Parking visualization for origin points during this time slot exhibits a pattern akin to that of the origin points between 7:00 and 9:00, with positive regression results. This suggests that during the evening hours, parking areas are frequently the starting points for passengers (Figure 8e). Furthermore, the Railway Station visualization for origin points aligns closely with the outcomes observed during the 7:00–9:00 time frame, displaying more prominent positive values (Figure 8g).
The GWR results for destination points during the 17:00–19:00 time period are depicted in Figure 9. A comparative analysis reveals that the numerical values and spatial distribution patterns of the regression outcomes are generally consistent with those observed for the origin points.

5. Discussion

This study is based on the data field theory, which involves grid partitioning within the research area, followed by the application of GWR models to investigate the influencing factors of taxi travel within the urban core. This research comprehensively analyzes taxi OD trajectory points and various transportation-related influencing factors within different grid cells across various time intervals. The study employs GWR to investigate the relationships between taxi pick-up and drop-off locations and different categories of influencing factors. This analysis is conducted separately for the 7:00–9:00 and 17:00–19:00 time periods, resulting in four sets of regression results. These outcomes are visually represented and categorized using the natural breaks method, with Figure 6, Figure 7, Figure 8 and Figure 9 depicting these results.
During the 7:00–9:00 time interval, the GWR results reveal several key observations regarding origin points: bus stations have a significant positive impact on taxi demand, with positive values mainly concentrated in the southeastern part of the study area. Bus stops also exhibit a positive influence, with the highest positive values located in the same southern region of Chaoyang District. Areas with dense road crossings show reduced taxi demand. Most regions display negative values in the case of fuel, with occasional positive values at the periphery. Parking areas positively affect taxi demand, with the central core areas of Beijing showing the highest positive values. Bicycle parking and railway stations attract taxi services, particularly in the eastern and central regions. Bike-sharing points also exhibit an overall positive effect, with high positive values concentrated in the central region of the study area.
For destination points during the 7:00–9:00 period, the regression results are similar to those for origin points, although the magnitude of positive and negative values may differ. In the 17:00–19:00 time interval, the origin point results align with those of the 7:00–9:00 period, indicating that similar patterns persist into the evening hours. Parking areas also frequently serve as starting points for passengers during this time. Finally, for destination points during the 17:00–19:00 period, the regression results generally correspond with those of origin points, indicating that the relationship between taxi demand and various POI categories remains consistent throughout the day.
In summary, this study thoroughly explores the spatiotemporal variations in taxi demand and its associations with various influencing factors, providing valuable insights for urban transportation planning and management.
Based on the above analysis, recommendations can be provided to taxi drivers, passengers, and relevant transportation authorities:
(1) For Taxi Drivers: during peak traffic hours, taxi drivers can significantly enhance their passenger pickup rates and income by strategically positioning themselves in key areas known for high passenger demand, such as long-distance bus stations, bus stops, parking zones, and train stations. Understanding the flow of passengers in these locations allows drivers to maximize their chances of picking up passengers quickly and efficiently. In the evening, parking areas often become preferred boarding points for passengers. Drivers can capitalize on this trend by actively seeking passengers in regions with frequent evening activities and entertainment, such as restaurants, theaters, and nightlife hotspots, ensuring a steady stream of passengers looking for convenient transportation options after their evening out. Additionally, there is a positive correlation between the activities of bike-sharing and the demand for taxis. Drivers can increase their cruising frequency in areas dense with bike-sharing users, positioning themselves near popular bike-sharing stations to enhance their opportunities to find new fares. Optimizing route planning using real-time traffic information is crucial; by selecting congestion-free routes to popular areas, drivers can reduce travel time, improve operational efficiency, and increase the number of trips they can complete within a given period. Regularly monitoring significant urban events and activities enables drivers to proactively plan their service strategies. Events such as exhibitions, concerts, sports games, and other gatherings often lead to a surge in taxi demand. Staying informed about these events allows drivers to position themselves strategically to meet the increased demand. Considering collaboration with bike-sharing platforms can provide additional strategic advantages, as obtaining information on bike-sharing hotspots through platform data enables drivers to understand where bike-sharing users are likely to end their rides, this allows them to be present at the right locations to pick up these passengers. Integrating technology into daily operations further enhances service delivery; using apps and platforms that provide real-time updates on traffic conditions, event schedules, and bike-sharing activity helps drivers make informed decisions quickly. Additionally, participating in driver networks or communities where information is shared about high-demand areas provides a collective advantage, helping drivers stay ahead of the competition. By implementing these strategies, taxi drivers can optimize their operations, increase their efficiency, and ultimately boost their income by better meeting the dynamic demands of urban transportation.
(2) For Passengers: during peak hours, especially in the morning and evening, opting to wait for taxis in hotspot areas like long-distance bus stations and bus stops allows for quicker access to taxi services. If a taxi is needed after evening activities, considering parking areas as pickup points is advisable, as these locations typically have more taxis waiting for passengers, enhancing the convenience of hailing a cab. For bike-sharing users, alighting near bike-sharing hotspots and utilizing shared bikes to address the last-mile challenge not only solves the final leg of the journey but also improves the accessibility of taxi services. Additionally, choosing these strategies helps manage time and travel more efficiently during peak periods, reducing wait times and making use of existing transportation resources in a more convenient and effective manner. By optimizing the combination of these transportation methods, passengers can more flexibly navigate the complexities of urban traffic, achieving a smoother and more seamless travel experience.
(3) For Transportation Authorities: in the core areas of Beijing, particularly in the south and southeast, optimizing transportation hubs and enhancing traffic services in hotspot areas like long-distance bus stations, bus stops, and railway stations should be prioritized. Taxi demand is noticeably lower in high-density intersection areas, indicating the need to improve the traffic capacity of these intersections to reduce congestion and enhance overall traffic efficiency. Utilizing the data field theory and geographically weighted regression model as mentioned in the study, developing an intelligent traffic management system can provide a deeper understanding of and more effective response to the dynamic changes in urban taxi demand, thereby significantly improving urban mobility. Addressing the parking demand during peak hours involves establishing additional parking areas, especially around event venues and transportation hubs, to accommodate the increased need for parking during these times. Policymaking should also encourage collaboration between the bike-sharing and taxi industries, facilitating the sharing of data resources to enhance overall urban mobility efficiency. By integrating these measures, the city can create a more seamless and efficient transportation network, catering to the needs of residents and visitors alike while alleviating congestion and improving the overall quality of urban transportation. Additionally, implementing these strategies will contribute to a more sustainable and user-friendly transportation system, fostering a better urban living environment.
In conclusion, this research provides valuable insights into the dynamics of taxi demand, its spatiotemporal variations, and its relationship with various POI categories, offering significant contributions to urban transportation planning and management.

6. Conclusions

In summary, this study employed the theory of spatial data to perform grid partitioning in the research area. Subsequently, it extensively investigated the relationship between taxi travel in the urban core area and various influencing factor categories using the GWR model. The research comprehensively analyzed the distribution of taxi Origin-Destination trajectory points and various transportation-related influencing factors within different grid units across different time intervals, presenting the findings through spatial visualization. Through this study, the following conclusions were drawn:
Firstly, during the 7:00–9:00 time period, it was observed that the presence of long-distance bus stations, bus stops, parking areas, and railway stations significantly increased taxi demand, particularly in the southern and southeastern parts of the Chaoyang District. Conversely, areas with high-density intersections exhibited relatively lower taxi demand. These findings offer valuable information to taxi drivers regarding optimal waiting locations, enabling them to better cater to passenger needs. For passengers, choosing to wait for taxis in these hotspot areas may be more convenient. Additionally, the proximity to railway stations appeared to correlate with increased demand for taxis, possibly due to the needs of long-distance travelers. The same high demand for cabs exists in the areas where shared bikes are used, especially in the center of the study area. Secondly, during the 17:00–19:00 time period, the patterns for origin points resembled those in the morning, with long-distance bus stations, bus stops, parking, and bike-sharing areas continuing to be high-demand areas for taxis. Notably, parking areas often served as starting points for passengers during this time slot, potentially linked to evening activities and entertainment. Furthermore, areas in close proximity to railway stations remained popular pickup points for taxis. This study provides valuable insights into the spatial and temporal variations in taxi demand and its correlation with different influencing factor categories. The findings offer valuable information for urban transportation planning and management.
In this study, despite obtaining significant findings and conclusions, several limitations need to be acknowledged, and prospects for future research are outlined. Firstly, one of the limitations of this study is the exclusive consideration of the relationship between taxi demand and transportation-related influencing factors, without giving full consideration to other potential factors that may influence taxi demand. Factors such as weather conditions, traffic incidents, special holidays, and urban events can significantly impact taxi demand. Future research could incorporate these factors into the model to comprehensively analyze and forecast variations in taxi demand. This would contribute to improving the responsiveness and efficiency of taxi services to better meet passenger needs. Secondly, this study primarily focused on the urban core area, and the patterns of taxi demand in suburban and rural areas have not been extensively investigated. These areas often possess distinct traffic and demographic characteristics, potentially resulting in variations in taxi demand. Future research could extend its scope to a broader geographical range to understand the taxi demand patterns in different regions, offering guidance for more effective urban taxi service planning. Additionally, this study predominantly concentrated on the spatiotemporal variations of taxi demand while giving limited consideration to supply-side factors of taxi services. Factors related to taxi drivers’ behaviors and decisions, as well as strategies implemented by taxi service providers, remain understudied. Future research could delve into supply-side aspects to achieve better supply–demand alignment in the taxi service sector. Finally, the data used in this study were based on observations within specific time intervals, while urban transportation demand exhibits seasonal and long-term trends. Future research could utilize data covering longer time spans to comprehensively understand the changing trends in urban taxi demand.
In conclusion, despite the limitations, this study provides valuable insights into the spatiotemporal characteristics of taxi demand in urban areas. Future research endeavors should aim to overcome these limitations and further explore opportunities for optimizing taxi services and enhancing urban transportation planning.

Author Contributions

Conceptualization, D.T., M.Z., X.L. and J.L.; data curation, M.Z.; formal analysis, J.L.; investigation, D.T.; methodology, X.L. and J.L.; project administration, X.L.; software, M.Z.; supervision, J.L.; writing—original draft, M.Z. All authors have read and agreed to the published version of the manuscript.

Funding

This work was funded by Beijing Social Science Fund: Innovation research on fine governance mechanism of backstreets and alleys in Beijing’s old city (Z23167), Doctoral Research Ability Improvement Program of Beijing University of Civil Engineering and Architecture (DG2023004).

Institutional Review Board Statement

Not applicable.

Informed Consent Statement

Not applicable.

Data Availability Statement

https://github.com/JILLIC/Data, URL (accessed on 26 July 2024). This link provides access to publicly archived datasets that were analyzed and generated during the study.

Acknowledgments

The authors would like to thank all of the reviewers for their valuable contributions to this work.

Conflicts of Interest

The authors declare no conflicts of interest.

References

  1. Vansteenwegen, P.; Souffriau, W.; Berghe, G.V.; Oudheusden, D.V. The City Trip Planner: An Expert System for Tourists. Expert Syst. Appl. 2011, 38, 6540–6546. [Google Scholar] [CrossRef]
  2. Dolnicar, S.; Laesser, C.; Matus, K. Short-Haul City Travel Is Truly Environmentally Sustainable. Tour. Manag. 2010, 31, 505–512. [Google Scholar] [CrossRef]
  3. Le-Klähn, D.T.; Hall, C.M. Tourist use of public transport at destinations–a review. Curr. Issues Tour. 2015, 18, 785–803. [Google Scholar] [CrossRef]
  4. Hall, C.M.; Le-Klähn, D.T.; Ram, Y. Tourism, Public Transport and Sustainable Mobility; Channel View Publications; Taylor & Francis: Abingdon, UK, 2017; Volume 4. [Google Scholar]
  5. Cai, H.; Jia, X.; Chiu, A.S.F.; Hu, X.; Xu, M. Siting Public Electric Vehicle Charging Stations in Beijing Using Big-Data Informed Travel Patterns of the Taxi Fleet. Transp. Res. Part D Transp. Environ. 2014, 33, 39–46. [Google Scholar] [CrossRef]
  6. Kamga, C.; Yazici, M.A.; Singhal, A. Analysis of Taxi Demand and Supply in New York City: Implications of Recent Taxi Regulations. Transp. Plan. Technol. 2015, 38, 601–625. [Google Scholar] [CrossRef]
  7. Yang, W.H.; Wong, R.C.P.; Szeto, W.Y. Modeling the Acceptance of Taxi Owners and Drivers to Operate Premium Electric Taxis: Policy Insights into Improving Taxi Service Quality and Reducing Air Pollution. Transp. Res. Part A Policy Pract. 2018, 118, 581–593. [Google Scholar] [CrossRef]
  8. Chen, T.-Y.; Chang, H.-L.; Tzeng, G.-H. Using Fuzzy Measures and Habitual Domains to Analyze the Public Attitude and Apply to the Gas Taxi Policy. Eur. J. Oper. Res. 2002, 137, 145–161. [Google Scholar] [CrossRef]
  9. Mukai, N.; Yoden, N. Taxi Demand Forecasting Based on Taxi Probe Data by Neural Network. In Intelligent Interactive Multimedia: Systems and Services; Watanabe, T., Watada, J., Takahashi, N., Howlett, R.J., Jain, L.C., Eds.; Springer: Berlin/Heidelberg, Germany, 2012; pp. 589–597. [Google Scholar]
  10. Yang, C.; Gonzales, E.J. Modeling Taxi Trip Demand by Time of Day in New York City. Transp. Res. Rec. J. Transp. Res. Board 2014, 2429, 110–120. [Google Scholar] [CrossRef]
  11. Wong, R.C.P.; Szeto, W.Y.; Wong, S.C. Bi-Level Decisions of Vacant Taxi Drivers Traveling towards Taxi Stands in Customer-Search: Modeling Methodology and Policy Implications. Transp. Policy 2014, 33, 73–81. [Google Scholar] [CrossRef]
  12. Szeto, W.Y.; Wong, R.C.P.; Yang, W.H. Guiding Vacant Taxi Drivers to Demand Locations by Taxi-Calling Signals: A Sequential Binary Logistic Regression Modeling Approach and Policy Implications. Transp. Policy 2019, 76, 100–110. [Google Scholar] [CrossRef]
  13. Jianqin, Z.; Peiyuan, Q.; Yingchao, D.; Mingyi, D.; Feng, L. A Space-Time Visualization Analysis Method for Taxi Operation in Beijing. J. Vis. Lang. Comput. 2015, 31, 1–8. [Google Scholar] [CrossRef]
  14. Horsu, E.N.; Yeboah, S.T. Influence of Service Quality on Customer Satisfaction: A Study of Minicab Taxi Services in Cape Coast, Ghana. Int. J. Econ. Commer. Manag. 2015, 3, 1451–1464. [Google Scholar]
  15. Nguyen-Phuoc, D.Q.; Su, D.N.; Tran, P.T.K.; Le, D.-T.T.; Johnson, L.W. Factors Influencing Customer’s Loyalty towards Ride-Hailing Taxi Services—A Case Study of Vietnam. Transp. Res. Part A Policy Pract. 2020, 134, 96–112. [Google Scholar] [CrossRef]
  16. Xu, T.; Zhu, H.; Zhao, X.; Liu, Q.; Xiong, H. Taxi Driving Behavior Analysis in Latent Vehicle-to-Vehicle Networks: A Social Influence Perspective. In Proceedings of the 22nd ACM SIGKDD International Conference, San Francisco, CA, USA, 13–17 August 2016. [Google Scholar]
  17. Huang, Y.-W.; Lin, P.-C.; Wang, J. The Influence of Bus and Taxi Drivers’ Public Self-Consciousness and Social Anxiety on Aberrant Driving Behaviors. Accid. Anal. Prev. 2018, 117, 145–153. [Google Scholar] [CrossRef]
  18. Kamga, C.; Yazici, M.A.; Singhal, A. Hailing in the Rain: Temporal and Weather-Related Variations in Taxi Ridership and Taxi Demand-Supply Equilibrium. In Proceedings of the Transportation Research Board Annual Meeting, Washington DC, USA, 13–17 January 2013. [Google Scholar]
  19. Liu, Y.; Yan, X.; Wang, Y.; Yang, Z.; Wu, J. Grid Mapping for Spatial Pattern Analyses of Recurrent Urban Traffic Congestion Based on Taxi GPS Sensing Data. Sustainability 2017, 9, 533. [Google Scholar] [CrossRef]
  20. Kong, X.; Yang, J.; Yang, Z. Measuring Traffic Congestion with Taxi GPS Data and Travel Time Index. In Proceedings of the Cota International Conference of Transportation Professionals, Beijing, China, 24–27 July 2015. [Google Scholar]
  21. Lyu, Y.; Chow, C.-Y.; Lee, V.C.S.; Li, Y.; Zeng, J. T2CBS: Mining Taxi Trajectories for Customized Bus Systems. In Proceedings of the 2016 IEEE Conference on Computer Communications Workshops (INFOCOM WKSHPS), San Francisco, CA, USA, 10–14 April 2016; pp. 441–446. [Google Scholar]
  22. Tang, L.; Sun, F.; Kan, Z.; Ren, C.; Cheng, L. Uncovering Distribution Patterns of High Performance Taxis from Big Trace Data. ISPRS Int. J. Geo-Inf. 2017, 6, 134. [Google Scholar] [CrossRef]
  23. Wang, H.; Huang, H.; Ni, X.; Zeng, W. Revealing Spatial-Temporal Characteristics and Patterns of Urban Travel: A Large-Scale Analysis and Visualization Study with Taxi GPS Data. ISPRS Int. J. Geo-Inf. 2019, 8, 257. [Google Scholar] [CrossRef]
  24. Wang, Y.; Qin, K.; Chen, Y.; Zhao, P. Detecting Anomalous Trajectories and Behavior Patterns Using Hierarchical Clustering from Taxi GPS Data. IJGI 2018, 7, 25. [Google Scholar] [CrossRef]
  25. Wong, R.C.P.; Szeto, W.Y.; Wong, S.C. A Two-Stage Approach to Modeling Vacant Taxi Movements. Transp. Res. Procedia 2015, 7, 254–275. [Google Scholar] [CrossRef]
  26. Albalate, D.; Bel, G. Tourism and urban public transport: Holding demand pressure under supply constraints. Tour. Manag. 2010, 31, 425–433. [Google Scholar] [CrossRef]
  27. La, Q.N.; Lee, A.H.; Meuleners, L.B.; Van Duong, D. Prevalence and Factors Associated with Road Traffic Crash among Taxi Drivers in Hanoi, Vietnam. Accid. Anal. Prev. 2013, 50, 451–455. [Google Scholar] [CrossRef] [PubMed]
  28. Chen, D.; Wang, J.; Xiong, C. Research on Origin-Destination Travel Demand Prediction Method of Inter-Regional Online Taxi Based on SpatialOD-BiConvLSTM. IET Intell. Transp. Syst. 2021, 15, 1533–1547. [Google Scholar] [CrossRef]
  29. Qu, H.; Zhao, Z. The Application of Lagrange Relaxation on Taxi Dispatchments During Evening Rush Hours. J. Phys. Conf. Ser. 2020, 1650, 032019. [Google Scholar] [CrossRef]
  30. Qian, X.; Ukkusuri, S.V. Spatial Variation of the Urban Taxi Ridership Using GPS Data. Appl. Geogr. 2015, 59, 31–42. [Google Scholar] [CrossRef]
  31. Cui, H.; Wu, L.; Hu, S.; Lu, R.; Wang, S. Recognition of Urban Functions and Mixed Use Based on Residents’ Movement and Topic Generation Model: The Case of Wuhan, China. Remote Sens. 2020, 12, 2889. [Google Scholar] [CrossRef]
  32. Lyu, T.; Wang, P.S.; Gao, Y.; Wang, Y. Research on the Big Data of Traditional Taxi and Online Car-Hailing: A Systematic Review. J. Traffic Transp. Eng. 2021, 8, 1–34. [Google Scholar] [CrossRef]
  33. Faghih-Imani, A.; Anowar, S.; Miller, E.J.; Eluru, N. Hail a cab or ride a bike? A travel time comparison of taxi and bicycle-sharing systems in New York City. Transp. Res. Part A Policy Pract. 2017, 101, 11–21. [Google Scholar] [CrossRef]
  34. Dai, H.; Tao, Y.; Lin, H. Visual analytics of urban transportation from a bike-sharing and taxi perspective. In Proceedings of the 12th International Symposium on Visual Information Communication and Interaction, Shanghai, China, 20–22 September 2019; pp. 1–8. [Google Scholar]
  35. Ni, Y.; Chen, J. Exploring the effects of the built environment on two transfer modes for metros: Dockless bike sharing and taxis. Sustainability 2020, 12, 2034. [Google Scholar] [CrossRef]
  36. Jiang, W. Bike sharing usage prediction with deep learning: A survey. Neural Comput. Appl. 2022, 34, 15369–15385. [Google Scholar] [CrossRef]
  37. Kou, Z.; Cai, H. Understanding bike sharing travel patterns: An analysis of trip data from eight cities. Phys. A Stat. Mech. Its Appl. 2019, 515, 785–797. [Google Scholar] [CrossRef]
  38. Wu, J.; He, Q.; Chen, Y.; Lin, J.; Wang, S. Dismantling the Fence for Social Justice? Evidence Based on the Inequity of Urban Green Space Accessibility in the Central Urban Area of Beijing. Environ. Plan. B Urban Anal. City Sci. 2020, 47, 626–644. [Google Scholar] [CrossRef]
  39. Thomas, A. Development and Properties of 0.25-Degree Gridded Evapotranspiration Data Fields of China for Hydrological Studies. J. Hydrol. 2008, 358, 145–158. [Google Scholar] [CrossRef]
  40. Chen, Y.; Yue, W.; La Rosa, D. Which Communities Have Better Accessibility to Green Space? An Investigation into Environmental Inequality Using Big Data. Landsc. Urban Plan. 2020, 204, 103919. [Google Scholar] [CrossRef]
  41. He, N.; Gan, W.Y.; Li, D.Y. Evaluate nodes importance in the network using data field theory. In Proceedings of the 2007 International Conference on Convergence Information Technology (ICCIT 2007), Gyeongju, Republic of Korea, 21–23 November 2007; IEEE: Piscataway, NJ, USA, 2007; pp. 1225–1234. [Google Scholar]
  42. Zhou, C.; Huang, H.; Liu, Z.; Ding, Y.; Xiao, J.; Shu, Y. Identification and analysis of ship carbon emission hotspots based on data field theory: A case study in Wuhan Port. Ocean Coast. Manag. 2023, 15, 106479. [Google Scholar] [CrossRef]
  43. Qin, K.; Zhou, Q.; Wu, T.; Xu, Y.Q. Hotspots detection from trajectory data based on spatiotemporal data field clustering. The International Archives of the Photogrammetry. Remote. Sens. Spat. Inf. Sci. 2017, 14, 1319–1325. [Google Scholar]
  44. Athanesious, J.J.; Chakkaravarthy, S.S.; Vasuhi, S.; Vaidehi, V. Trajectory based abnormal event detection in video traffic surveillance using general potential data field with spectral clustering. Multimed. Tools Appl. 2019, 78, 19877–19903. [Google Scholar] [CrossRef]
  45. Wang, H.; Deng, Y.; Wang, L.; Guan, X. A c-means algorithm based on data field. Geomat. Inf. Sci. Wuhan Univ. 2009, 34, 626–629. [Google Scholar]
  46. Lu, B.; Yang, W.; Ge, Y.; Harris, P. Improvements to the Calibration of a Geographically Weighted Regression with Parameter-Specific Distance Metrics and Bandwidths. Comput. Environ. Urban Syst. 2018, 71, 41–57. [Google Scholar] [CrossRef]
  47. Tang, J.; Gao, F.; Liu, F.; Zhang, W.; Qi, Y. Understanding Spatio-Temporal Characteristics of Urban Travel Demand Based on the Combination of GWR and GLM. Sustainability 2019, 11, 5525. [Google Scholar] [CrossRef]
  48. Tang, J.; Gao, F.; Han, C.; Cen, X.; Li, Z. Uncovering the Spatially Heterogeneous Effects of Shared Mobility on Public Transit and Taxi. J. Transp. Geogr. 2021, 95, 103134. [Google Scholar] [CrossRef]
  49. Basak, E.; Iris, Ç. Shifting Gears: Examining the Complementary and Substitution Effects of Bikesharing Platforms on Public Transit. Available online: https://ssrn.com/abstract=4391093 (accessed on 16 January 2023).
Figure 1. Study area.
Sustainability 16 07386 g001
Figure 2. Spatial visualization of POI data.
Sustainability 16 07386 g002
Figure 3. Technology roadmap.
Sustainability 16 07386 g003
Figure 4. Potential entropy calculation.
Sustainability 16 07386 g004
Figure 5. Grid division.
Sustainability 16 07386 g005
Figure 6. GWR regression results for origin points from 7:00 to 9:00: (a) Bus Station; (b) Bus Stop; (c) Crossing; (d) Fuel; (e) Parking; (f) Parking Bicycle; (g) Railway Station; (h) Bike.
Sustainability 16 07386 g006aSustainability 16 07386 g006b
Figure 7. GWR regression results for destination points from 7:00 to 9:00: (a) Bus Station; (b) Bus Stop; (c) Crossing; (d) Fuel; (e) Parking; (f) Parking Bicycle; (g) Railway Station; (h) Bike.
Sustainability 16 07386 g007aSustainability 16 07386 g007b
Figure 8. GWR regression results for origin points from 17:00 to 19:00: (a) Bus Station; (b) Bus Stop; (c) Crossing; (d) Fuel; (e) Parking; (f) Parking Bicycle; (g) Railway Station; (h) Bike.
Sustainability 16 07386 g008aSustainability 16 07386 g008b
Figure 9. GWR regression results for destination points from 17:00 to 19:00: (a) Bus Station; (b) Bus Stop; (c) Crossing; (d) Fuel; (e) Parking; (f) Parking Bicycle; (g) Railway Station; (h) Bike.
Sustainability 16 07386 g009aSustainability 16 07386 g009b
Table 1. Taxi OD data contents table.
Data NameData Field NameData Field ContentData Size
Taxi OD dataTIMECollection time3,600,000 entries
TAXI_IDTaxi license plate number
O_LATITUDELatitude of origin/°
O_LONGITUDELongitude of origin/°
D_LATITUDELatitude of destination/°
D_LONGITUDELongitude of destination/°
Table 2. Bike-sharing data contents table.
Data NameData SizeData Field ContentData Field Name
Bike-sharing location data376, 893 entriesCollection timeTIME
Bike-sharing ID numberBIKE_ID
Latitude/°LATITUDE
Longitude/°LONGITUDE
Table 3. POI data contents table.
Data NameData Size/EntriesData Description
Bus Station30Long-distance bus station
Bus Stop4030Roadside bus stop
Crossing3075Intersection in the middle of the road
Fuel70Gas station
Parking175Car parking lot (both open-air and underground)
Parking Bicycle32Bike-sharing parking hub
Railway Station319Urban subway stations
Disclaimer/Publisher’s Note: The statements, opinions and data contained in all publications are solely those of the individual author(s) and contributor(s) and not of MDPI and/or the editor(s). MDPI and/or the editor(s) disclaim responsibility for any injury to people or property resulting from any ideas, methods, instructions or products referred to in the content.

