Article

Assessment and Prediction of Health and Agricultural Impact from Combined PM2.5 and O3 Pollution in China

Key Laboratory of Beijing on Regional Air Pollution Control, Faculty of Environmental Science and Engineering, Beijing University of Technology, Beijing 100124, China
*
Author to whom correspondence should be addressed.
Sustainability 2024, 16(17), 7391; https://doi.org/10.3390/su16177391
Submission received: 24 May 2024 / Revised: 18 July 2024 / Accepted: 23 August 2024 / Published: 27 August 2024
(This article belongs to the Section Air, Climate Change and Sustainability)

Abstract

:
Combined PM2.5 and O3 pollution in China has caused negative health impacts on residents and reduced crop yields. The quantitative assessment and prediction of these impacts could provide a scientific basis for policy development. This study assessed the nationwide premature mortality, health effects, and crop damage attributable to PM2.5 and O3 pollution in 2019, and projected the associated health and agricultural losses under a business-as-usual (BAU) scenario for 2025. The economic benefits of improving air quality under different policy scenarios, including the 14th Five-Year Plan (FFP), Secondary Standard Limit (SSL), and Primary Standard Limit (PSL), were also explored. The results showed PM2.5 pollution in 2019 resulted in 246,000 all-cause premature deaths and the economic health loss was RMB 196.509 billion. Similarly, O3 pollution caused 186,300 premature deaths and the economic health loss was RMB 155.807 billion. O3 pollution has led to a loss of 28.5241 million tonnes of crop production and an economic loss of RMB 62.268 billion. Compared with 2019, the avoidable premature deaths from PM2.5 under different scenarios in 2025 were 50,600, 43,000, and 200,300 cases, respectively, exceeding the number of avoided premature deaths from O3 pollution. Compared with the BAU, reducing PM2.5 under different scenarios could generate economic benefits of RMB 70.178 billion, RMB 60.916 billion, and RMB 229.268 billion. Furthermore, the FFP scenario outperformed the SSL in mitigating winter wheat production losses caused by O3 pollution. These results provide important scientific support for the development and evaluation of future comprehensive pollution control measures for PM2.5 and O3.

1. Introduction

Air pollution has emerged as a pressing environmental concern globally, with air quality emerging as a crucial environmental concern of current focus [1]. In particular, fine particulate matter (PM2.5) and ozone (O3) have been substantiated as major air pollutants that exert severe adverse impacts on human health and agricultural productivity [2]. Research has shown that these air pollutants can induce respiratory diseases, cardiovascular diseases, and other chronic conditions [3]. For agricultural production, PM2.5 and O3 can diminish crop photosynthesis and growth, thereby reducing yields [4]. Furthermore, abandoned farmland may also serve as a source of metal- and pesticide-laden dust emissions [5], further impacting local environmental quality. While numerous studies have examined these issues, accurately assessing the comprehensive impacts of different air pollutants on health and agriculture remains a challenge [6]. Robust quantification of these impacts could provide crucial scientific evidence to inform policymaking and the development of effective pollution control strategies.
In recent years, China’s air pollution control efforts have achieved good results, with air pollution levels decreasing considerably. However, air pollution remains severe with combined PM2.5 and O3 pollution [7]. The average PM2.5 concentration in China was 30 µg/m3 in 2021, which was still far from the value of World Health Organization (WHO) guideline (5 µg/m3) and the decrease in PM2.5 concentration is accompanied by an increase in photochemical reactions and a significant increase in O3 precursors such as nitrogen oxides (NOx) and volatile organic compounds (VOCs), exacerbating the growth and spread of O3 [8]. Due to the failure of PM2.5 failed to meet control targets, and because O3 pollution has become increasingly serious, the synergistic control of dual pollutants has become a major challenge for the Chinese government.
The health risks associated with PM2.5 pollution have attracted the attention of many researchers. The study [9] concluded that the number of deaths related to PM2.5 pollution in 161 Chinese cities was 652,000 in 2015, accounting for 6.92% of the total deaths, and that the number of prevented deaths will be 4.4% lower than in 2015 by 2020 when PM2.5 concentration reaches the Air Pollution Control and Prevention Action Plan (APPCAP). Another study [10] has shown that the average annual growth rate of premature deaths due to PM2.5 decreased from 2.1% in 2000–2013 to 1.0% in 2013–2017 after the implementation of the APPCAP, but further significant reductions in PM2.5 levels are needed to reduce the health effects of air pollution by 2030, and stronger policy measures are needed. A study [11] quantitatively assessed the impact of PM2.5 on public health and the economic losses caused by it, and concluded that PM2.5 caused 964,000 deaths nationwide, accounting for approximately 9.98% of the total number of reported deaths in China, and that the resulting economic losses amounted to US$10,139 million, or 0.91% of the 2016 national GDP.
Exposure to O3 and its associated health effects are becoming increasingly serious. A study [12] investigated the annual premature mortality associated with respiratory and cardiovascular diseases, and the corresponding economic losses due to O3 pollution in 338 cities. In 2016, the total number of premature deaths due to O3 was 74.2 × 10³, with respiratory and cardiovascular diseases accounting for 48.1 × 10³ and 26.1 × 10³ deaths, respectively. O3 exposure has caused approximately $7.6 billion in economic losses nationwide. [13] found that all-cause, cardiovascular, and respiratory mortality due to short-term O3 exposure in 331 Chinese cities showed an increasing trend during the period of implementation of the Air Pollution Prevention and Control Action Plan (2013–2017).
Some studies have quantified the health effects caused by combined PM2.5 and O3 pollution. Xie [14] compared the health impacts of PM2.5 and ozone in China and found that the health and economic impacts of PM2.5 pollution are much higher than those of O3. PM2.5, rather than O3, to reduce the number of premature deaths under the most stringent abatement scenarios, and that health expenditures of RMB 157 billion and RMB 50 billion could be saved by controlling PM2.5 and O3 pollution, respectively. Another study [15] quantitatively assessed the health risks attributable to PM2.5 and ozone in 367 cities in China from 2015–2018 and found an overall decrease of 23.4–26.9% in the total PM2.5-attributable mortality, number of respiratory and cardiovascular diseases, and incidence of chronic bronchitis in 2018 compared to 2015, while O3-related mortality rates had increased by 18.9%. Similarly, other researchers [16] assessed the health effects of PM2.5 and ozone pollution in 338 Chinese cities from 2015 to 2020 and found that from 2015 to 2020, PM2.5-related health effects decreased by 14.97%, while ozone-related all-cause health effects increased by 94.61% and respiratory health effects increased by 96.54%, indicating an urgent need for synergistic control of both pollutants. At the same time, the study estimated the potential health benefits of achieving the double target in 2021–2025, whereby PM2.5-related health damage in 338 Chinese cities was reduced by 1.56 × 10⁶ DALYs (6.37% improvement), and the health risks from ozone improved accordingly if a positive concentration target (10% reduction) was achieved in the period 2020 to 2025. The health risks associated with ozone were also reduced accordingly.
In addition, there have been some studies on the effects of O3 pollution on crop yield; however, research on the economic effects of changes in O3 concentration on agriculture is relatively limited. Some scholars [17] established a dose-response relationship using the over-the-counter (OTC) method and found that winter wheat was more sensitive to O3 than rice. Using hourly monitoring data on O3 concentrations, the mean of hourly concentrations from 09:00 to 16:00 (M7) and the accumulated O3 exposure over a concentration threshold of 40 nmol mol−1 (AOT40) indices in different cities of Shanxi Province in 2017, it was concluded that long-term O3 pollution caused a relative yield loss of winter wheat by 7.87% to 24.28% [18]. Zhao [19] evaluated the negative impact of O3 pollution on three major grain crops, namely, winter wheat, maize, and rice, from 2015 to 2018 and found that winter wheat suffered the most severe yield loss. Ref. [20] collected observational data on O3 concentrations during the growing season in southern China and estimated the relative yield and economic losses of rice varieties in 2015 using the M7 and AOT40 methods. In addition, a study [21] assessed rice yield losses due to O3 pollution in the YRD region under current and future climate change scenarios by incorporating measured rice stomatal conductance data.
To date, there have been relatively many studies on the health effects of PM2.5 pollution. However, comprehensive studies and comparative studies on PM2.5 and O3 pollution are relatively few. Additionally, the assessment of the economic impact of changes in O3 concentration on crop yield decline is lacking. Therefore, it is necessary to investigate the comprehensive economic benefits of combined PM2.5 and O3 pollution on health and agriculture, which could support the formulation of scientific pollution control policies. The data after 2020 may be influenced by the COVID-19 pandemic, which would be unfavourable for discussing the impact of air quality on health and agriculture. Therefore, this paper uses 2019 as the base year and adopts the health impact function, statistical life value, and AOT40 methods to determine the premature deaths, health economic losses, and winter wheat losses caused by combined pollution with PM2.5 and O3 nationwide. Scenario analysis was used to project the economic benefits of improving air quality for agriculture and public health under the 14th Five-Year Plan (FFP), Secondary Standard Limit (SSL), and Primary Standard Limit (PSL), with 2025 as the target year. The corresponding monetised results could provide scientific support for the development of subsequent optimisation policies under the 14th Five-Year Plan (FYP).

2. Materials and Methods

2.1. Calculation of Air Quality Index

A Q I = m a x I A Q I 1 , I A Q I 2 , I A Q I 3 , , I A Q I n
I A Q I —air quality sub-index;
n—pollutant item.
The air quality sub-index for pollutant item p is calculated according to the following formula:
I A Q I p = I A Q I H i I A Q I L o B P H i B P L o C P B P L o + I A Q I L o
where I A Q I P —air quality sub-index for pollutant item P;
C P —the quality concentration value of pollutant item P;
B P H i —the higher value of the pollutant concentration limit value in Table 1 that is similar to CP;
B P L o —the lower value of the pollutant concentration limit value in Table 1 that is similar to CP;
I A Q I H i —the air quality sub-index corresponding to B P H i   in Ambient Air Quality Standards (GB 3095-2012) [22];
I A Q I L o —the air quality sub-index corresponding to B P L o   in Ambient Air Quality Standards (GB 3095-2012) [22].

2.2. Calculation of PM2.5- and O3-Related Health Impacts

Δ M o r t = B i × P O P × 1 1 R R i
In the equation, Δ M o r t represents the number of premature deaths from health endpoint i caused by exposure to O3 (or PM2.5) pollution; B i is the baseline mortality rate for health endpoint i; P O P is the population exposed (i.e., the annual end-of-year resident population); and R R i is the relative risk of health endpoint i caused by exposure to O3 (or PM2.5) pollution.
RR is usually calculated using a log-linear model derivation:
R R = e x p β × C C 0
In the equation, β is the exposure–response coefficient for health endpoint i, which represents the percentage increase in the risk of mortality from different health effects per 10 µg/m3 increase in the O3 (or PM2.5) concentration. The selection of the parameters in this study was based on previous research. The selection of the O3 concentration was based on the studies by Yin [23] and Madaniyaz [24], while the selection of the PM2.5 concentration was based on the meta-analysis results of Cao [25], Zeng [26,27], and Sun [28]; C represents the annual average concentration of O3 (or PM2.5); C 0 represents the background concentration value (also known as the threshold concentration) of O3 (or PM2.5), below which the health risks associated with air pollution can be considered negligible. The reference background concentration for PM2.5 is set to the WHO recommended annual average of 10 μg/m3. Regarding the maximum daily 8 h average ozone concentration (O3–8h) threshold, there is no unified standard in China. The WHO has suggested that the global natural background concentration of O3-8h is about 70 μg/m3. Therefore, this study selected 70 μg/m3 as the threshold concentration for O3-8h, as shown in Table 1.
In this study, premature death was determined as the health endpoint of PM2.5 and O3 pollution. To monetise economic losses, the concept of the value of statistical life (VSL) was introduced, that is, the price that people are willing to pay to reduce the risk of premature death from environmental pollution [29].
V S L x , t = V S L b a s e × G x , t G b a s e β × 1 + % Δ P x + % Δ G x β
In the equation, V S L x , t is the adjusted VSL value of province x in year t; V S L b a s e is the benchmark value of VSL, and in this study, the latest VSL assessment value of Beijing in 2012 was chosen to be USD 132,000, which is equivalent to RMB 936,000 [30]; G x , t represents the per capita GDP for province x in year t; G b a s e represents the baseline per capita GDP, which is RMB 87,475 based on the per capita GDP in Beijing in 2012; and β is the income elasticity coefficient, which reflects the percentage increase in income. The income elasticity coefficient for developing countries is assumed to be 1.00 [31]. % Δ P x represents the percentage increase in consumer prices for province x from 2012 to year t, as reflected by the Consumer Price Index (CPI); % Δ G x represents the percentage increase in real per capita GDP for province x from 2012 to year t, which reflects the annual growth rate of real per capita GDP.
The total health economic burden for a province in a year can be obtained by multiplying the calculated number of pollution-exposure-related premature deaths by the VSL, as shown in the following equation:
E = V S L x , t × Δ M o r t

2.3. Calculation of Crop Yield Impact

2.3.1. Indicator of O3 Exposure

In this study, the effect of O3 on winter wheat yield was assessed using the AOT40 index established by the European Environment Agency (EEA). The response equation is as follows:
A O T 40 = i n C z o n e 40 i
In the equation, n is the number of hours with ozone observations during the crop growing season, which was taken as 10 in this study; C z o n e is the value of hourly ozone concentration value ≥85.7 μg/m3 (which is the value converted to a mass concentration from the volumetric concentration of 40 nmol/mol).

2.3.2. Assessment of Crop Yield and Economic Losses

This study calculated the relative loss of winter wheat in each province and city based on the AOT40, an indicator of crop yield exposure to ozone.
R Y = 0.0228 × A O T 40 + 1
R Y L = 1 R Y
C P L i = R Y L i 1 R Y L i × C P i
E C L = C P L × C P P
In the equations, RY denotes the relative yield of winter wheat; RYL denotes the theoretical yield of winter wheat relative to that which is not damaged by ozone; i is a particular city; C P L i is the crop production loss, that is, the difference between the theoretical and actual yields of winter wheat that is not stressed by ozone pollution; C P i is the crop production; E C L is the estimated economic losses, that is, direct economic losses from the difference between the theoretical and actual yields of winter wheat not subjected to ozone stress; and C P P is the crop purchase price.
The yield loss of a crop is mainly influenced by the combination of the RYL and the actual yield. If the RYL based on the AOT40 index is large and the actual yield of the crop is high, the CPL will be relatively large. In contrast, if the RYL is small and the actual crop yield is low, the CPL will also be relatively small. The yield and economic losses for each prefecture-level city in each province were added up in this study after the AOT40 values for each city were determined. This allowed researchers to determine the yield and economic losses at the provincial level.

2.4. Data Sources

2.4.1. PM2.5 and O3 Concentrations

The data selected for this study were obtained from the China Environmental Monitoring General Station (https://quotsoft.net/air/, accessed on 3 February 2020), which monitors regional near-surface PM2.5 and O3 concentrations in China and provides hourly PM2.5 and O3 concentration data for all provinces and cities across the country, using the beginning and ending dates of 1 January 2019 and 31 December 2019, respectively. Compared to satellite observations, ground-based monitoring stations typically provide higher temporal resolution and more accurate measurements [32]. According to the data provided by the website, as of the end of 2019, there were a total of 1605 environmental monitoring stations nationwide. The monitoring network had relatively dense spatial coverage, which enabled it to cover a large urban population. This allowed us to better describe the detailed spatiotemporal patterns of PM2.5 and ozone concentrations in the entire study domain. The cities covered in the dataset are also representative in terms of population characteristics and socioeconomic conditions. The data were published in hourly units, ensuring good temporal continuity and meeting the time requirements for each study.

2.4.2. Population and Baseline Mortality Rates

The China Statistical Yearbook, which was released in 2020, provided information on the population of each province and city in the nation as of the end of 2019. Premature death from all causes, premature death from respiratory disease, and premature death from cardiovascular disease were defined as the endpoints of health effects in this study. Baseline mortality data for premature deaths due to all causes, premature deaths due to respiratory disease, and premature deaths due to cardiovascular disease were obtained from the China Cause of Death Surveillance Dataset, published by the National Health and Health Commission (NHHC) and the Chronic Disease Centre of the China Centre for Disease Control and Prevention (CCDC), assuming that the baseline mortality rates for each region were evenly distributed among the central, western, and eastern parts of China [33,34]. The baseline mortality rates of the diseases in the sub-regions were evaluated.

2.4.3. Crop Yield and Growth Period

The annual winter wheat output in each province of China for 2019 was derived from the 2020 China Rural Statistical Yearbook. Different crops in China are distributed across different regions, and winter wheat is mainly cultivated in the northern, central, and eastern China [35]. We defined the growing period as the three-month harvest period after plant emergence [36]. The growing period of winter wheat varies from February to June in different provinces and cities [37].
The purchase price of crops was derived from the public information on the website of the National Development and Reform Commission (https://www.ndrc.gov.cn/, accessed on 3 February 2020), combined with the minimum purchase price of crops published in the statistical database of the Food and Agriculture Organization of the United Nations, and in order to facilitate the comparison and discussion, the historical annual average exchange rate (https://chl.cn/, accessed on 3 February 2020) was selected for conversion to calculate the 2019 purchase price of winter wheat, which was RMB 2183 per ton.

2.5. Scenario Designed

We created a baseline scenario (business as usual, BAU) and a scenario based on the 14th Five-Year Plan (FFP). We also calculated the ideal scenarios, namely, the Secondary Standard Limit (SSL) and Primary Standard Limit (PSL), using 2019 as the base year and 2025 as the target year.
In the baseline scenario, the annual average was the same as that in 2019, which means that any pollution control measures introduced after 2019 were not considered, and each of the 31 provinces and municipalities took the 2019 annual average for that province or municipality as its target.
In the FFP scenario, the national assessment target for PM2.5 is set at a 10% reduction from the base year, with reference to “The 14th FYP for the Development of the People’s Economy and Society of the People’s Republic of China and the Long-range objective for 2035,” and the target annual average for O3 is set at a 10% reduction from the base year.
The use of a particular value as the target annual average value in the Tier II and Tier I standard scenarios was predicated on the idea that the pollutant concentration in a province or city in 2019 fell short of the value given in the scenario. If the 2019 pollutant concentration reached the target annual mean value set in the scenario, the maintenance of the 2019 pollutant concentration value in the province or city was used as the target. The specific scenario settings are listed in Table S1.

Prediction of Key Parameters

Population: Based on the year-end resident statistics for each province and city in the China Statistical Yearbook published over the years and by analysing the trends in the available population data for the major years, it was concluded that negative population growth has become a general trend. Combined with relevant documents on population development planning issued by each province and city in recent years, the total population of each province and city in 2025 was calculated using the growth rate projection method.
Baseline mortality: Based on the baseline mortality data for all-cause premature deaths, premature deaths from cardiovascular diseases, and premature deaths from respiratory diseases in the central, eastern, and western regions of the “China Cause of Death Surveillance Dataset” for all previous years, the baseline mortality rates for the three health endpoints in 2025 for all provinces and municipalities were calculated using the trend extrapolation method.
Per capita GDP: The annual growth rate of GDP from 2021 onwards was determined according to the “14th FYP and the Outline of Long-range objective for 2035” of each province and city.
Production of winter wheat: Based on the annual winter wheat production data of the studied provinces and municipalities in the “China Rural Statistical Yearbook” of past years, the annual winter wheat production of each province and municipality in 2025 was calculated using the growth rate forecast method. Combined with the minimum purchase price of winter wheat in 2023, which was released on the website of the National Development and Reform Commission of the People’s Republic of China, the purchase price of winter wheat in 2025 is forecast to be RMB 2,414 per ton; the specific forecast values are shown in Table S2.

3. Results

3.1. Health and Agricultural Impacts Attributable to PM2.5 and O3 Pollution

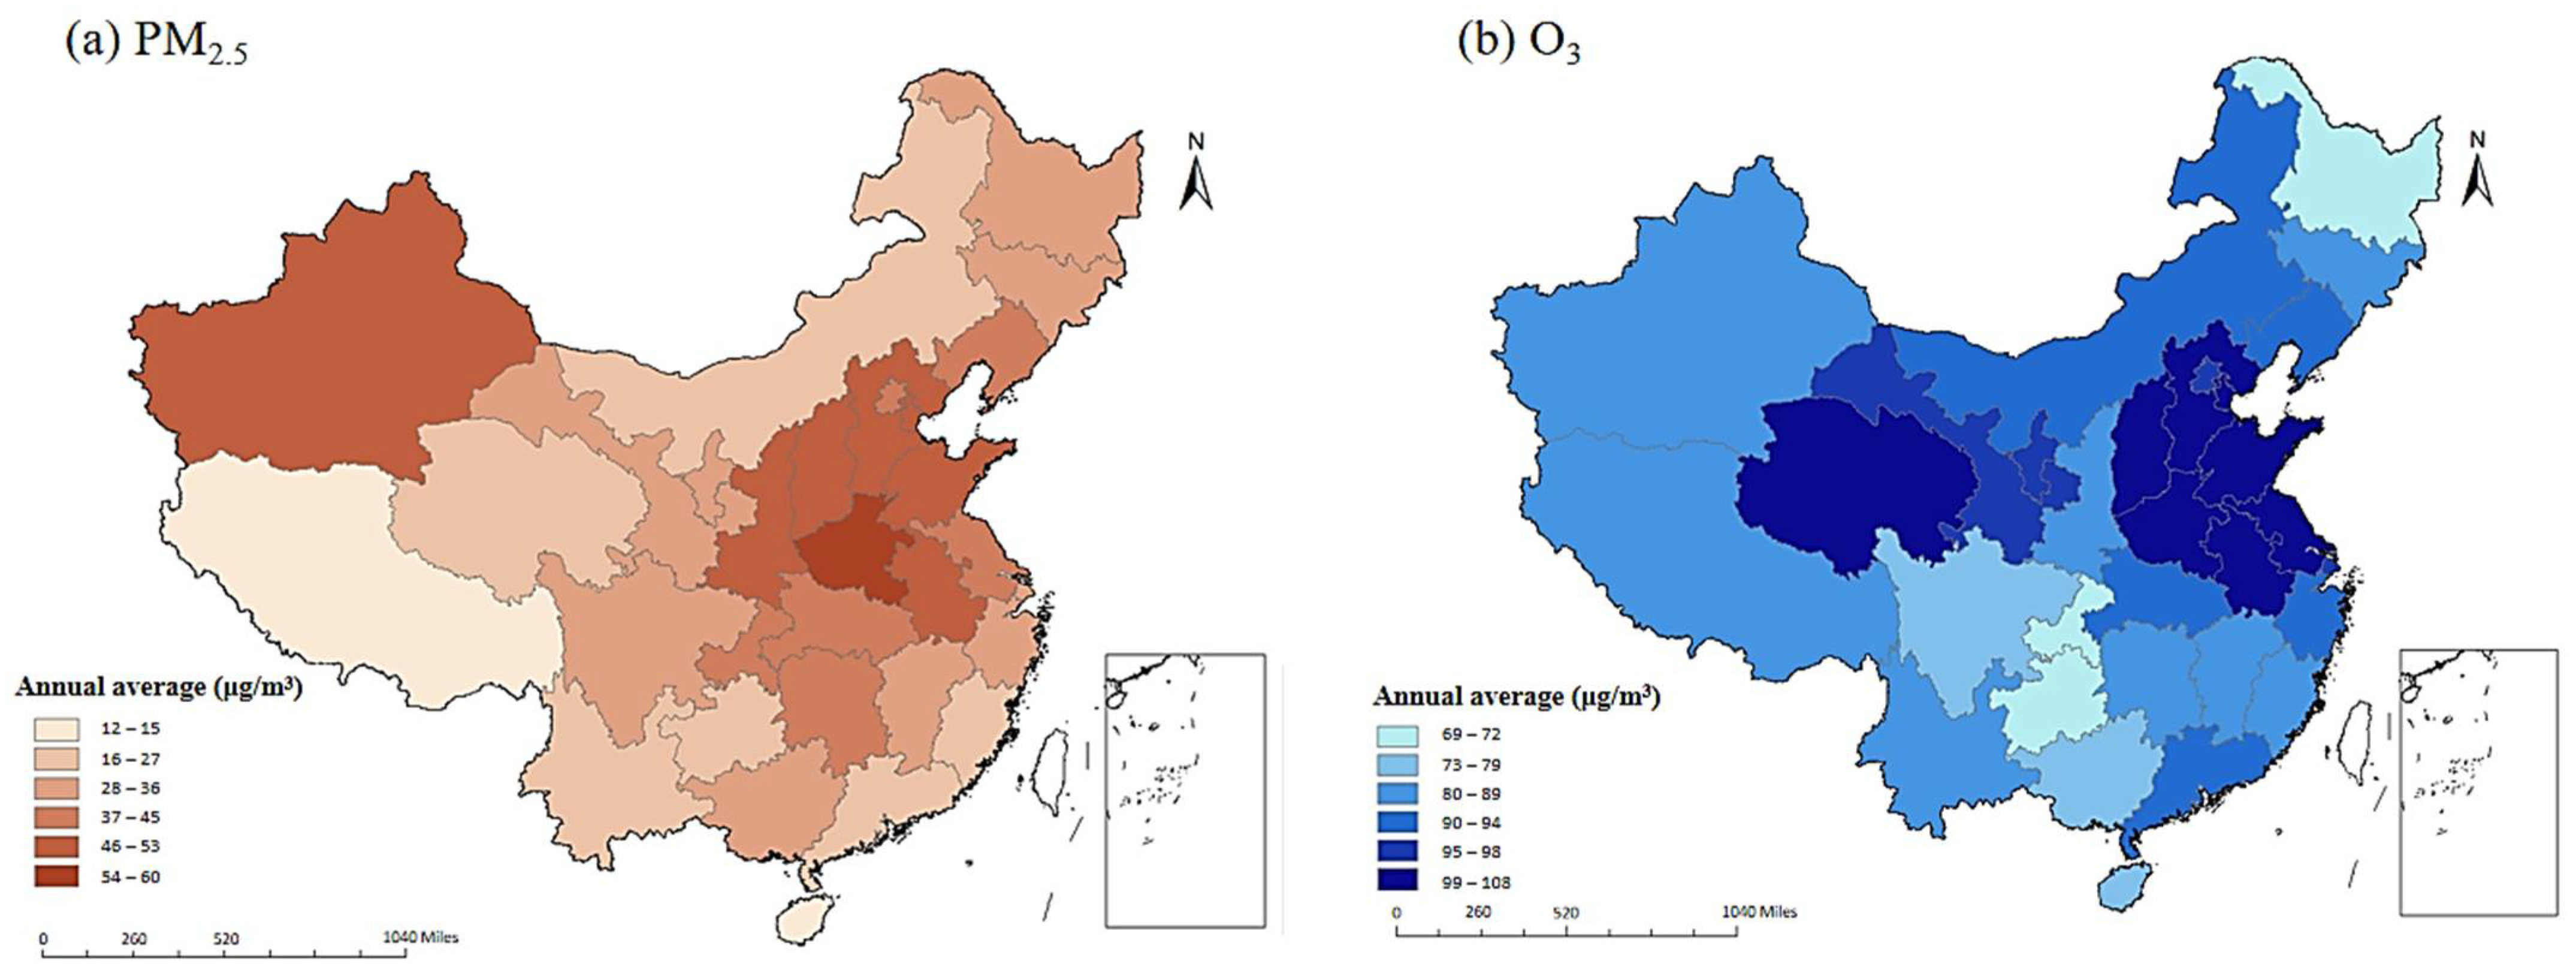
3.1.1. Spatial Distribution of Pollutant Concentrations

According to the air quality index calculation, the average air quality index value in 2019 was 90, which belongs to the “good” category. However, it is worth noting that exceedance of PM2.5 and O3 standards still occurred. The spatial distribution of the annual average values of PM2.5 and O3 in 2019 is shown in Figure 1. The annual average value of PM2.5 was 36 μg/m3. The number of times when values exceeded the WHO standard (15 μg/m3) was 335, and the numbers of times when values exceeded China’s first-level standard (35 μg/m3) and second-level standard (75 μg/m3) were 149 and 20 times, respectively. Overall, the regions with high PM2.5 annual average values were concentrated in the Xinjiang Uygur Autonomous Region, North China, Central China, and East China. The province with the highest value was Henan, with an annual average of 60 μg/m3, and the province with the lowest value was the Tibet Autonomous Region, with an annual average of 12 μg/m3. The annual average value of O3-8h was 93 μg/m3. The number of times when values exceeded the WHO standard (60 μg/m3) was 289, and the numbers of times when values exceeded China’s first-level standard (100 μg/m3) and second-level standard (160 μg/m3) were 145 and 6 times, respectively. The high values of annual average O3 were concentrated in the northern and central parts of China, with the highest value in Tianjin, where the annual average was 199 μg/m3, and the lowest value in Heilongjiang Province, where the annual average was 102 μg/m3.

3.1.2. Health Impacts of Pollutant Exposure

A study analysing the health effects of PM2.5 and O3 pollution was conducted in 31 provinces and cities. The number of all-cause premature deaths aggregated at the provincial spatial level was analysed to determine the number of all-cause premature deaths attributable to PM2.5 and O3 pollution in 2019 and the proportion of total deaths in that year in each province and city. Based on the number of premature deaths caused by PM2.5 and O3 pollution, the health and economic losses caused by PM2.5 and O3 pollution exposure in 2019 could be obtained, as shown in Figure 2.
The total number of all-cause premature deaths attributable to PM2.5 pollution in the country was 246,014 (95% CI: 82,820, 484,824) (Figure 2a). The province with the highest number of all-cause premature deaths attributable to PM2.5 was Henan Province, followed by Shandong and Hebei Provinces. The proportion of all-cause premature deaths attributable to PM2.5 out of the total number of deaths for the year was lowest in the Tibet Autonomous Region, at 0.24%, and highest in the Xinjiang Autonomous Region, at 33.07%, indicating that PM2.5 pollution poses a greater health hazard to local residents. In Beijing, although the number of premature deaths attributable to PM2.5 pollution was low, the proportion of premature deaths out of the total number of deaths for the year was higher than average, which deserves attention and vigilance.
The total number of all-cause premature deaths due to O3 pollution was 186,346 (95% CI: 101,432, 270,432) (Figure 2b). Compared to PM2.5, the proportion of premature deaths due to cardiovascular disease was significantly higher, and the province with the highest proportion was Heilongjiang Province, with 57.27%, indicating that O3 pollution poses a greater potential threat to the cardiovascular health of the population. Shandong Province had the highest number of all-cause premature deaths attributable to O3 pollution, followed by Hebei Province and the Guangxi Autonomous Region. The proportion of all-cause premature deaths attributable to O3 pollution out of the total number of deaths that year was lowest in Sichuan Province, at 0.99%, and highest in the Xinjiang Autonomous Region, at 11.48%, indicating that the health hazards of various air pollutants were much greater for residents in this region than for people in other regions. Although the number of all-cause premature deaths in Beijing and Hainan Provinces attributable to O3 pollution was relatively small and did not exceed 5000, it accounted for a larger proportion of the total number of deaths that year, and O3 pollution needs to be monitored, prevented, and controlled.
Combining the number of premature deaths due to PM2.5 and O3 pollution, the health economic losses and GDP share due to PM2.5 and O3 pollution in 2019 were derived as shown in Figure 2c,d. Health economic losses due to PM2.5 accounted for approximately RMB 196.509 billion. The province with the largest PM2.5 health economic loss was Jiangsu Province (RMB 22.369 billion), followed by Guangdong Province and Hubei Province. The province with the largest proportion of losses due to cardiovascular diseases was Shanxi with 30.21%, and the largest proportion of respiratory diseases was in the Tibet Autonomous Region, with 20.85%. At the national level, the health economic losses due to PM2.5 pollution amounted to 0.2% of GDP, with the proportion of Tianjin, Shaanxi, Shanxi, and the Xinjiang Autonomous Region that did not suffer large economic losses being higher than average, indicating that the health economic losses due to PM2.5 pollution are more serious in northern and north-western China.
Economic health damage caused by O3 pollution amounted to approximately RMB 155.807 billion. The province with the largest O3 health loss was Jiangsu Province (RMB 18.965 billion), followed by Guangdong Province (RMB 17.003 billion). The province with the largest proportion of losses from cardiovascular disease was Heilongjiang, with 57.27%, and the province with the largest proportion of respiratory disease was Chongqing with 9.87%. At the national level, health economic losses due to O3 pollution accounted for 0.16% of GDP, and Beijing, Tianjin, and Hebei Provinces all lost more than 0.2% of GDP, suggesting that health economic losses due to O3 pollution have a more serious impact in northern China.

3.1.3. Agricultural Impact Attributable to Ozone Pollution

We selected the main provinces with winter wheat production above 300,000 tonnes in 2019, namely Hebei, Jiangsu, Anhui, Shandong, Henan, Hubei, Shaanxi, Xinjiang, Gansu, Shanxi, Sichuan, Zhejiang, Guizhou, Tianjin, and Yunnan, a total of 15 provinces and municipalities. We utilised the hourly O3 data to calculate the respective AOT40 response function for each province and municipality and then estimate the yield loss and economic loss of winter wheat in 2019.
For winter wheat in 2019 specifically, the specific distributions of AOT40 are shown in Figure 3a. The distribution of the AOT40 index showed significant spatial differences between the east and west. The AOT40 indices in Tianjin, Hebei, Shanxi, Jiangsu, Shandong, and Henan Provinces were all above 8 ppm-h, while the AOT40 indices in Sichuan and Guizhou Provinces were all below 2 ppm-h. The AOT40 index in Shandong Province was the highest, at 9.7 ppm-h. This is because the growing period of winter wheat in Shandong Province is from mid-March to mid-June, and there are more days with higher mean O3–8h concentrations, which causes a cumulative effect on winter wheat. The AOT40 index of Guizhou Province was the lowest, at only 1.09 ppm-h. Owing to the cold growing season of winter wheat, the overall low mean O3–8h values prevented the accumulation of high concentrations of O3.
Winter wheat production and economic losses by province and municipality in 2019 are shown in Figure 4.
The absolute yield losses due to O3 pollution amounted to 28,524,100 tonnes, which corresponds to 22.97% of the actual production of winter wheat in the provinces and cities surveyed. In 2019, the per capita consumption of grain in China was 130.11 kg per year, and the yield loss of winter wheat was equivalent to the grain consumption of about 219 million people for one year. Henan Province had the largest production loss, with a production loss of 8,855,100 tonnes, accounting for 31% of the total loss, which was approximately 23.74% of the province’s annual winter wheat output. This was followed by Shandong Province, with a production loss of 7,914,200 tonnes, accounting for approximately 32.74% of the province’s annual winter wheat production; these two provinces were also the top two in annual winter wheat production in 2019. In contrast, Anhui Province, one of the provinces with higher winter wheat production, had a production loss of less than 15% of the actual winter wheat output of 2,182,500 tonnes, mainly because of the low O3 concentration during the growing season of its winter wheat, as did Sichuan and Guizhou Provinces. Despite the lower yield loss in Shanxi Province, it had the highest proportion (36.5%) of actual winter wheat production, indicating that O3 pollution was harmful to local winter wheat production.
The economic loss of winter wheat due to O3 pollution amounted to RMB 62.268 billion, equivalent to 0.11% of the 2019 GDP of the provinces and municipalities surveyed. Because economic loss was mainly calculated based on yield loss, its distribution was generally the same as that of yield loss, with a wide gap between different provinces. The economic loss in Henan Province, which had the largest output value, was RMB 19.331 billion, accounting for 31.04% or approximately 0.36% of the province’s GDP in 2019. It had the largest GDP share among the provinces and municipalities surveyed, followed by Shandong and Hebei. The provinces with larger GDP shares besides Henan were Shandong and Hebei, which were both above 0.24%, although the economic loss of winter wheat due to O3 pollution in Hebei was significantly higher as a proportion of its actual production, and O3 pollution burdened the province’s economic expenditure on crops.
O3 pollution had different effects on areas with different pollution characteristics for the same crop. The impact was generally higher in provinces with high actual winter wheat yields, and losses were not necessarily lower when the yields were low. Careful division of the growing season and monitoring of the actual O3 concentration can help us understand the accumulation of pollution during the growing season of a particular crop and to take different targeted measures depending on the region.

3.2. Health Benefits from Pollutant Reduction

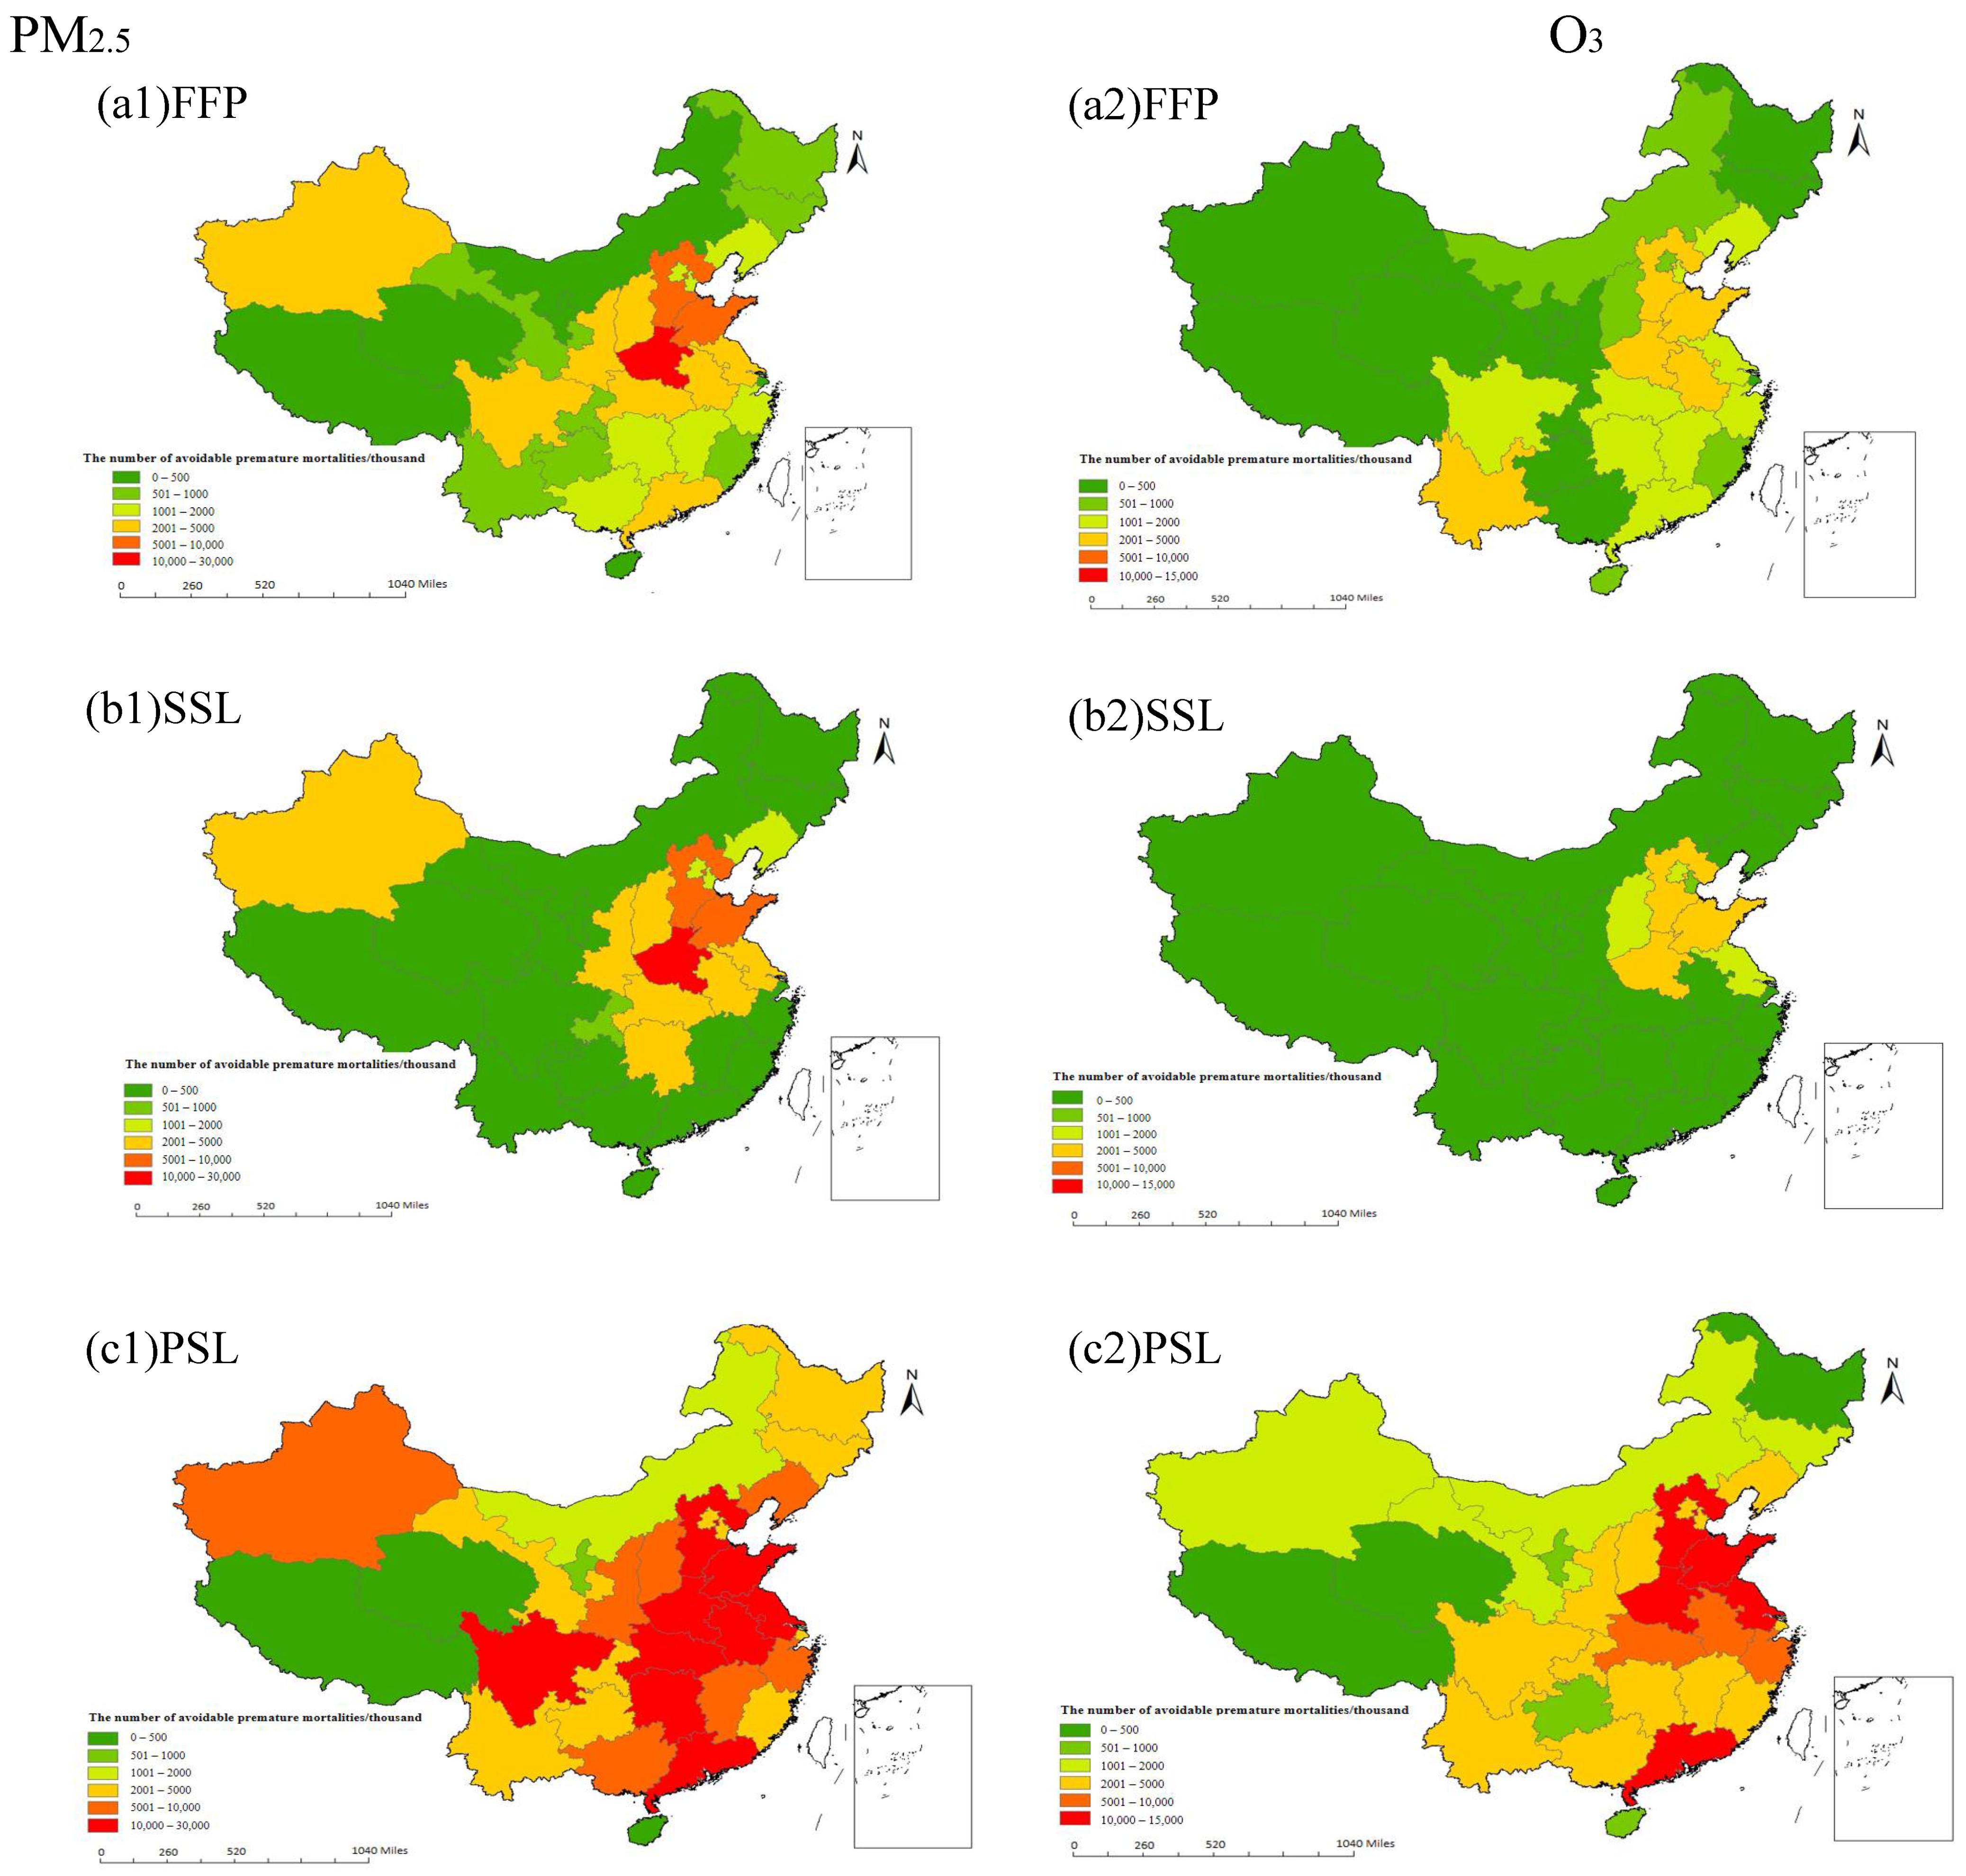
3.2.1. Analysis of the Number of Premature Deaths Avoidable

Based on the target levels of pollutants set for the different scenarios, combined with the projected and baseline mortality rates for each province and city, the number of premature deaths attributable to PM2.5 and O3 pollution for the different scenarios in the target years can be calculated as shown in Figure 5.
The total number of all-cause premature deaths attributable to PM2.5 pollution in 2025 under the baseline scenario was 264,225 (95% CI: 88,951, 520,710), representing an increase of 18,211 or 7.4% compared to the number of all-cause premature deaths in 2019; the same period showed an increase of 8412 and a decrease of 11,389 premature deaths from cardiovascular and respiratory diseases. Compared with 2019, all three scenarios led to a decrease in premature deaths from PM2.5, with PSL > FFP > SSL. The FFP scenario resulted in a 20.56% decrease in all-cause premature deaths compared with 2019, indicating that the existing 14th FYP pollution control targets would be effective in reducing the number of premature deaths due to PM2.5. In the SSL scenario, the number of premature deaths due to PM2.5 was reduced by 17.48% compared to the baseline scenario, which is the lowest number among the three scenarios. The reduction in 200,304 premature deaths due to PM2.5 under the PSL scenario was 81.42% lower than under the baseline scenario. This indicates that the primary default concentration target can significantly reduce the number of premature deaths.
The total number of all-cause premature deaths attributable to O3 exposure in 2025 in the baseline scenario was 201,700 (95% CI: 109,790, 292,711). Compared to 2019, the number of premature deaths from O3 decreased by 9.70% in the FFP scenario compared to the baseline scenario, which was a smaller decrease than that from PM2.5. The number of premature deaths due to O3 in the SSL scenario was essentially the same as that of all-cause premature deaths due to O3 pollution in 2019, indicating that reaching the standard concentration of the second stage of the zone when the standard is exceeded for the provinces and municipalities could reduce the number of premature deaths, but it would not be sufficiently direct and effective. The PSL scenario of premature deaths from all causes of O3 was 60.74% lower than the baseline scenario, which is a more significant reduction than in the other scenarios, indicating that the target of the primary standard concentration could significantly reduce the number of premature deaths.
Regarding the health impacts of PM2.5 and O3 pollution, 31 provinces and cities were analysed. The number of avoidable premature deaths attributed to PM2.5 and O3 pollution for different scenarios in the target year compared to 2019 were obtained, as shown in Figure 6.
Regarding the number of avoidable premature deaths due to PM2.5, the three scenarios showed that the PSL scenario had the highest number of avoidable premature deaths by region, with Henan and Shandong far outperforming the other provinces. They were the best-performing province in the FFP scenario, with 4582 cases, and the result was 44% in the PSL scenario. The number of avoidable premature deaths under the SSL scenario was slightly higher than that under the FFP scenario in Tianjin, Hebei, Shanxi, Shandong, Henan, Hubei, Hunan, and Shaanxi. The number of avoidable premature deaths under the PSL scenario was higher in Hebei, Jiangsu, Shandong, and Henan. As with PM2.5, the number of avoidable deaths from O3 pollution in the PSL scenario was higher in all regions, with Henan and Guangdong far exceeding the other regions. The SSL scenarios in Henan, Hebei, and Shandong Provinces had more avoidable cases, with 3766, 3632, and 3203 cases, respectively. The FFP and PSL scenarios showed similar trends across provinces, with the FFP scenario having more avoidable premature deaths than the SSL scenario, except in Beijing, Shanxi, Jiangsu, and Shandong. Overall, the existing 14th FYP exceeded the performance of the secondary zone standard in reducing premature deaths attributable to O3 pollution in the provinces and cities exceeding the O3 standard.

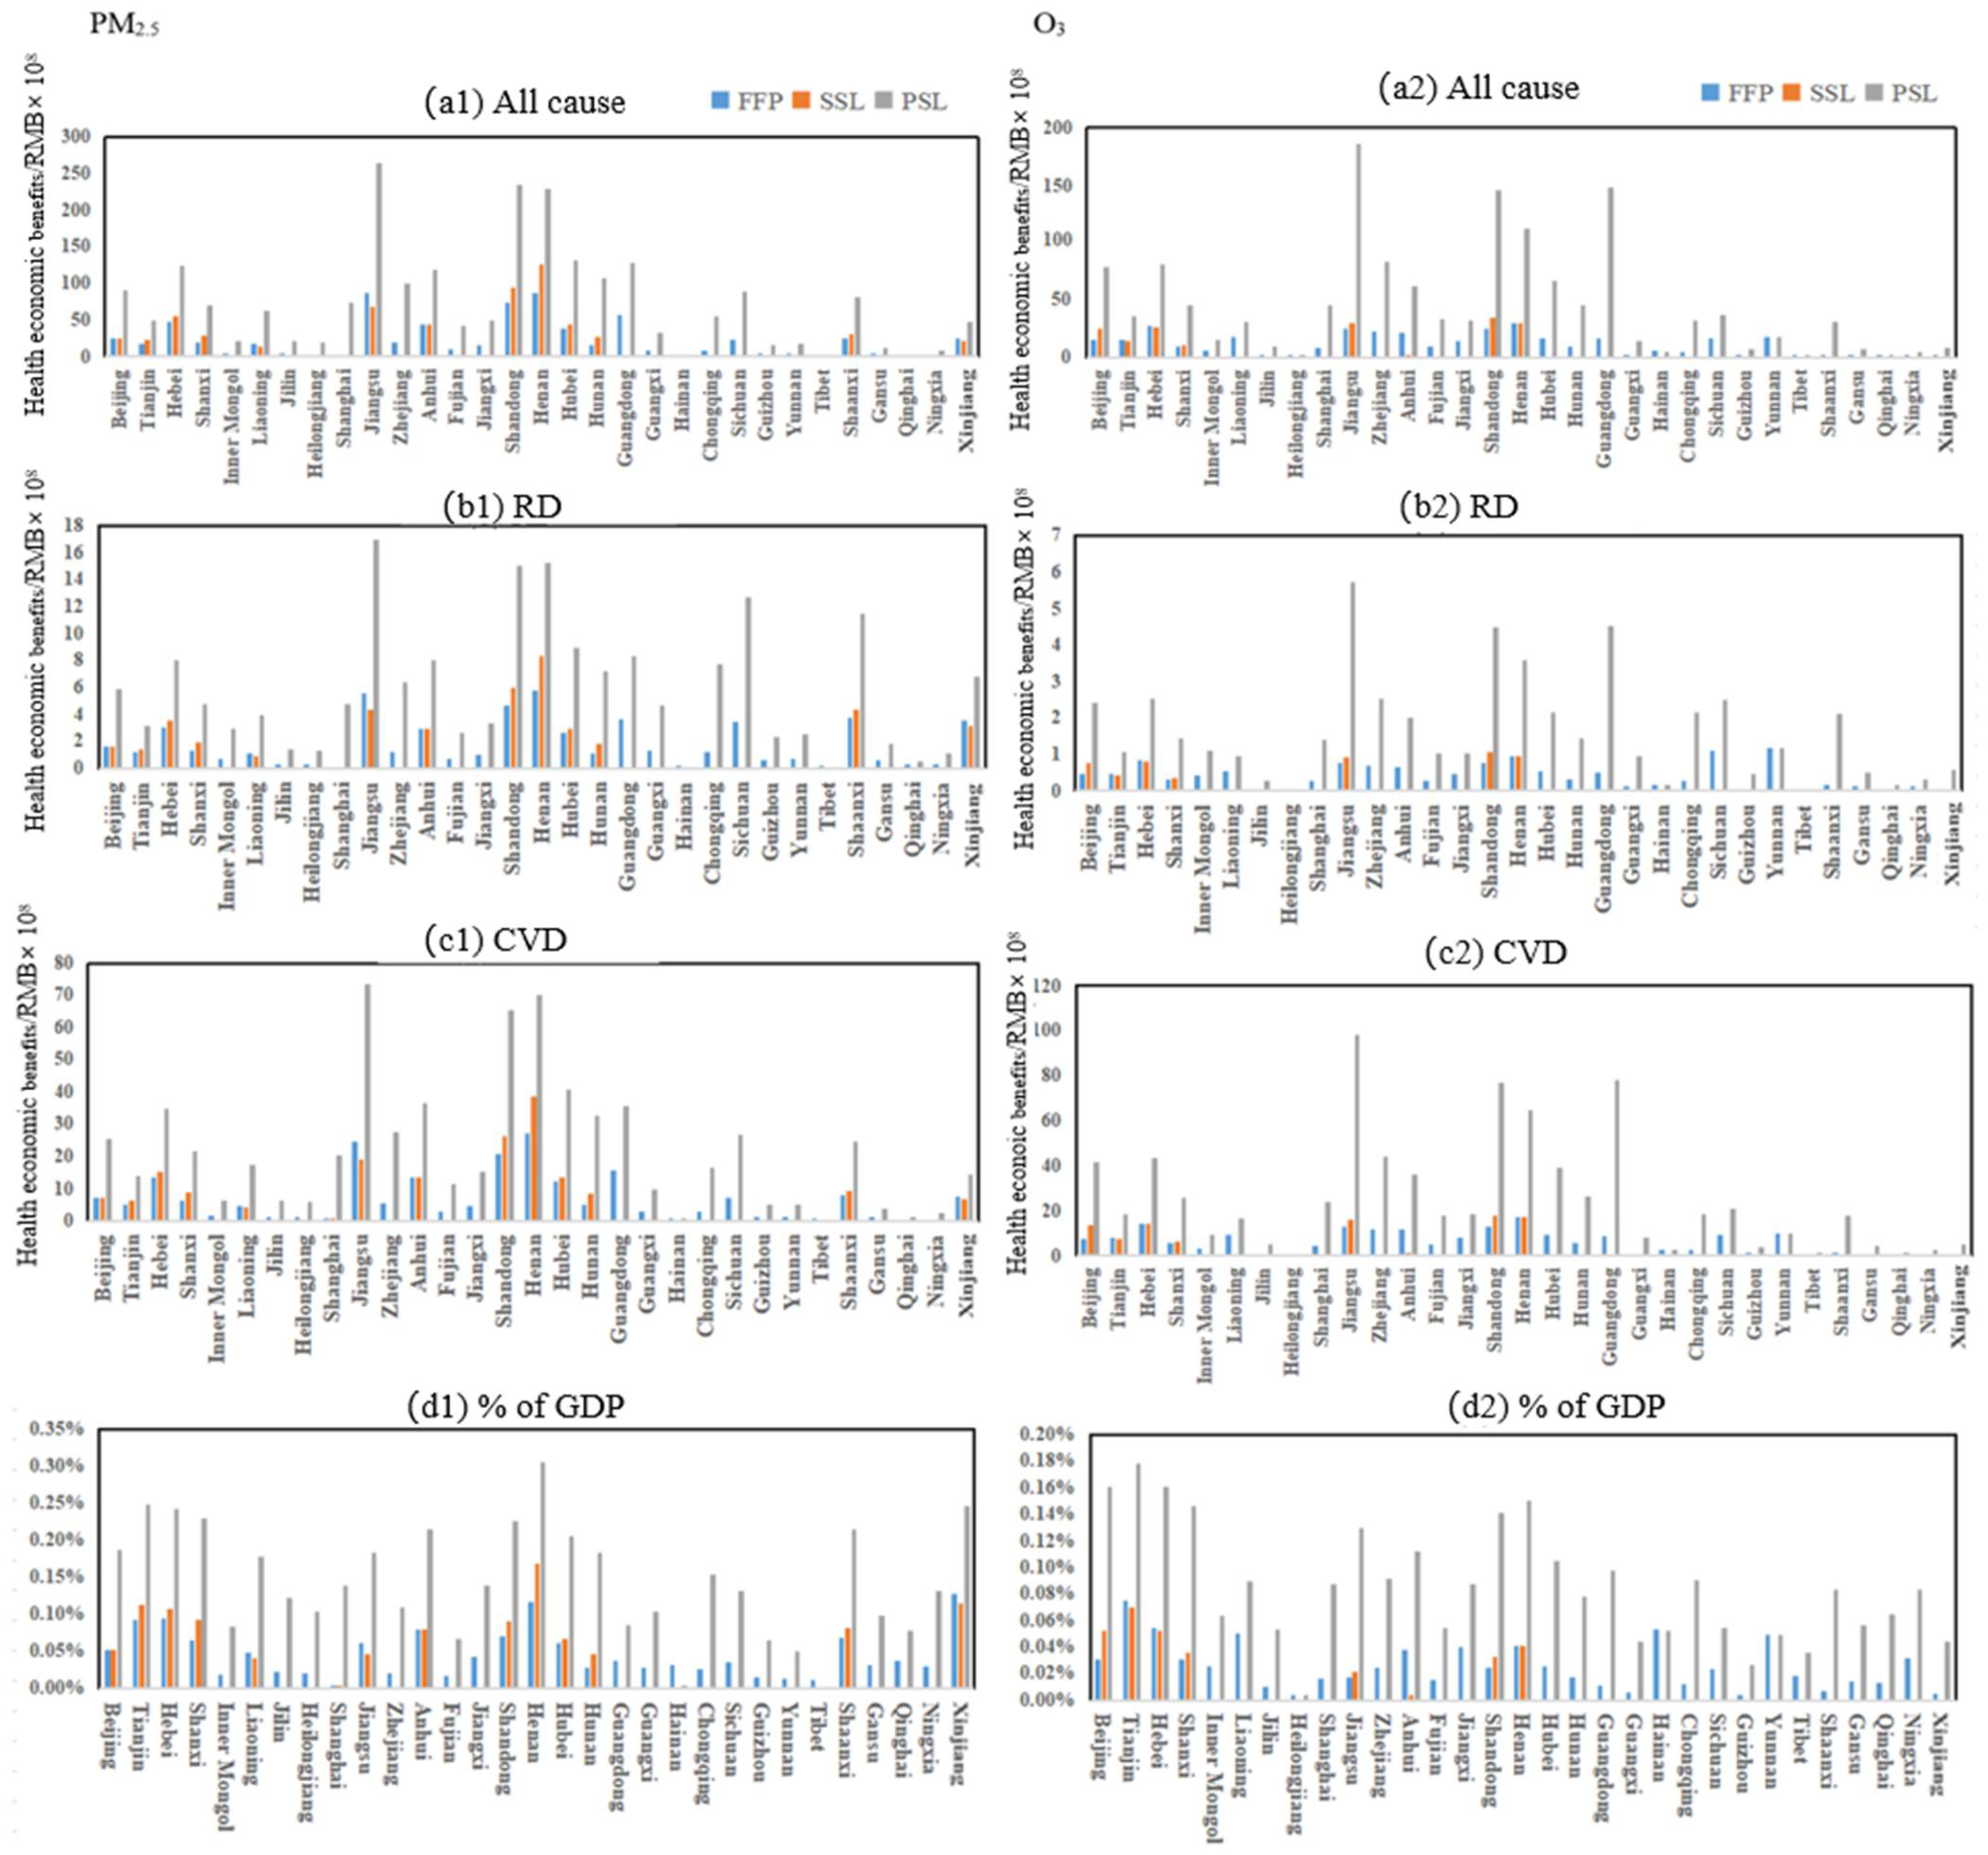
3.2.2. Health Benefit Assessment

From the number of premature deaths in the different scenarios combined with the VSL values, the health and economic losses due to PM2.5 and O3 pollution for the different scenarios in the target year can be calculated, as shown in Table 2.
As can be seen from the table, the health economic losses caused by PM2.5 and O3 pollution increased in all three scenarios compared to 2019, except for the PSL scenario. In the PSL scenario, the number of premature deaths decreased across all scenarios, while the value of statistical life (VSL) increased because of various factors, such as subjective perceptions of the population, gender, education, and economic level, which continued to change over time. Therefore, the impact of the policy scenario on the economic loss of health compared to the baseline scenario is discussed. Compared to the baseline scenario, all three scenarios effectively reduced health economic losses caused by PM2.5 and O3 pollution. The PSL scenario exhibited the largest reduction, followed by the FFP scenario, whereas the SSL scenario did not differ significantly from the baseline scenario.
The achievable health economic benefits of different scenarios were analysed at the provincial scale, and the health economic benefits of PM2.5 and O3 pollution improvement in 2025 in different scenarios were calculated, as shown in Figure 7. The health economic benefits of PM2.5 pollution improvement in the FFP scenario, were RMB 70.178 billion, of which the economic benefits of reduced cardiovascular and respiratory disease were RMB 20.562 billion and RMB 5.432 billion, with Jiangsu and Shandong Provinces generating the greatest economic benefits of RMB 8.717 billion and RMB 7.309 billion, respectively, accounting for 6.05 and 7.1 per cent of GDP, respectively. The health economic benefits of improving O3 pollution are estimated at RMB 34.384 billion, derived mainly from reductions in cardiovascular and respiratory diseases. Specifically, these reductions accounted for RMB 18.938 billion and RMB 1.278 billion in economic gains, respectively. In Henan Province, the benefits from reduced cardiovascular and cerebrovascular disease amounted to RMB 1.209 billion, with similar improvements noted in Hebei Province for respiratory ailments. The health economic benefits of reductions in both pollutants under the FFP scenario were higher, which suggests that the existing 14th FYP pollution control targets could effectively reduce the health economic losses caused by PM2.5 and O3 pollution. PM2.5 has more realisable benefits than O3, and the reduction in losses is more significant.
The health economic benefits of PM2.5 pollution improvement under the SSL scenario were RMB 60.916 billion. Tianjin, Hebei, Shanxi, Shandong, Henan, Hubei, and Hunan realised more economic benefits under the SSL scenario than under the FFP scenario. The economic health benefits of reduced O3 pollution were RMB 17.267 billion, with RMB 9.346 billion and RMB 539 million for reductions in cardiovascular and respiratory diseases, respectively. The realisable economic benefits in Beijing, Shanxi, Jiangsu, and Henan were larger than those in the FFP scenario. The health benefits of O3 were found to be significantly lower in the SSL scenario compared to PM2.5. This suggests that imposing a secondary zone standard concentration in provinces and cities that exceed PM2.5 concentration limits will lessen the economic losses associated with O3 pollution in terms of health.
The realisable economic benefits of PM2.5 pollution improvement under the PSL scenario were RMB 229.268 billion. Jiangsu Province had the most realisable economic benefits, at RMB 26.303 billion, accounting for 18.25% of GDP. The realisable economic benefits of improving O3 pollution improvement were RMB 14.227 billion, of which RMB 77.924 billion and RMB 5.094 billion were for cardiovascular and respiratory diseases, respectively. This shows that the implementation of the Tier 1 area standard concentration for the exceeding provinces and cities can achieve a great deal of health economic benefits from circumventing premature deaths caused by PM2.5 and O3 pollution, with Jiangsu Province and Guangdong Province having the most realisable economic benefits but not a high percentage of GDP.

3.3. Agricultural Benefits from O3 Pollution Reduction

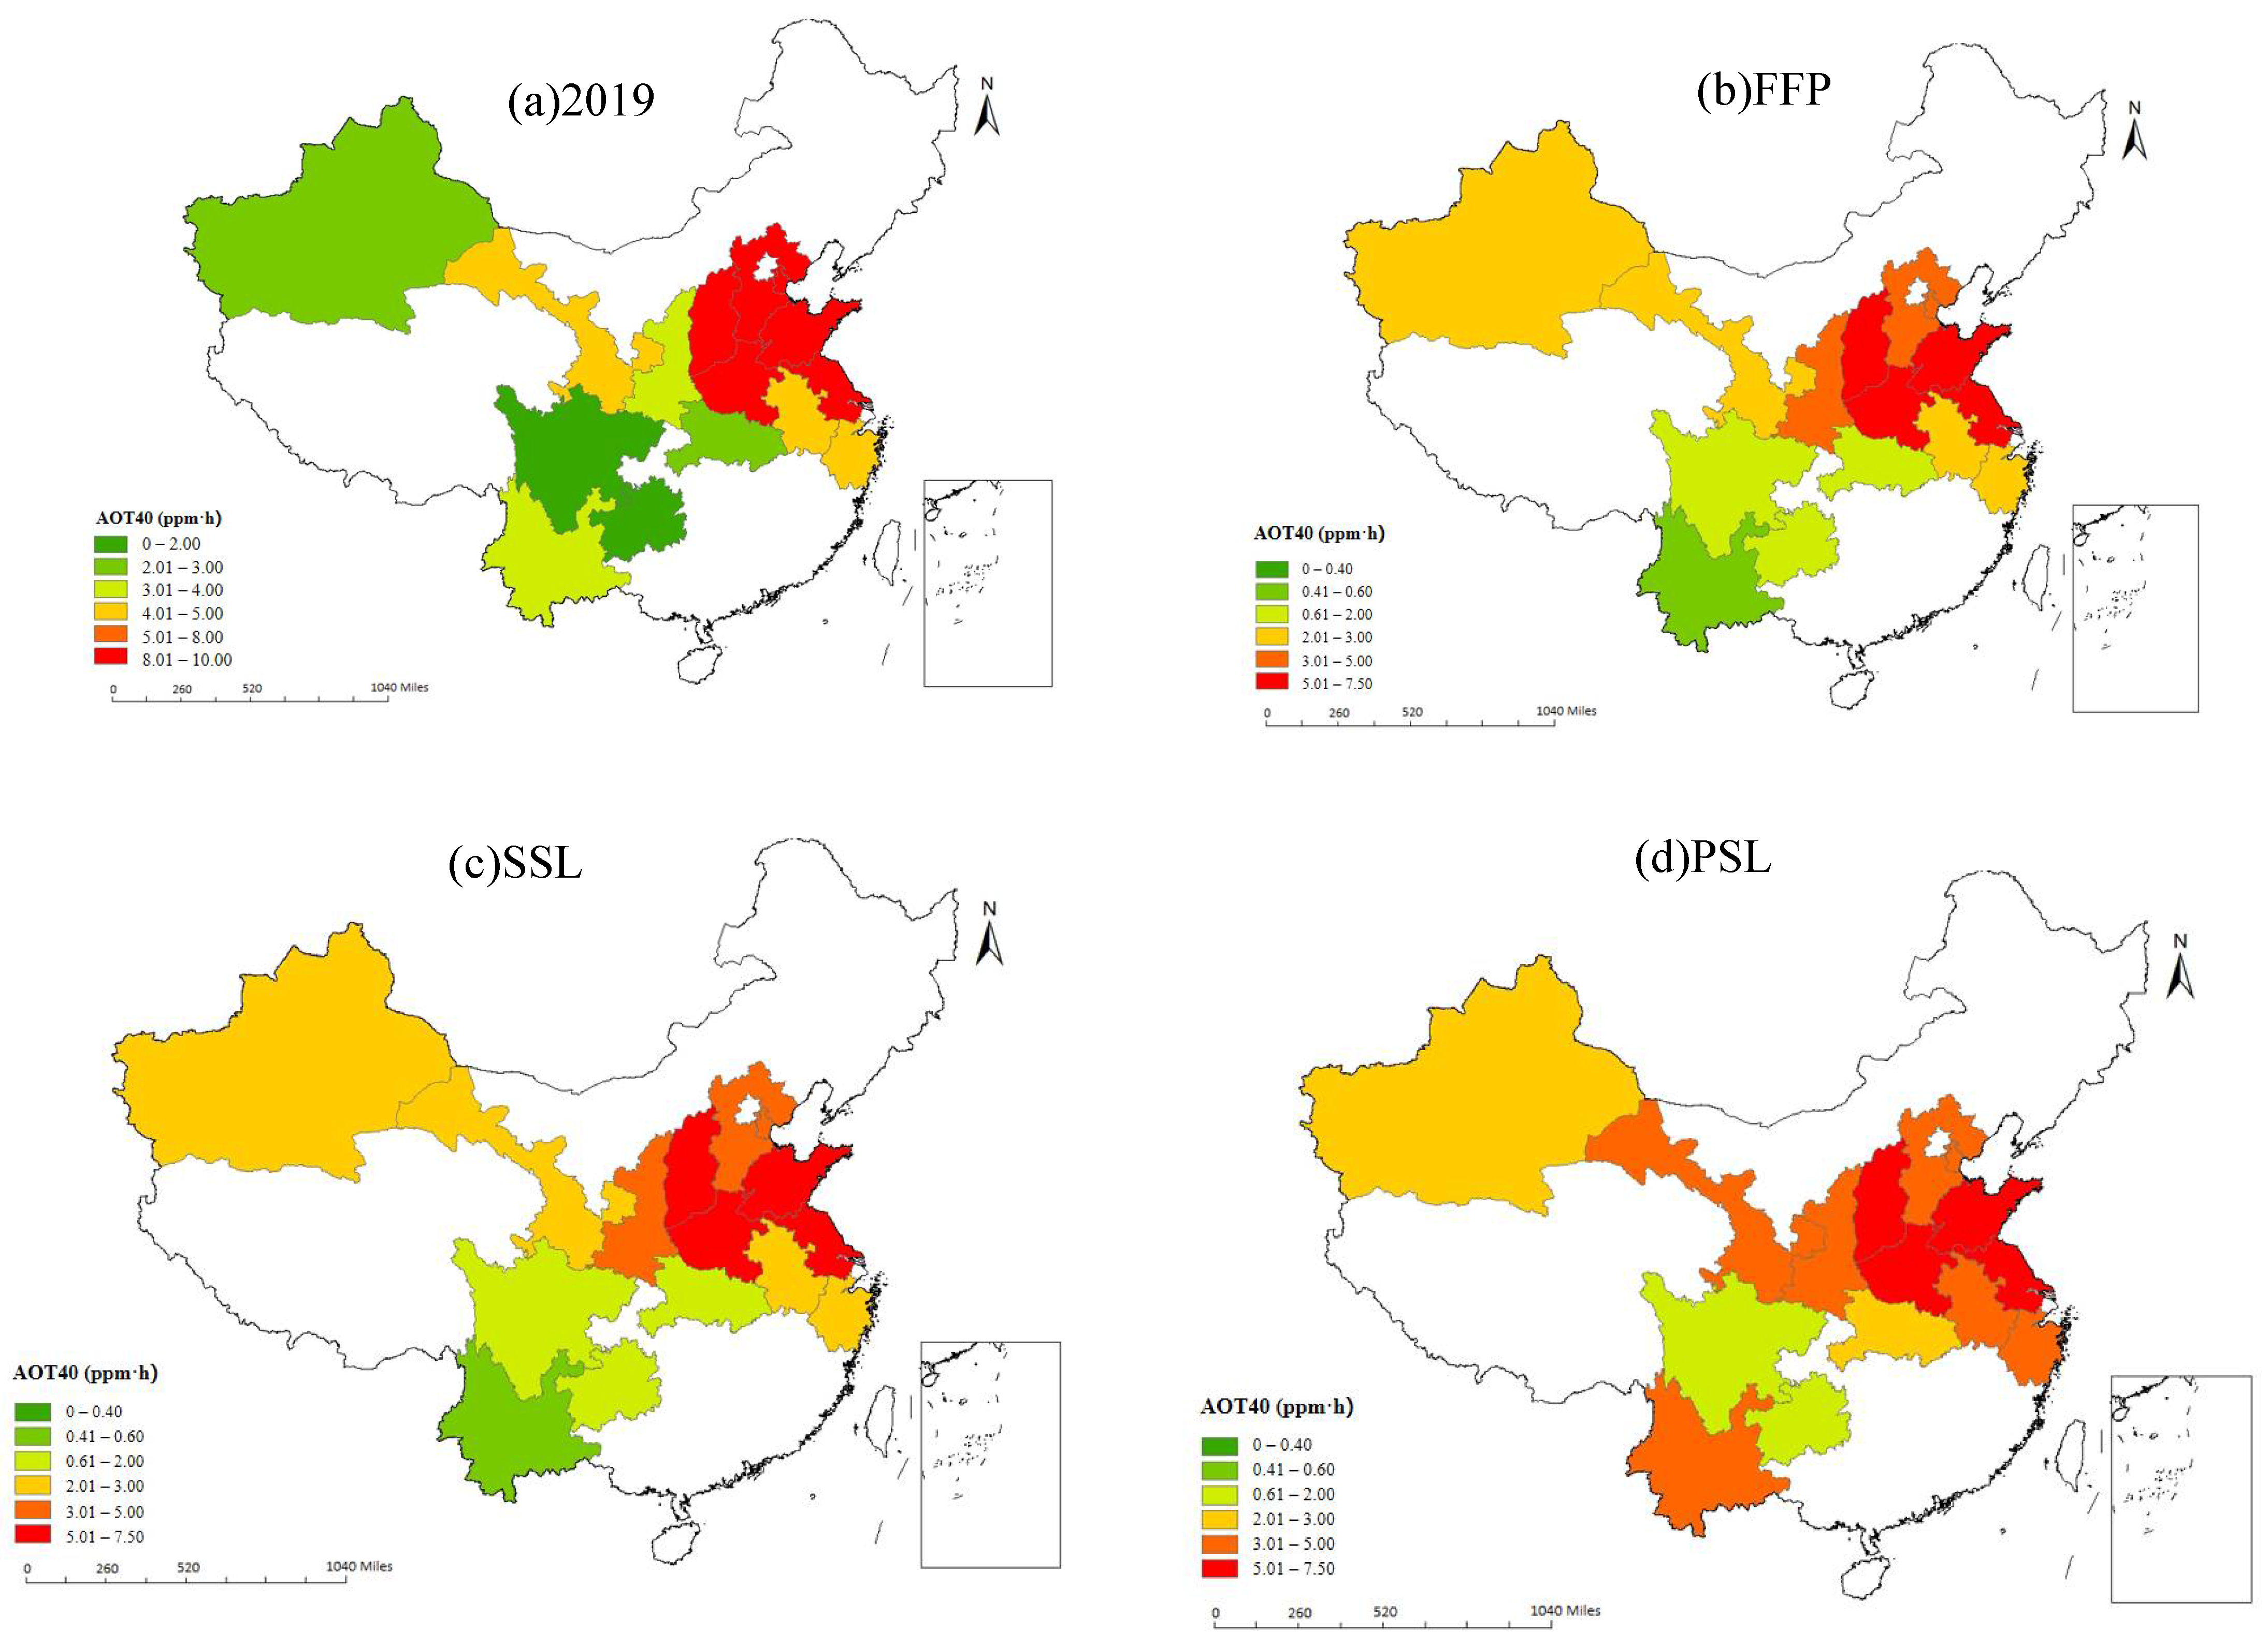
3.3.1. AOT40 Index Forecasts under Various Scenarios

We assumed that the climatic conditions during the growing period of winter wheat in 2025 would be identical to those in the base year. The distribution of the O3 exposure index, AOT40, under each scenario in 2025 was computed and is shown in Figure 3, based on the linear relationship between the two. The distribution of AOT40 was higher in the east and lower in the west, and the ozone exposure index was generally higher in northern and eastern China. The mean values of AOT40 under the FFP scenario ranged from 0.03 to 11.82 ppm-h (Figure 3b). The AOT40 indexes of Shanxi Province, Shandong Province, and Jiangsu Province exceeded 6 ppm-h, while the AOT40 indexes of Sichuan Province, Guizhou Province, and Yunnan Province were less than 1 ppm-h. The SSL scenario did not differ significantly from the FFP scenario, with mean AOT40 values ranging from 0.18 to 10.75 ppm-h (Figure 3c). Notably, the AOT40 indices of Yunnan, Gansu, Anhui, and Zhejiang Provinces increased compared to the FFP scenario, indicating that the implementation of the secondary zone concentration limit was not as effective as the 14th FYP target for O3 exposure in winter wheat. In the PSL scenario, the average AOT40 values in the studied cities ranged from 0.01 to 1.43 ppm-h (Figure 3d). With the significant decrease in annual O3 values, the ozone exposure indices decreased significantly to below 1 ppm-h in all provinces except Shandong, where the AOT40 reached 0.6 ppm-h, the highest value in the studied area. This suggests that winter wheat in Shandong Province was the most affected by O3 pollution after the implementation of the Tier 1 zone concentration limit.

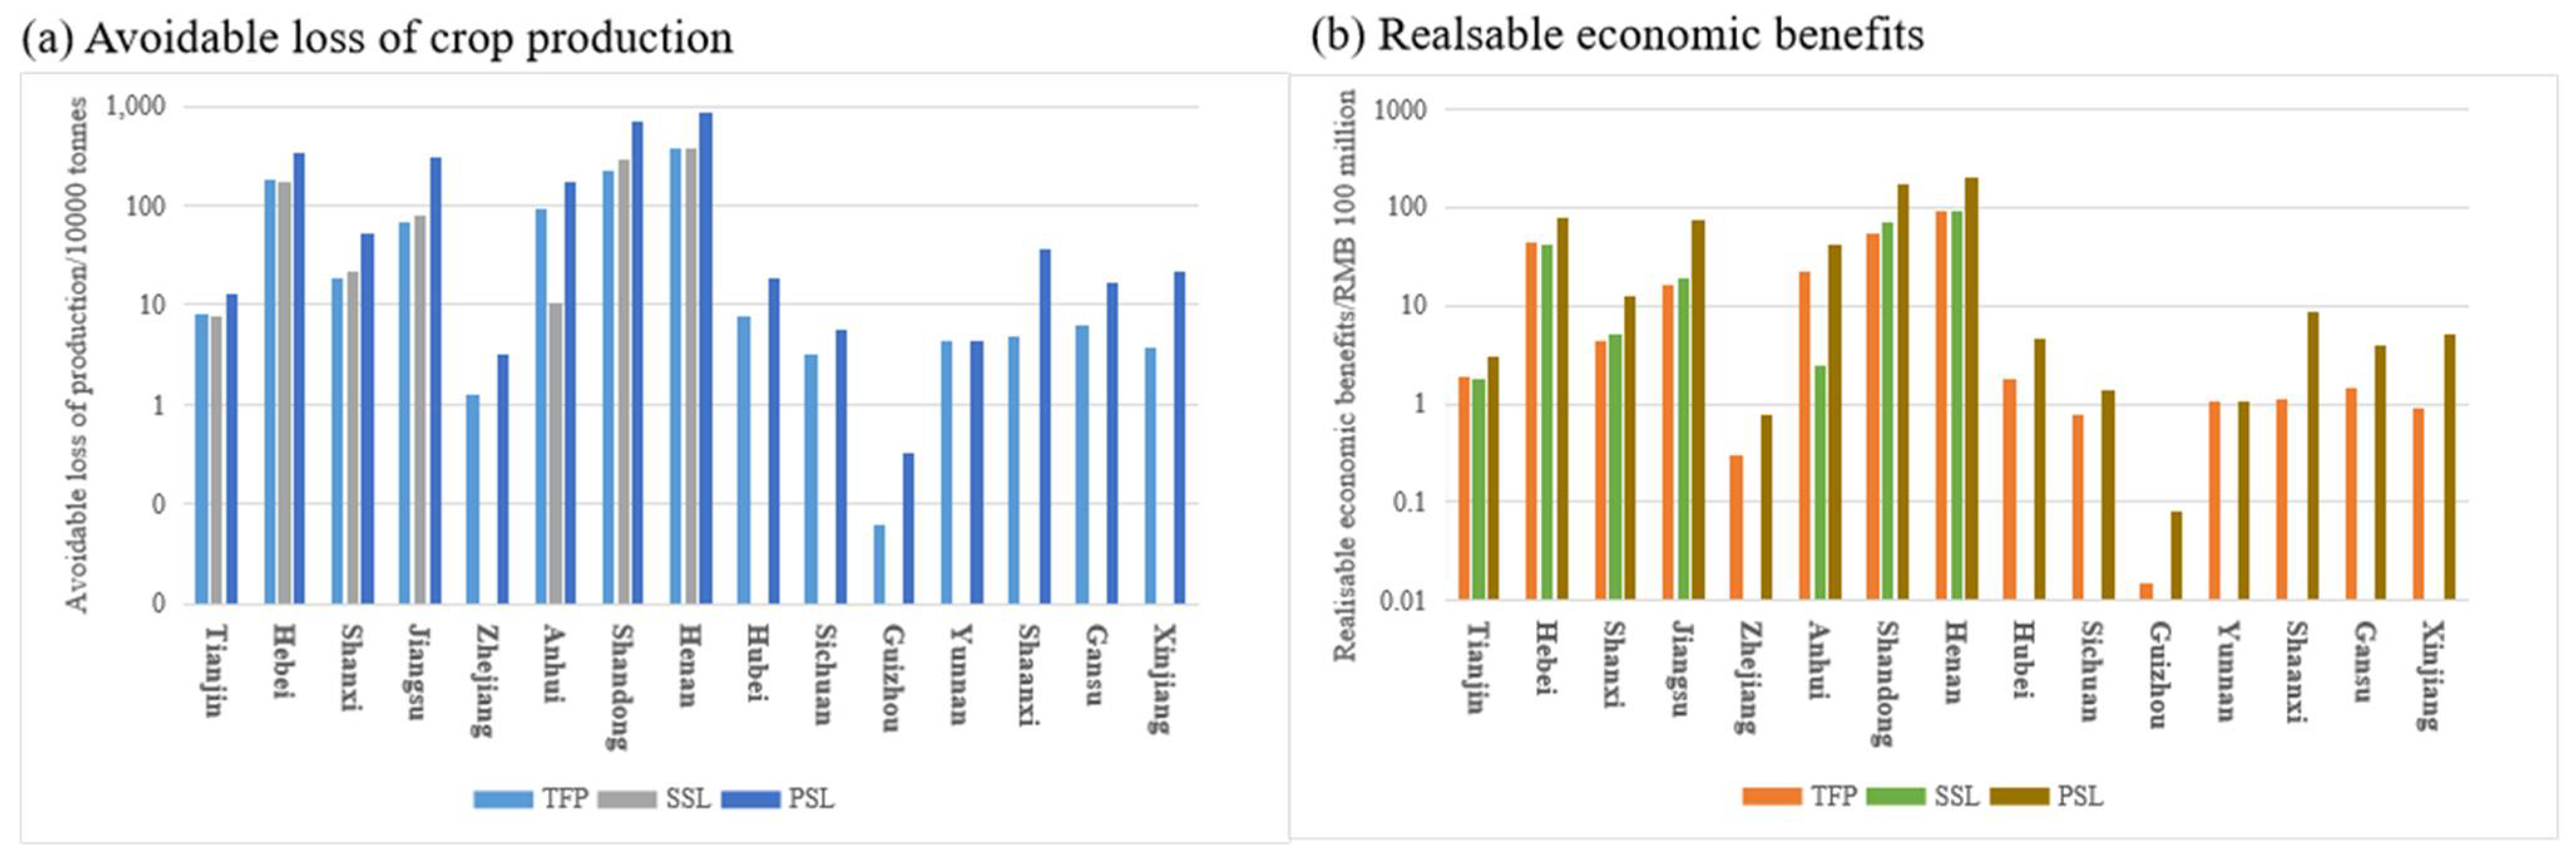
3.3.2. Achievable Crop Yields and Economic Benefits

The avoidable winter wheat yield losses for each scenario in China are shown in Figure 8. Across the scenarios, the total avoided loss followed the order PSL > FFP > SSL, indicating that the 14th FYP target was more effective in mitigating winter wheat yield losses due to O3 pollution than the implementation of the secondary zone concentration limit exceeding the O3 standard. Losses were higher in Henan and Shandong than in the other provinces. Although the losses in Tianjin were not significant, they represented a significant proportion of annual production. The FFP scenarios showed significant reductions in yield losses except in Guizhou. The SSL scenario demonstrated varying degrees of reduction compared to the FFP scenario. Notably, avoidable winter wheat losses increased by 127,900 tonnes and 684,900 tonnes in Jiangsu and Shandong, respectively. Under PSL scenario, avoidable yield reduction exceeded 20% of annual production in Tianjin, Hebei, Shanxi, Jiangsu, Shandong, and Henan provinces.
The economic benefits of winter wheat in each scenario are shown in Figure 8. The total economic benefits are ranked as follows: PSL > FFP > SSL. These results indicate that the existing targets of the 14th FYP outperformed the implementation of the secondary concentration limit for winter wheat in major provinces and cities in terms of economic benefits. Henan Province demonstrated the highest economic benefits, followed by Shandong and Hebei Provinces. The FFP scenario had some economic benefits, except for Shaanxi and Xinjiang Provinces. Henan Province reached RMB 7.18 billion, accounting for 0.10% of the province’s GDP in that year. The implementation of the 14th FYP target effectively reduced the economic expenditure on winter wheat caused by O3 pollution. Under the SSL scenario, the economic benefits of Shandong and Jiangsu provinces increased by RMB 1.653 billion and RMB 309 million, respectively, compared to the FFP scenario. The economic benefits for Henan Province remain unchanged. However, the economic benefits for other provinces and cities have decreased. Conversely, all other provinces and cities observed an increase in economic benefits with the potential to contribute up to 0.28% of their GDP in that year. The implementation of O3 primary concentration limits for winter wheat output in provinces and cities has significant value for reducing national expenditures on winter wheat.

4. Discussion

This study quantifies the number of premature deaths and health economic losses attributable to PM2.5 and O3 pollution for three health endpoints in 2019 and summarises winter wheat production and economic losses in major producing provinces and cities due to O3 pollution. Using 2019 as the base year and 2025 as the target year, improvements in PM2.5 and O3 pollution were analysed under different scenarios, and the number of premature deaths, the health economic benefits, and the agricultural benefits that could be achieved in the target year under different control scenarios were calculated.
This study’s findings on the premature mortality attributable to PM2.5 pollution are similar to the results of the study by Zeng et al. [26], as they both used 10 μg/m3 as the concentration threshold for PM2.5. The results on premature mortality attributed to O3 pollution are close to the findings of Cheng et al. [12] but lower than the results of Wang et al. [38], mainly because their study used an O3 concentration threshold of 57.2 μg/m3, which is lower than the 70 μg/m3 used in this study but higher than the 37.6nmol/mol used by Chen et al. [39]. The literature [26,40] that studied both the premature mortality attributed to pollutants and the associated economic health losses reported results higher than this study, as they used different study years and generally considered the morbidity, outpatient, and hospitalisation losses caused by pollutants, in addition to the premature mortality. In this study, using 2019 as the base year, the number of premature deaths from all causes that could be avoided by PM2.5 reductions in the FFP, SSL, and PSL scenarios in 2025 were 50,600, 43,000, and 200,300 respectively, all of which were more than the number of premature deaths that could be avoided by O3. The overall 2025 forecast results are similar to the findings of Guo et al. [41], with the addition of the health economic benefits. It is suggested that PM2.5 and O3 concentrations in 31 provinces and cities in China need to be reduced to below the secondary standard limit by 2025 to keep the premature mortality close to the 2019, which could realise health benefits of RMB 70.178 billion and RMB 34.384 billion, respectively, to achieve the “14th Five-Year Plan” concentration targets. Some scholars have found that the health and economic impacts of ozone pollution are significantly lower than those of PM2.5, which is consistent with the findings of this study.
The 2019 winter wheat yield loss in Jiangsu Province reported in this study was 3.504 million tonnes. This is similar to the findings of Wang et al. [42], who estimated the annual absolute yield loss in Jiangsu Province to be (1.94–3.75) × 106 t, as they both used the same dose-response function. The differences in results from other studies can be attributed to factors such as earlier study periods [21,43], differences in the selected crops, assessment models, and evaluation indicators [34,44], as well as the exclusion of agricultural economic losses from the scope of research [42]. Compared to previous studies, this research calculated the provincial and temporal variations based on the winter wheat growth and development data, rather than using a single growth period, which resulted in relatively lower but more detailed estimates. There is limited research on the analysis of future agricultural benefits due to changes in O3 concentrations, with most studies focusing on crop yield reductions in local areas under current O3 levels. This study, while considering data availability, has made predictions on the winter wheat yield losses due to future O3 pollution, further exploring the agricultural losses and potential benefits associated with O3 pollution.
This study had several limitations. Firstly, owing to the limited and uneven distribution of monitoring stations, which are influenced by climate, geographical conditions, and other factors, it is not possible to accurately assess the impact of PM2.5, O3 pollution on health and agriculture. Individuals’ subjective perception, family economic level, level of education, and other factors influence the economic risks caused by different pollutants in terms of the medical costs of various diseases. These factors also affect differences in the actual required costs, which will partially affect the accuracy of the results. Secondly, the AOT40 index only considers the effects of O3 exposure concentration and dose, without further considering the characteristics of the crops and climatic differences in different regions, which may lead to a certain degree of uncertainty in the results. Thirdly, the uniform use of 08:00–18:00 during the daytime hours of the main growing season (the period of O3 accumulation) to calculate the AOT40 values for the entirety of China may lead to errors in the estimation of relative crop losses.

5. Conclusions

In this study, the number of premature deaths, the health economic losses, and the winter wheat losses attributable to PM2.5 and O3 pollution were calculated at the national level, using 2019 as the base year. Scenario analyses were used to project health and winter wheat losses in 2025 under four policy scenarios. The aim was to assess the economic benefits of improved air quality in terms of public health and winter wheat yields that could be realised in different regions under different policy scenarios to control PM2.5 and O3 pollution.
In 2019, the annual average PM2.5 was 36 μg/m3, O3-8h was 93 μg/m3, and the composite pollution was more serious in northern and eastern China. The number of all-cause premature deaths attributable to PM2.5 was 46,000 (95% CI: 82,820, 48,484,824) nationwide, with Henan Province accounting for the largest share, causing RMB 196.509 billion in health and economic losses and accounting for 0.2% of GDP. The number of all-cause premature deaths attributable to O3 pollution was about 186,000 cases (95% CI: 101,432, 270,432), with the largest share in Shandong Province, causing a total of RMB 155,807 million in health economic losses and a GDP share of 0.16%, with serious impacts on North China. In 2019, O3 pollution led to 28,524,100 tonnes of absolute production losses and RMB 62,268 million in economic losses in winter wheat in major output provinces and cities, including a more pronounced negative impact on economic expenditure on winter wheat in Hebei Province.
The numbers of all-cause premature deaths due to PM2.5 and O3 pollution in the baseline scenario in 2025 were 264,225 (95% CI: 88,951, 520,710) and 20,700 (95% CI: 10,979,790, 292,711), and the health economic losses due to PM2.5 and O3 pollution were RMB 278,033 and 220,281 million, respectively, with a significant impact on Henan, Hebei, and Shandong Provinces. The numbers of premature deaths due to PM2.5 in the FFP, SSL, and PSL scenarios decreased by 20.56%, 17.48%, and 81.42%, respectively, compared to 2019, which is more than the number of avoidable premature deaths in O3. Compared to the baseline scenario, the health economic benefits of PM2.5 pollution improvement amounted to 70.178, 60.916, and RMB 229.268 billion for the three scenarios, respectively. For O3, RMB 34.384, 17.267, and 14.227 billion were realised for the three scenarios, respectively. PM2.5 has higher benefits in Henan Province and O3 has higher benefits in Jiangsu Province. The total avoided winter wheat yield loss under the three scenarios was PSL > FFP > SSL, with significant impacts on Henan and Shandong provinces. A total of RMB 62.268 billion in agricultural economic losses was incurred under the baseline scenario, and the three policy scenarios achieved RMB 21.569 billion, RMB 20.789 billion, and RMB 58.947 billion in agricultural benefits, respectively. The provinces with the greatest benefits under the three scenarios were Henan, Shandong, and Hebei.

Supplementary Materials

The following supporting information can be downloaded at: https://www.mdpi.com/article/10.3390/su16177391/s1. Table S1. The 14th Five-Year Plan (FFP) scenarios designed. Table S2. Parameter projections for 2025.

Author Contributions

Conceptualisation, Y.L. and X.G.; methodology, Y.L.; validation, X.G.; formal analysis, Y.L. and D.C.; investigation, C.Y.; data curation, P.T. and L.X.; writing—original draft preparation, Y.L.; writing—review and editing, X.G. and D.C.; project administration, D.C. All authors have read and agreed to the published version of the manuscript.

Funding

This work was supported by National Key Research and Development Program of China No. 2022YFC3700703.

Institutional Review Board Statement

Not applicable.

Informed Consent Statement

Not applicable.

Data Availability Statement

The original contributions presented in the study are included in the article/Supplementary Material, further inquiries can be directed to the corresponding author.

Acknowledgments

This paper represents the perspectives of the authors and does not necessarily represent the official views of our sponsors. We would like to thank the anonymous reviewers for their valuable comments and suggestions to improve the manuscript.

Conflicts of Interest

The authors declare no conflicts of interest.

References

  1. Sokhi, R.S.; Moussiopoulos, N.; Baklanov, A.; Bartzis, J.; Coll, I.; Finardi, S.; Friedrich, R.; Geels, C.; Grönholm, T.; Halenka, T.; et al. Advances in air quality research—Current and emerging challenges. Atmos. Chem. Phys. 2022, 22, 4615–4703. [Google Scholar] [CrossRef]
  2. Schiavo, B.; Morton-Bermea, O.; Arredondo-Palacios, T.E.; Meza-Figueroa, D.; Robles-Morua, A.; García-Martínez, R.; Valera-Fernández, D.; Inguaggiato, C.; Gonzalez-Grijalva, B. Analysis of COVID-19 Lockdown Effects on Urban Air Quality: A Case Study of Monterrey, Mexico. Sustainability 2022, 15, 642. [Google Scholar] [CrossRef]
  3. Manisalidis, I.; Stavropoulou, E.; Stavropoulos, A.; Bezirtzoglou, E. Environmental and Health Impacts of Air Pollution: A Review. Front. Public Health 2020, 8, 14. [Google Scholar] [CrossRef] [PubMed]
  4. Lynch, J.; Cain, M.; Frame, D.; Pierrehumbert, R. Agriculture’s Contribution to Climate Change and Role in Mitigation Is Distinct from Predominantly Fossil CO2-Emitting Sectors. Front. Sustain. Food Syst. 2021, 4, 518039. [Google Scholar] [CrossRef]
  5. Bracamonte-Terán, J.A.; Meza-Figueroa, D.; García-Rico, L.; Schiavo, B.; Meza-Montenegro, M.M.; Valenzuela-Quintanar, A.I. Agricultural abandoned lands as emission sources of dust containing metals and pesticides in the Sonora-Arizona Desert. Environ. Monit. Assess. 2023, 195, 1496. [Google Scholar] [CrossRef] [PubMed]
  6. Chataut, G.; Bhatta, B.; Joshi, D.; Subedi, K.; Kafle, K. Greenhouse gases emission from agricultural soil: A review. J. Agric. Food Res. 2023, 11, 100533. [Google Scholar] [CrossRef]
  7. Deng, C.; Tian, S.; Li, Z.; Li, K. Spatiotemporal characteristics of PM2.5 and ozone concentrations in Chinese urban clusters. Chemosphere 2022, 295, 133813. [Google Scholar] [CrossRef] [PubMed]
  8. Lu, X.; Zhang, L.; Wang, X.; Gao, M.; Li, K.; Zhang, Y.; Yue, X.; Zhang, Y. Rapid increases in warm-season surface ozone and resulting health impact in China since 2013. Environ. Sci. Technol. Lett. 2020, 7, 240–247. [Google Scholar] [CrossRef]
  9. Maji, K.J.; Dikshit, A.K.; Arora, M.; Deshpande, A. Estimating premature mortality attributable to PM2.5 exposure and benefit of air pollution control policies in China for 2020. Sci. Total Environ. 2018, 612, 683–693. [Google Scholar] [CrossRef]
  10. Yue, H.; He, C.; Huang, Q.; Yin, D.; Bryan, B.A. Stronger policy required to substantially reduce deaths from PM2.5 pollution in China. Nat. Commun. 2020, 11, 1462. [Google Scholar] [CrossRef]
  11. Maji, K.J.; Ye, W.-F.; Arora, M.; Shiva Nagendra, S.M. PM2.5-related health and economic loss assessment for 338 Chinese cities. Environ. Int. 2018, 121, 392–403. [Google Scholar] [CrossRef]
  12. Cheng, Y.-K. Spatial and Temporal Distribution Characteristics of Ozone Concentration and Population Health Benefit Assessment in the Yangtze River Delta Region from 2017 to 2020. Environ. Sci. 2023, 44, 719–729. (In Chinese) [Google Scholar] [CrossRef]
  13. Zhang, X.; Osei, F.; Stein, A.; Cheng, C.; Maji, K.J. Temporal and spatial evolution of short-term exposure to ozone pollution: Its health impacts in China based on a meta-analysis. J. Clean. Prod. 2022, 373, 133938. [Google Scholar] [CrossRef]
  14. Xie, Y.; Dai, H.; Zhang, Y.; Wu, Y.; Hanaoka, T.; Masui, T. Comparison of health and economic impacts of PM2.5 and ozone pollution in China. Environ. Int. 2019, 130, 104881. [Google Scholar] [CrossRef] [PubMed]
  15. Kuerban, M.; Waili, Y.; Fan, F.; Liu, Y.; Qin, W.; Dore, A.J.; Peng, J.; Xu, W.; Zhang, F. Spatio-temporal patterns of air pollution in China from 2015 to 2018 and implications for health risks. Environ. Pollut. 2020, 258, 113659. [Google Scholar] [CrossRef]
  16. Guan, Y.; Xiao, Y.; Wang, Y.; Zhang, N.; Chu, C. Assessing the health impacts attributable to PM2.5 and ozone pollution in 338 Chinese cities from 2015 to 2020. Environ. Pollut. 2021, 287, 117623. [Google Scholar] [CrossRef] [PubMed]
  17. Wang, X.; Zhang, Q.; Zheng, F.; Zheng, Q.; Yao, F.; Chen, Z.; Zhang, W.; Hou, P.; Feng, Z.; Song, W. Effects of elevated O3 concentration on winter wheat and rice yields in the Yangtze River Delta, China. Environ. Pollut. 2012, 171, 118–125. (In Chinese) [Google Scholar] [CrossRef] [PubMed]
  18. Yang, C.; Mi, X.N.; Li, Y.; Wang, Z. Effect of Ambient Ozone (O3) Pollution on the Yield of Winter Wheat in Shanxi Province, China. J. Ecol. Rural Environ. 2022, 38, 446–452. [Google Scholar] [CrossRef]
  19. Zhao, H.; Zhang, Y.; Qi, Q.; Zhang, H. Evaluating the Impacts of Ground-Level O3 on Crops in China. Curr. Pollut. Rep 2021, 7, 565–578. [Google Scholar] [CrossRef]
  20. Cao, J.; Wang, X.; Zhao, H.; Ma, M.; Chang, M. Evaluating the effects of ground-level O3 on rice yield and economic losses in Southern China. Environ. Pollut. 2020, 267, 115694. [Google Scholar] [CrossRef]
  21. Zhao, H.; Zheng, Y.F.; Zhang, Y.X.; Li, S. Potential risk assessment of ground-level ozone on rice yield under climate change scenarios. China Environ. Sci. 2020, 40, 2858–2869. [Google Scholar] [CrossRef]
  22. GB 3095-2012; Ambient Air Quality. Environmental Science Press: Beijing, China, 2012. (In Chinese)
  23. Yin, P.; Chen, R.; Wang, L.; Meng, X.; Liu, C.; Niu, Y.; Lin, Z.; Liu, Y.; Liu, J.; Qi, J. Ambient ozone pollution and daily mortality: A nationwide study in 272 Chinese cities. Environ. Health Perspect. 2017, 125, 117006. [Google Scholar] [CrossRef]
  24. Madaniyazi, L.; Nagashima, T.; Guo, Y.; Pan, X.; Tong, S. Projecting ozone-related mortality in East China. Environ. Int. 2016, 92, 165–172. [Google Scholar] [CrossRef]
  25. Cao, J.; Yang, C.; Li, J.; Chen, R.; Chen, B.; Gu, D.; Kan, H. Association between long-term exposure to outdoor air pollution and mortality in China: A cohort study. J. Hazard. Mater. 2011, 186, 1594–1600. [Google Scholar] [CrossRef]
  26. Zeng, X.G.; Ruan, F.F.; Peng, Y.Y. Health effects’ spatial distribution analysis of PM2.5 pollution in China based on spatial grid scale. China Environ. Sci. 2019, 39, 2624–2632. (In Chinese) [Google Scholar] [CrossRef]
  27. Zeng, X.; Ruan, J.; Li, K.; Yu, C.; Wang, Q.; Ruan, F. Health impact and economic loss assessment of indoor PM2.5 pollution: A case during the COVID-19 lockdown period. Atmos. Pollut. Res. 2024, 15, 101963. [Google Scholar] [CrossRef]
  28. Sun, X.; Zhang, R.; Wang, G. Spatial-Temporal Evolution of Health Impact and Economic Loss upon Exposure to PM2.5 in China. Int. J. Environ. Res. Public Health 2022, 19, 1922. [Google Scholar] [CrossRef] [PubMed]
  29. He, X.C.; Pi, X.; Xue, D.D.; Zhang, P.L.; Qiu, D.Y.; Liu, X.; Tan, H.W.; Peng, L.; Zeng, H.; Yan, W.H.; et al. Reimbursement rates for doctors’ risky practice allowance under public health emergencies. Soft Sci. Health 2020, 34, 33–36. (In Chinese) [Google Scholar]
  30. Li, Y. Dynamic Assessment of the Air Pollution- Related Disease Burdens and Its response to Reductions in China. Ph.D. Thesis, Lanzhou University, Lanzhou, China, 2020. (In Chinese). [Google Scholar]
  31. Hoffmann, S.; Krupnick, A.; Qin, P. Building a set of internationally comparable value of statistical life studies: Estimates of Chinese willingness to pay to reduce mortality risk. J. Benefit-Cost Anal. 2017, 8, 251–289. [Google Scholar] [CrossRef]
  32. Mushtaq, Z.; Bangotra, P.; Gautam, A.S.; Sharma, M.; Suman; Gautam, S.; Singh, K.; Kumar, Y.; Jain, P. Satellite or ground-based measurements for air pollutants (PM2.5, PM10, SO2, NO2, O3) data and their health hazards: Which is most accurate and why? Env. Monit. Assess. 2024, 196, 342. [Google Scholar] [CrossRef]
  33. Gu, Y.; Wong, T.W.; Law, C.K.; Dong, G.H.; Ho, K.F.; Yang, Y.; Yim, S.H.L. Impacts of sectoral emissions in China and the implications: Air quality, public health, crop production, and economic costs. Environ. Res. Lett. 2018, 13, 084008. [Google Scholar] [CrossRef]
  34. Maji, K.J.; Ye, W.-F.; Arora, M.; Nagendra, S.S. Ozone pollution in Chinese cities: Assessment of seasonal variation, health effects and economic burden. Environ. Pollut. 2019, 247, 792–801. [Google Scholar] [CrossRef]
  35. Feng, Z.; Kobayashi, K.; Li, P.; Xu, Y.; Tang, H.; Guo, A.; Paoletti, E.; Calatayud, V. Impacts of current ozone pollution on wheat yield in China as estimated with observed ozone, meteorology and day of flowering. Atmos. Environ. 2019, 217, 116945. [Google Scholar] [CrossRef]
  36. Avnery, S.; Mauzerall, D.L.; Liu, J.; Horowitz, L.W. Global crop yield reductions due to surface ozone exposure: 2. Year 2030 potential crop production losses and economic damage under two scenarios of O3 pollution. Atmos. Environ. 2011, 45, 2297–2309. [Google Scholar] [CrossRef]
  37. Zhao, H.; Zheng, Y.; Zhang, Y.; Li, T. Evaluating the effects of surface O3 on three main food crops across China during 2015–2018. Environ. Pollut. 2020, 258, 113794. [Google Scholar] [CrossRef]
  38. Wang, C.; Wang, Y.; Shi, Z.; Sun, J.; Gong, K.; Hu, J. Assessment of surface ozone pollution change and its health effect in China from 2014 to 2018 based on multi-source fusion data. Trans. Atmos. Sci. 2021, 44, 737–745. (In Chinese) [Google Scholar] [CrossRef]
  39. Chen, J.; Peng, J.; Xu, Y. Spatiotemporal Distribution and Health Impacts of PM2.5 and O3 in Beijing, from 2014 to 2020. Environ. Sci. 2021, 42, 4071–4082. (In Chinese) [Google Scholar] [CrossRef]
  40. Song, J.; Li, C.; Hu, Y.; Zhang, J.; Kang, J.; Zhao, L. Premature Deaths and Economic Losses Attributable to Long- and Short-Term PM2.5 Exposure in China. Ecosyst. Health Sustain. 2023, 9, 0111. [Google Scholar] [CrossRef]
  41. Guo, Y.; Jiang, Y.D.; Huang, B.Z.; Xing, J.J.; Wei, Z.Z. Health Impact of PM2.5 and O3 and Forecasts for Next 10 Years in China. Res. Environ. Sci. 2021, 34, 1023–1032. (In Chinese) [Google Scholar] [CrossRef]
  42. Wang, Q.; Liu, M.; Yang, J.; Bi, J. Yield losses of rice and winter wheat due to ground~level ozone in Jiangsu Province from 2013 to 2019. China Environ. Sci. 2021, 41, 5094–5103. (In Chinese) [Google Scholar] [CrossRef]
  43. Zhao, H.; Zheng, Y.; Cao, J.; Wei, L.; Guan, Q. Impact of yield and economic losses of crops due to exposure to ozone pollution: A case study of winter wheat and rice in Jiangsu Province. China Environ. Sci. 2018, 38, 1165–1173. (In Chinese) [Google Scholar] [CrossRef]
  44. Dong, C.; Gao, R.; Zhang, X.; Li, H.; Wang, W.; Xue, L. Assessment of O3-induced crop yield losses in northern China during 2013–2018 using high-resolution air quality reanalysis data. Atmos. Environ. 2021, 259, 118527. [Google Scholar] [CrossRef]
Figure 1. Annual average PM2.5 (a) and O3 (b) concentrations in China in 2019.
Sustainability 16 07391 g001
Figure 2. The number of premature mortalities and health economic loss in China in 2019. Note: (a,b) Yellow lines represent the proportion of total deaths in each province that were attributable to PM2.5 and O3 pollution in 2019. (c,d) Yellow lines represent the proportion of GDP that was lost due to health impacts from PM2.5 and O3 pollution in 2019.
Sustainability 16 07391 g002
Figure 3. Distribution of AOT40 in 2019 (a) and under different scenarios (bd) in 2025.
Sustainability 16 07391 g003
Figure 4. Crop yield and economic losses due to O3 in China’s major provinces in 2019.
Sustainability 16 07391 g004
Figure 5. The number of premature deaths attributed to PM2.5 (a) and O3 (b) pollution in 2025.
Sustainability 16 07391 g005
Figure 6. Distribution of avoidable premature deaths attributed to PM2.5 and O3 pollution under different scenarios (FFP, SSL and PSL) in China in 2025.
Sustainability 16 07391 g006
Figure 7. The health economic benefits (ac) and corresponding % of GDP (d) from PM2.5 and O3 pollution abatement under different scenarios in China in 2025.
Sustainability 16 07391 g007
Figure 8. Avoidable loss of crop production (a) and realisable economic benefits (b) under different scenarios in China in 2025.
Sustainability 16 07391 g008
Table 1. The values of β and C 0 for O3 and PM2.5.
PollutantsHealth Endpoints β C 0 (µg/m3)
O3All-cause
RD
CVD
0.00024 (95% CI: 0.00013–0.00035)
(95% CI: 0.00013–0.00035)
70
RD
CVD
0.00018 (95% CI: 0.00011–0.00047)
CVD
CVD
0.00024 (95% CI: 0.0001–0.00044)
PM2.5All-cause
RD
CVD
0.0009 (95% CI: 0.0003–0.0018)
(95% CI: 0.00013–0.00035)
10
RD
CVD
0.00143 (95% CI: 0.00085–0.00201)
CVD
CVD
0.00053 (95% CI: 0.00015–0.0009)
Note: 95% CI: 95% confidence interval; RD: respiratory diseases; CVD: cardiovascular diseases.
Table 2. Economic health loss due to PM2.5 and O3 pollution in 2025.
ScenariosHealth Economic Losses from PM2.5 Pollution
(RMB × 108)
Health Economic Losses from O3 Pollution
(RMB × 108)
All-CauseRDCVDAll-CauseRDCVD
20191965.09255.84548.861558.0795.04821.62
BAU2780.33219.41810.32202.8181.171209.42
FFP2078.55165.09604.681858.9768.391020.04
SSL2171.17175630.522030.1475.781115.96
PSL487.6539.94140.95780.1330.23430.18
Disclaimer/Publisher’s Note: The statements, opinions and data contained in all publications are solely those of the individual author(s) and contributor(s) and not of MDPI and/or the editor(s). MDPI and/or the editor(s) disclaim responsibility for any injury to people or property resulting from any ideas, methods, instructions or products referred to in the content.

