Article

Mapping and Assessing Urban Agriculture in São Paulo: Tackling Socio-Economic and Environmental Issues through Nature-Based Solutions

by
Luiza Vigne Bennedetti
1,
Silvia Ronchi
2,
Maurício Lamano Ferreira
3 and
Fabiano Lemes de Oliveira
2,*
1
Environmental Science Graduate Program, University of São Paulo, Avenida Professor Luciano Gualberto, 1289, São Paulo 04021-001, Brazil
2
Department of Architecture and Urban Studies, Politecnico di Milano, Via Edoardo Bonardi, 3, 20133 Milan, Italy
3
Department of Basic and Environmental Science, University of São Paulo, Estrada Municipal do Campinho, s/n, Pte. Nova, Lorena 12602-810, Brazil
*
Author to whom correspondence should be addressed.
Sustainability 2024, 16(17), 7388; https://doi.org/10.3390/su16177388
Submission received: 20 June 2024 / Revised: 19 August 2024 / Accepted: 20 August 2024 / Published: 27 August 2024
(This article belongs to the Special Issue Sustainable Urbanization)

Abstract

:
Inefficient urban transformations pose multifaceted challenges. In this context, urban agriculture (UA) can address environmental and socio-economic issues. Despite recent UA policies in São Paulo, the lack of data hampers comprehensive evaluations, highlighting the need for robust indicators to enhance environmental sustainability. This article assesses São Paulo’s UA potential using an Ecosystem Services (ES)-based approach, combining ES spatial mapping and a producer survey at 49 UA sites. Results show natural habitats and anthropic areas within urbanised land, especially in the south, with high habitat quality scores. Nine ES were identified: food supply, commercialisation, income generation, waste mediation, lifecycle maintenance, soil formation, leisure/social, well-being, and education. Utilising mixed methods, this study provides innovative insights into ES related to UA in São Paulo, offering valuable input for urban policies and planning.

1. Introduction

Increasing urbanisation processes are linked to a myriad of issues, encompassing losses stemming from ineffective infrastructure, transportation and traffic challenges, socio-economic disparities and vulnerabilities, food insecurity, suboptimal distribution and mismanagement of green spaces, seasonal flood events, biodiversity loss, the urban heat island effect, and air pollution, among others [1].
Essential goals of public policies concerning the utilisation of urban spaces tend to call for their social equity, economic viability, and environmental equilibrium. Nature-based solutions (NbS) hold the potential to offer ecosystem services (ES) to address these challenges [2]. An example of NbS in urban areas that has been reported with relative success is urban agriculture (UA) [3,4,5]. This activity can bring benefits through ES, encompassing environmental aspects (e.g., sequestration and storage of atmospheric carbon and nitrogen compounds and the protection of urban fauna), social dimensions (e.g., democratisation and promotion of a healthy environment and the provision of activities related to mental health), and economic facets (e.g., food supply) [6,7,8].
ES models play a pivotal role in understanding and quantifying the intricate relationships between ecosystems and human well-being in cities [9]. These models provide valuable insights into the myriad of benefits that ecosystems offer, ranging from clean air and water to food provision and cultural enrichment [10]. By accurately depicting the connections between ecological processes and human activities, ecosystem services models inform decision-making processes across various sectors, including urban planning, agriculture, and conservation [11].
Moreover, cities can also function as spaces for biodiversity. Research suggests that the state of biodiversity in urban areas can mirror habitat quality [12]. Habitat quality denotes the capacity of an ecosystem to furnish all essential goods and services for its living environment [13]. It is an inherently abstract concept aimed at encapsulating the overall quality of an ecosystem by assessing its departure from an ideal reference state [14].
São Paulo expanded without efficient urban planning [15], becoming currently the fifth largest city on Earth [16] and Brazil’s most populous city, hosting the country’s largest industrial area [17]. Despite the mapping of the municipality’s vegetation cover revealing a significant number of green spaces, there is a lack of indicators demonstrating these areas’ potential in providing ES for enhancing human well-being.
While recent public policies have been implemented to promote UA in São Paulo [18], the practice has deep historical roots in the city, notably in its southern neighbourhoods [19]. A survey conducted by Valdiones [20] reported in 2012 that there were a minimum of 446 UA sites within the city, encompassing an estimated area of 5000 hectares.
While São Paulo boasts 50% vegetative coverage across its territory [21] and accommodates UA activities, there is a notable absence of comprehensive analyses qualifying the provisioning of its ES, currently limited to air pollution mitigation and thermal comfort promoted by urban vegetation [22,23,24]. Such information is crucial for reshaping environmental policies and the urban planning process towards a performance-based approach to enhance the quality of urban spaces. The evaluation of its ES in the city can support a shift in planning policy towards more performative landscapes, encompassing the assessment of urban space habitat quality in conjunction with UA activities.
As such, this article aims to map the potential ES offered by UA in the city of São Paulo, employing two distinct approaches. The first one involves the assessment and mapping of the habitat quality based on a tailored-made Land Use/Land Cover (LULC) map of São Paulo in 2021. This examination describes how habitats are threatened by specific LULCs and suggests the performance of areas that provide ES. The second involves identifying ES already provided by UA based on responses obtained from UA users through a semi-structured questionnaire. Thus, the study addresses the following research questions: (i) How do land use and land cover in the city of São Paulo contribute to or hinder habitat quality? (ii) Considering that green spaces such as UA can provide ES, what ES can we identify from the discourse of UA producers?
This study is based on the hypothesis that UA in São Paulo contributes to the provision of ES, thereby enhancing urban habitat quality. However, proper integration of UA requires an understanding of the existing habitat quality profile in the city. The absence of a comprehensive analysis of this profile and the potential of ES provided by UA in São Paulo represents a significant gap in the literature that this work aims to fill. By combining spatial analysis with qualitative insights from UA users, this study provides valuable data that can benefit urban planners, policymakers, researchers, and the general population, facilitating the development of more functional and environmentally balanced urban landscapes.

2. Materials and Methods
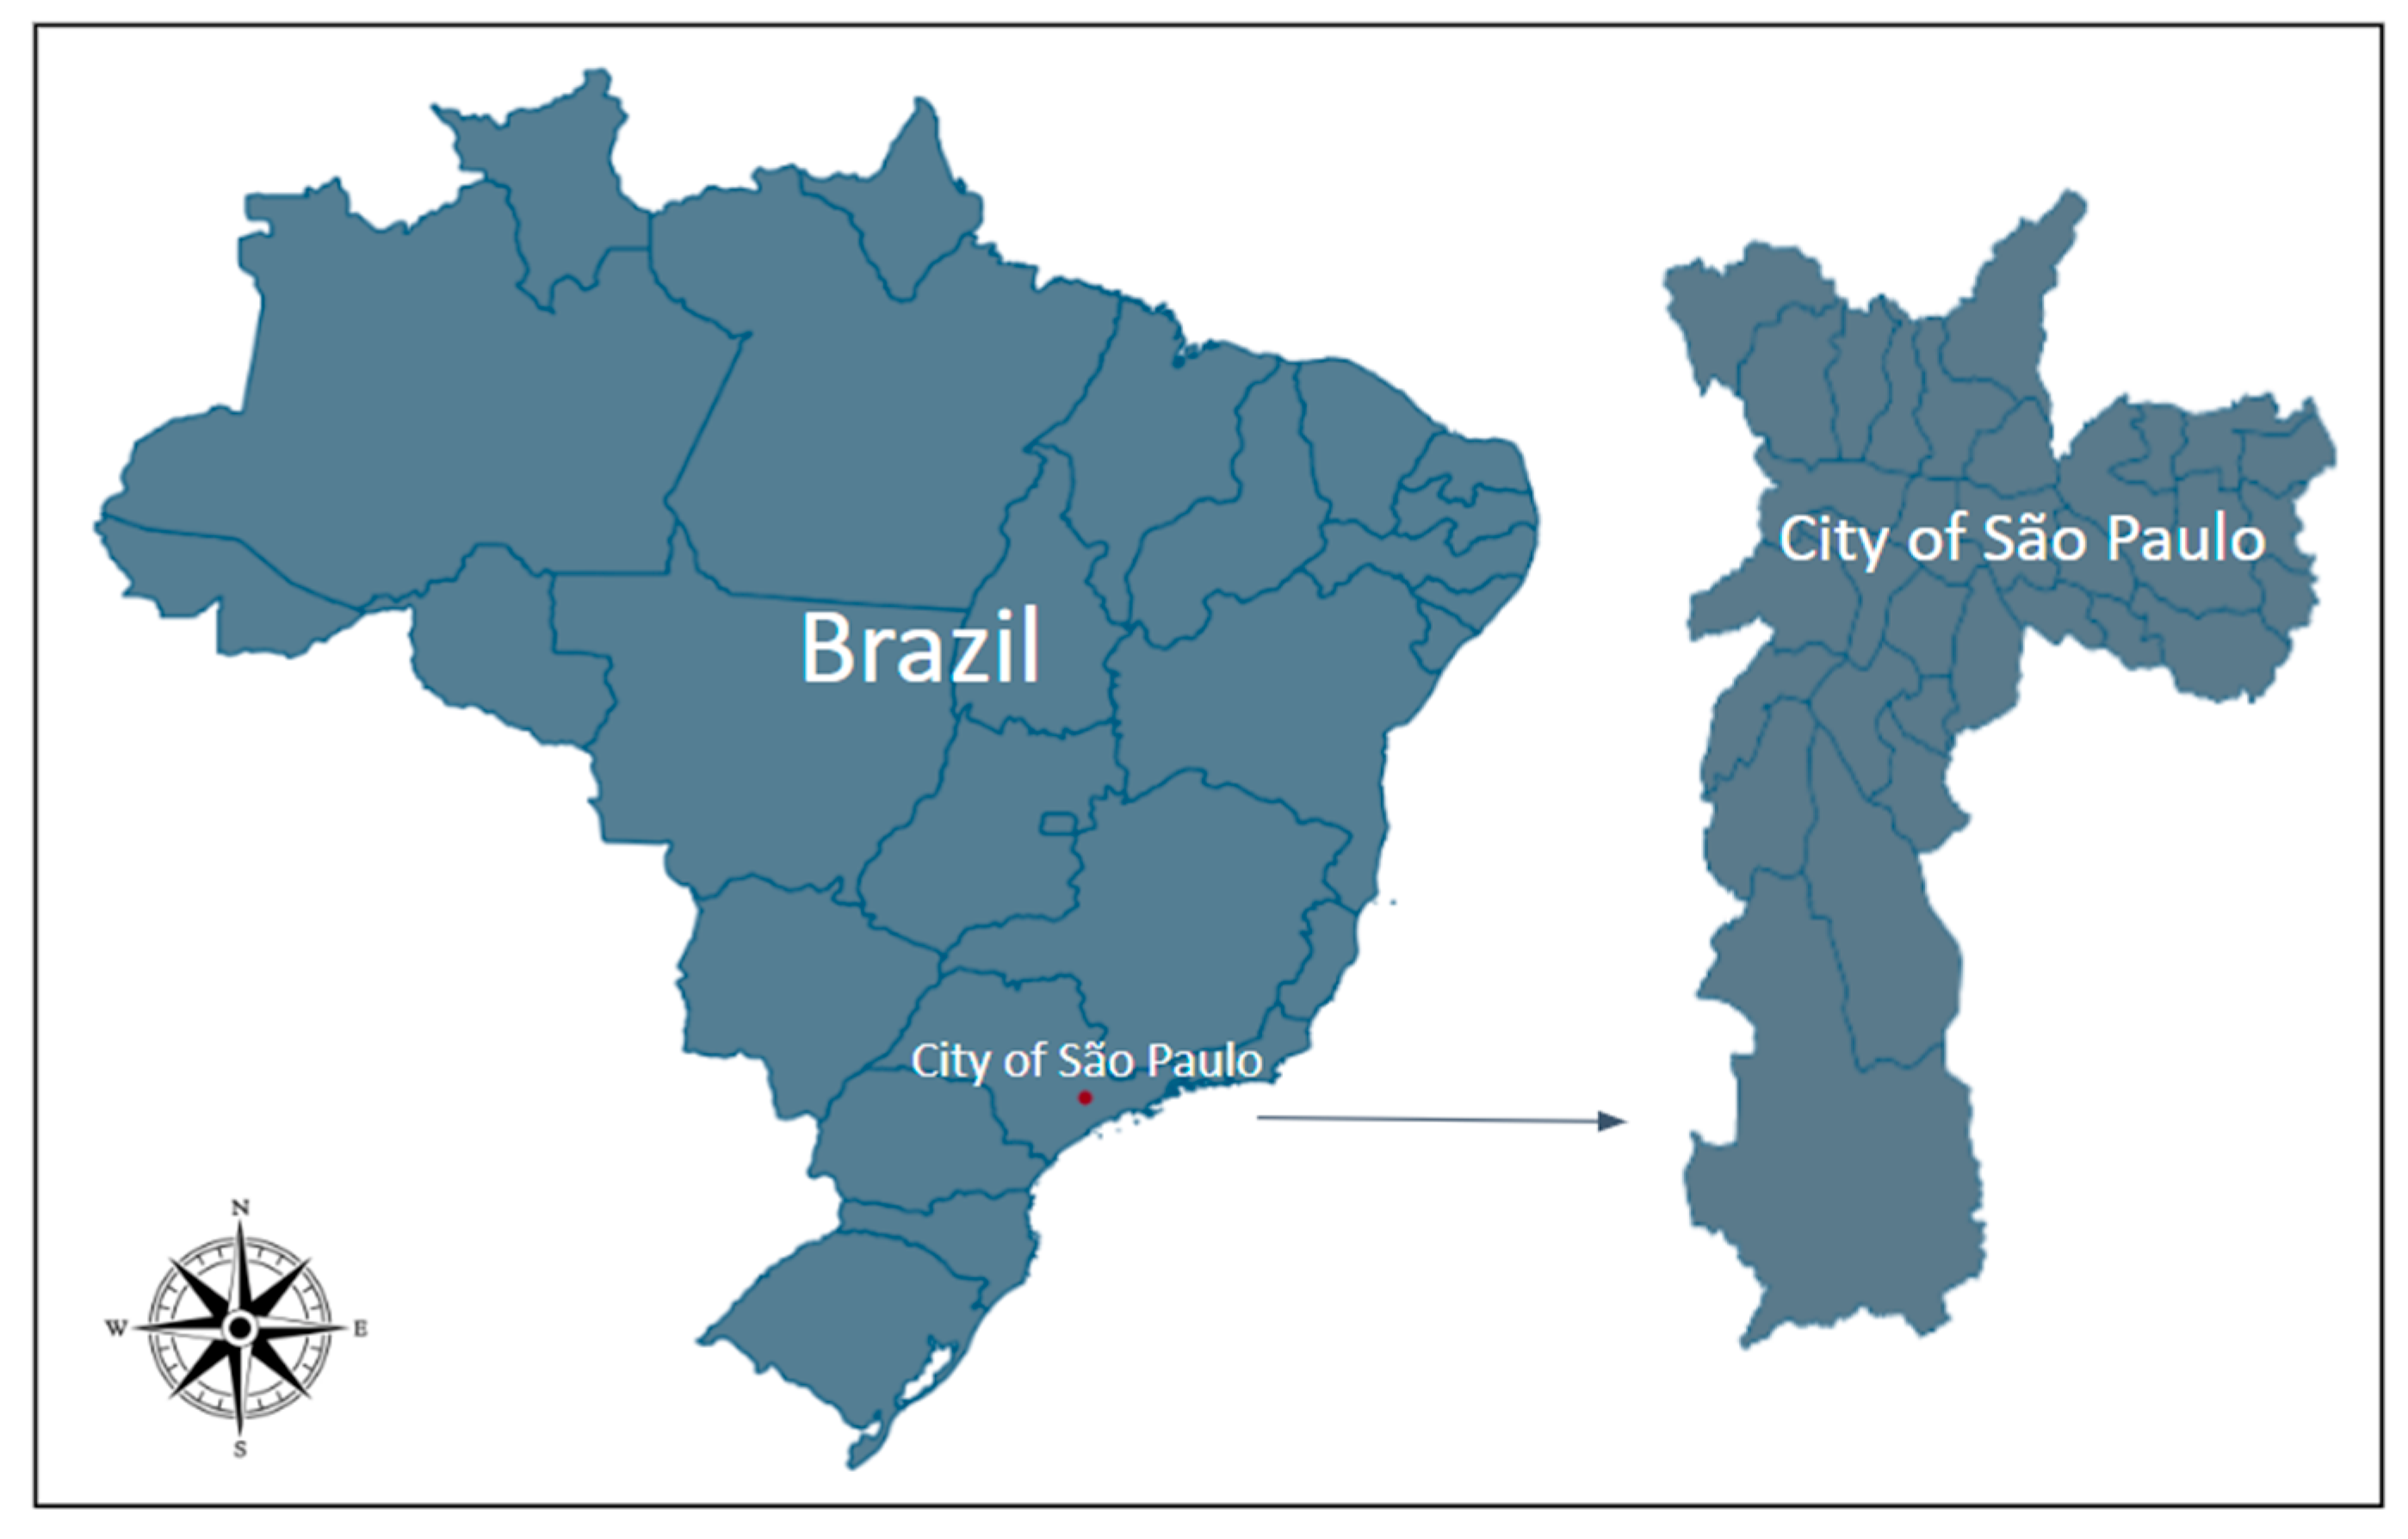
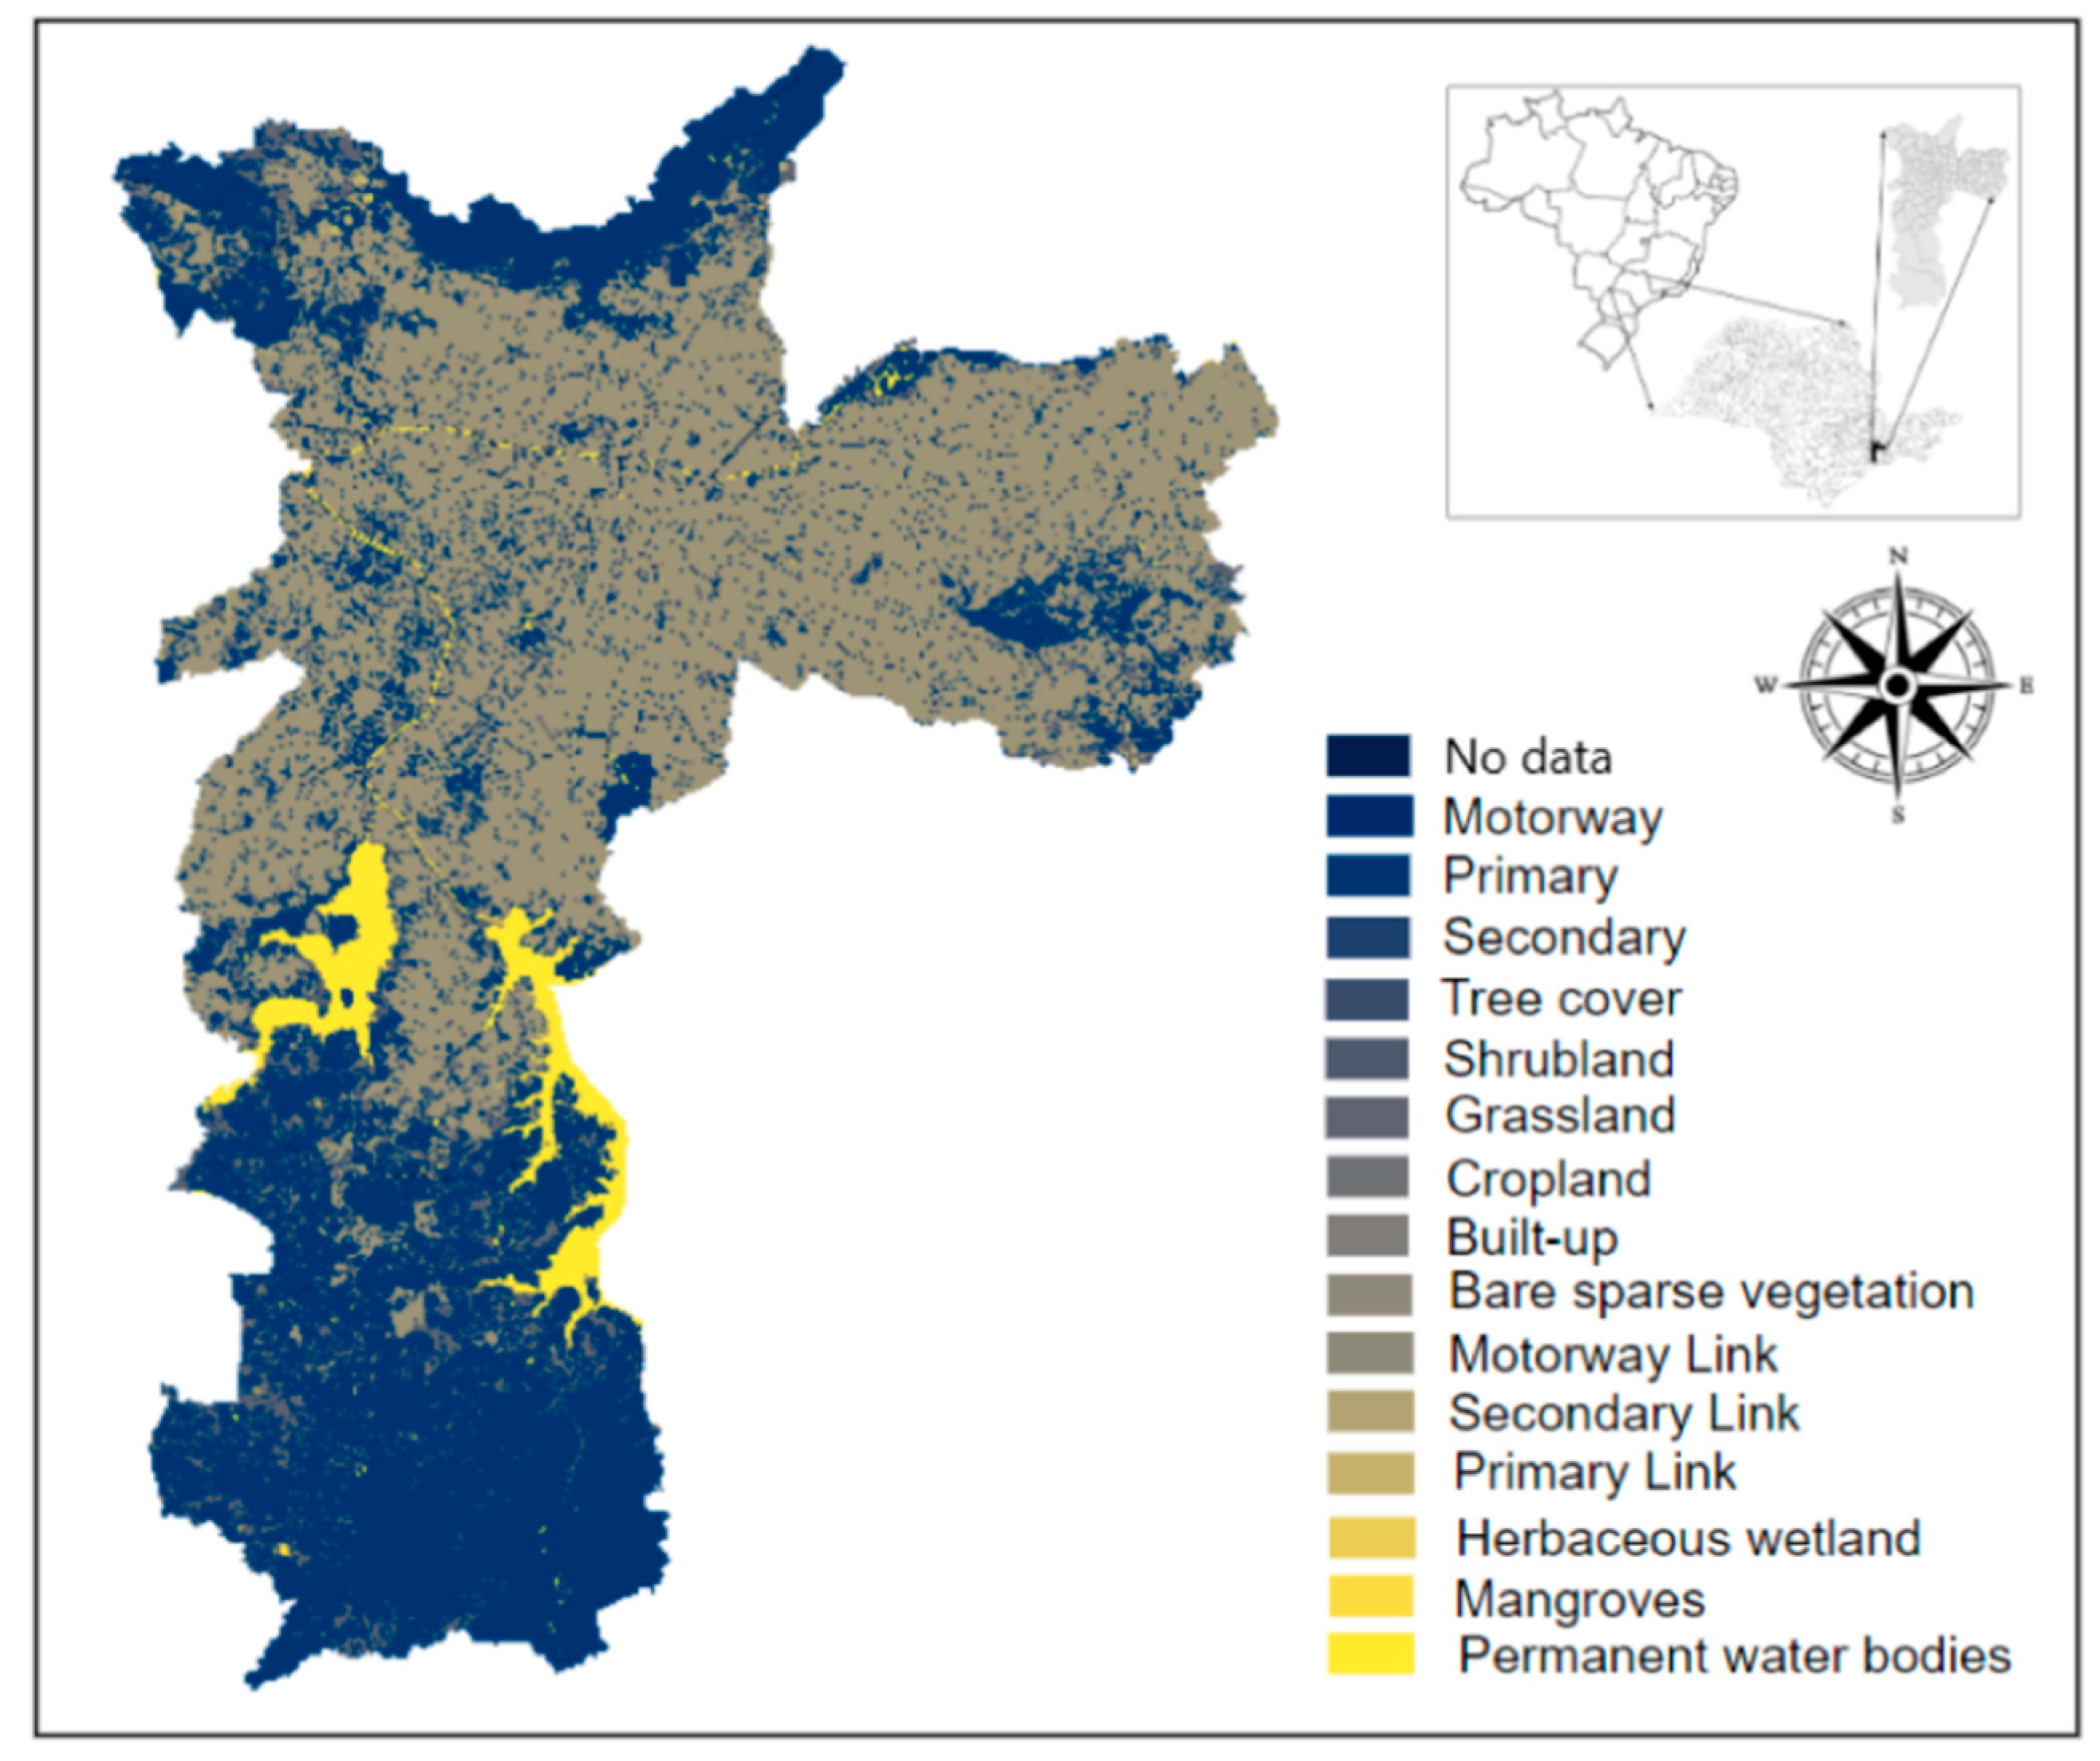
2.1. Study Area

The study area is the capital of São Paulo state (Figure 1), located in the southeast region of Brazil. São Paulo is the largest and most populated Brazilian city and the main economic centre of Latin America. It encompasses 32 sub-municipalities, with a population of 12,325.232 people in a land area of 1521.110 km2. The metropolitan region of São Paulo hosts more than 22 million people, making it the fifth largest city on the planet [16]. It has a subtropical climate, with humid summers and dry winters. The annual mean temperature is 19.5 °C, with a mean annual precipitation of 1356 mm. São Paulo presents a Municipal Human Development Index (MHDI) of 0.805 and a Gross Domestic Product of US$ 11,941.14 [17], indicating relatively high levels of human development and economic output when compared with the national average of 0.699 and US$ 2.13, respectively. Notwithstanding, São Paulo manifests a pronounced socio-economic contrast across its territory, with peripheral neighbourhoods exhibiting the lowest MHDI [25]. São Paulo is located within the Atlantic Forest biome, comprising 45.9 thousand hectares of the municipality’s total area. The city boasts approximately 70% of roads lined with trees, although this is unevenly distributed [17]. Despite its elevated population density, the presence of informal settlements, coupled with environmental protection sites within urban areas, remains noteworthy.
In São Paulo, UA manifests itself in different localities, each with its own characteristics. In the southern zone, known for its peri-urban arable land and low socio-economic indicators, there is a gradual transition towards organic farming [26]. Areas such as the eastern zone demonstrate an effective model of UA that supports local market supply. In densely surbanised regions such as the western zone, initiatives are more focused on social issues and environmental awareness [27].

2.2. Habitat Quality

The InVEST Habitat Quality (HQ) model gauges an ecosystem’s capacity to provide suitable conditions for individual and population persistence. This index is computed using Integrated Valuation of Ecosystem Services and Trade-offs (InVEST) software version 3.14.2 (https://naturalcapitalproject.stanford.edu/software/invest, accessed on 4 November 2023), a freely accessible and downloadable toolkit designed to map and assess ES provision across various service types [12]. The resulting HQ score is based on the proximity of the habitat to human land uses and the degree of disturbance caused by them [28]. The model can be applied to generate habitat maps tailored to specific fauna or used more broadly to provide a comprehensive evaluation of habitat quality for all species. In the latter, HQ is considered a synthetic indicator, serving as a proxy for ecological quality.
Implementation of the HQ model requires (i) data on the LULC map, (ii) information on threats to habitats, specifying the maximum distance over which each threat affects each habitat, and (iii) details about the habitat type and its sensitivity to threats. The assignment of values for each habitat type is crucial, with each LULC assigned a specific value ranging from 0 to 1. The HQ map represents a relative value specific to the projected location.
As such, the habitat index input variable plays a vital role, with the model assigning an initial value to each land cover and defining the interaction of the habitat with threats. This process generates a degradation trend for each habitat type using linear or exponential decay functions.
In formulating the habitat quality model, we defined parameters supported by the literature [29,30]. The parameters encompassed the relative weight assigned to each threat, the habitat sensitivity to individual threats, the distance between habitats and sources of threats, and the presence or absence of habitats. Expert knowledge guided the determination of these parameters.
The LULC data for the year 2021 for the municipality were chosen as the sampling source. These data were collected as Landsat satellite images from the European Space Agency [31]. In order to have more accurate information about threats, we added a layer extracted from OpenStreetMaps to the satellite image [32]. A detailed description of the LULC categories from the satellite image is provided in Table 1. In this study, we designate urbanisation and infrastructure as potential threats to the habitats within the scope of the available LULC data (Table 2). Threats and sensitivity scores were established through a synthesis of information drawn from relevant literature and expert knowledge (Table 3).

2.3. Questionnaire

Data were collected between October 2022 and July 2023. We conducted a semi-structured questionnaire with UA users to gain insights into their perceptions of the challenges and opportunities associated with UA. The survey included questions about the general characteristics of their food production, activities, and the socio-environmental aspects of the sites, employing a combination of open-ended and Likert-scale questions (Table 4). Subsequently, the collected responses were analysed to identify the presence of ES-based references in the UA users’ narratives.
Participants were selected because of their enrolment with the São Paulo City Hall through the website Sampa+Rural [33] between 2022 and 2023, where their contact information was available (Figure 2). After applying the selection criteria, field visits were conducted in 49 out of the 152 locations to conduct the semi-structured questionnaire. Reasons for excluding locations from the study included failure to establish contact with the site, cessation of horticultural activities at the time of contact, and respondents not having sufficient time to complete the survey on the day of the visit.
We used QDA Minner Lite v.6 to analyse the answers, seeking common themes. To understand the potential of UA in delivering ES, as perceived by UA users through the questionnaire, we developed codes according to the Common International Classification of Ecosystem Services [34]. This classification encompasses ES in three main sections: provisioning, regulation and maintenance, and cultural (Table 5).
Statistical tests were executed in IBM SPSS Statistics version 29.0.2.0 to assess the distribution of variables using the Kolmogorov-Smirnov method and to examine the correlation between variables through an ANOVA test. A statistical significance level of 0.005 was employed.
All of the procedures involving human subjects were approved by the ethics committees of the University of São Paulo, São Paulo, Sao Paulo estado (ETIC 5464). Written, informed consent was obtained from all participants.

3. Results

3.1. Habitat Quality

The LULC map (Figure 3) shows the composition of classes in the city of São Paulo. We found that the territory exhibits a robust coverage of natural habitats, encompassing tree cover, wetlands, and herbaceous wetlands. However, these areas suffer a significant impact from anthropogenic LULC classes, particularly motorways and built-up areas (Table 6).
The InVEST HQ model output comprises a map illustrating the quality levels of various habitats and another map depicting the levels of degradation within these habitats (Figure 4). They employ distinct metrics, which are determined by the saturation coefficient specified for running the model. In this study, we exclusively concentrate on the metrics of the quality of the habitats.
In our results, the HQ model score ranged from 0 to 1, with a median value of 0.84 and a standard deviation of ±0.27. Notwithstanding the pronounced anthropogenic impact on numerous regions, primarily attributed to the coverage of motorway classes (HQ scores varied between 0.1 and 0.3), followed by built-up coverage (HQ score of 0.25), there are certain locations exhibiting relatively elevated habitat quality. These areas, notably characterised by herbaceous wetland (HQ score of 0.1), wetlands (HQ score of 0.95), permanent water bodies (HQ score of 0.9), tree coverage (HQ score of 0.85), and bare sparse vegetation (HQ score of 0.75), warrant attention. Additionally, land use classes such as cropland and grassland present HQ scores considered low, with values of 0.6 and 0.5, respectively.
Based on the observed results (Figure 3), it is evident that the southern neighbourhoods of the city of São Paulo exhibit superior habitat quality parameters. This is given the fact that a higher concentration and combination of LULC classes associated with positive ecological attributes, such as herbaceous wetland, permanent water bodies, and tree coverage, are present. Furthermore, this area displays lower concentrations of classes linked to anthropogenic activities, specifically motorways and built-up coverage. The human influence on the natural habitat is relatively mild; hence, in the majority of areas in these neighbourhoods, habitat quality is better preserved.

3.2. Questionnaire Approach

In our study area, urban and peri-urban São Paulo, we visited 49 UA sites out of 152 identified in the municipality records between 2022 and 2023 and administered a semi-structured questionnaire to users. A total of 69.39% of the sites are on public land, with an average area of 0.146 hectares and a standard deviation of ±0.232, and are located primarily in the centre-west zone of the city. Only 38.77% of the gardens are cooperatives or associations; 20.4% reported having received municipal, state, or federal financial resources; and 14.28% reported resources from the private sector or from a non-governmental organisation (Table 7).
In analysing the geographic distribution of ES identified in the questionnaire responses, we observed that most services are evenly distributed across the territory, spanning the entire range of areas studied. Notably, only services associated with provisioning, regulation, and maintenance extend to the southernmost region (Figure 5).
The results reveal that 24.48% of the locations primarily focus on food production, another 24.48% on educational or therapeutic activities, and for the remaining 48.97%, the main objective was not explicitly stated.
Considering the significant proportion of female participants, tests were conducted to evaluate the correlation of this proportion with the main service provided by the garden, food commercialisation, and the garden being a cooperative or an association. The female participation in each location was initially categorised into three groups: low (up to 25% of women), medium (from 25.1% to 74.9% of women), and high (equal to or above 75%). After conducting normality tests on the variables, the correlations were assessed using the ANOVA test [35]. Concerning the primary service provided by the UA site, categorised as education, well-being, or food supply, it was noted that the differences in the averages of women across the groups were not uniform; however, this lack of homogeneity was not statistically significant. Additionally, in relation to the food commercialisation of the UA site’s affiliation with a cooperative or association format, no significant differences were observed among the group means. Statistical tests were conducted to assess the correlation between the inclusion of the garden in a cooperative or association model and the commercialisation statement by the users, as well as with the identified purpose from the responses (education, food supply, or well-being), and no significant associations were observed.
Upon analysing the responses, we identified nine distinct types of ES across the three categories adopted in this study (Figure 6). Within the provisioning category, the nutrition service was identified in 70.9% of cases. Additionally, income generation and commercialisation were considered subclasses of services in this category, with respective identification in 20.4% and 24.48% of sites. The most frequently identified category was regulation and maintenance, encompassing the mediation of waste and toxicity as well as soil formation and composition, identified in 81.63% and 20.4% of cases, respectively. Moreover, lifecycle maintenance, habitat, and gene pool protection were identified in 10.2% of responses. Lastly, the cultural section showed that 77.55% of cases related to education, 6.12% to well-being, and only 2.04% to leisure/social services.

3.2.1. Provisioning Services

In relation to provisioning services, all locations offer fruits and vegetables, including non-conventional edible species, with one particular location additionally employing the aquaponic technique to supply fish.
In our study, we assume the commercialisation of food and its income-generating aspects as subcategories prompted by the provision of food from the sites. Regarding income generation, it was mentioned in 20.4% of the 49 surveyed locations in structured responses, while 18.2% of producers affirmed it in open-ended replies. This disparity could have arisen from challenges in precisely defining income generation and financial returns. Some locations assert that their activities merely cover costs, stating, “the operation only pays the costs,” or suggesting that “…there is still no financial return in reais as it is estimated that this will only occur in five years.” In essence, the activity has the potential to generate income, but it may not always occur immediately.
Another noteworthy point is that, in certain instances, the activity may not yield direct income but rather alleviate monthly food costs. As stated by one producer, “there is no financial return because we do not sell our production, it is exclusively for consumption by the group that takes care of the garden; however, this consumption generates a positive impact on the income of families, as they stop buying vegetables in the market.” In an exceptional scenario, three sites reported the recruitment of employees by the municipality through targeted announcements to provide labour for urban agriculture initiatives.
Selling to commercial establishments was reported by 24.48% of the producers, and sales can occur both at the site and in street markets. Of these producers, 14.5% indicated that the buyers of their products come from the neighbourhood.

3.2.2. Regulating and Maintenance Services

Regulation and maintenance services were discerned through the presence of processes such as waste mediation, lifecycle maintenance, habitat and gene pool protection, and soil formation and composition.
Composting was reported by 81.63% of the producers, contributing to waste mediation. The lifecycle maintenance service was supported through beekeeping at 7.3% of the sites and, additionally, through the observation of general wildlife by 3.6% of the producers. Although a minority of producers mentioned the presence of animals, it was evident that some farmers understood the association between UA and the fostering of habitat for species. One participant explicitly stated, “There is no animal husbandry, but the activity supports urban fauna.”
The service related to soil formation and composition can also be supported by organic production, identified by having an official organic certification (20.4% of the sites), or through production without chemical pesticides, reported by 85.71% of the producers. We perceive the possession of an organic production certificate as a more reliable indicator for the soil formation service, given that stating the non-use of agrochemicals might be ambiguous for certain producers.

3.2.3. Cultural Services

Cultural services were predominantly reported in the structured responses (77.55%), all linked to the presence of social, food, or environmental education projects. In the open-ended questions, leisure/social were mentioned by 2.04% and well-being services by 12% of the respondents. Besides that, 14.5% of the producers associated the gardens with educational purposes. Some producers emphasise the connection between mental health and UA, as indicated by statements like “The garden has a well-being and education purpose as it is part of a care and assistance space for vulnerable people and mental health issues”. We understand the mental health association as a contribution to well-being services [36].

4. Discussion

4.1. Habitat Quality

Our HQ map of São Paulo reveals a mix of natural habitats and human-disturbed areas, with significant impact from motorways and built-up coverage. The HQ model score had a median of 0.84. Despite anthropogenic pressures, certain locations exhibit high HQ scores, notably herbaceous wetland, wetlands, permanent water bodies, tree coverage, and sparse vegetation. Southern São Paulo displays superior habitat quality, with concentrations of positive ecological attributes and less human influence, preserving habitat quality in most areas.
The only study applying the HQ methodology in Brazil that we found was also conducted in the southeastern region of the country, albeit in a different biome from São Paulo’s capital, in an area called the Iron Triangle [30]. With distinct LULC classes, the study found a median HQ score of 0.52 and threats to the habitat arising from the high anthropogenic impact of areas dedicated to eucalyptus plantations, pastures, and mining activities. The authors highlight that within their study area, 42.2% overlapped with protected areas and advocate for areas overlapping strictly protected areas to receive financial support through payments for ES. This is particularly important as reserves and parks often lack financial support and management projects, do not consistently restrict nearby deforestation, and face pressure from the local community due to high opportunity costs [30].
The study by Wang et al. [37], which assessed HQ in Cangshan (China), highlights that the primary stressors of habitat quality were the developed economy, high population density, intense urban expansion, and urban construction. For the study of Aneseyee et al. [38] conducted in the Omo-Gibe Basin (Ethiopia), on the other hand, the primary stressors identified were agricultural expansion and highways. In the case of highways, the authors emphasise that they become problematic not only due to anthropogenic disturbance but also because they facilitate logging activities. Therefore, they advocate that keeping roads out of natural habitats is the most effective approach to environmental protection.
Similar to Xiao et al. [39], who evaluated habitat quality in Hubei (China), our research reveals that cropland areas in our study do not exhibit high habitat quality. However, the authors highlight that while habitat quality may be lacking in these areas, urban croplands play a crucial role in ensuring food security, which can also be particularly important in São Paulo, where there is an issue regarding access to fresh food by vulnerable people [40]. Xiao et al. [39] advocate for future efforts to balance land take and compensation policies and implement comprehensive land improvement projects to stabilise agricultural lands and mitigate the loss of essential land resources. We recognise that UA may improve habitat quality to some extent when situated in more urbanised regions, such as the central-eastern region of São Paulo, where the lowest habitat quality is observed. However, considering the abundant vegetation in the southern part of São Paulo, UA may not be an optimal choice for enhancing habitat quality in this area.
Observing the highest HQ score in the southern area of São Paulo is not surprising, given its lower landscape fragmentation, which is also observed in other studies in places with this characteristic [37,41]. Increased fragmentation resulting from decentralised urbanisation leads to reduced landscape connectivity, impacting ecological landscape function and jeopardising organism habitat quality [41]. Thus, an interactive, benign landscape pattern between urbanisation and ecological protection should be established, prioritising the safeguarding of these areas.

4.2. The ES Perception of UA Producers

Regarding the questionnaire, our findings indicate that, in the UA places assessed, it was possible to identify nine different ES through responses obtained from the questionnaire. Regulation and maintenance services took precedence, particularly through prevalent practices such as composting and organic production without pesticides. Among provisioning services, nutrition emerged as the predominant service. Additionally, sales to commercial establishments were reported in some cases, and transactions with neighbourhood buyers were mentioned. Notably, cultural services played a significant role, predominantly educational, underscoring the gardens’ contribution to social, food, and environmental education initiatives. The geographic distribution of these services demonstrated an even distribution across the study area.
Different from our findings, the systematic review of Evans et al. [42], evaluating a total of 157 studies and using ‘The Economics of Ecosystems and Biodiversity’ (TEEB) as the principal ES framework, besides supplementing this with additions from the ‘Millennium Ecosystem Assessment’ (MEA) framework, identified the report of 19 ES associated to UA, which respectively: Maintenance of Genetic Diversity; Local Climate and Air Quality Regulation; Recreation and Mental and Physical Health; Food, Fibre and Fuel; Aesthetic Appreciation and Inspiration for Culture, Art, and Design; Biological Control; Spiritual Experience and Sense of Place; Moderation of Extreme Events; Noise Management; and Disease Regulation. The disparities between our results and theirs may be attributed to the fact that the framework adopted by Evans et al. [42] encompasses a broader range of categories and explores a more diverse array of ES.
On the other hand, in a comparable review of 217 studies conducted by Haase et al. [43], although not exclusively focused on UA, the proportions for each type of ES were revealed to be 70% for regulation and maintenance services, followed by 15% for cultural services, and, finally, 11% for provisioning services.
Promoting green infrastructure in urban centres is not a novel concept, given its multiple benefits in reinforcing a comprehensive resilience strategy [44]. Our findings substantiate the potential of UA in soil preservation or recovery, as well as the provision of habitat for pollinators and other wild species. Prior studies have prominently documented support for faunal species in urban allotments [45,46,47]. Another noteworthy aspect, although not statistically examined in our study, pertains to the support for floral biodiversity. Sanyè-Mengual et al. [47] contend that urban producers contribute to the revitalisation of local and ancient vegetable crops. In our investigation, the overwhelming majority of assessed UA users reported cultivating non-conventional edible species, thereby promoting biodiversity.
Mediation of waste emerged as the most frequently mentioned ES in the questionnaire responses, primarily through composting activities. The synergy between UA and composting has been underscored in prior research [48,49,50], and it is highlighted that by fostering circularity in urban flows, such practices contribute to the reuse of nutrients found in waste, thereby mitigating the environmental costs associated with nutrient protection and synthesis [51].
The observed organic production in the assessed gardens aligns with earlier findings indicating a rise in organic and agroecological practices in São Paulo, particularly present in the city’s south and east zones [40]. Similarly, the study conducted by Diekmann et al. [52] assessed the contribution of various types of urban gardens in California (United States), noting that organic gardening was the most common system of production in both community and home urban garden types. Along with the associated environmental benefits, such as fostering long-term soil fertility [53], it is also emphasised that a prevalent issue in contemporary urban centres pertains to the accessibility of organic products for economically disadvantaged populations [53]. Our study, similarly to Nagib’s [40], illustrates that vegetable gardens situated in areas of São Paulo characterised by a lower level of MHDI can offer local producers and consumers access to organic food.
In the study by Camps-Calvet et al. [45], which assessed the ES of UA in Barcelona (Spain), the most commonly recognised service was “learning and education." In contrast to our findings, Barcelona gardeners also emphasised the significance of “entertainment and leisure” opportunities in UA places. Other scholars underscore that, in addition to food provision, recreational purposes have historically proven to be the primary rationale for urban decision-makers and professionals advocating for urban gardening [54,55]. Schröter et al. [56] stress that the delivery of services pertaining to cultural aspects is contingent upon individual preferences and proves challenging to assess or quantify through objective data collection.
Given that most spaces examined in this study are on public land, their activities tend to be community-orientated, potentially facilitating the identification of a substantial number of cultural services. This outcome might not be as pronounced if the assessment had encompassed more privately owned gardens, for instance, as shown by research in the United Kingdom by Grafius et al. [57] that urban food production predominantly takes place in private gardens. Nonetheless, other studies have discovered that privately managed spaces, such as allotments, contribute to cultural services like recreation, educational activities related to nature, and the promotion of environmental behaviour [54].
The comprehensive examination conducted by Pradhan et al. [58], which analysed 1450 publications, affirms that UA is multifunctional and delivers diverse ES, including pollination, pest control, climate resilience, water regulation, nutrient cycling, recreation, and other cultural services. However, the authors caution that trade-offs among these ES may arise based on the adopted agricultural management practices. In essence, unsustainable practices, marked by inefficient use of agricultural and energy production factors, may not consistently result in lower carbon, energy, or water costs. The authors advocate for judicious management strategies derived from a comprehensive life cycle assessment of both existing and planned projects to ensure the realisation of these benefits.
Some studies assert that UA has the potential to augment extra income for producers [59,60,61]. However, this phenomenon is not universally observed across all UA formats. Abdoellah et al. [62], in their evaluation of income generation from urban allotments in Greater Bandung (Indonesia), found substantial financial returns exclusively in UA places where formal commercialisation took place. Conversely, garden formats dedicated to personal consumption demonstrated only a reduction in monthly food expenses for producers, aligning with our own observations. In this context, UA grapples with a spectrum of intricate issues related to land requirements, adaptability to community characteristics, divergent interests among stakeholders, and the dynamics of area development [59,63,64], which may jeopardise income generation.
Our findings demonstrate that the geographic distribution of the three main types of ES exhibits uniformity across the entire study area, with only provisioning, regulation, and maintenance services extending to the southern region. In an alternative perspective, Caldas and Jayo’s [27] analysis allows for identifying distinct patterns in the location of UA initiatives in São Paulo, characterised by their scale or visibility. In this sense, we could associate the two classifications of UA places in the study with two types of ES: provisioning and cultural, respectively. UA initiatives classified as “scale,” predominantly centred around food supply and consumption, are notably found in the suburbs of the city. In contrast, those with the “visibility” profile, focused on discourse production and visibility for the UA political agenda and strongly emphasising educational activities, tend to concentrate in central regions. The authors acknowledge that, while the mapped initiatives do not constitute a comprehensive census, the results suggest that this distinction between scale and visibility initiatives may be generalised for the entirety of UA in São Paulo. Although the study did not evaluate peri-urban agriculture, this geographical differentiation could, therefore, reflect the distinct emphases of the initiatives, contributing to an understanding of the ES provision and the support that these spaces necessitate from pertinent authorities.
In contrast to our findings, where cultural services were not identified in a peri-urban agriculture model in the southern region, the study by Giacheè et al. [65] documents the well-perceived and evaluated presence of these services by users in microfarms located around Paris (France). However, it is crucial to acknowledge that our study assessed only a singular space, which, firstly, is situated in a peri-urban region and, secondly, is categorised as a microfarm, thus differing significantly from the configurations of urban gardens observed in the central regions of the city.
In our study, we categorise commercialisation as a subclass within provisioning services. In this context, our findings indicate a possibility for urban agricultural production to be predominantly commercialised within its immediate surroundings. The study by Biazoti et al. [66] assessed the commercialisation practices of certain urban producers in São Paulo. The research underscores that farmers affiliated with associations in the east zone concentrate their production within the same zone, maintaining local distribution due to transportation costs and limitations in small cultivation areas. In the south zone, the evaluated cooperative producers have a diverse array of distribution channels, primarily directing the majority of their production to central areas of the city. Conversely, non-cooperative producers in the south zone sell their products at CEAGESP, city of São Paulo, Brazil (a state-owned company responsible for managing supply depots and storage facilities for agricultural products in the São Paulo region), open-air markets, local markets, and directly in the production area, standing out as an alternative for larger-scale production and industrialised markets. Cooperative producers in the north zone sell directly to consumers, notably from surrounding neighbourhoods, and extend their reach to other municipalities in the São Paulo metropolitan region through the National School Food Program. Open-air markets and organic markets play a crucial role in supplying the city with healthier and fresher food, bringing additional benefits to urban spaces such as reducing environmental impacts in production, storage, and commercialisation. Despite the intriguing outcomes of this study, it is important to note that a limited number of producers in our results reported being affiliated with a cooperative or association format. Consequently, comparisons drawn from these findings may be subject to bias.
The significant presence of women in UA, as also evidenced in our study, is notable as they constitute the majority of participants and actively engage in leadership roles within the activity worldwide [67,68]. This trend extends to specific contexts, such as Cape Town (South Africa), where women predominantly hold crucial positions in UA networks, extensions, and markets, serving as influential ambassadors for the activity [69]. However, challenges persist in African and Asian countries, where, despite female leadership in the UA, trade-related roles are often occupied only by men. While our results do not reveal a clear relationship between trade-related activities and the presence of women, other authors [70,71] may indicate a noteworthy gap that requires attention in policies aimed at promoting women’s participation in the activity. Moreover, although our study also does not demonstrate a relationship between the female audience and educational or environmental activities within UA, the involvement of women in the environmental aspect of the activity is already documented in São Paulo, where female UA groups are established to promote agroecology within the sector [72]. Therefore, it becomes apparent that female participation fosters self-development and provides cultural, regulatory, and maintenance services [70,72].

4.3. UA Integration with Environmental Protection

Our study identified nine different ES provided by urban gardens, while the habitat quality analysis highlights the contribution of LULC classes such as herbaceous wetland, wetlands, and tree coverage. Therefore, we emphasise the importance of integrating UA projects with environmental conservation efforts to take advantage of ES. This initiative is exemplified in São Paulo, where the “Programa Guarapiranga Sustentável” (Sustainable Guarapiranga Program) was launched in 2009 with the aim of protecting the Guarapiranga Reservoir, located in the southern region of the city, from environmental degradation, with UA encouraged in its guidelines [19]. This demonstrates that well-planned UA initiatives can be interconnected with environmental preservation, resulting in the local biome’s preservation of habitat quality services.
NbS are specific strategies that harness ecosystems and biodiversity to address issues and promote sustainable development, leveraging ES [2]. The assessment conducted by Castellar et al. [73] regarding the performance of ES provided by NbS implemented in four European projects indicates that cultural services attain the highest score, whereas provisioning services achieve the lowest score. NbS-encompassing activities such as UA have shown particularly high scores in social matters, climate resilience, and air quality [73]. However, it may be of interest to highlight the viewpoint of Almenar et al. [2] in their literature review, which indicates that assessments of NbS typically focus on issues such as climate change but overlook those related to important social matters such as community participation and governance, which could be particularly significant in the Global South [74,75].

4.4. Study Limitations

The application of the InVEST HQ model in practical scenarios is currently limited, despite its significance as a valuable tool for landscape managers in biodiversity conservation [12]. The assessment of habitat quality in our study faced limitations due to the unavailability of regional data. We relied on expert knowledge to base the model. Nonetheless, our study introduces a methodological approach to the São Paulo area, which, according to our research findings, has not been previously applied in other studies.
We acknowledge that findings from a more extensive and diverse sample of producers in São Paulo could offer a more comprehensive perspective on identifiable ES. Regarding the questionnaire, we emphasise that the responsive and semi-structured methods yielded results that provide a broad overview of respondents’ perspectives on UA. However, a more structured and systematic approach, specifically focused on ES, would offer more generalisable results. We also underscore that synergies between the services were not evaluated, besides the exploration of potential ecosystem disservices associated with the activity. Understanding these gaps can facilitate planners and decision-makers in promoting UA as a NbS.

5. Conclusions

In summary, this study employed a mixed-methods approach to present an innovative assessment of ES associated with UA in the city of São Paulo. It demonstrated that the LULC observed in São Paulo affects its habitat quality, highlighting the importance of specific LULC types in supporting ES. Moreover, it identified different ES provided by UA from the perspective of urban users, including educational benefits, social engagement, and environmental enhancements. The results not only have the potential to enhance local comprehension of this subject but also offer insights for addressing urban challenges. This information proves particularly pertinent in crafting policies aimed at tackling socio-economic and environmental issues through NbS.
The findings suggest that across various geomorphic land-use types, we had distinct habitat quality in the megacity of São Paulo, suggesting the need for tailored land management strategies based on geographical and environmental factors to enhance regional habitat quality. This requires ecological planning and biodiversity protection efforts, with strong involvement of the sub-municipalities in planning their territories.
While food supply is advantageous, it may not be the primary motivator for establishing UA places in the city; instead, education emerges as a prominent activity. Additionally, quantifying environmental benefits might pose challenges, yet these gardens exhibit significant outcomes, making them a viable basis for environmental policy initiatives accessible to diverse social classes and locations, even in a city of São Paulo’s magnitude.
We underline that, while UA is not a panacea for all socio-economic and environmental concerns, cities can implement planned strategies to foster agricultural development in specific areas. Employing sustainable practices tailored to the location and for differentiated purposes can contribute to bolstering resilience and delivering ES. Nevertheless, it is imperative to perceive UA as a complex socio-ecological system, wherein concerns of community development, equitable opportunities, and local resilience are intricately interconnected.
Despite inherent limitations in the study, the approach to evaluating ES dynamics underscores how a comprehensive and integrated understanding can serve as a guiding framework for future urban planning policies, facilitating the seamless integration of UA into the construction of more resilient, sustainable, and equitable cities.

Author Contributions

L.V.B.: Conceptualisation; Administration; Data curation; Formal analysis; Writing—original draft and review; and Writing—review and editing. S.R.: Formal analysis; Investigation; Validation; Visualisation; Writing—original draft; and Writing—review and editing. M.L.F.: Validation; Visualisation; Writing—original draft; and Writing—review and editing. F.L.d.O.: Methodology; Project; Supervision; Validation; Visualisation; Writing—original draft; and Writing—review and editing. All authors have read and agreed to the published version of the manuscript.

Funding

The National Council for Scientific and Technological Development (CNPq) for the grant to M.L.F. under project 307185/2023-0. L.V.B; Fundação Coordenação de Aperfeiçoamento de Pessoal de Nível Superior (CAPES) for the scholarship in international mobility.

Institutional Review Board Statement

The study was conducted in accordance with the Declaration of Helsinki and approved by the Ethics Committee of the Instituto de Biociências da Universidade de São Paulo (CAAE 57511622.0.0000.5464, 6 October 2022).

Informed Consent Statement

Informed consent was obtained from all subjects involved in the study.

Data Availability Statement

The original contributions presented in the study are included in the article, further inquiries can be directed to the corresponding author.

Conflicts of Interest

The authors declare no conflicts of interest.

References

  1. Faivre, N.; Fritz, M.; Freitas, T.; Boissezon, B.; Wandewoestijne, S. Nature-Based Solutions in the EU: Innovating with nature to address social, economic and environmental challenges. Environ. Res. 2017, 159, 509–518. [Google Scholar] [CrossRef] [PubMed]
  2. Almenar, J.B.; Elliot, T.; Rugani, B.; Philippe, B.; Gutierrez, T.N.; Sonnemann, G.; Geneletti, D. Nexus between nature-based solutions, ecosystem services and urban challenges. Land Use Policy 2021, 100, 104898. [Google Scholar] [CrossRef]
  3. Larcher, F.; Baldacchini, C.; Ferracini, C.; Vercelli, M.; Ristorini, M.; Battisti, L.; Calfapietra, C. Nature-based Solutions as tools for monitoring the abiotic and biotic factors in urban ecosystems. Urban Serv. Ecosyst. Future City 2021, 17, 131–150. [Google Scholar]
  4. Kingsley, J.; Egerer, M.; Nuttman, S.; Keniger, L.; Pettitt, P.; Frantzeskaki, N.; Gray, T.; Ossola, A.; Lin, B.; Bailey, A.; et al. Urban agriculture as a nature-based solution to address socio-ecological challenges in Australian cities. Urban For. Urban Green. 2021, 60, 127059. [Google Scholar] [CrossRef]
  5. Frantzeskaki, N. Seven lessons for planning nature-based solutions in cities. Environ. Sci. Policy 2019, 93, 101–111. [Google Scholar] [CrossRef]
  6. Eigenbrod, C.; Gruda, N. Urban vegetable for food security in cities. A review. Agron. Sustain. Dev. 2015, 35, 483–498. [Google Scholar] [CrossRef]
  7. Ferreira, L.M.; Souza, L.C.; Conti, D.M.; Quaresma, C.C.; Tavares, A.R.; Silva, K.G.; Kniess, C.T.; Camargo, P.B. Soil biodiversity in urban forests as a consequence of litterfall management: Implications for São Paulo’s ecosystem services. Sustainability 2018, 10, 684. [Google Scholar] [CrossRef]
  8. Ramon, M.; Lafortezza, R.; Ribeiro, A.P.; Camargo, P.B.; Domingos, M.; Gomes, E.P.C.; Tavares, A.R.; Dias, A.G.; Kniess, C.T.; Ferreira, M.L. Carbon and nitrogen stock in soils of subtropical urban forests: Isotopic δ13C and δ15N indicators for nature-based solutions in a megacity. Ecol. Indic. 2024, 160, 111743. [Google Scholar] [CrossRef]
  9. Doshi, M.; Mitchell, M.; Shanahan, D.; Wilson, K.; Ives, C.; Lovelock, C.; Rhodes, J. The role of socio-economic factors in planning and managing urban ecosystem services. Ecosyst. Serv. 2018, 31, 102–110. [Google Scholar] [CrossRef]
  10. Ouyang, X.; Luo, X. Models for Assessing Urban Ecosystem Services: Status and Outlooks. Sustainability 2022, 14, 4725. [Google Scholar] [CrossRef]
  11. Dennis, M.; James, P. Urban Social-ecological Innovation: Implications for Adaptive Natural Resource Management. Ecol. Econ. 2018, 150, 153–164. [Google Scholar] [CrossRef]
  12. Sharp, R.; Tallis, H.T.; Ricketts, T.; Guerry, A.D.; Wood, S.A.; Chapler-Kramer, R.; Nelson, E.; Ennaanay, D.; Wolny, S.; Olwero, N.; et al. InVEST 3.6.0 User’s Guide; Collaborative Publication by the Natural Capital Project, Stanford University, The University of Minnesota, The Nature Conservancy, and the World Wildlife Fund; Stanford University: Stanford, CA, USA, 2018; Available online: https://naturalcapitalproject.stanford.edu/software/invest (accessed on 3 October 2023).
  13. Niquisse, S.; Cabral, P. Assessment of changes in ecosystem service monetary values in Mozambique. Environ. Dev. 2018, 25, 12–22. [Google Scholar] [CrossRef]
  14. Czúcz, B.; Ildiko, A.; Miklos, K.; Ferenc, H.; Andras, B.; Andras, Z.; Reka, A. The relevance of habitat quality for biodiversity and ecosystem service policies. In Proceedings of the International Workshop on Remote Sensing and GIS for Monitoring of Habitat Quality, Vienna, Austria, 24–25 September 2014. [Google Scholar]
  15. Duarte, D.H.S.; Giulio, G.D.; Humberto, R. Oportunidades e Desafios da Urbanização para Adaptação Climática na Megacidade de São Paulo, Brasil; XV Encontro Nacional de Conforto no Ambiente Construído: João Pessoa, Brazil, 2019. [Google Scholar]
  16. UN-HABITAT—United Nations Human Settlement Programme. Annual Report 2022; UN-HABITAT: Nairobi, Kenya, 2022. [Google Scholar]
  17. IBGE, Instituto Brasileiro de Geografia e Estatística. São Paulo. 2023. Available online: https://cidades.ibge.gov.br/brasil/sp/sao-paulo/panorama (accessed on 16 November 2023).
  18. Amato-Lourenço, L.F.; Buralli, R.; Reis Ranieri, G.; Hearn, A.; Williams, C.; Mauad, T. Building knowledge in urban agriculture: The challenges of local food production in São Paulo and Melbourne. Environ. Dev. Sustain. 2021, 23, 2785–2796. [Google Scholar] [CrossRef]
  19. Giacchè, G.; Porto, L. Políticas públicas de agricultura urbana e periurbana: Uma comparação entre os casos de São Paulo e Campinas. Inf. Econ. 2015, 45, 45–60. [Google Scholar]
  20. Valdiones, A.P. Panorama da Agricultura Urbana e Periurbana no Município de São Paulo. Master’s Thesis, Social Change and Political Participation Graduate Program. University of São Paulo, São Paulo, Brazil, 2013. [Google Scholar]
  21. SVMA (Secretaria do Verde e Meio Ambiente de São Paulo). 2023. Biosampa 2022. São Paulo: Brazil. Available online: https://capital.sp.gov.br/web/meio_ambiente/w/noticias/362493 (accessed on 20 June 2024).
  22. Martins, A.P.G.; Ribeiro, A.P.; Ferreira, M.L.; Martins, M.A.C.; Negri, E.M.; Scapin, M.A.; Oliveira, A.; Saiki, M.; Saldiva, P.H.N.; Lafortezza, R. Infraestrutura verde para monitorar e minimizar os impactos da poluição atmosférica. Estud. Av. 2021, 35, 31–57. [Google Scholar] [CrossRef]
  23. Ribeiro, A.P.; Bolmann, H.; Oliveira, A.; Rakauskas, F.; Cortese, T.; Costa Rodrigues, M.S.; Quaresma, C.; Ferreira, M.L. The role of tree landscape to reduce effects of urban heat islands: A study in two Brazilian cities. Trees 2021, 37, 17–30. [Google Scholar] [CrossRef]
  24. Ramon, M.; Ribeiro, A.; Sawamura Theophilo, C.; Moreira, E.; Camargo, P.; Pereira, C.; Saraiva, E.; Tavares, A.; Dias, A.; Nowak, D.; et al. Assessment of four urban forest as environmental indicator of air quality: A study in a Brazilian megacity. Urban Ecosyst. 2023, 26, 197–207. [Google Scholar] [CrossRef]
  25. UNDP—United Nations Development Programme. Human Development Atlas in the Brazilian Metropolitan Regions; UNDP: Brasilia, Brazil, 2014. [Google Scholar]
  26. Hearn, A.H.; Mauad, T.; Williams, C.; Fernando, L.; Amato-Lourenco, L.; Ranieri, R. Digging up the past: Urban agriculture narratives in Melbourne and São Paulo. J. Urban Int. Res. Placemaking Urban Sustain. 2020, 14, 309–336. [Google Scholar] [CrossRef]
  27. Caldas, E.L.; Jayo, M. Agriculturas urbanas em São Paulo: Histórico e tipologia. Confins 2019, 39. [Google Scholar] [CrossRef]
  28. Salata, S.; Ronchi, S.; Arcidiacono, A.; Ghirardelli, F. Mapping habitat quality in the Lombardy region, Italy. One Ecosyst. 2017, 2, 11402. [Google Scholar] [CrossRef]
  29. Burkhard, B.; Kroll, F.; Nedkov, S.; Muller, F. Mapping ecosystem service supply, demand and budgets. Ecol. Indic. 2012, 21, 17–29. [Google Scholar] [CrossRef]
  30. Duarte, G.T.; Ribeiro, M.C.; Paglia, A.P. Ecosystem Services Modeling as a Tool for Defining Priority Areas for Conservation. PLoS ONE 2016, 11, e0154573. [Google Scholar] [CrossRef] [PubMed]
  31. Zanaga, D.; Van De Kerchove, R.; Daems, D.; De Keersmaecker, W.; Brockmann, C.; Kirches, G.; Wevers, J.; Cartus, O. ESA WorldCover 10 m 2021 v200. 2022. Available online: https://pure.iiasa.ac.at/id/eprint/18478/ (accessed on 8 December 2023). [CrossRef]
  32. GEOFABRIK. OpenStreetMap Data Extracts. 2022. Available online: https://download.geofabrik.de/ (accessed on 8 December 2023).
  33. SAMPA+RURAL. Sampa mais Rural. São Paulo City Hall. 2022. Available online: https://sampamaisrural.prefeitura.sp.gov.br/ (accessed on 30 May 2022).
  34. European Commission. Mapping and Assessment of Ecosystems and Their Services—An Analytical Framework for Ecosystem Assessments under Action 5 of the EU Biodiversity Strategy to 2020; European Commission: Brussels, Belgium, 2013. [Google Scholar]
  35. Tabachnick, B.G.; Fidell, L.S. Using Multivariate Statistics, 7th ed.; Pearson: London, UK, 2019. [Google Scholar]
  36. Bratman, G.N.; Anderson, C.B.; Berman, M.G.; Cochran, B.; Vries, S.; Flanders, J.; Folke, C.; Frumkin, H.; Gross, J.J.; Hartig, T.; et al. Nature and mental health: An ecosystem service perspective. Sci. Adv. 2019, 5, 903. [Google Scholar] [CrossRef] [PubMed]
  37. Wang, S.; Liang, X.; Wang, J. Parameter assignment for InVEST habitat quality module based on principal component analysis and grey coefficient analysis. Math. Biosci. Eng. 2022, 21, 13928–13948. [Google Scholar] [CrossRef] [PubMed]
  38. Aneseyee, A.B.; Noszczyk, T.; Soromessa, T.; Elias, E. The InVEST Habitat Quality Model Associated with Land Use/Cover Changes: A Qualitative Case Study of the Winike Watershed in the Omo-Gibe Basin, Southwest Ethiopia. Remote Sens. 2020, 12, 1103. [Google Scholar] [CrossRef]
  39. Xiao, P.; Zhou, Y.; Li, M.; Xu, J. Spatiotemporal patterns of habitat quality and its topographic gradient effects of Hubei Province based on the InVEST model. Environ. Dev. Sustain. 2022, 25, 6419–6448. [Google Scholar] [CrossRef]
  40. Nagib, G. The political space of urban agriculture as activism in São Paulo and Paris. L’Espace Polit. 2020, 40. [Google Scholar]
  41. Bai, L.; Xiu, C.; Feng, X.; Liu, D. Influence of urbanization on regional habitat quality: A case study of Changchun City. Habitat Int. 2019, 93, 102042. [Google Scholar] [CrossRef]
  42. Evans, D.L.; Falagan, N.; Hardman, C.A.; Kourmpetli, S.; Liu, L.; Mead, B.; Davies, J. Ecosystem service delivery by urban agriculture and green infrastructure—A systematic review. Ecosyst. Serv. 2022, 54, 101405. [Google Scholar] [CrossRef]
  43. Haase, D.; Larondelle, N.; Andersson, E.; Artmann, M.; Borgstrom, S.; Breuste, J.; Gomez-Baggethun, E.; Gren, A.; Hamstead, Z.; Hansen, R.; et al. A Quantitative Review of Urban Ecosystem Service Assessments: Concepts, Models, and Implementation. Ambio 2014, 43, 413–433. [Google Scholar] [CrossRef]
  44. Meerow, S.; Newell, J.P. Spatial planning for multifunctional green infrastructure: Growing resilience in Detroit. Landsc. Urban Plan. 2017, 159, 62–75. [Google Scholar] [CrossRef]
  45. Camps-Calvet, M.; Langemeyer, J.; Calvet-Mir, L.; Gomez-Baggethun, E. Assessment and valuation of ecosystem services provided by urban gardens: Insights for policy and planning. Environ. Sci. Policy 2016, 62, 14–23. [Google Scholar] [CrossRef]
  46. Schwarz, N.; Moretti, M.; Bugalho, M.; Davies, Z.; Haase, D.; Hack, J.; Hof, A.; Melero, Y.; Pett, T.; Knapp, S. Understanding biodiversity-ecosystem service relationships in urban areas: A comprehensive literature review. Ecosyst. Serv. 2017, 27 Pt A, 161–171. [Google Scholar] [CrossRef]
  47. Sanyé-Mengual, E.; Specht, K.; Vavra, J.; Artmann, M.; Orsini, F.; Gianquinto, G. Ecosystem Services of Urban Agriculture: Perceptions of Project Leaders, Stakeholders and the General Public. Sustainability 2020, 12, 10446. [Google Scholar] [CrossRef]
  48. Arcas-Pilz, V.; Gabarrell Durany, X.; Orsini, F.; Villalba, G. Literature review on the potential of urban waste for the fertilization of urban agriculture: A closer look at the metropolitan area of Barcelona. Sci. Total Environ. 2023, 905, 167193. [Google Scholar] [CrossRef] [PubMed]
  49. Ercilla-Montserrat, M.; Sanjuan-Delmas, D.; Sanye-Mengual, E.; Calvet-Mir, L.; Banderas, K.; Rieradevall, J.; Gabarrell Durany, X. Analysis of the consumer’s perception of urban food products from a soilless system in rooftop greenhouses: A case study from the Mediterranean Area of Barcelona (Spain). Agric. Hum. Values 2019, 36, 375–393. [Google Scholar] [CrossRef]
  50. Sanyé-Mengual, E.; Martinez-Blanco, J.; Finkbeiner, M.; Cerda-Domenech, M.; Camargo, M.; Ometto, A.; VelaSquez, L.; Villada, G.; Niza, S.; Pina, A. Urban horticulture in retail parks: Environmental assessment of the potential implementation of rooftop greenhouses in European and South American cities. J. Clean. Prod. 2018, 172, 3081–3091. [Google Scholar] [CrossRef]
  51. Canet-Martí, A.; Pineda-Martos, R.; Junge, R.; Bohn, K.; Paco, T.; Delgado, C.; Alencikiene, G.; Skar, S.V.; Baganz, G. Nature-Based Solutions for Agriculture in Circular Cities: Challenges, Gaps, and Opportunities. Water 2021, 13, 2565. [Google Scholar] [CrossRef]
  52. Diekmann, L.O.; Gray, L.C.; Baker, G.A. Growing ‘good food’: Urban gardens, culturally acceptable produce and food security. Renew. Agric. Food Syst. 2020, 35, 169–181. [Google Scholar] [CrossRef]
  53. Giovannucci, D. Evaluation of Organic Agriculture and Poverty Reduction in Asia; International Fund for Agricultural Development (IFAD): Rome, Italy, 2006. [Google Scholar]
  54. Breuste, J.; Artmann, M. Allotment gardens contribute to urban ecosystem service: Case study Salzburg, Austria. J. Urban Plann. Dev. 2014, 141, A5014005. [Google Scholar] [CrossRef]
  55. Keshavarz, N.; Simon, B.; Zilans, A.; Hursthouse, A.; Voigt, A.; Hobbelink, A.; Zammit, A.; Jokinen, A.; Mikkelsen, B.; Notteboom, B.; et al. A history of urban gardens in Europe. In Urban Allotment Gardens in Europe; Routledge: London, UK, 2016; pp. 8–32. [Google Scholar]
  56. Schroter, M.; Kramer, R.; Mantel, M.; Kabisch, N.; Hecker, S.; Richter, A.; Neumeier, V.A.; Bonn, A. Citizen science for assessing ecosystem services: Status, challenges, and opportunities. Ecosyst. Serv. 2017, 28, 80–94. [Google Scholar] [CrossRef]
  57. Grafius, D.R.; Edmondson, J.; Norton, B.; Clark, R.; Mears, M.; Leake, J.; Corstanje, R.; Harris, J.; Warren, P. Estimating food production in an urban landscape. Sci. Rep. 2020, 10, 5141. [Google Scholar] [CrossRef] [PubMed]
  58. Pradhan, P.; Callaghan, M.; Hu, Y.; Dahal, Y.; Hunecke, C.; Reusswig, F.; Lotze-Campen, H.; Kropp, J. A systematic review highlights that there are multiple benefits of urban agriculture besides food. Glob. Food Secur. 2023, 38, 100700. [Google Scholar] [CrossRef]
  59. De Bon, H.; Parrot, L.; Moustier, P. Sustainable urban agriculture in developing countries. A review. Agron. Sustain. Dev. 2010, 30, 21–32. [Google Scholar] [CrossRef]
  60. Krikser, T.; Piorr, A.; Berges, R.; Opitz, I. Urban agriculture oriented towards self-supply, social and commercial purpose: A typology. Land 2016, 5, 28. [Google Scholar] [CrossRef]
  61. Mougeot, L.J.A. Agropolis: The Social, Political and Environmental Dimensions of Urban Agriculture; Routledge: London, UK, 2005. [Google Scholar]
  62. Abdoellah, O.S.; Suparman, Y.; Safitri, K.; Basagevan, R.; Fianti, N.; Wulandari, I.; Husodo, T. Between food fulfillment and income: Can urban agriculture contribute to both? Geogr. Sustain. 2023, 4, 127–137. [Google Scholar] [CrossRef]
  63. Dimitri, C.; Oberholtzer, L.; Pressman, A. Urban agriculture: Connecting producers with consumers. Br. Food J. 2016, 118, 603–617. [Google Scholar] [CrossRef]
  64. McClintock, N. Radical, reformist, and garden-variety neoliberal: Coming to terms with urban agriculture’s contradictions. Local Environ. 2014, 19, 147–171. [Google Scholar] [CrossRef]
  65. Giacchè, G.; Consales, J.N.; Baptiste Jean-Paul, G.; Daniel, A.C.; Chenu, C. Toward an Evaluation of Cultural Ecosystem Services Delivered by Urban Micro-Farms. Sustainability 2021, 13, 1716. [Google Scholar] [CrossRef]
  66. Biazoti, A.R.; Leao, V.; Buralli, R.; Mauad, T. Agricultura urbana no município de São Paulo: Considerações sobre produção e comercialização. Estud. Av. 2021, 35, 101. [Google Scholar] [CrossRef]
  67. Orsini, F.; Kahane, R.; Nono-Womdim, R.; Gianquinto, G. Urban agriculture in the developing world: A review. Agron. Sustain. Dev. 2013, 33, 695–720. [Google Scholar] [CrossRef]
  68. Van Veenhuizen, R. Cities farming for the future. In Urban Agriculture for Sustainable Cities; RUAF Foundation, IDRC and IIRR: Leusden, The Netherlands, 2016. [Google Scholar]
  69. Olivier, D.W.; Heinecken, L. Beyond food security: Women’s experiences of urban agriculture in Cape Town. Agric. Hum. Values 2017, 34, 743–755. [Google Scholar] [CrossRef]
  70. Hovorka, A.; Zeeuw, H.; Njenga, M. Women Feeding Cities: Mainstreaming Gender in Urban Agriculture and Food Security; CTA/Practical Action: Wageningen, The Netherlands, 2009. [Google Scholar]
  71. Nabulo, G.; Kiguli, J.; Kiguli, L. Gender analysis of urban agriculture in Kampala, Uganda. Urban Agric. Mag. 2004, 12, 32–33. [Google Scholar]
  72. Jancz, C.; Rosana, M.; Marques, G.; Nobre, M.; Moreno, R.; Saori, S.; Franco, V. Práticas Feministas de Transformação da Economia. Autonomia das Mulheres e Agroecologia no Vale do Ribeira. Sempreviva Organ. Fem. 2018, 84. [Google Scholar]
  73. Castellar, A.C.; Popartan, L.; Puyeo-Ros, J.; Atanasova, N.; Langergraber, G.; Saumel, I.; Corominas, L.; Comas, J.; Acuna, V. Nature-based solutions in the urban context: Terminology, classification and scoring for urban challenges and ecosystem services. Sci. Total Environ. 2021, 779, 146237. [Google Scholar] [CrossRef] [PubMed]
  74. Skar, S.L.G.; Pineda-Martos, R.; Timpe, A.; Polling, B.; Bohn, K.; Kulvik, M.; Delgado, C.; Pedras, C.M.G.; Paco, T.; Cujic, M.; et al. Urban agriculture as a keystone contribution towards securing sustainable and healthy development for cities in the future. Blue-Green Syst. 2019, 2, 1–27. [Google Scholar] [CrossRef]
  75. Ryschawy, J.; Tiffany, S.; Gaudin, A.; Niles, M.; Garrett, M. Moving niche agroecological initiatives to the mainstream: A case-study of sheep-vineyard integration in California. Land Use Policy 2021, 109, 105680. [Google Scholar] [CrossRef]
Figure 1. Study area.
Sustainability 16 07388 g001
Figure 2. Flowchart for selecting locations to be included in the work.
Sustainability 16 07388 g002
Figure 3. Results of land use and land cover class in the city of São Paulo.
Sustainability 16 07388 g003
Figure 4. Results of habitat quality and habitat degradation in the city of São Paulo.
Sustainability 16 07388 g004
Figure 5. Distribution of urban gardens within the municipality and their corresponding linked ecosystem services.
Sustainability 16 07388 g005
Figure 6. Identified ecosystem services.
Sustainability 16 07388 g006
Table 1. Land use land cover (LULC) class names and descriptions found in São Paulo city.
LULC Class NameDescription
Tree coverAny geographic area dominated by trees with a cover of 10% or more. Areas planted with trees for afforestation purposes and plantations are included in this class. This class also includes tree-covered areas seasonally or permanently flooded with fresh water, except for mangroves.
SchrublandAny geographic area dominated by natural shrubs having a cover of 10% or more. Trees can be present in scattered form if their cover is less than 10%. Herbaceous
plants can also be present at any density.
GrasslandAny geographic area dominated by natural herbaceous plants (plants without persistent stems or shoots above ground and lacking definite firm structure): (grasslands, prairies, steppes, savannahs, pastures) with a cover of 10% or more, irrespective of different human and/or animal activities.
CroplandLand covered with annual cropland that is sowed/planted and harvestable at least once within 12 months after the sowing/planting date.
Built-upLand covered by buildings, roads, and other artificial structures, such as railroads. Buildings include both residential and industrial buildings. Waste dump deposits and extraction sites are considered bare.
Bare-sparse vegetationLands with exposed soil, sand, or rocks that never have more than 10% vegetated cover during any time of the year.
Permanent water bodiesThis includes any geographic area covered for most of the year (more than 9 months) by water bodies such as lakes, reservoirs, and rivers.
Herbaceous wetlandNatural herbaceous vegetation (cover of 10% or more) that is permanently or regularly flooded by fresh, brackish, or salt water. It excludes unvegetated sediment, swamp forests (classified as tree cover), and mangroves.
MangrovesSalt-tolerant tree and other plant species, which thrive in intertidal zones of sheltered tropical shores, “overwash” islands, and estuaries.
Moss and lichenLand covered with lichens and/or mosses.
MotorwayA restricted access major divided highway, normally with two or more running lanes plus emergency hard shoulder. Equivalent to the freeway, autobahn, etc.
Motorway linkThe link roads (slip roads/ramps) leading to/from a motorway from/to a motorway or lower-class highway. Normally with the same motorway restrictions.
PrimaryThe next most important road in a country’s system (often link larger towns).
SecondaryThe next most important road in a country’s system (often link towns).
Secondary linkThe link roads (slip roads/ramps) leading to/from a secondary road from/to a secondary road or lower-class highway.
Primary linkThe link roads (slip roads/ramps) leading to/from a primary road from/to a primary road or lower-class highway.
Data are used for mapping and as input in the model. Data on tree cover, shrubland, grassland, cropland, built-up, bare-sparse vegetation, permanent water bodies, herbaceous wetland, mangroves, and moss and lichen were collected from ESA; data on roads were collected from Geofabrik.
Table 2. Threat types, their weight, decay, and maximum impact distance.
ThreatWeightM_DistanceDecay
Built-up0.80.5exponential
Motorway10.9exponential
Primary0.90.8exponential
Secondary0.90.7exponential
Table 3. Land use/cover types and their sensitivity to the threats.
No.LULCHABITATBui ¹Mot 2Pri 3Sec 4
0No data00000
1Motorway0.10000
2Motorway link0.10000
3Primary0.150000
4Secondary0.30000
5Secondary link0.30000
6Primary link0.20000
10Tree cover0.850.850.850.850.85
20Shrubland0.70.70.70.70.7
30Grassland0.50.50.50.50.5
40Cropland0.60.60.60.60.6
50Built-up0.250000
60Bare-sparse vegetation0.750.750.750.750.75
80Permanent water bodies0.90.80.80.80.4
90Herbaceous wetland11111
95Mangroves0.950.950.950.950.95
1 Built-up (bui); 2 Motorway (mot); 3 Primary (pri); 4 Secondary (sec).
Table 4. Semi-structured questionnaire.
#QuestionOptionsType
1The initiative is part of a cooperative or
association.
  • Totally agree
  • Agree
  • Indifferent
  • Disagree
  • Totally disagree
  • No answer
Likert Scale
2The land where I work is of public origin.
  • Totally agree
  • Agree
  • Indifferent
  • Disagree
  • Totally disagree
  • No answer
Likert Scale
3The initiative receives/received some financial resources from the municipal, state, or federal spheres.
  • Totally agree
  • Agree
  • Indifferent
  • Disagree
  • Totally disagree
  • No answer
Likert Scale
4The initiative receives/received some financial resources from the private sector or a non-governmental organization.
  • Totally agree
  • Agree
  • Indifferent
  • Disagree
  • Totally disagree
  • No answer
Likert Scale
5The place where I work has an organic
production certification.
  • Totally agree
  • Agree
  • Indifferent
  • Disagree
  • Totally disagree
  • No answer
Likert Scale
6In the system where I work, fertilisers or
chemical pesticides are used in crops.
  • Totally agree
  • Agree
  • Indifferent
  • Disagree
  • Totally disagree
  • No answer
Likert Scale
7In the system where I work, there are projects focused on social, food, or environmental education themes.
  • Totally agree
  • Agree
  • Indifferent
  • Disagree
  • Totally disagree
  • No answer
Likert Scale
8In the environment where I work, there is a financial return on the activity.
  • Totally agree
  • Agree
  • Indifferent
  • Disagree
  • Totally disagree
  • No answer
Likert Scale
9A fair is held to sell production on site or
external fairs are participated in.
  • Totally agree
  • Agree
  • Indifferent
  • Disagree
  • Totally disagree
  • No answer
Likert Scale
10In the environment where I work, composting is carried out on site.
  • Totally agree
  • Agree
  • Indifferent
  • Disagree
  • Totally disagree
  • No answer
Likert Scale
11How many families does production attend in total (absolute number)? Text
12What is the estimated number of women in the activity (%)? Text
13What is the area destined for the crops (m2)? Text
14What is planted, and how much is produced on average (kg) per year of each item? Text
15If there are commercial establishments that
buy products, where are they from?
Text
16If there are animals in the places, what are they? Text
17What are the main challenges faced for the
success of the initiative?
Text
Table 5. Description of ecosystem services based on the CICES approach and codes generated to categorise responses in the questionnaire into ecosystem services.
CICES ApproachPresent Work
SectionDivisionGroupClassCodes
ProvisioningNutritionBiomassCultivated cropsFood supply
Reared animals and their outputs
Wild plants, algae, and their outputsFood supply
Wild animals and their outputs
Animals from in-situ aquacultureFood supply
WaterSurface water for drinking
Groundwater for drinking
MaterialsBiomassFibres and other materials from plants, algae, and animals for direct processing
Materials from plants, algae, and animals for agricultural use
Genetic materials from all biota
WaterSurface water for non-drinking purposes
Ground water for non-drinking purposes
EnergyBiomass-based energy sourcesPlant-based resources
Animal-based resources
Mechanical energyAnimal-based energy
Regulation and MaintenanceMediation of
waste, toxic and
other nuisances
Mediation by biotaBioremediation by microorganisms, algae, plants, and animalsComposting
Filtration/sequestration/storage/accumulation by microorganisms, algae, plants, and animals
Mediation by ecosystemsDilution by atmosphere, freshwater, and marine ecosystems
Mediation of smell/noise/visual impacts
Mediation of flowsMass flowsMass stabilisation and control of erosion rates
Buffering and attenuation of mass flows
Liquid flowsHydrological cycle and water flow maintenance
Flood protection
Gaseous/air flowsStorm protection
Ventilation and transpiration
Maintenance of
physical,
chemical,
biological
conditions
Lifecycle
maintenance,
habitat and gene
pool protection
Pollination and seed dispersalBees
Maintaining nursery populations and habitatsWild life
Pest and disease
control
Pest control
Disease control
Soil formation
and
composition
Weathering processesOrganic
Decomposition and fixing processes
Water conditions
Atmospheric
composition
and climate
regulation
Chemical condition of freshwater
Chemical condition of salt waters
Global climate regulation by reducing greenhouse gas concentrations
Micro- and regional climate regulation
CulturalPhysical and
intellectual interactions
with biota,
ecosystems, and
land-/seascapes
Physical and
Experiential interactions
Experiential use of plants, animals, and land/seascapes in different environmental settings
Physical use of land/seascapes in different environmental settingsLeisure; social
Intellectual and
representative
interactions
Scientific
EducationalEducation
Heritage, cultural
Entertainment
Aesthetic
Spiritual,
symbolic and
other
interactions
with biota,
ecosystems, and
land-/seascapes
Spiritual and/or
emblematic
Symbolic
Sacred and/or religious
Other cultural
outputs
ExistenceWell-being
Bequest
Table 6. Area of each land use and land cover (LULC) class within the city of São Paulo, Brazil.
LULC NameArea (ha)%
No data92.610.01%
Motorway1626.050.27%
Motorway link439.700.07%
Primary1993.110.33%
Secondary3489.330.58%
Secondary link89.480.01%
Primary link115.580.01%
Tree cover318,843.653.4%
Shrubland0.440.004%
Grassland48,490.38.12%
Cropland2212.200.37%
Built-up158,597.226.55%
Bare-sparse vegetation3455.060.57%
Permanent water bodies50,479.38.45%
Herbaceous wetland1093.820.18%
Mangroves6142.481.02%
Table 7. Results of questions based on the Likert scale.
QuestionTotally DisagreeDisagreeIndifferentAgreeTotally AgreeNot Answer
Count%Count%Count%Count%Count%Count%
Format of a cooperative/association.2244.890024.0836.121938.7736.12
Land of public origin.3163.2636.1212.0412.041020.436.12
Financial
resources from the municipal, state, or federal
spheres.
3062.2236.1224.0836.12714.2848.16
Financial
resources from the private sector or from a non-governmental
organisation.
3062.2236.1224.0836.12714.2848.16
Presence of organic production certification.3673.460012.0424.081020.400
Use of fertilisers or chemical pesticides.4285.7112.04000048.1624.08
Presence of social, food, or environmental education projects.510.224.0824.0824.083877.5500
Presence of financial return.2857.1448.1648.1624.081020.412.04
Commercialisation of the food.3061.2212.04510.212.041224.4800
Presence of composting.612.2424.0812.04004081.6300
Disclaimer/Publisher’s Note: The statements, opinions and data contained in all publications are solely those of the individual author(s) and contributor(s) and not of MDPI and/or the editor(s). MDPI and/or the editor(s) disclaim responsibility for any injury to people or property resulting from any ideas, methods, instructions or products referred to in the content.

