
Research on Nondestructive Testing Technology for Drilling Risers Based on Magnetic Memory and Deep Learning
Abstract
:1. Introduction
2. Related Work
2.1. Existing Nondestructive Testing Devices for Risers
2.2. Research on Intelligent Identification of Pipeline Defects
3. Materials and Methods
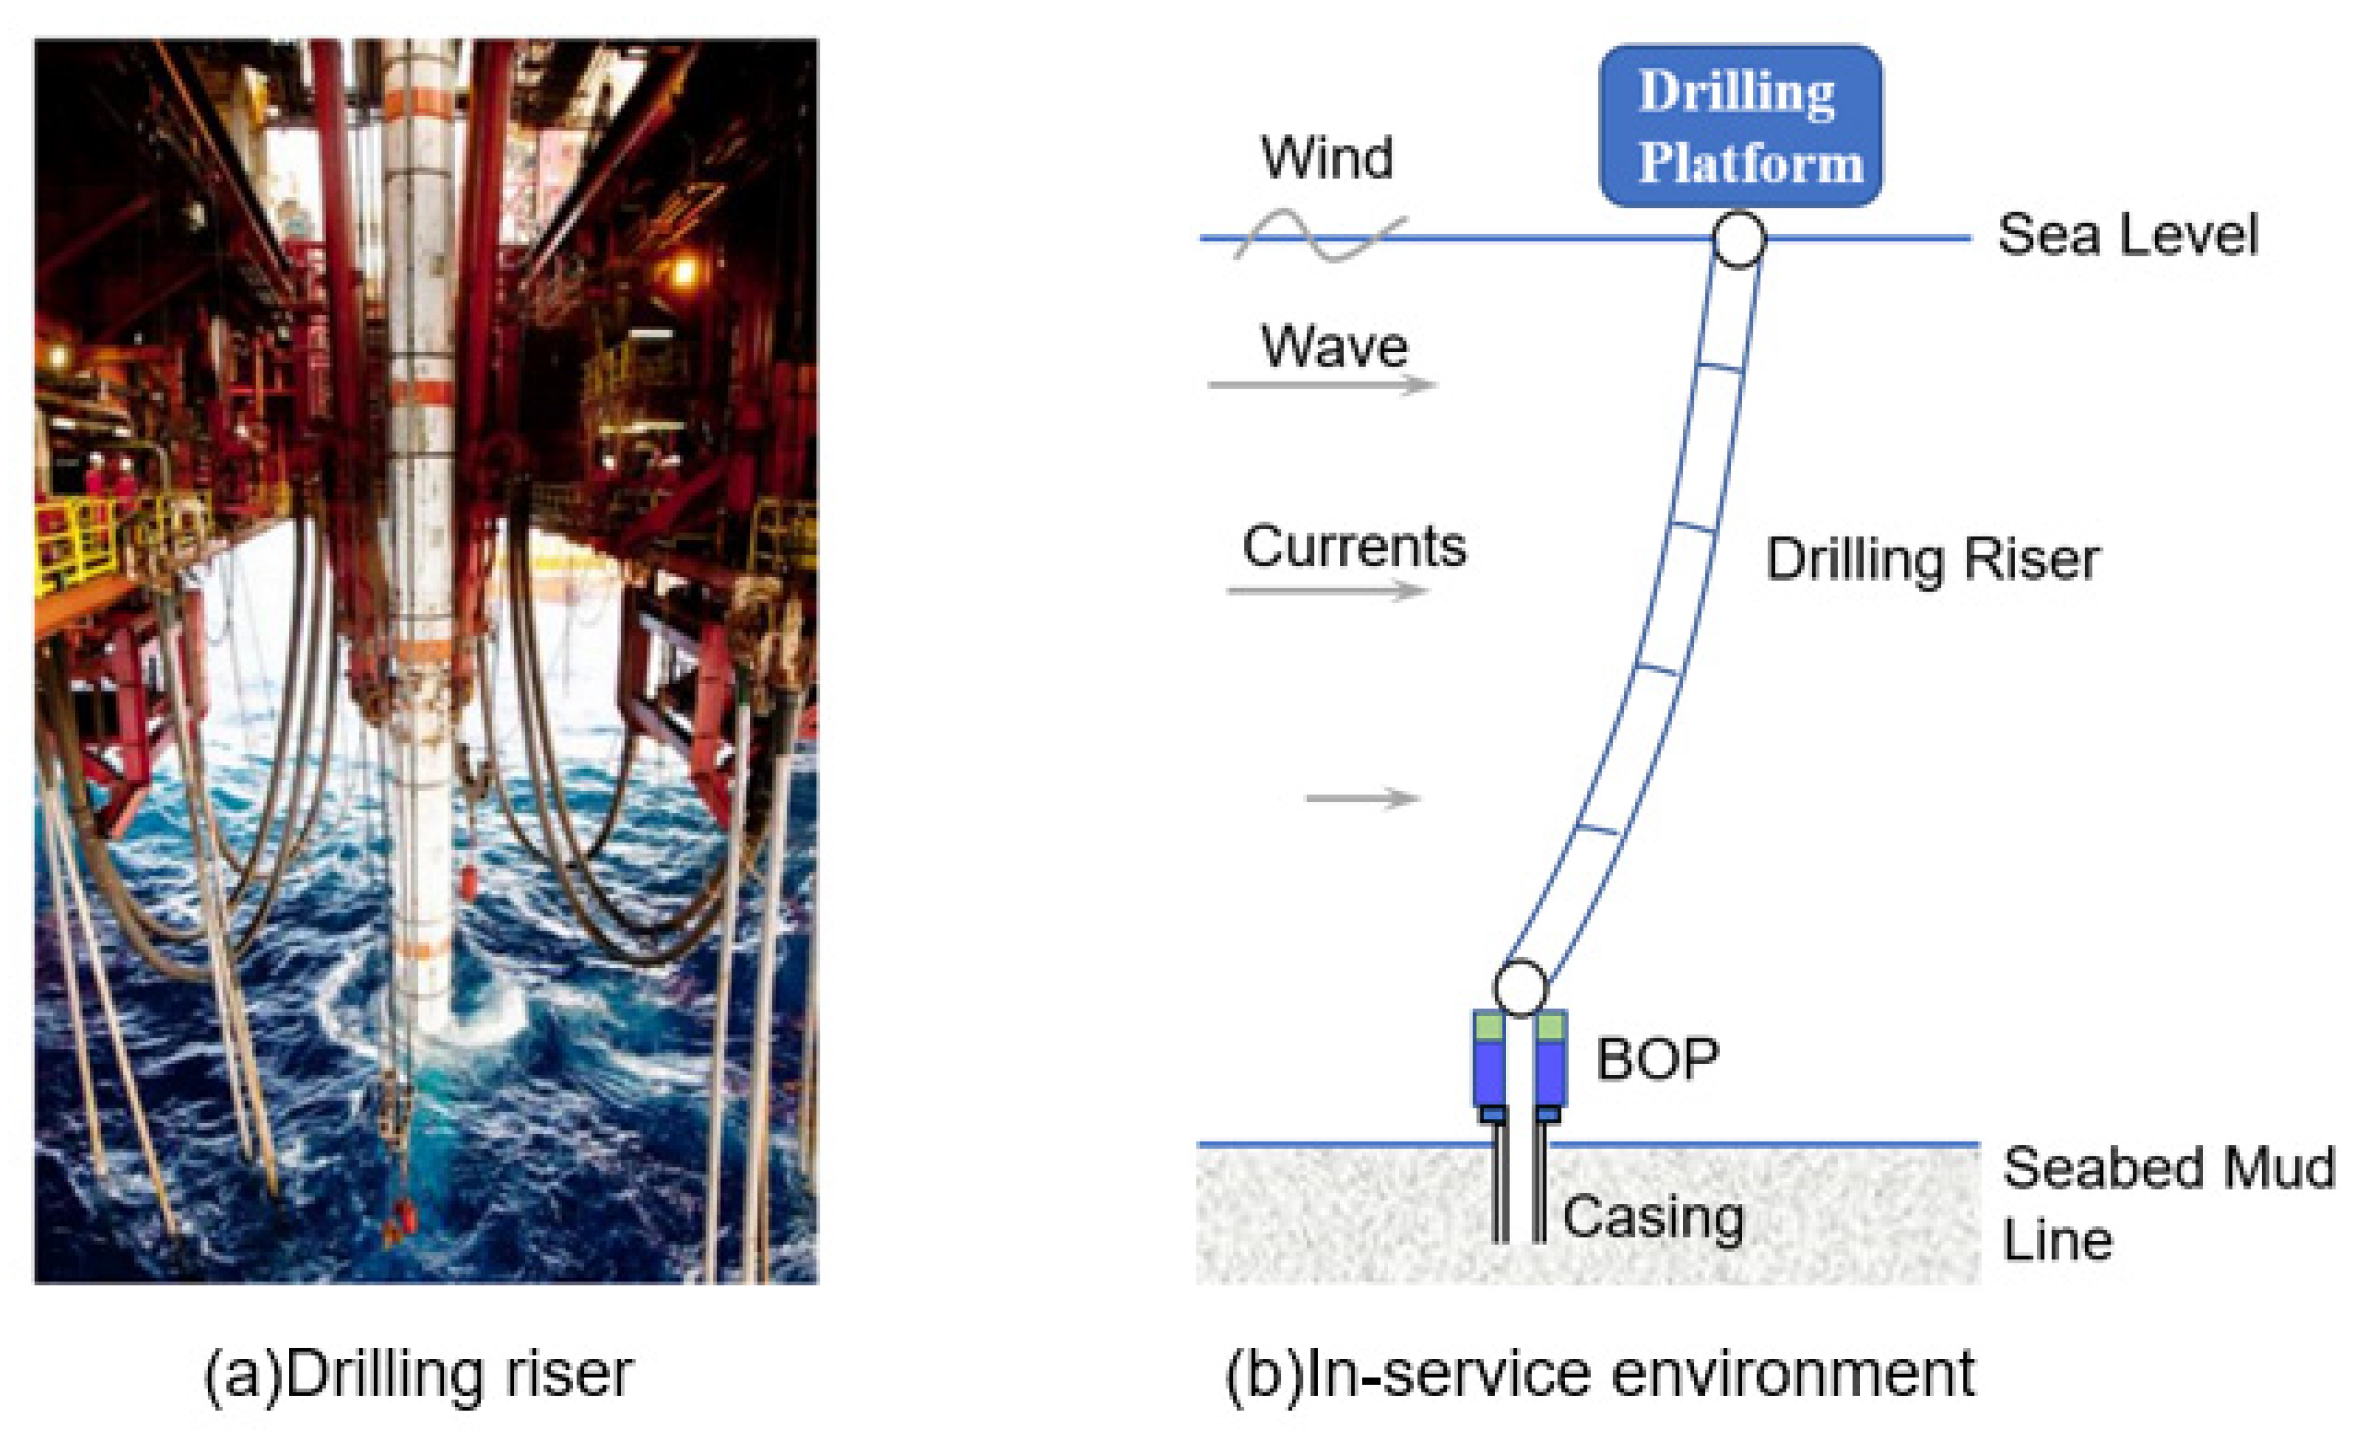
3.1. Development and Application of Magnetic Memory-Based Riser Inspection Robots
3.1.1. Design Requirements
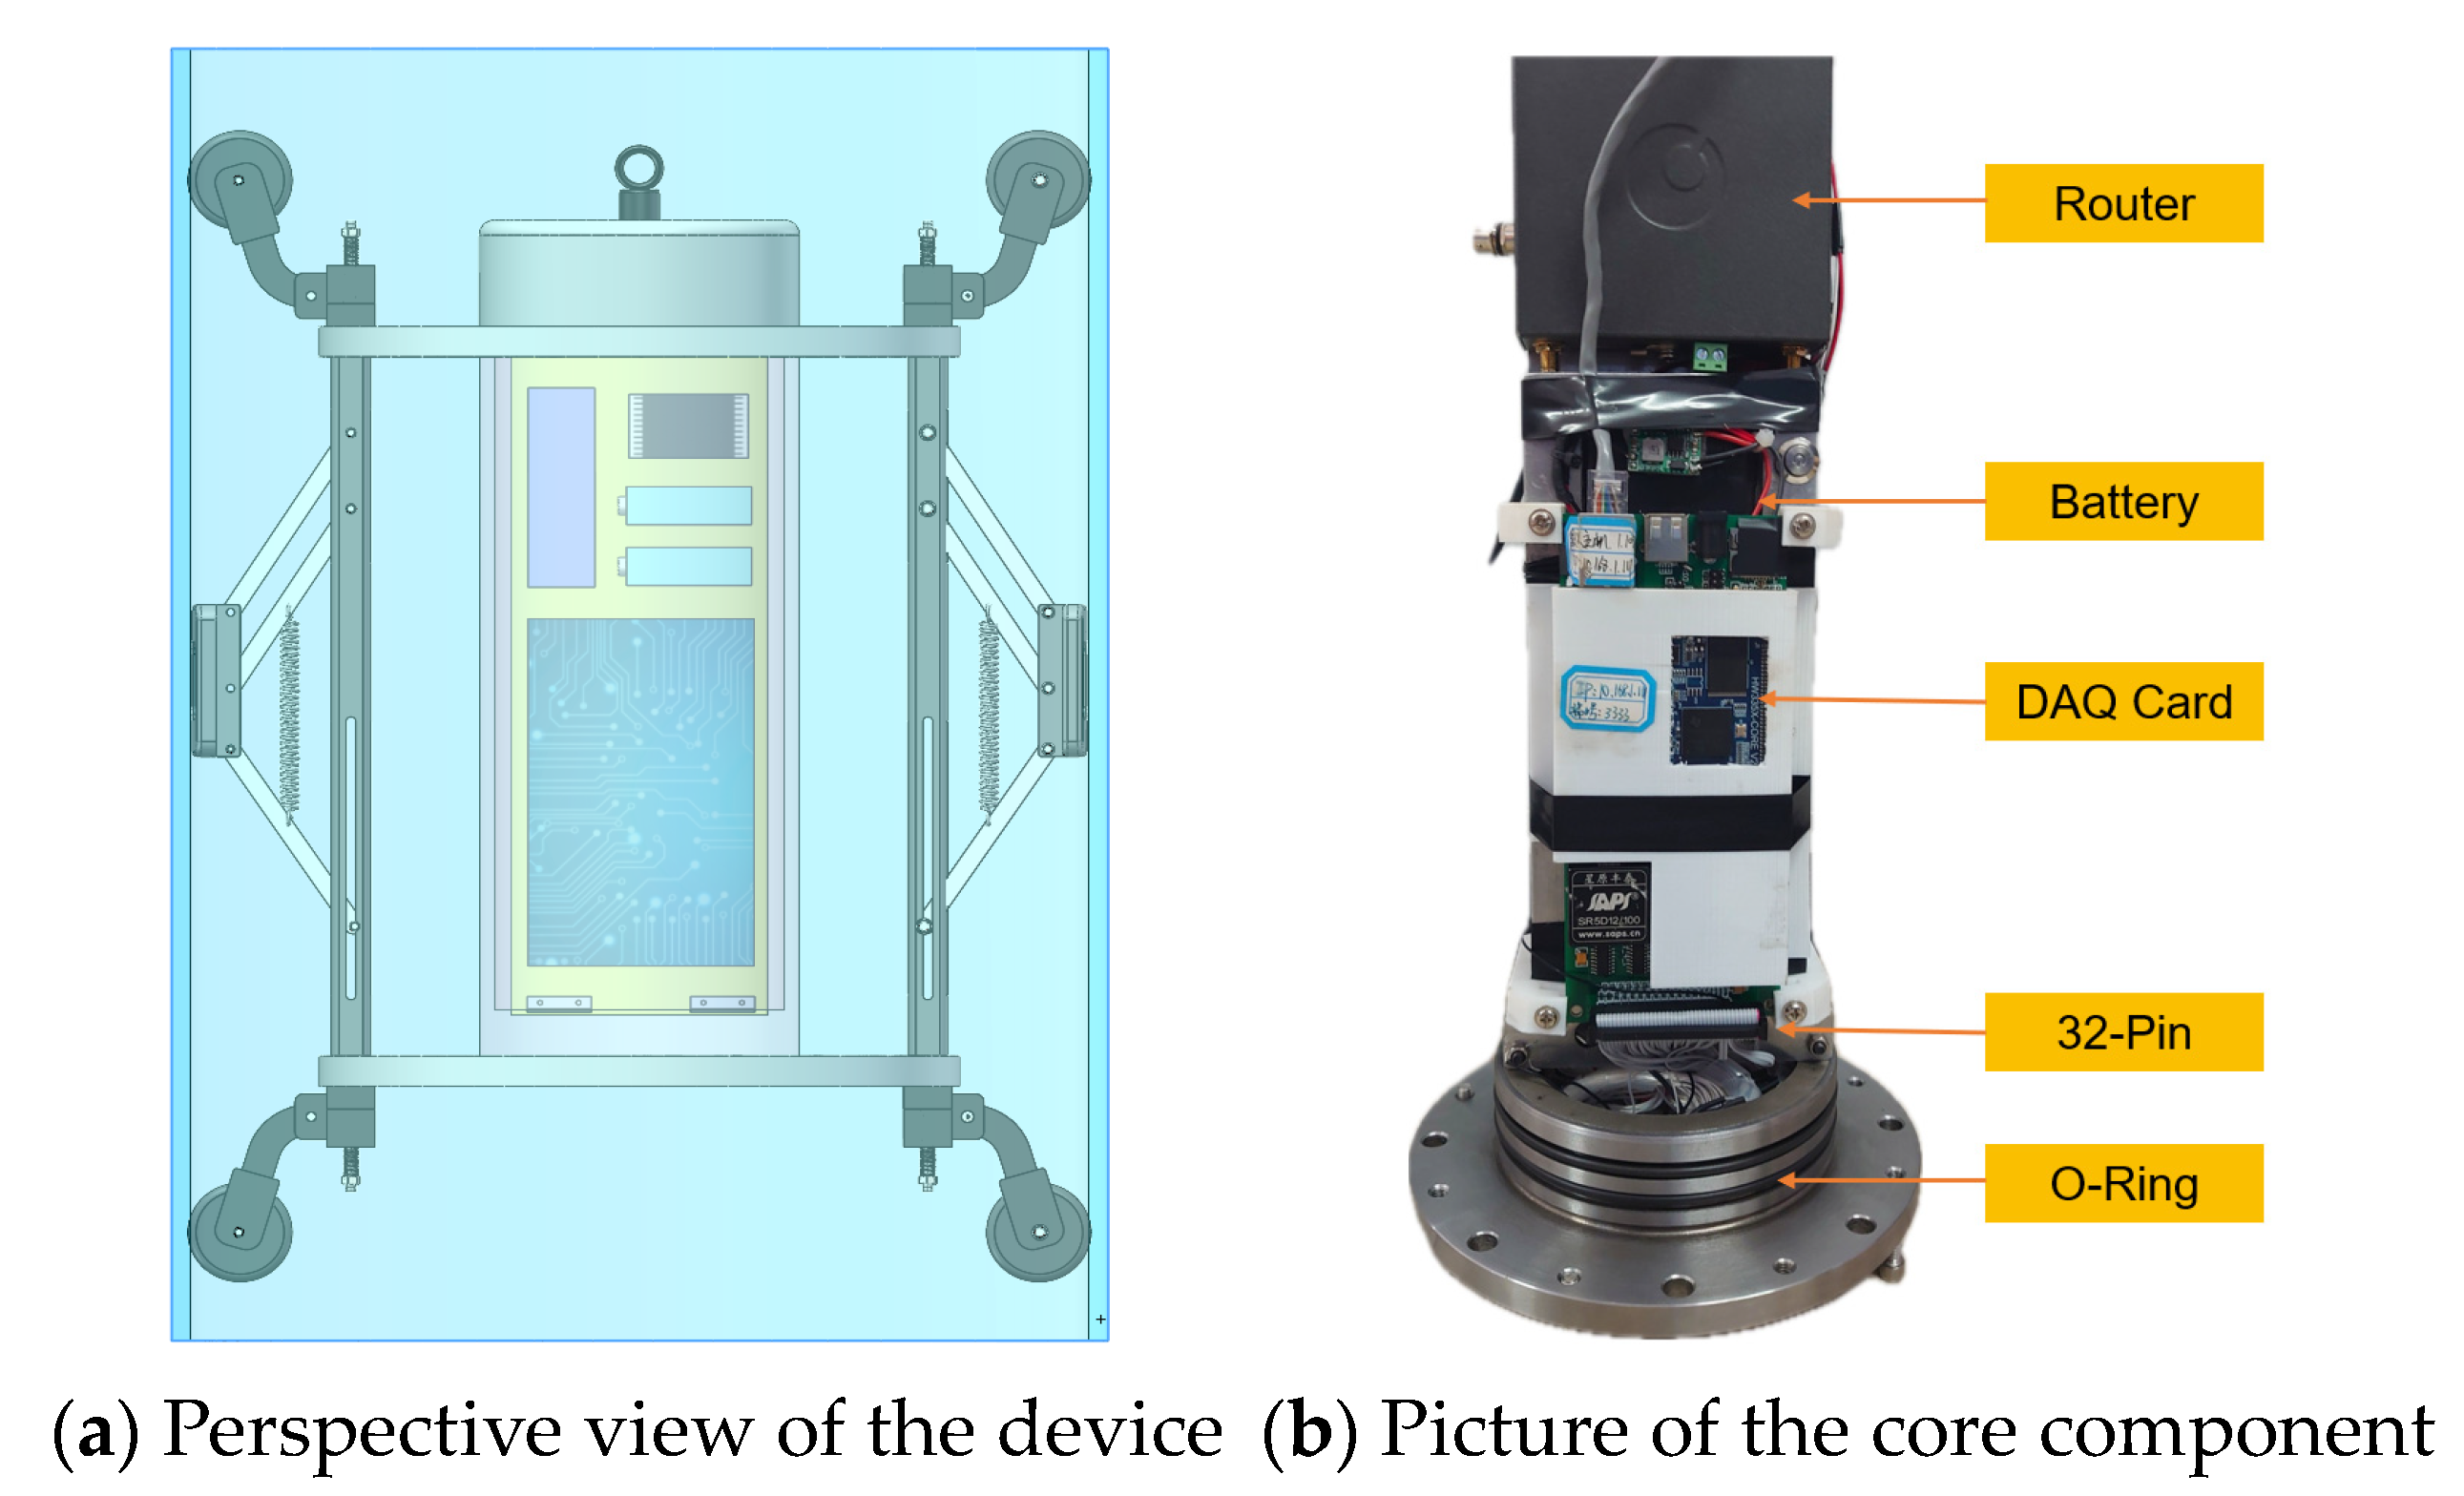
3.1.2. Design Proposal
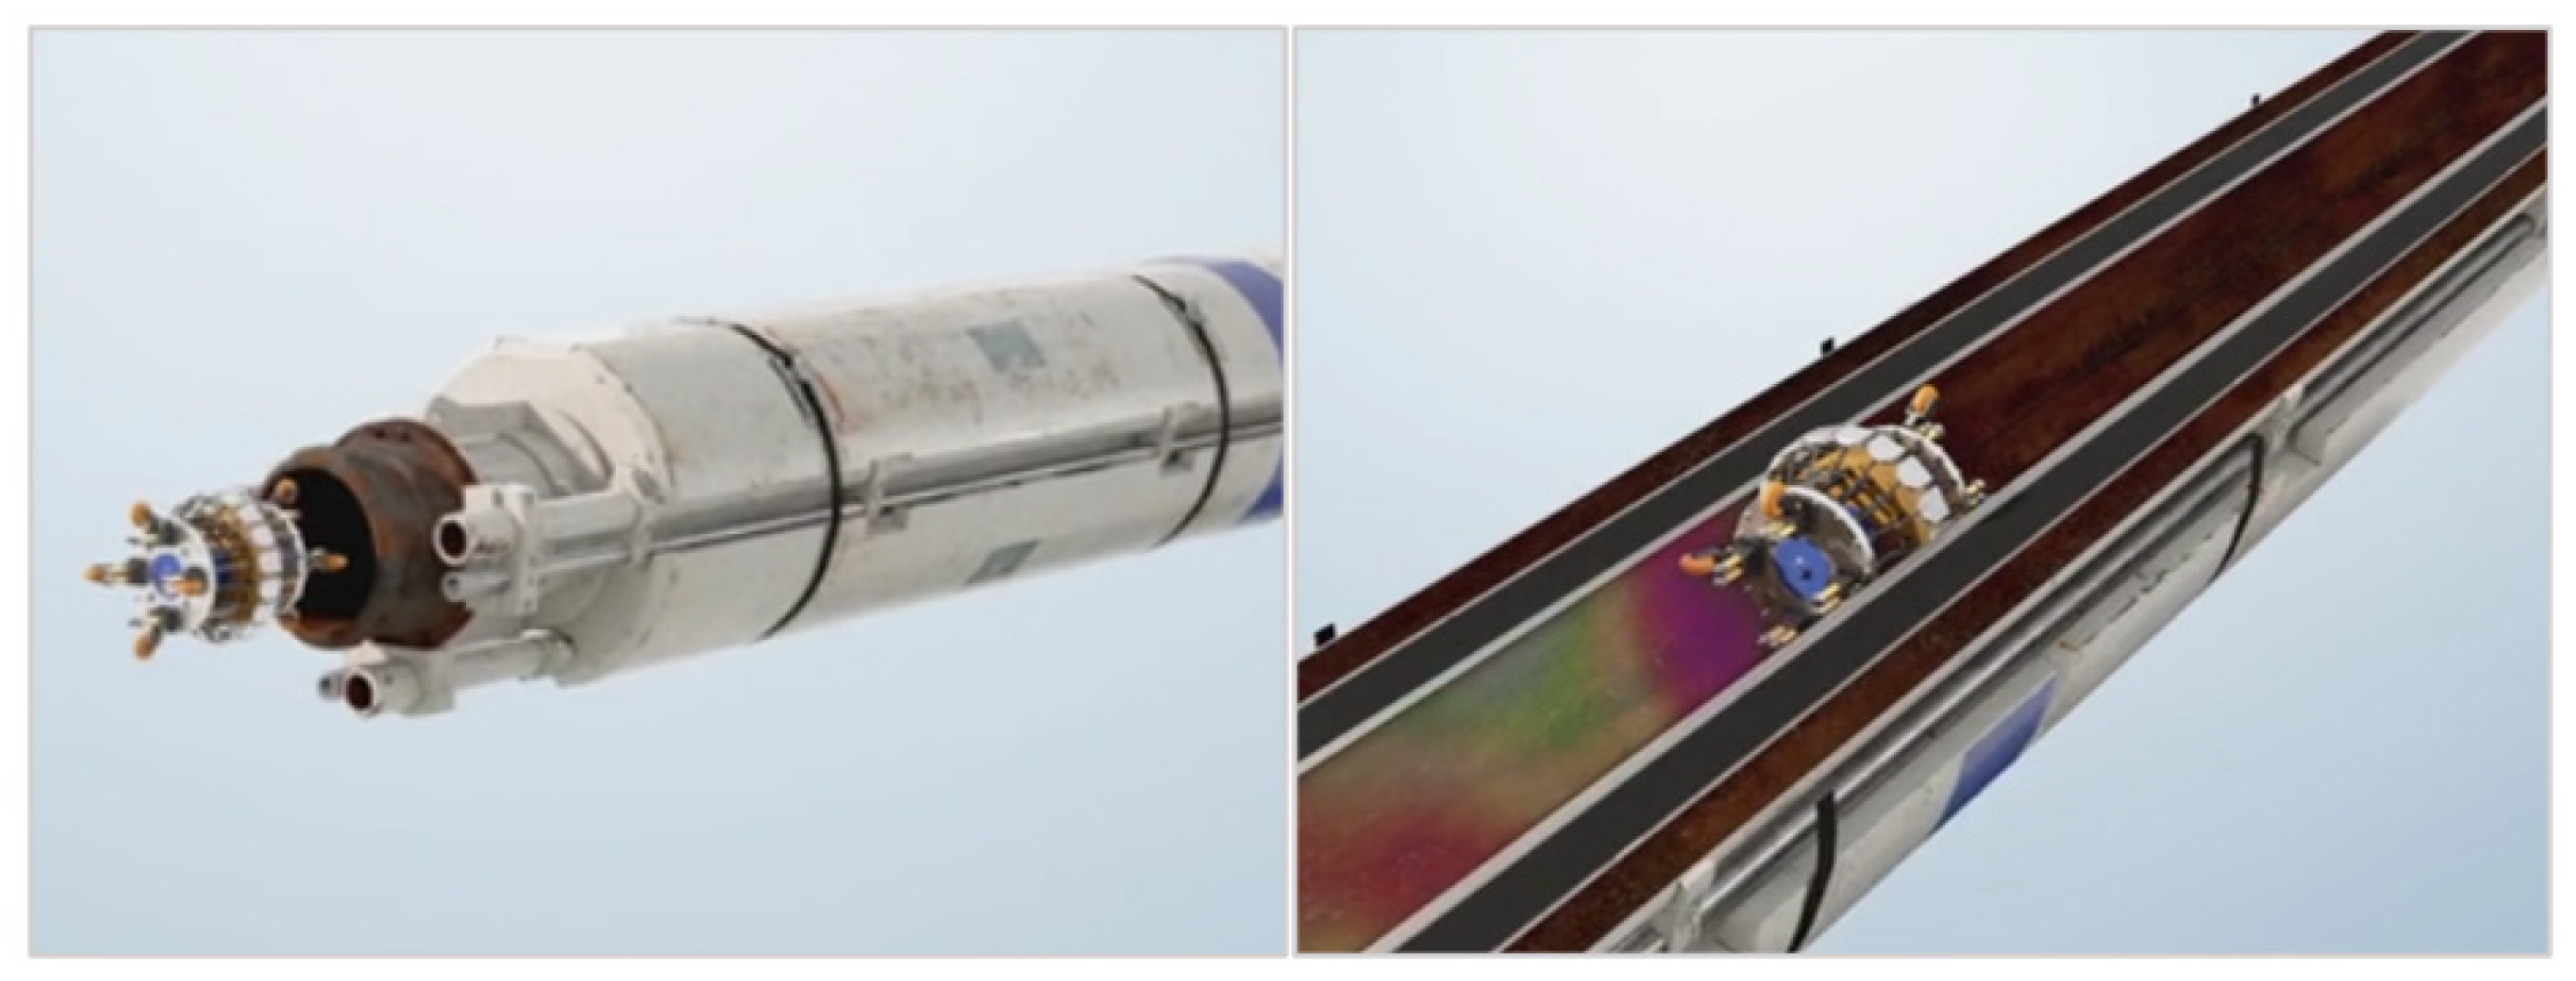
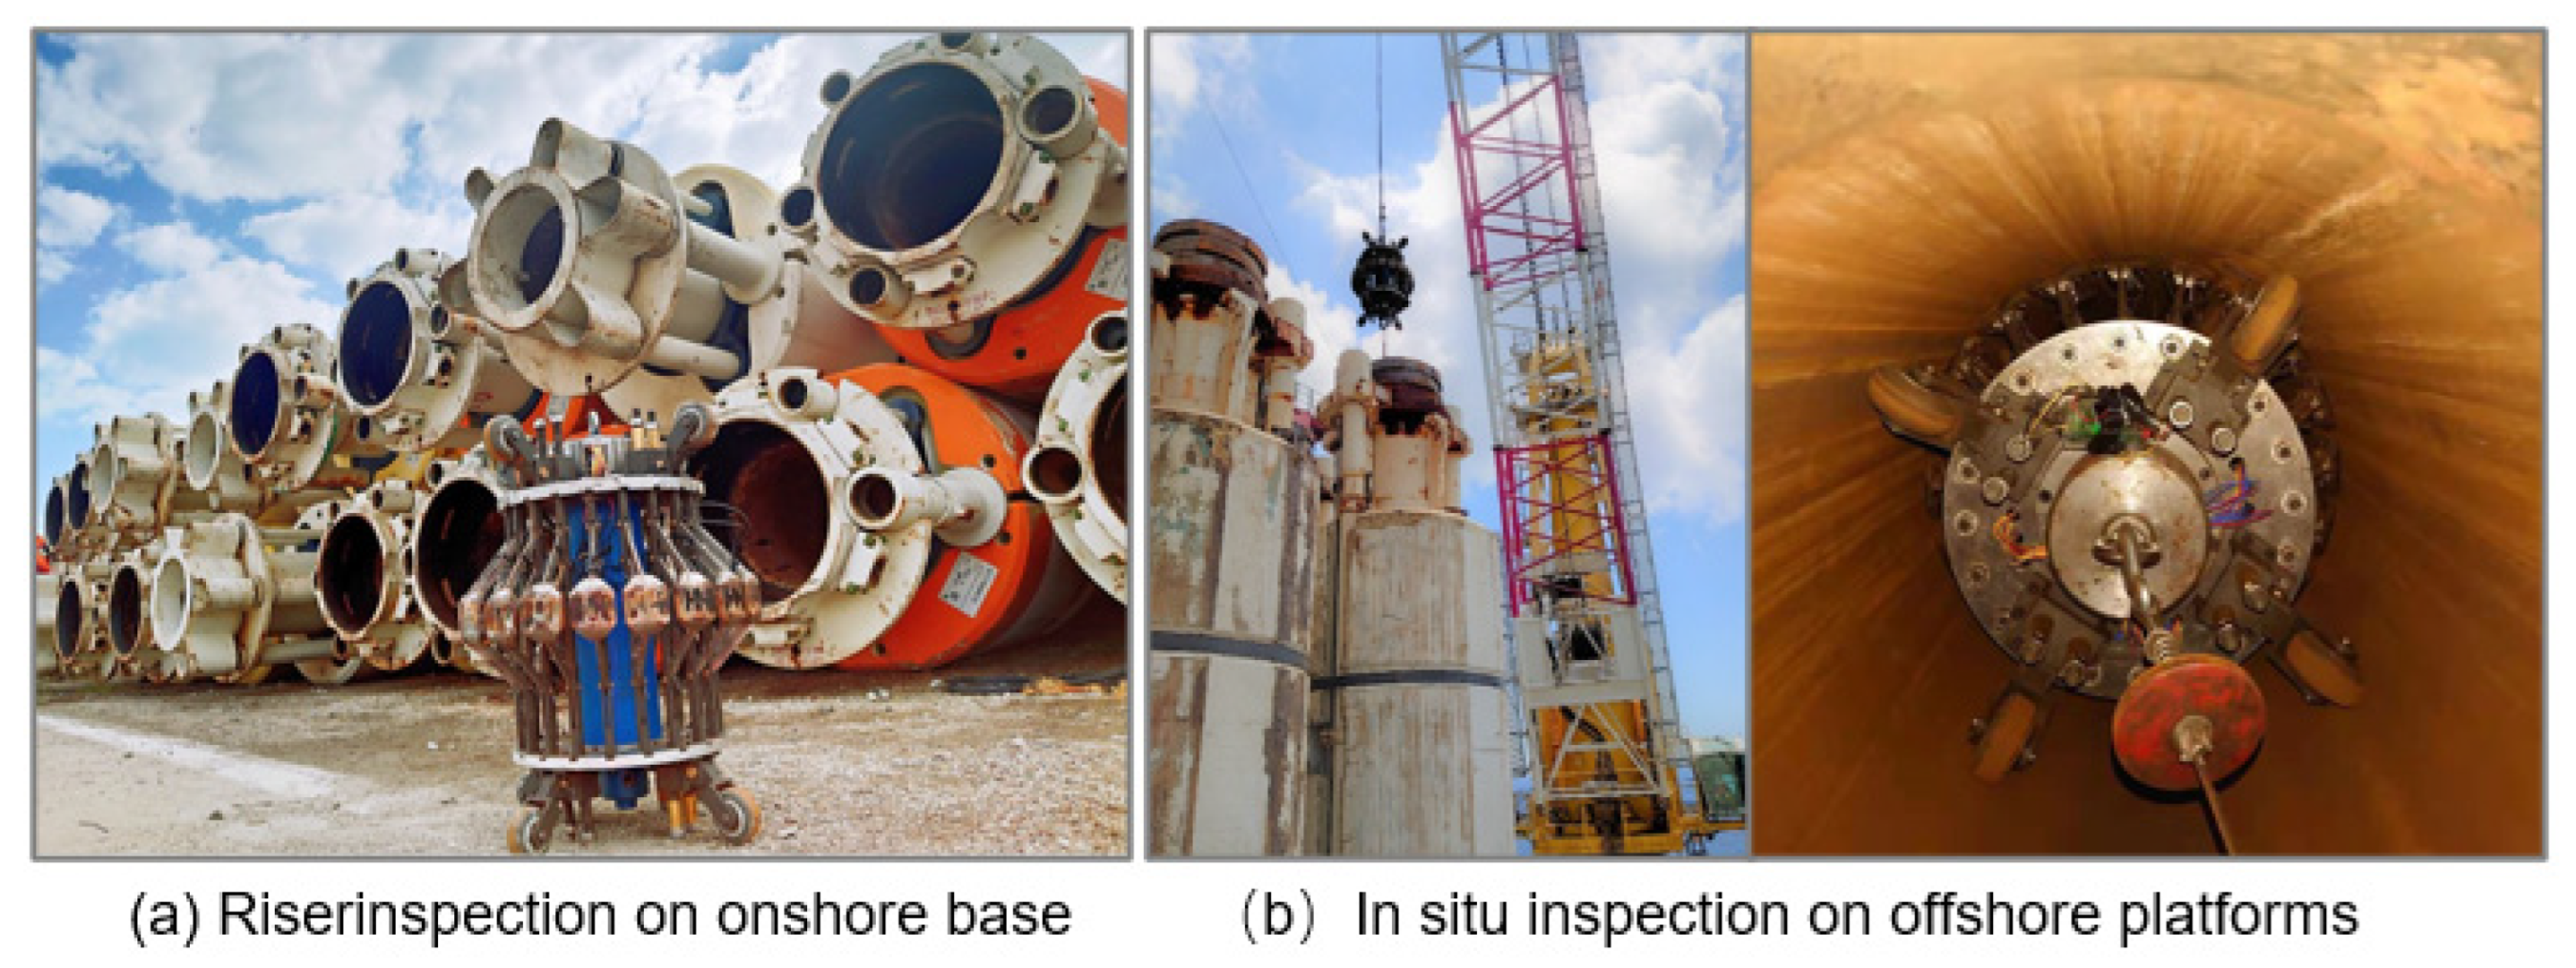
3.1.3. Industrial Application
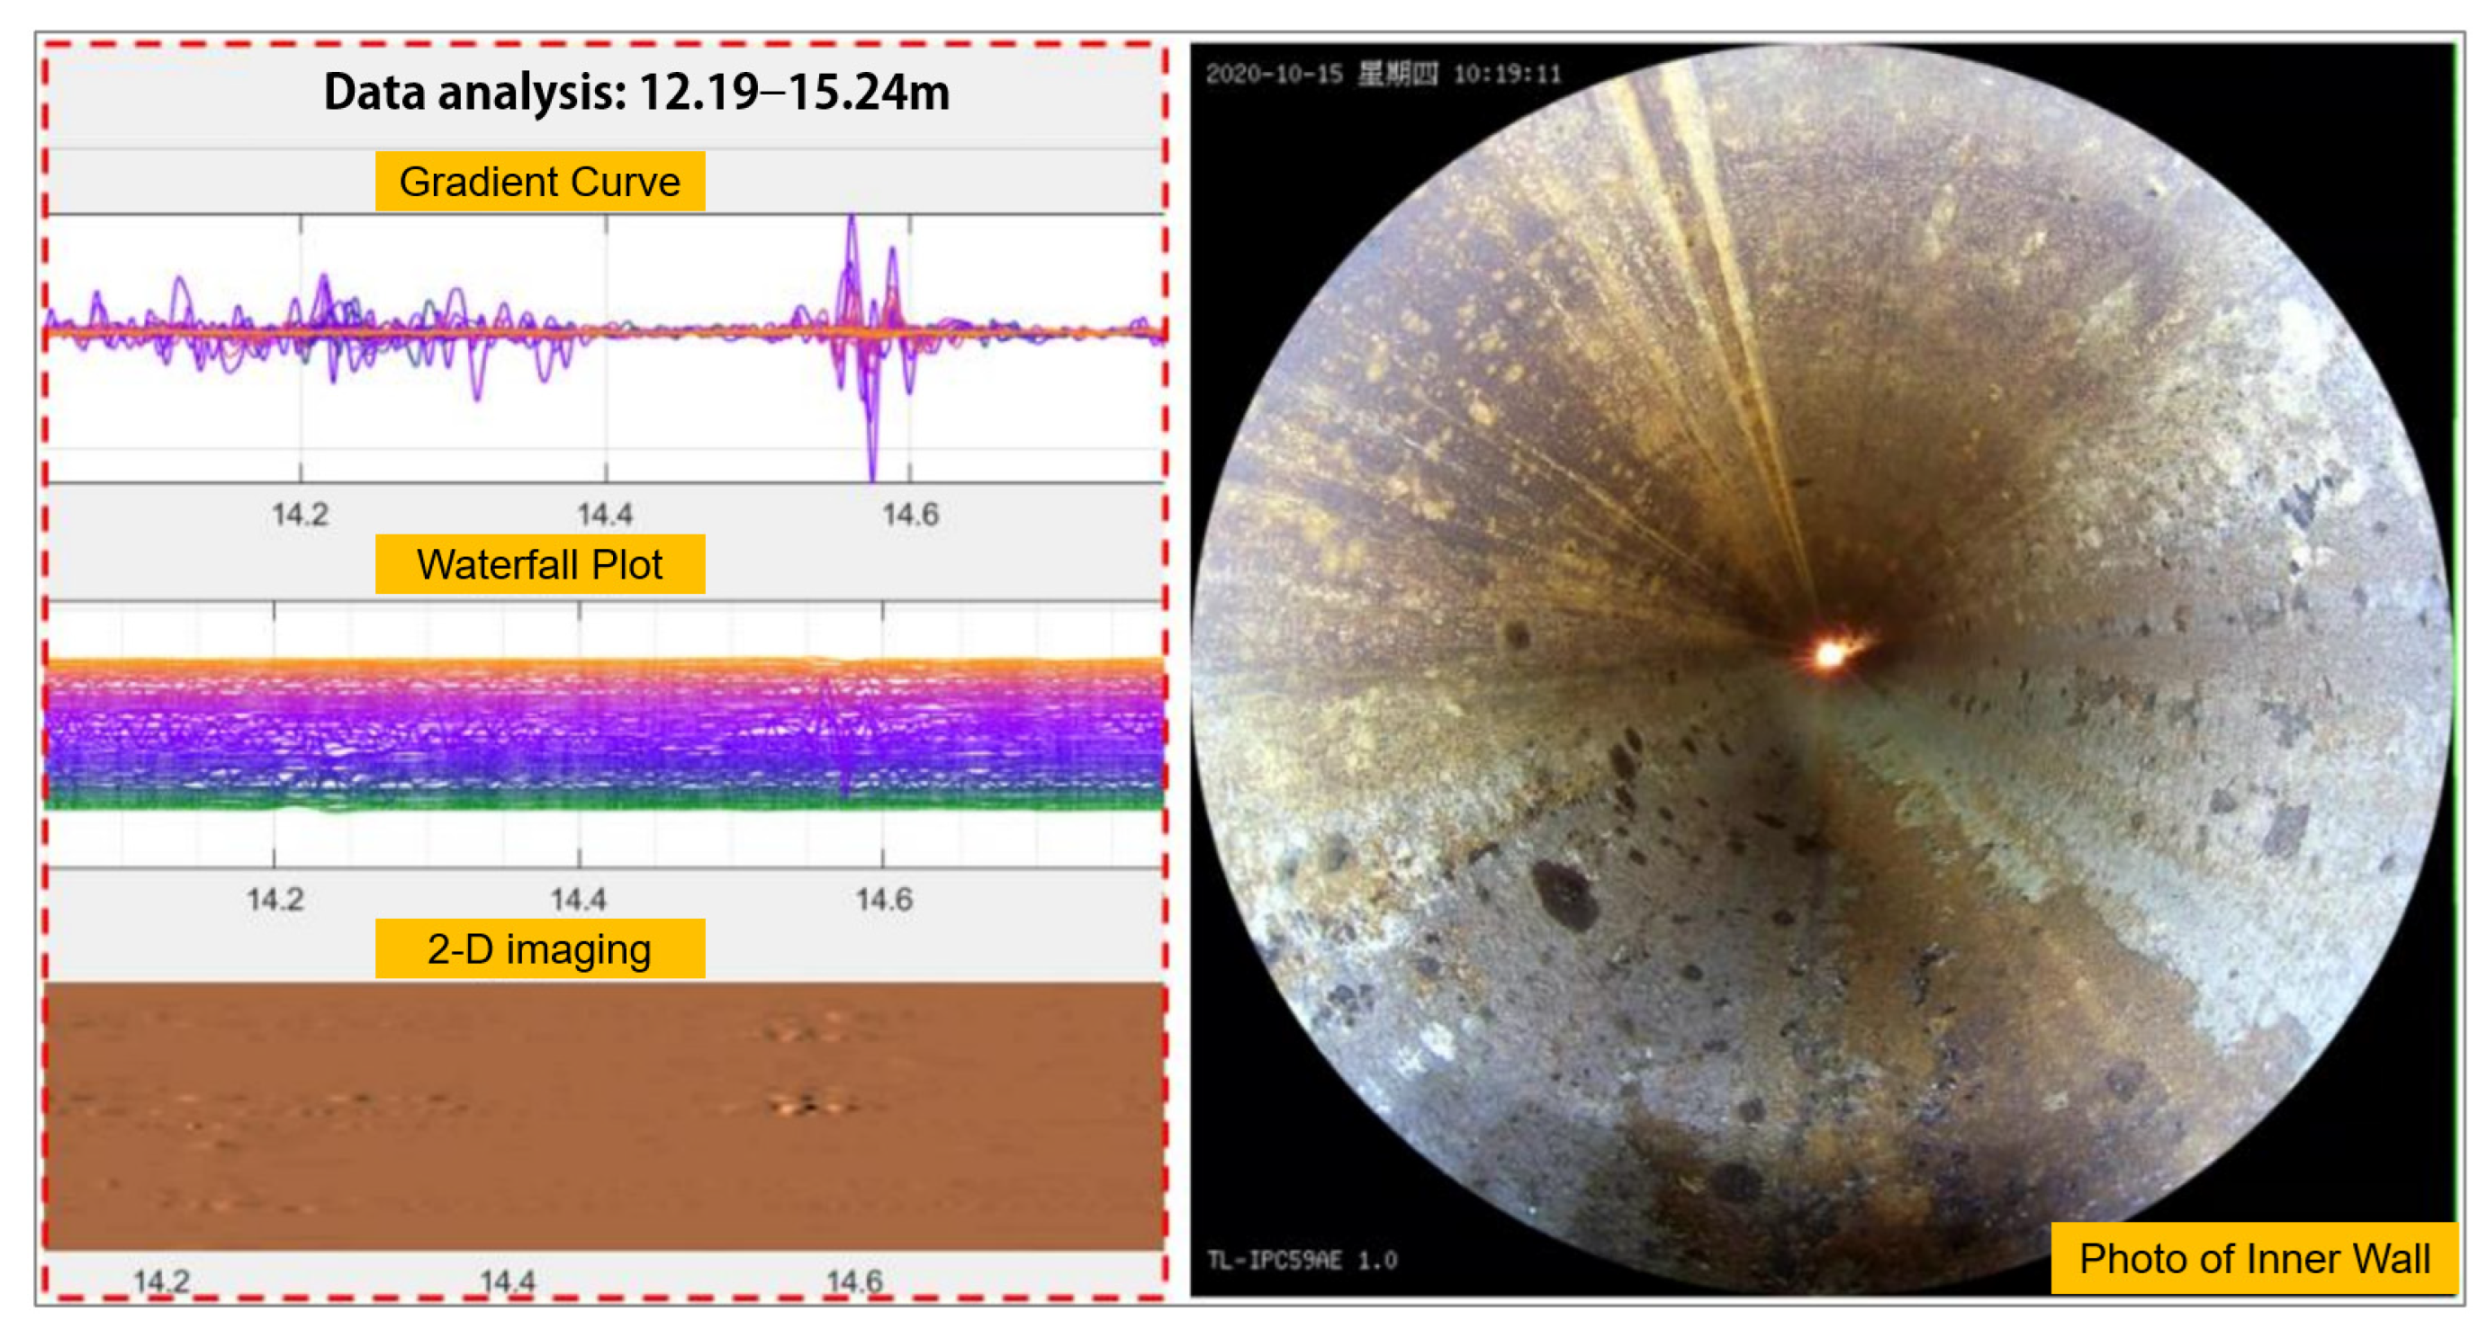
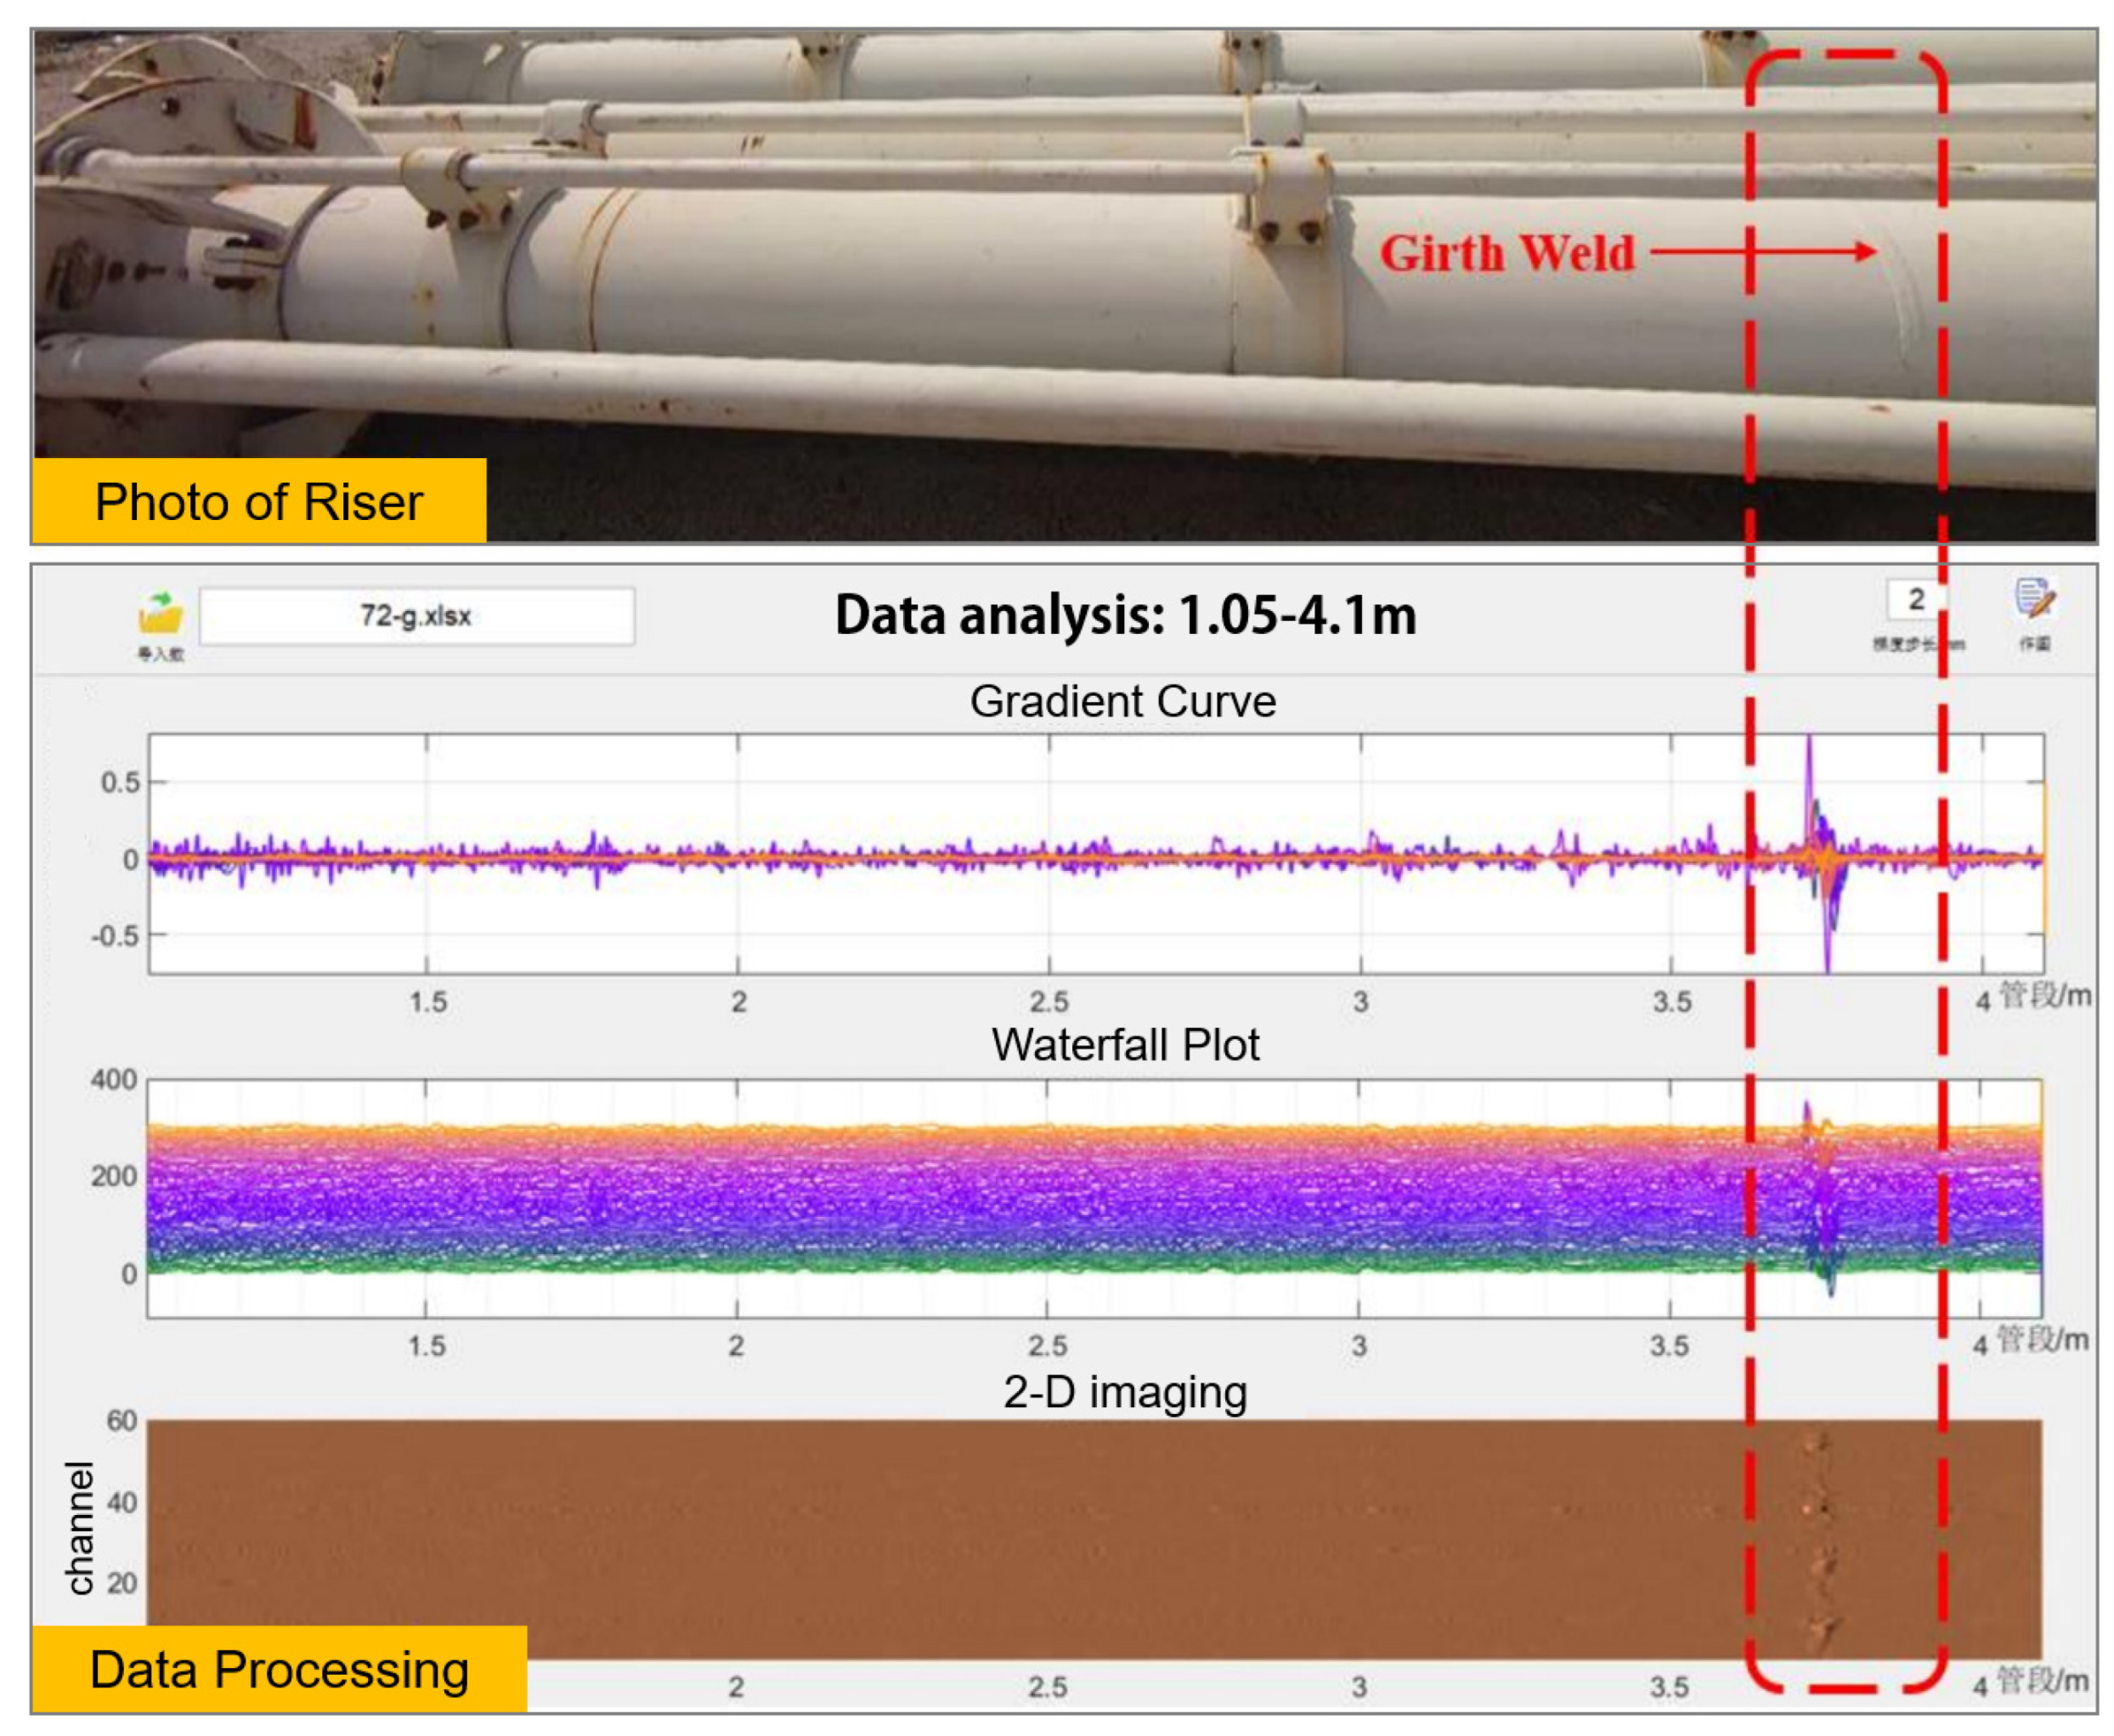
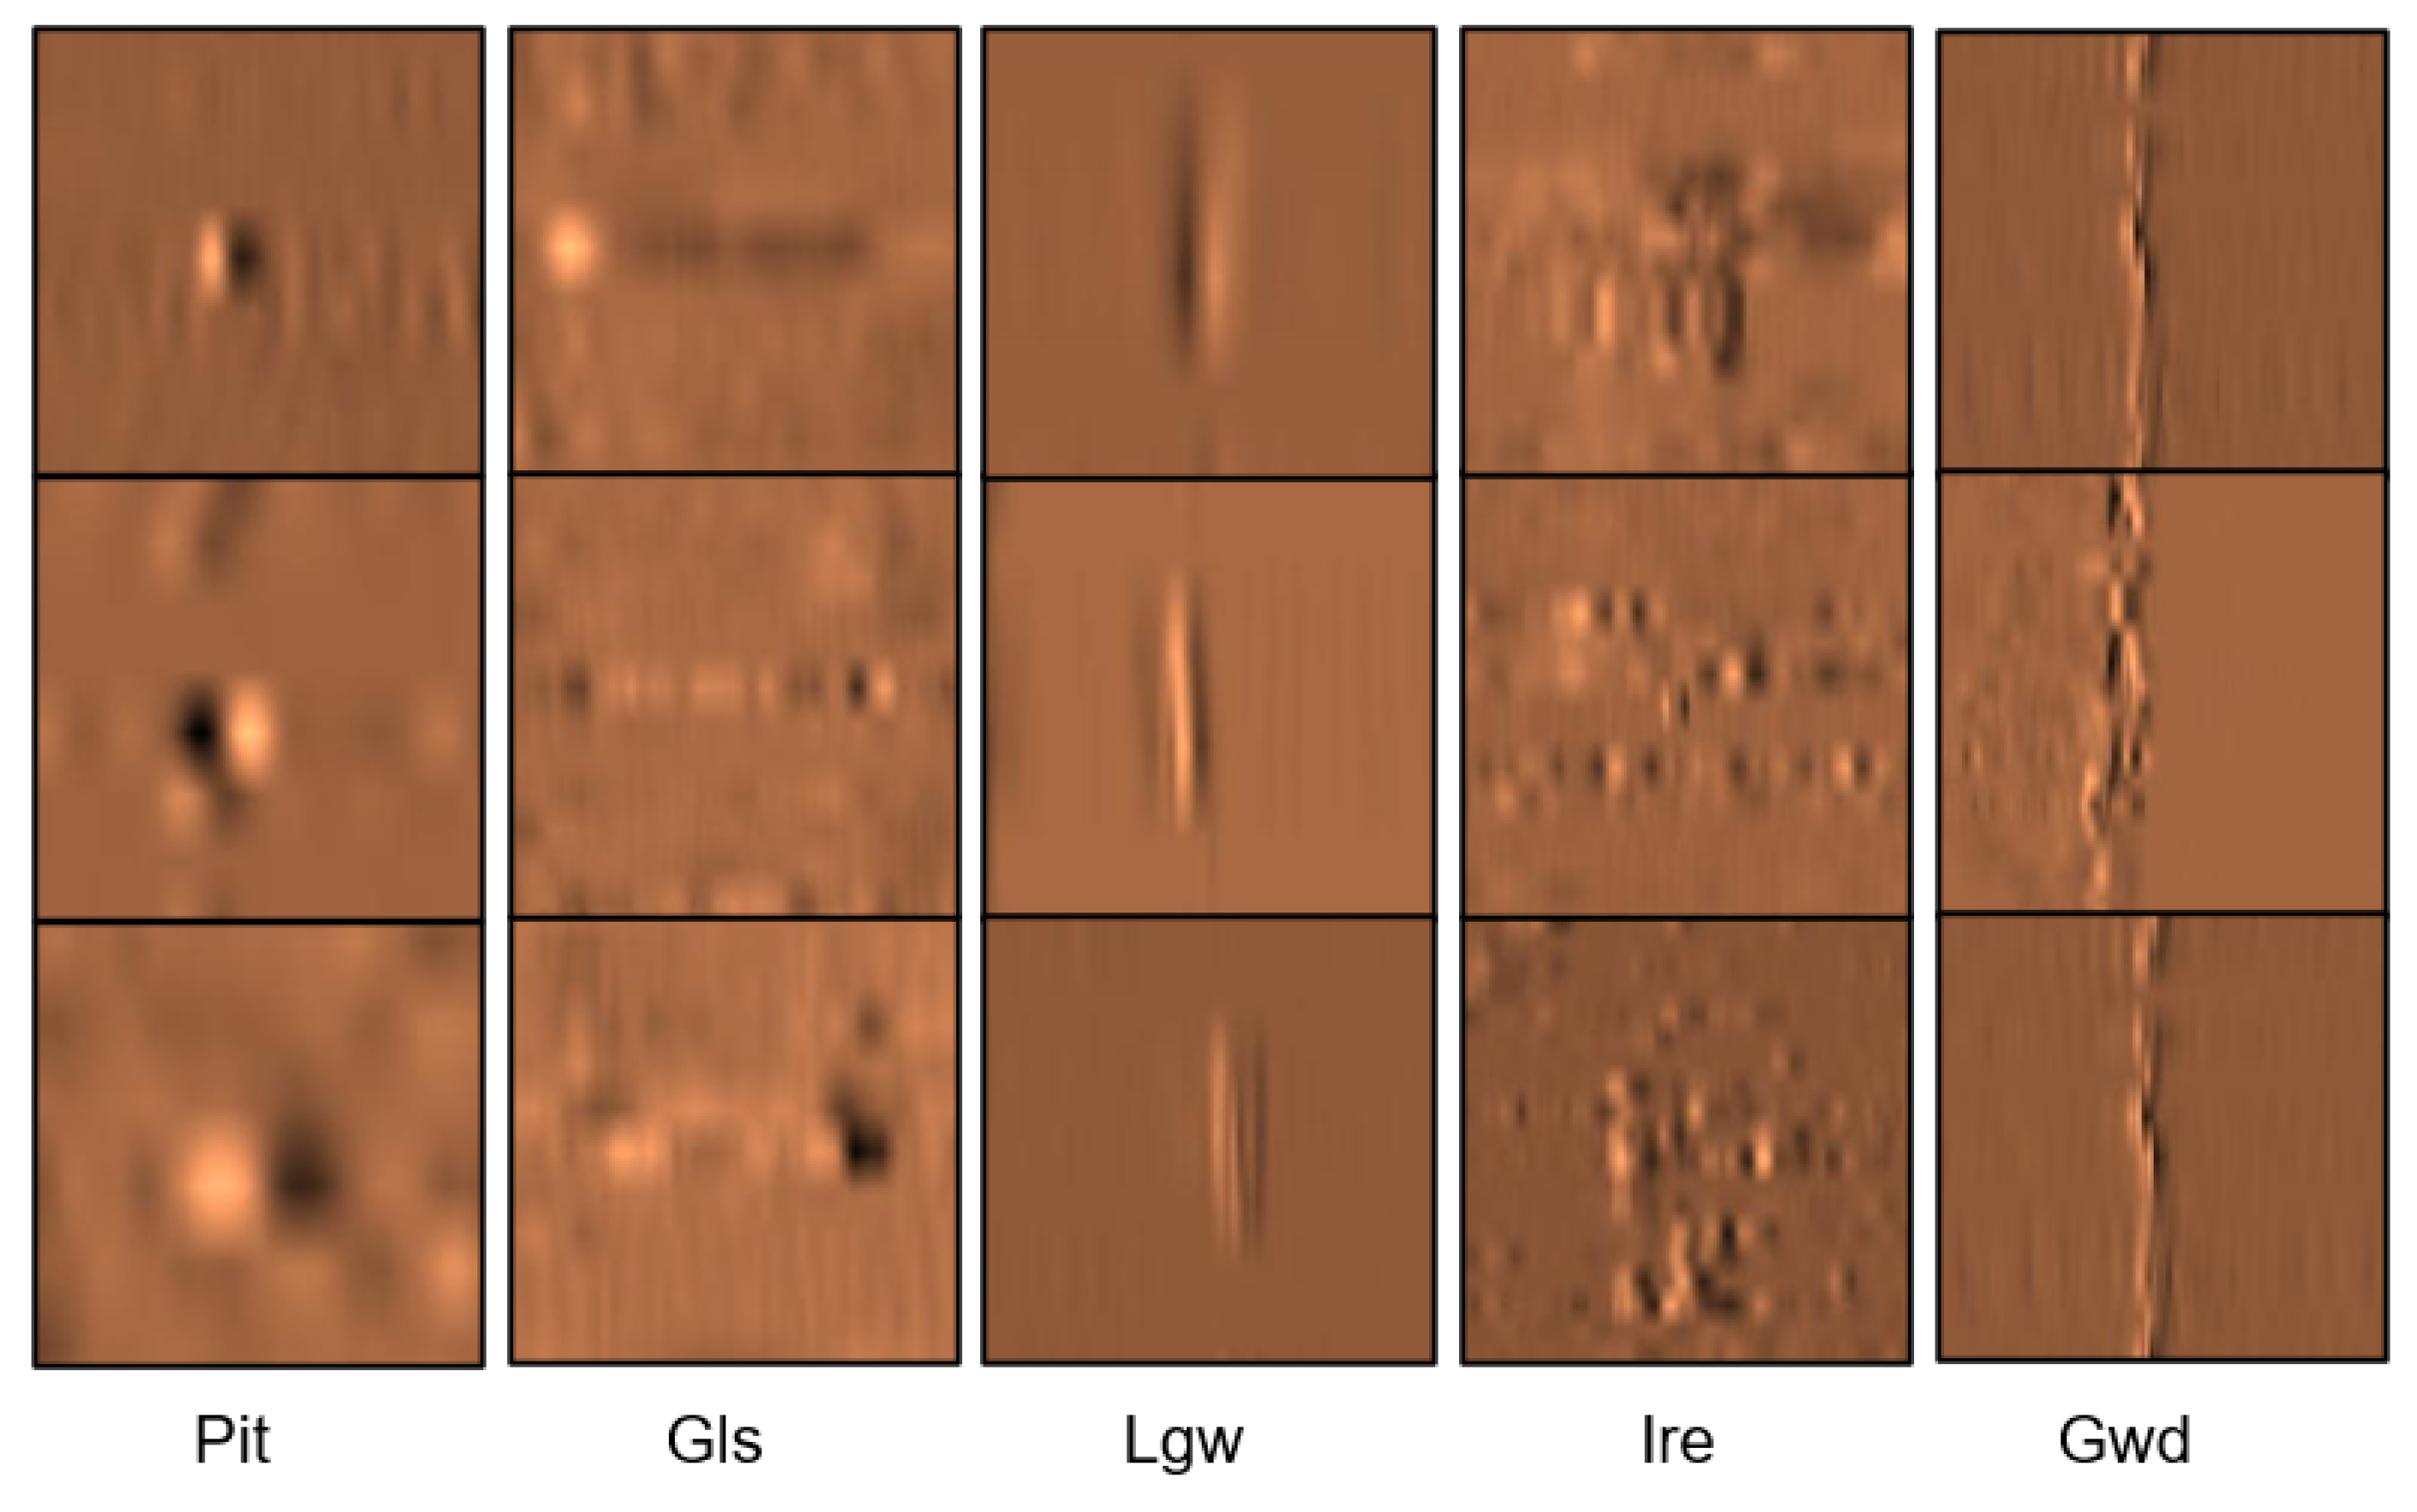
3.1.4. Data Visualization Analysis
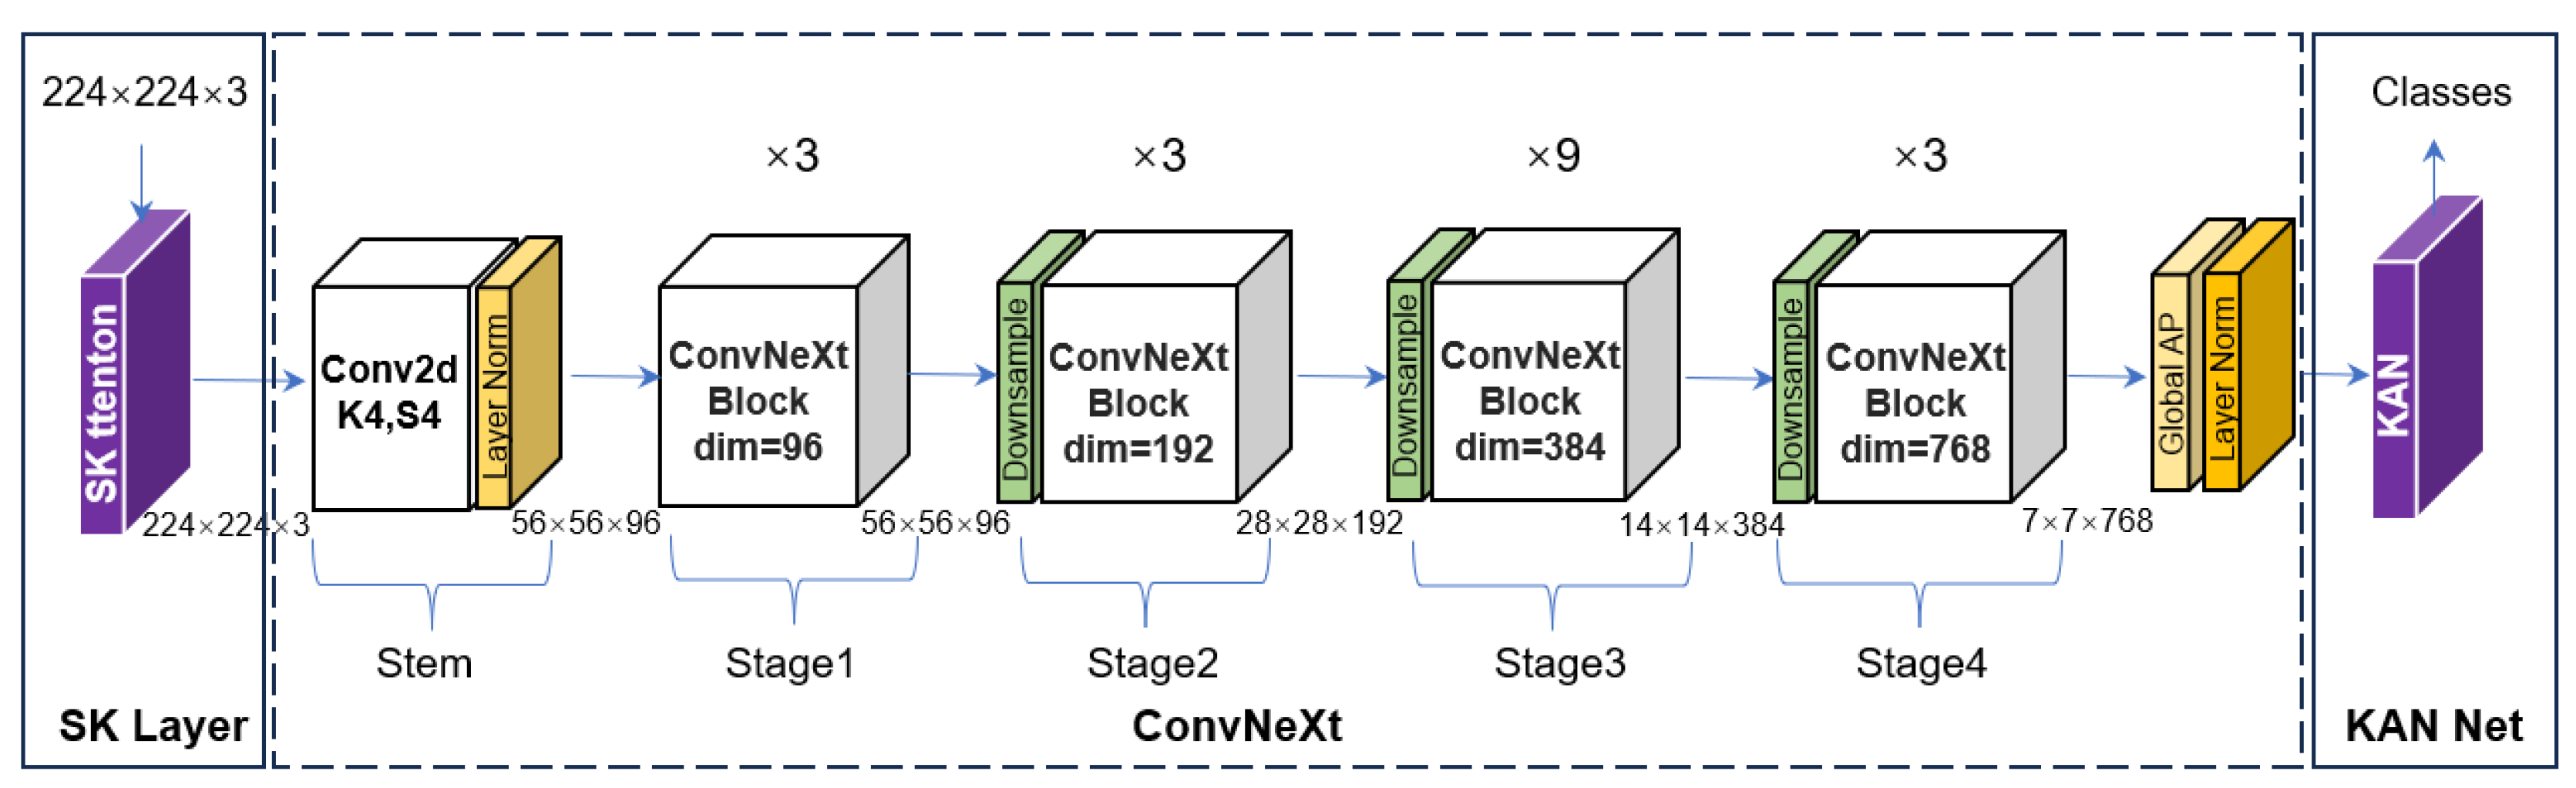
3.2. Intelligent Classification of Defect Images Based on SK-ConvNeXt-KAN
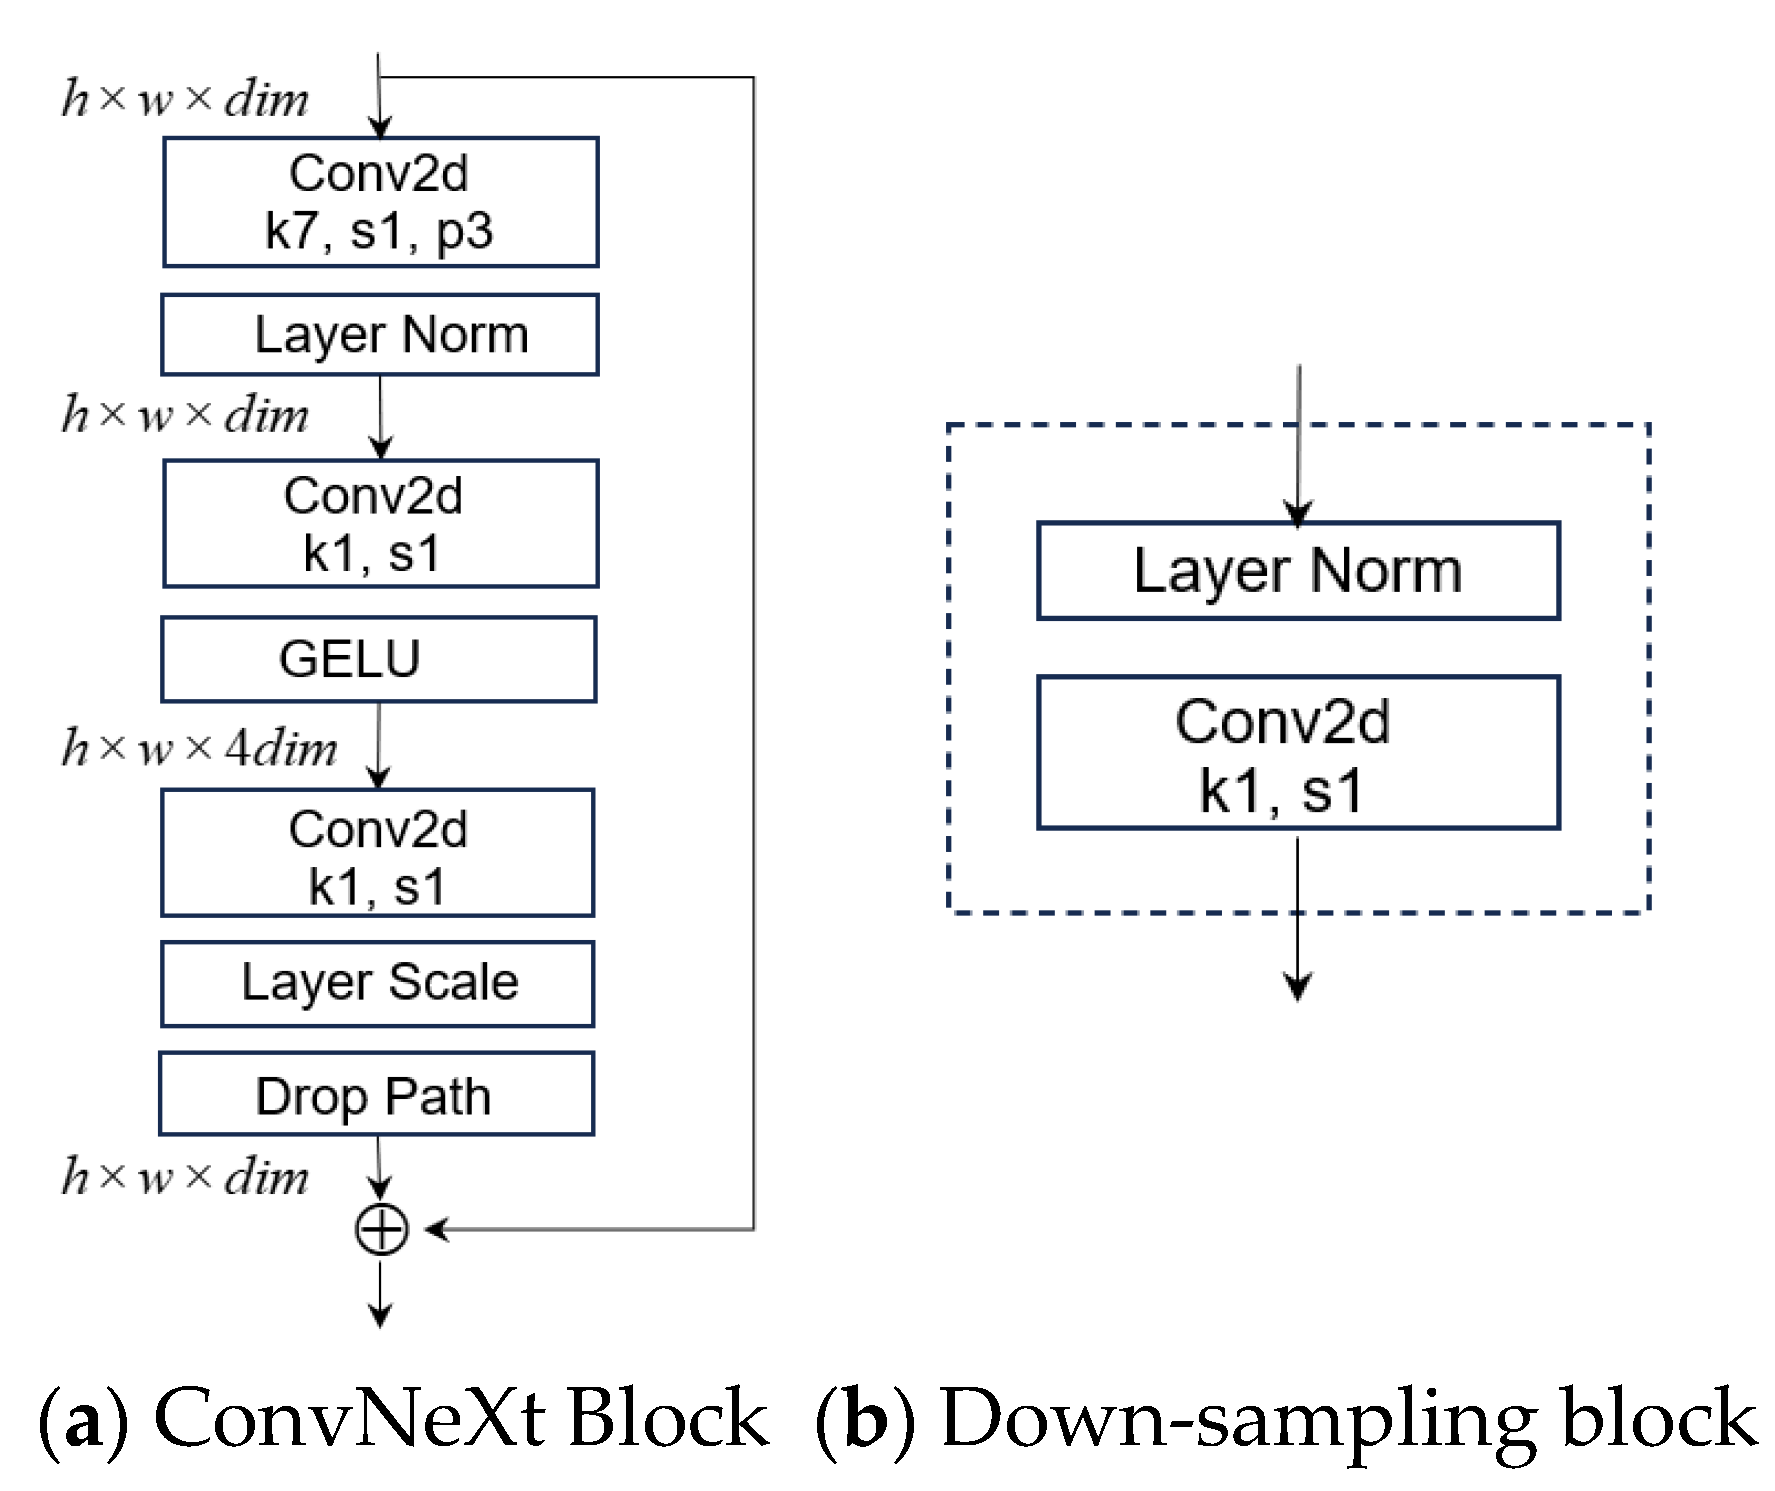
3.2.1. ConvNeXt Network
- Macro design
- Micro design
3.2.2. Selective Kernel Attention
- Split
- Fuse
- Select
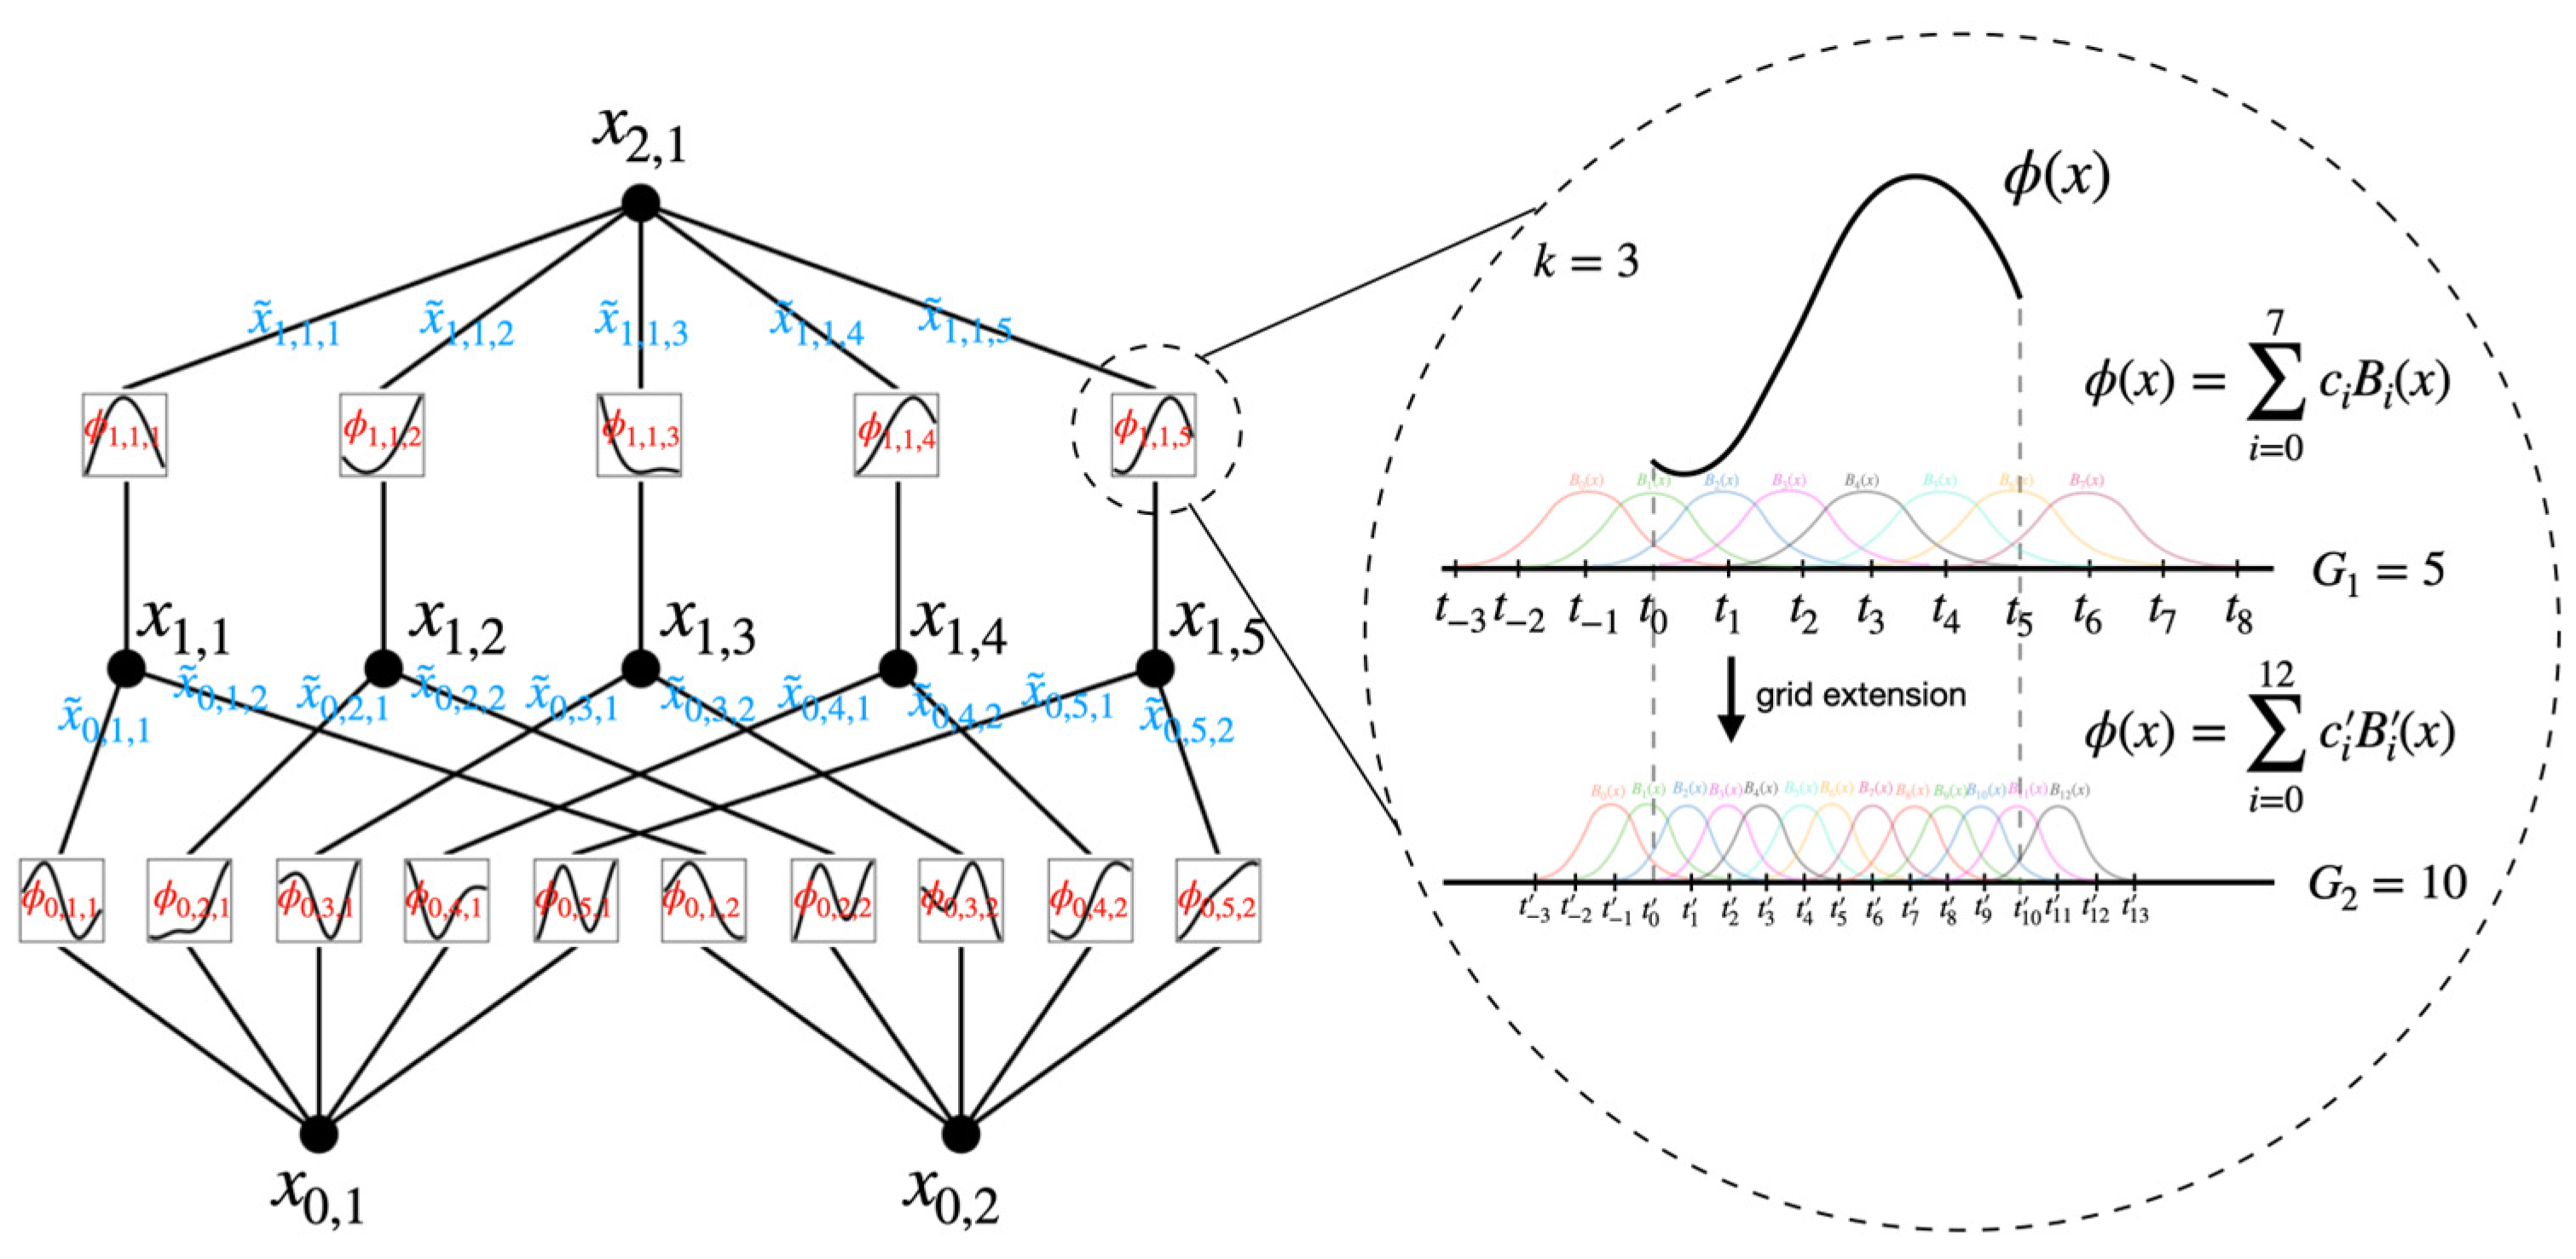
3.2.3. Kolmogorov–Arnold Network
3.2.4. SK-ConvNeXt-KAN Network
4. Experiment Results and Discussion
4.1. Experimental Environment
4.2. Dataset and Evaluation Metrics
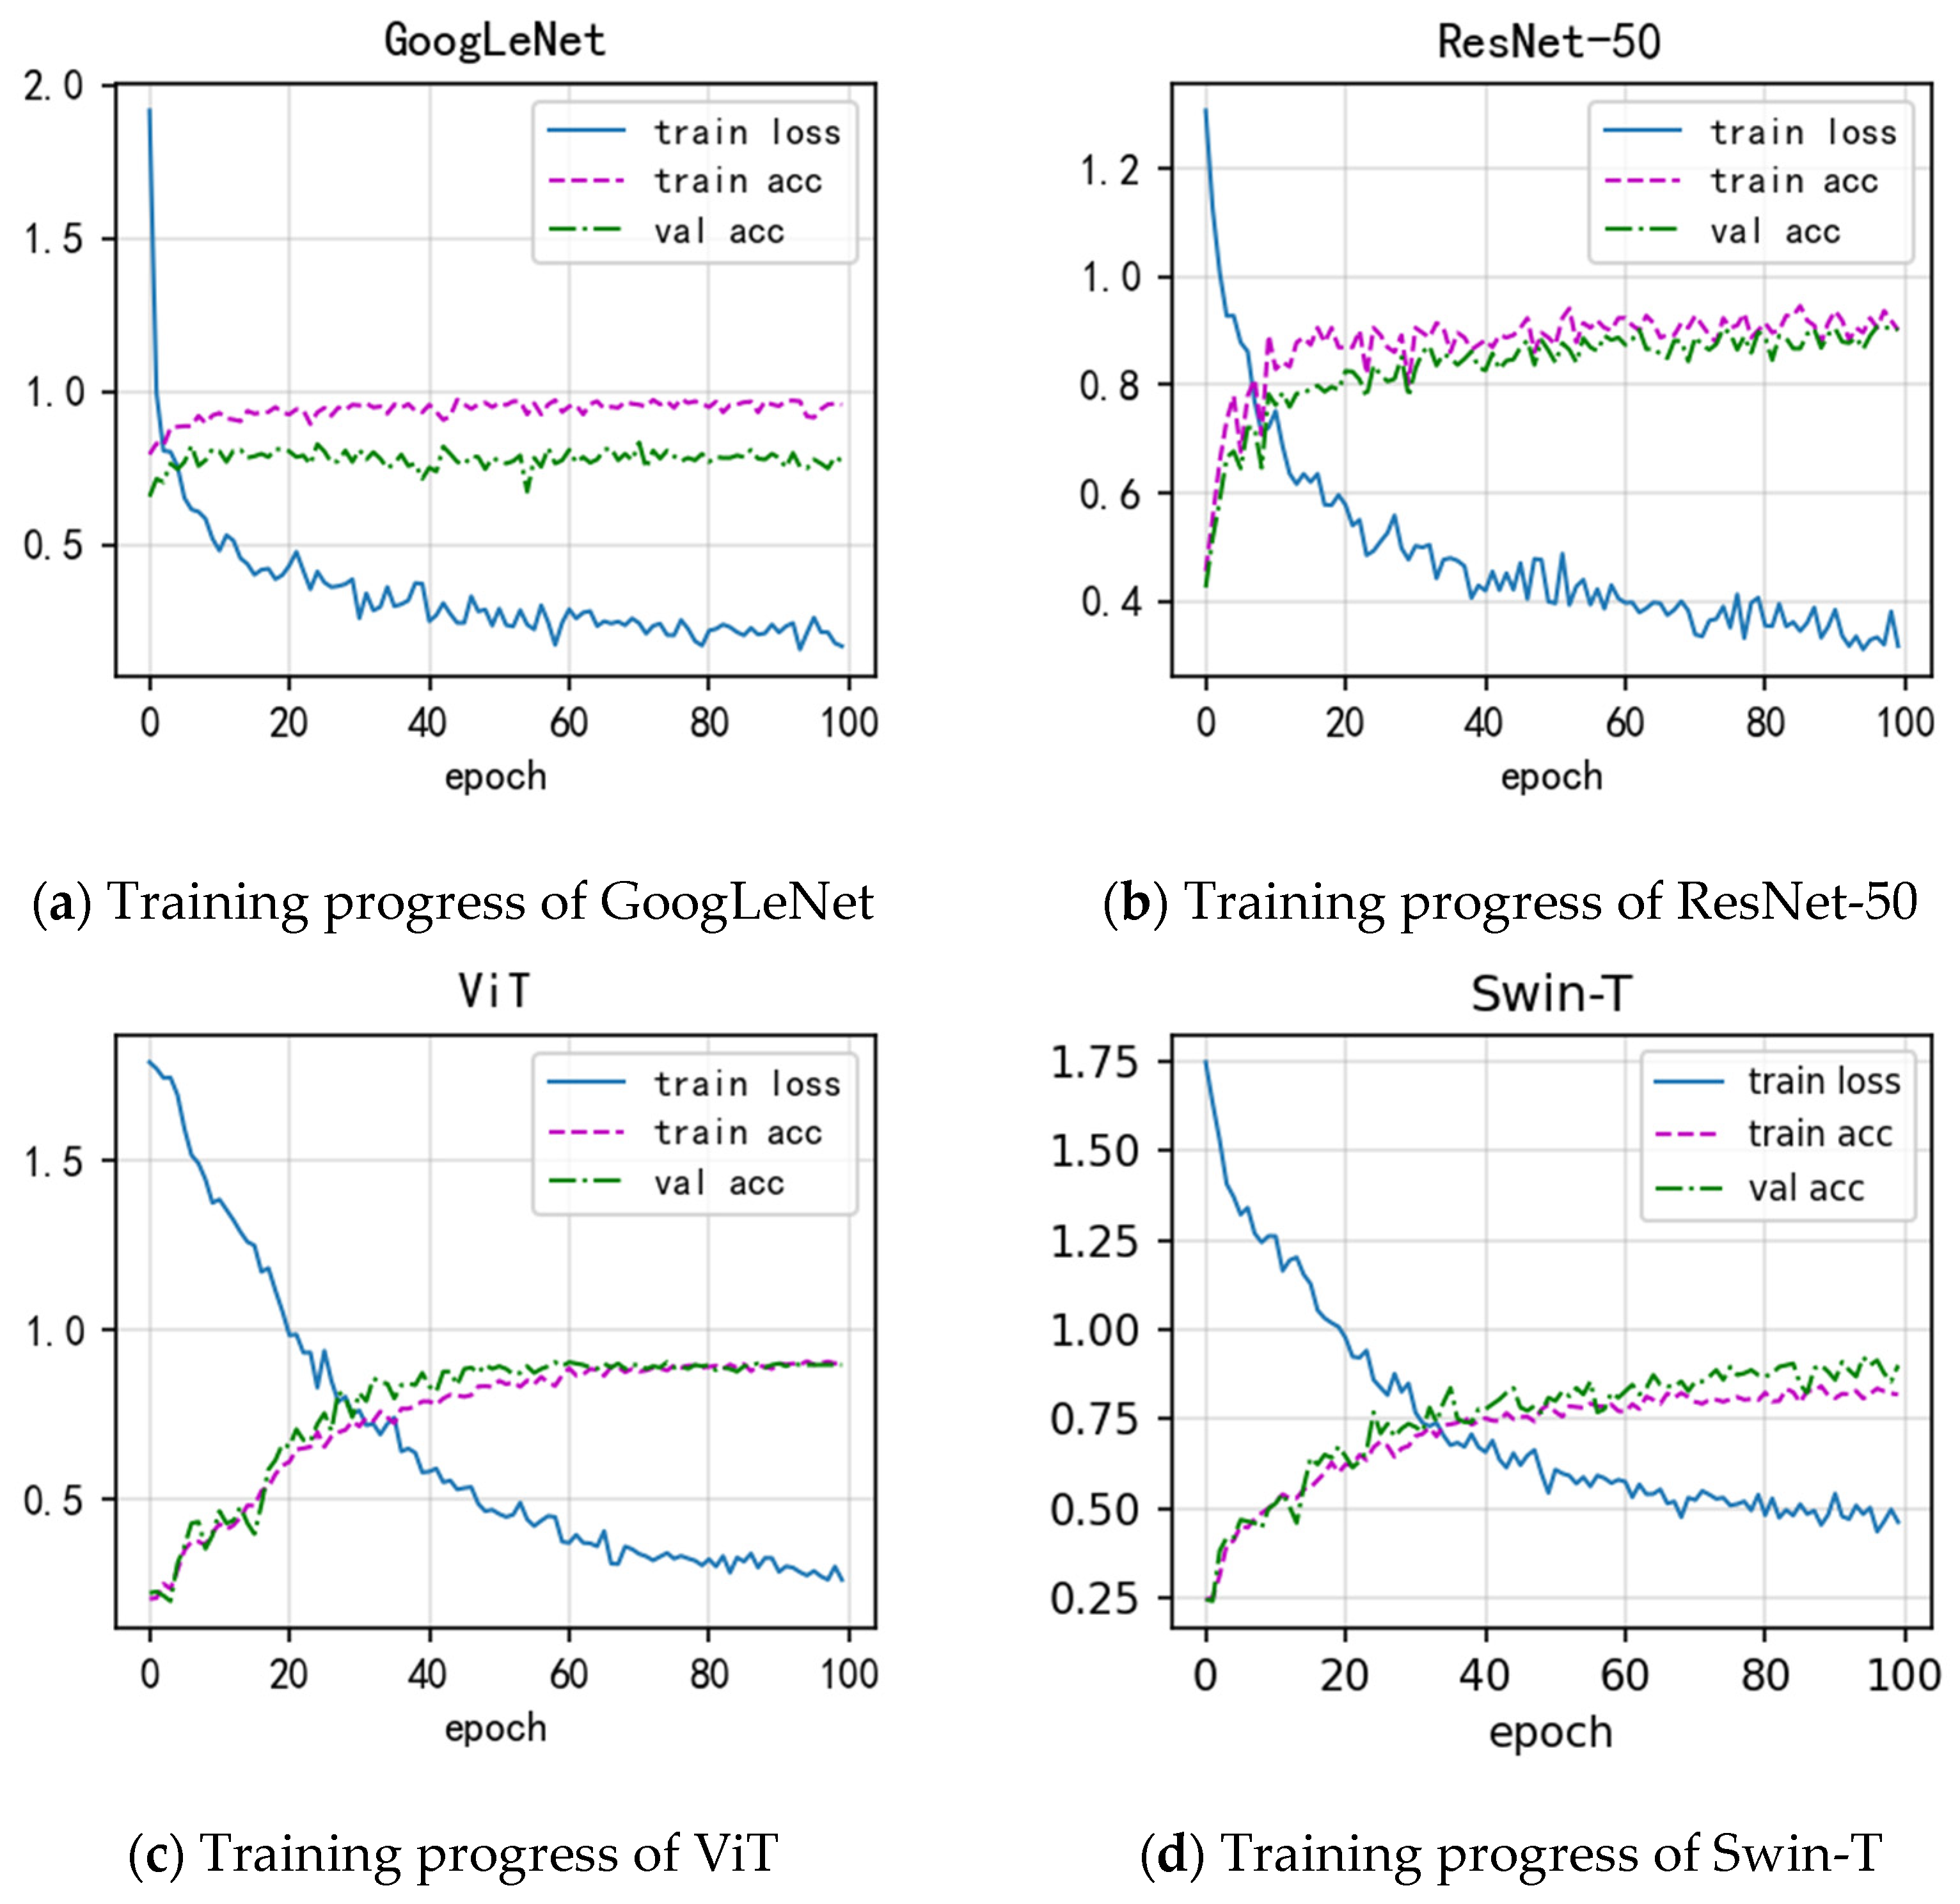
4.3. Comparative Experiment
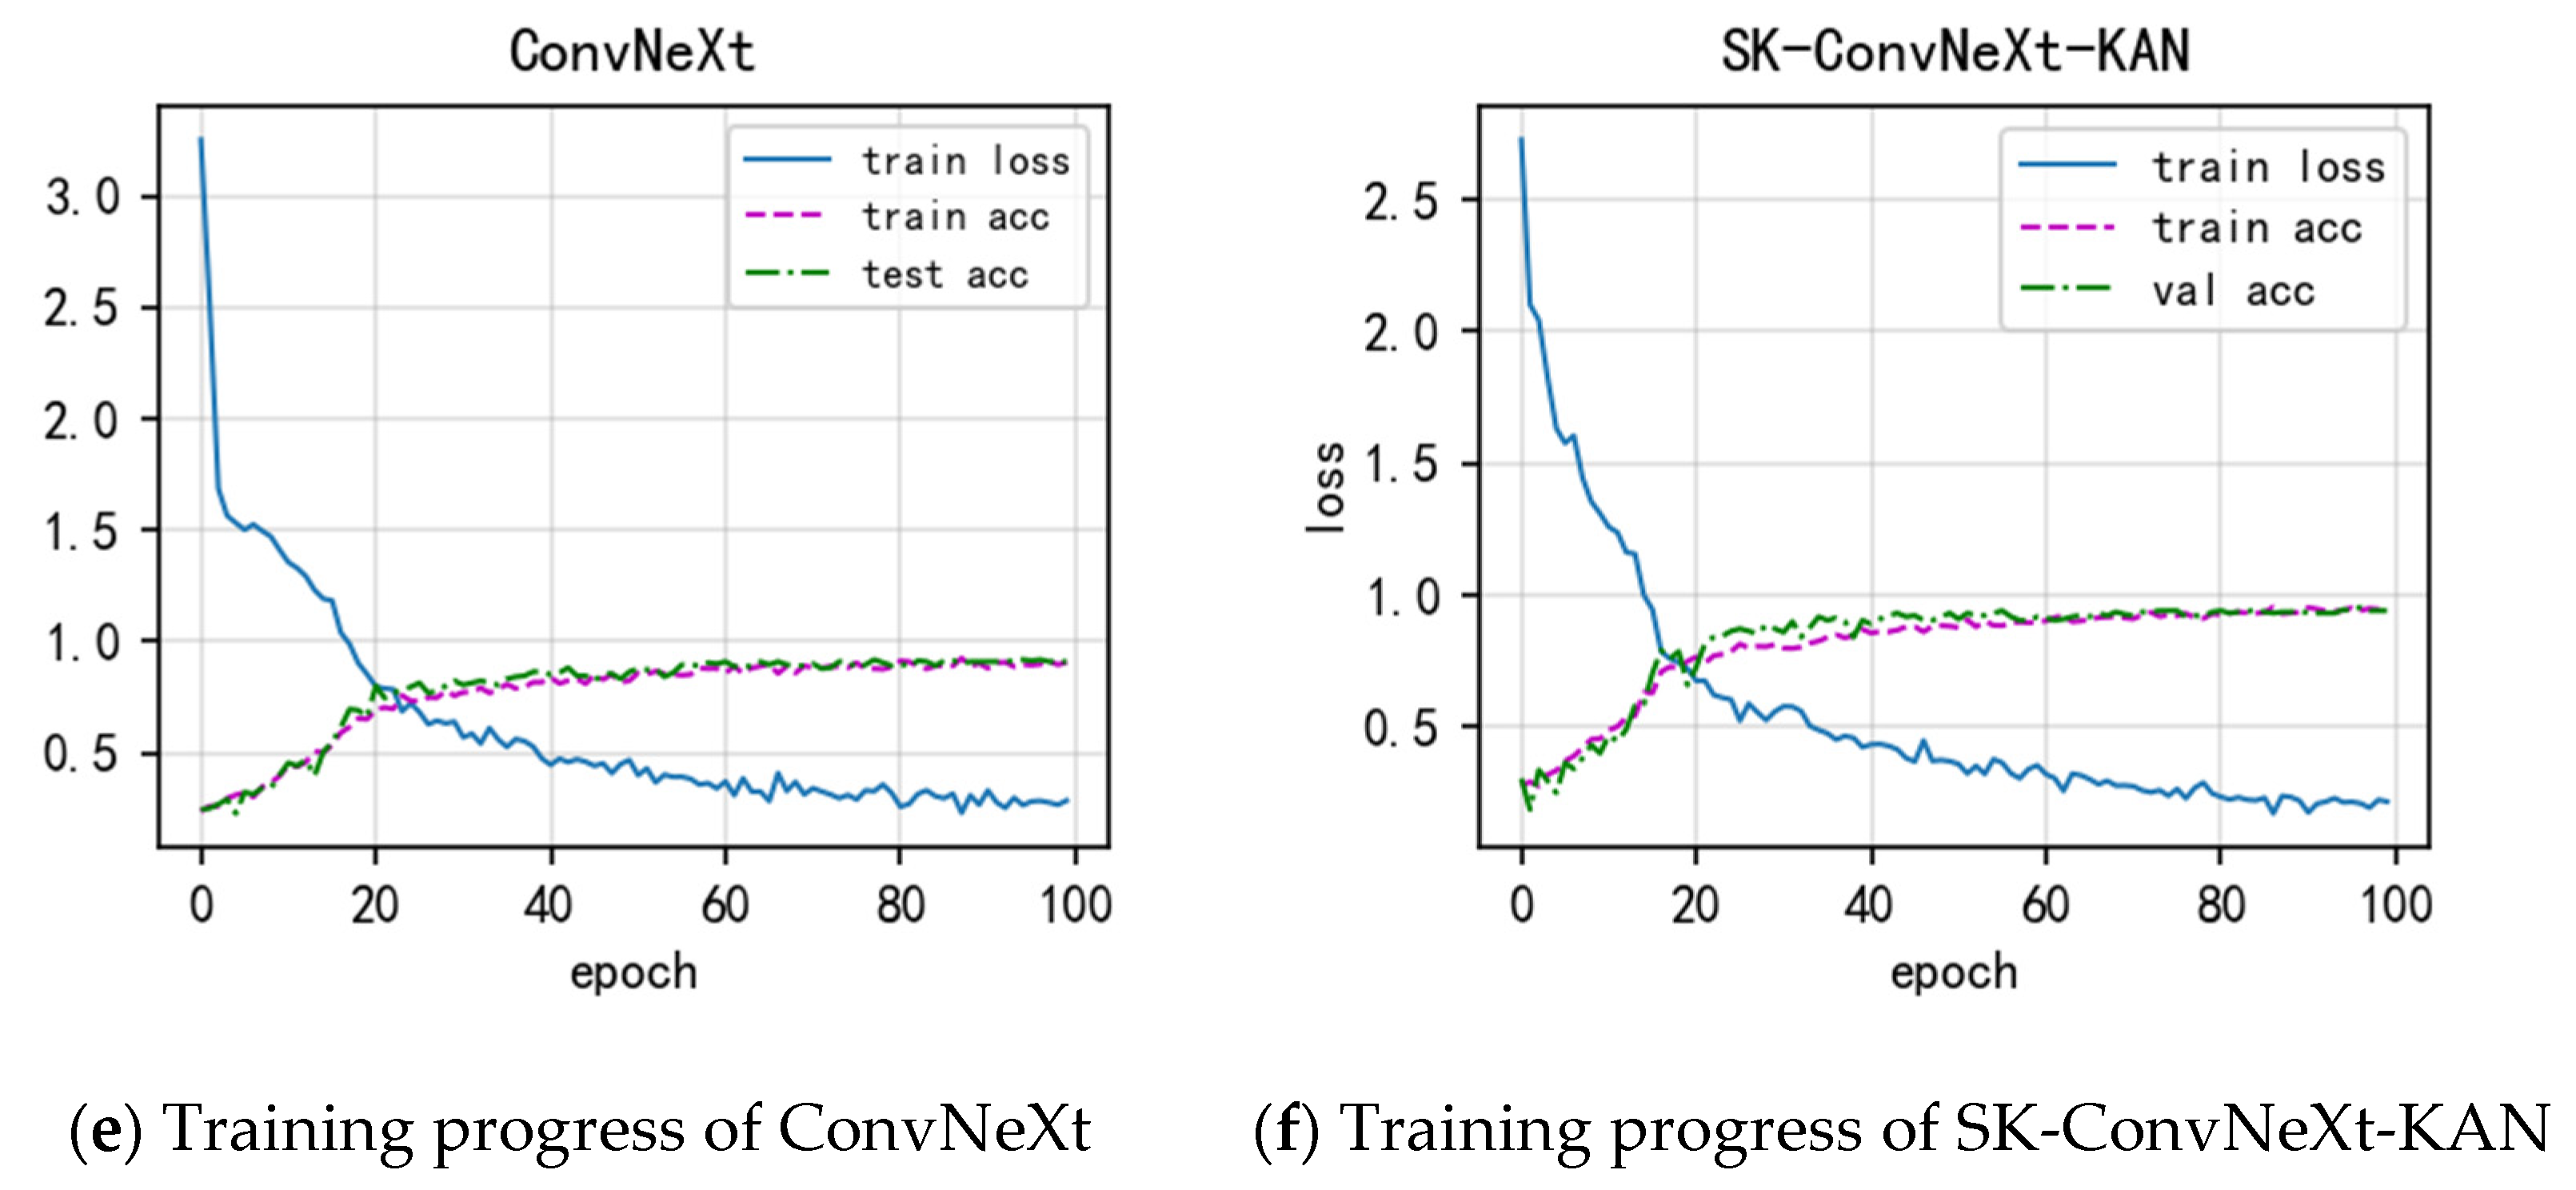
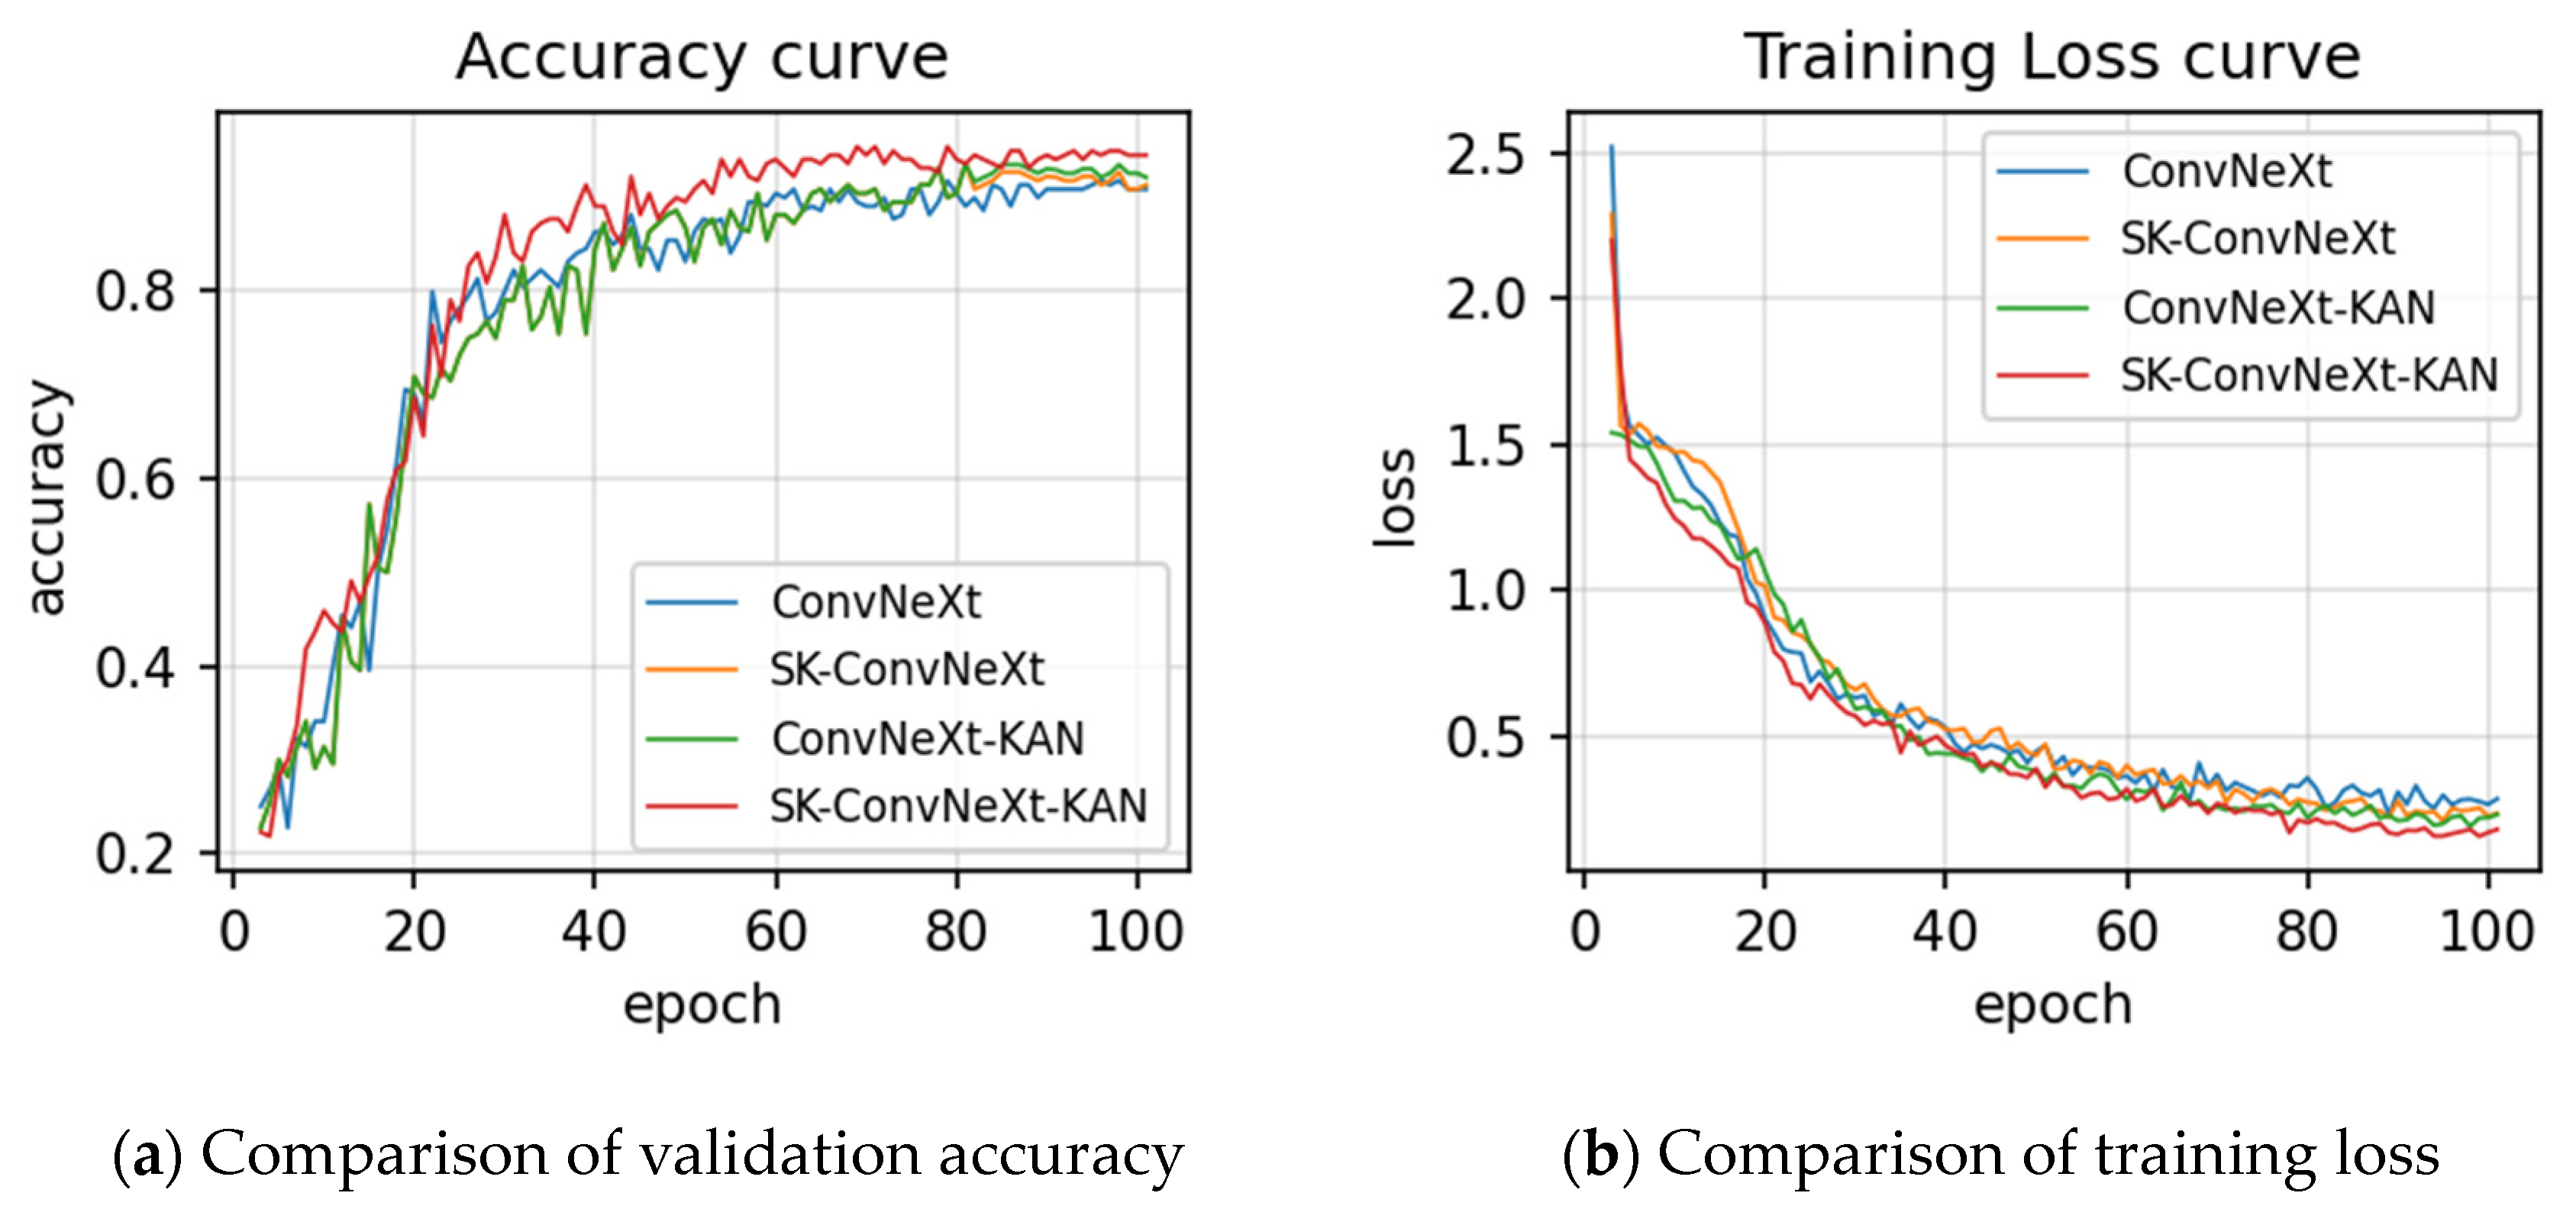
4.4. Ablation Study
- SK-ConvNeXt
- ConvNeXt-KAN
- SK-ConvNeXt-KAN
4.5. Generalization Ability Test
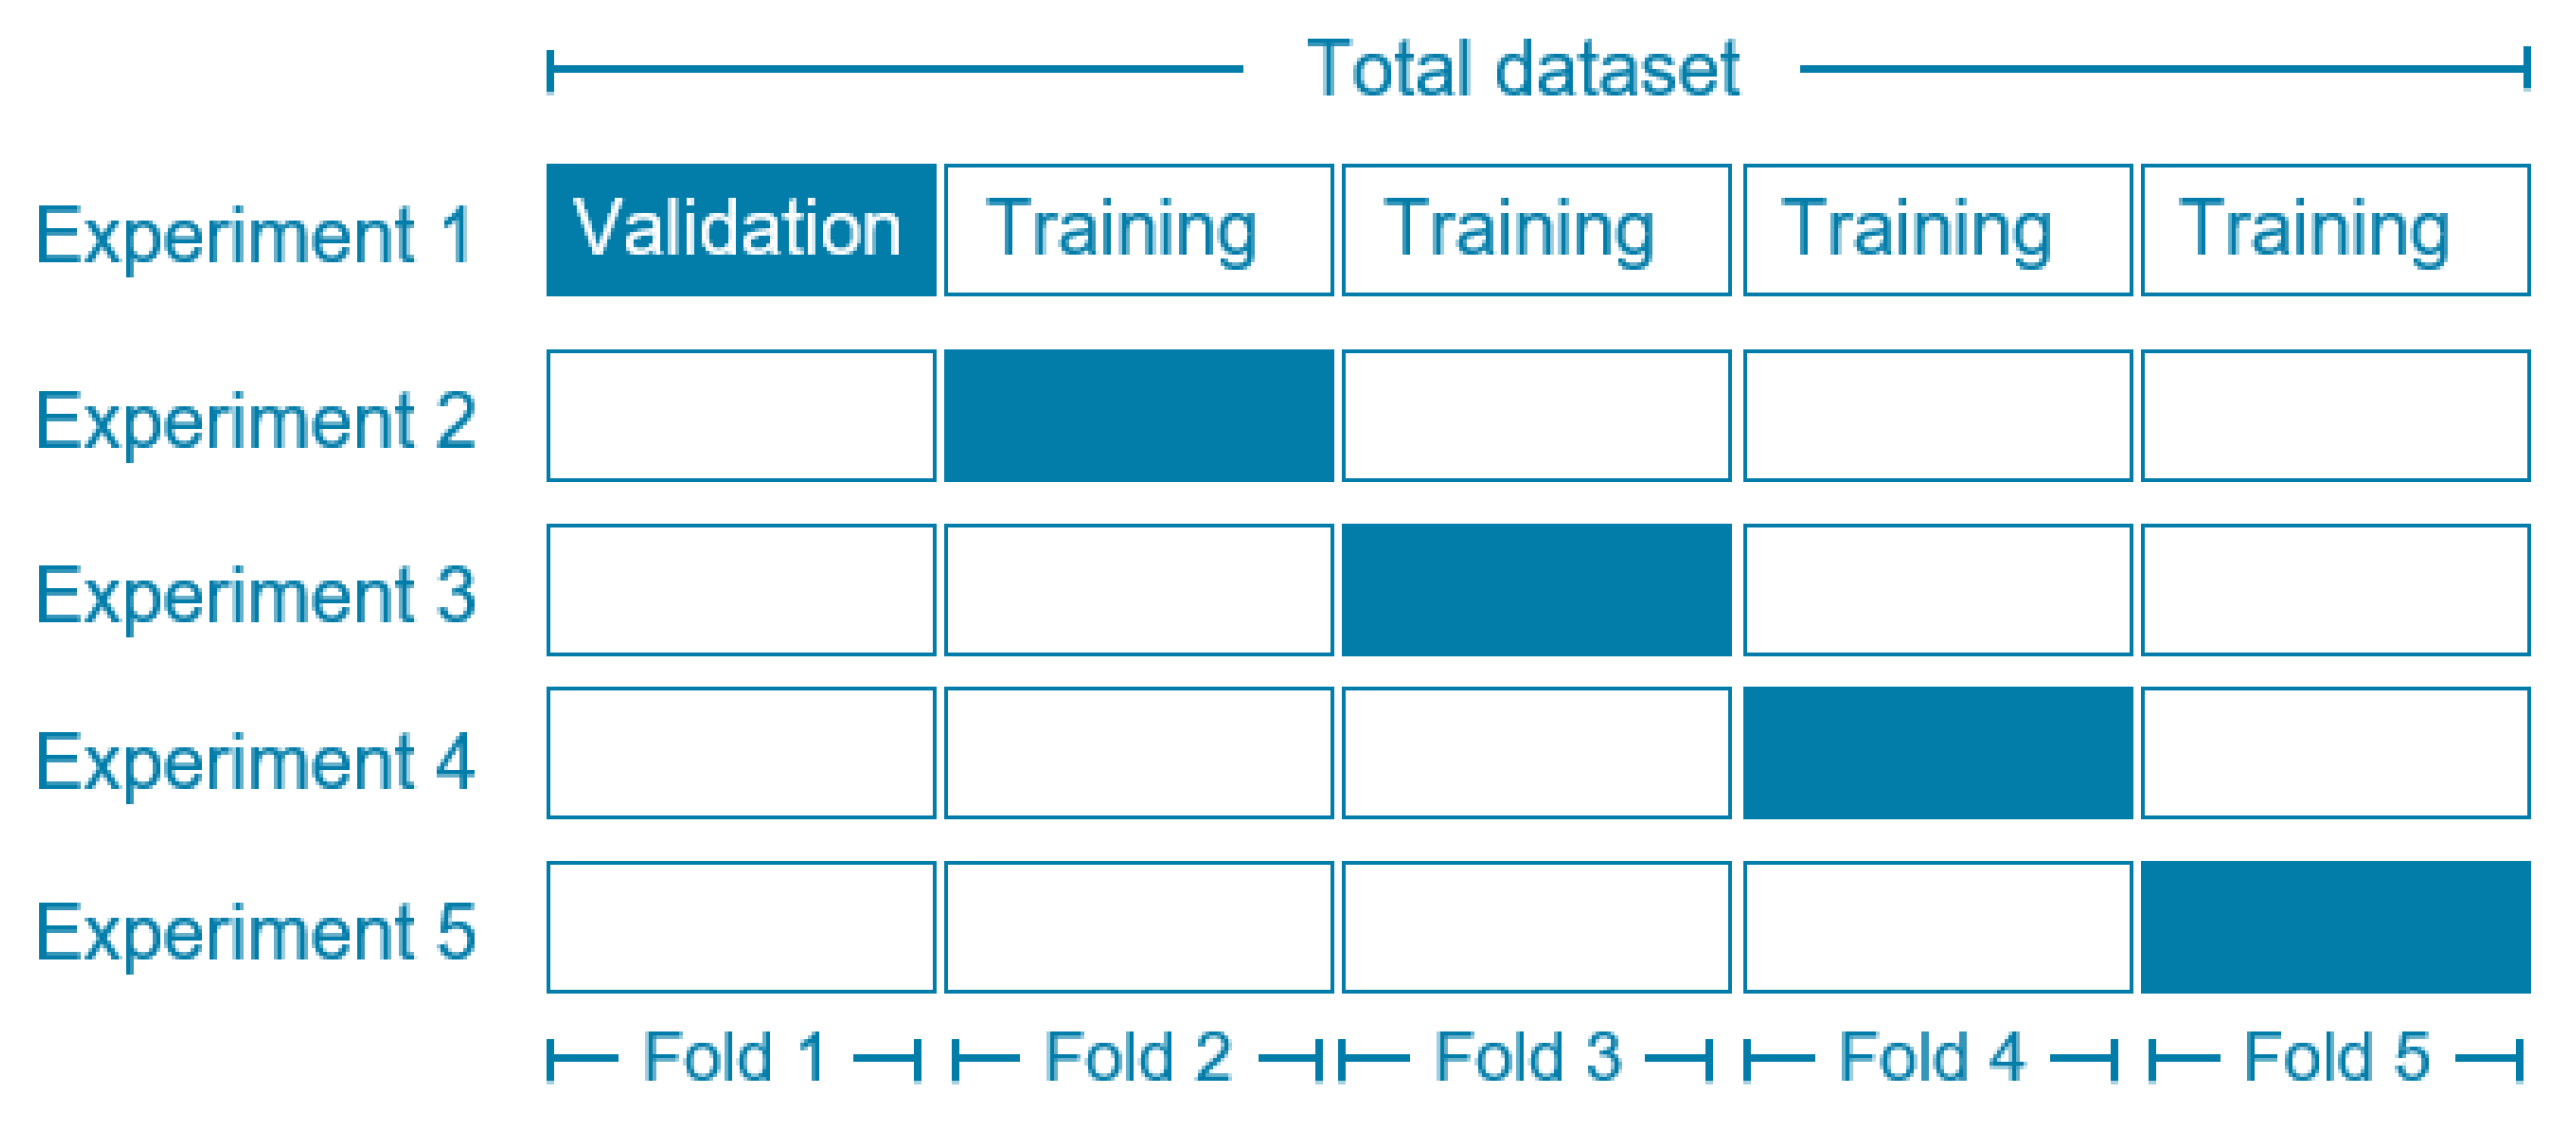
4.5.1. Fivefold Cross-Validation
4.5.2. Cross-Dataset Validation
5. Conclusions
Author Contributions
Funding
Institutional Review Board Statement
Informed Consent Statement
Data Availability Statement
Conflicts of Interest
References
- Liu, X.Q.; Sun, H.X.; Yu, M.R.; Qiu, N.; Li, Y.W.; Liu, F.L.; Chen, G.M. Mechanical analysis of deepwater drilling riser system based on multibody system dynamics. Pet. Sci. 2021, 18, 603–617. [Google Scholar] [CrossRef]
- Wang, Y.; Luan, T.; Gao, D.; Wang, J. Research progress on recoil analysis and control technology of deepwater drilling risers. Energies 2022, 15, 6897. [Google Scholar] [CrossRef]
- Chen, L.; Di, Q.; Lou, E.; Zhou, B.; Zhang, H.; Wang, W.; Hu, F. The visualization of rub-impact characteristics of drill string on casing. J. Pet. Sci. Eng. 2019, 174, 1321–1331. [Google Scholar] [CrossRef]
- Wang, Y.; Gao, D.; Wang, J. Influence of the Heave Motion of a Floating Drilling Platform on the Crossflow Vortex-Induced Vibration of the Deepwater Drilling Riser. SPE J. 2022, 27, 2073–2092. [Google Scholar] [CrossRef]
- Liu, X.; Chen, G.; Chang, Y.; Zhang, L.; Liu, K. Study on Deepwater Drilling Riser Wear. In Proceedings of the Offshore Technology Conference Asia, Kuala Lumpur, Malaysia, 25–28 March 2014; p. OTC-24993. OTC. [Google Scholar]
- Erb, P.R.; Ma, T.C.; Stockinger, M.P. Riser Collapse—A Unique Problem in Deep-Water Drilling. In Proceedings of the SPE/IADC Drilling Conference and Exhibition, New Orleans, LA, USA, 20–23 February 1983; p. SPE-11394. SPE. [Google Scholar]
- Prosser, T. Riser system wear: An unrecognized drilling risk. In Proceedings of the AADE National Drilling Conference, Houston, TX, USA, 27–29 March 2001. [Google Scholar]
- Chang, Y.; Zhang, C.; Wu, X.; Shi, J.; Chen, G.; Ye, J.; Xu, L.; Xue, A. A Bayesian Network model for risk analysis of deepwater drilling riser fracture failure. Ocean Eng. 2019, 181, 112. [Google Scholar] [CrossRef]
- Kilner, A.; Yoshioka, R.; Marcollo, H.; Rogers, R.; Taha, M. Failure in Drilling Riser Auxiliary Line Attributed to VIV. In Proceedings of the International Conference on Offshore Mechanics and Arctic Engineering, San Francisco, CA, USA, 8–13 June 2014; American Society of Mechanical Engineers: New York, NY, USA, 2014; p. V002T08A090. [Google Scholar]
- Poss, G.; Hall, R., Jr. Subsea drilling riser wear: A case history. In Proceedings of the SPE/IADC Drilling Conference and Exhibition, SPE, Dallas, TX, USA, 22–25 October 1995; p. SPE29392-MS. [Google Scholar]
- Bohan, P.; Lang, D.; Williams, D. Utilizing Advanced Digital Technologies to Provide Automated Drilling Riser Fatigue Tracking to Support Condition-Based Maintenance. In Proceedings of the International Conference on Offshore Mechanics and Arctic Engineering, American Society of Mechanical Engineers, Online. 3–7 August 2020; p. V001T01A031. [Google Scholar]
- Huang, C.; Nagarajaiah, S. Robotic MFL sensor and vibration-based deepwater riser monitoring system. In Proceedings of the Offshore Technology Conference, OTC, Houston, TX, USA, 30 April–3 May 2012; p. OTC23487-MS. [Google Scholar]
- Scottini, R.; Quakkelsteijn, H. Inspection of Coated Subsea Piping and Risers. In Proceedings of the 4th Middle East NDT Conference and Exhibition, Manama, Bahrain, 2–5 December 2007; NDT.net. 2008. [Google Scholar]
- Santos, M.F.; Brito, M.O.; Neves, C.; Menegaldo, L.L. Development of an underwater riser inspection robot. Ind. Robot Int. J. 2013, 40, 402–411. [Google Scholar] [CrossRef]
- Nicolas, Y. In-service Riser Inspection System IRIS. In Proceedings of the Offshore Technology Conference Asia, OTC, Kuala Lumpur, Malaysia, 20–23 March 2018; p. D031S017R002. [Google Scholar]
- Neidhardt, D.; Ziegler, R.; Lancaster, J. Drilling Riser Integrity Assurance for Deepwater Floating Drilling. In Proceedings of the Offshore Technology Conference, OTC, Houston, TX, USA, 1–4 May 2017; p. D011S002R004. [Google Scholar]
- Zhou, W.; Fan, J.; Liu, X.; Liu, S. Quantitative research of defects for pipelines based on metal magnetic memory testing. Insight-Non-Destr. Test. Cond. Monit. 2020, 62, 292–299. [Google Scholar] [CrossRef]
- Zhou, W.; Fan, J.; Ni, J.; Liu, S. Variation of magnetic memory signals in fatigue crack initiation and propagation behavior. Metals 2019, 9, 89. [Google Scholar] [CrossRef]
- Li, W.; Chen, G.; Yin, X.; Li, X.; Liu, J.; Zhao, J.; Zhao, J. Visual and intelligent identification methods for defects in underwater structure using alternating current field measurement technique. IEEE Trans. Ind. Inform. 2021, 18, 3853–3862. [Google Scholar]
- Geng, L.; Dong, S.; Qian, W.; Peng, D. Image Classification Method Based on Improved Deep Convolutional Neural Networks for the Magnetic Flux Leakage (MFL) Signal of Girth Welds in Long-Distance Pipelines. Sustainability 2022, 14, 12102. [Google Scholar] [CrossRef]
- Hou, W.; Wei, Y.; Jin, Y.; Zhu, C. Deep Features Based on a DCNN Model for Classifying Imbalanced Weld Flaw Types. Measurement 2019, 131, 482–489. [Google Scholar] [CrossRef]
- Mao, W.; Ding, L.; Tian, S.; Liang, X. Online Detection for Bearing Incipient Fault Based on Deep Transfer Learning. Measurement 2020, 152, 107278. [Google Scholar] [CrossRef]
- Abu, M.; Amir, A.; Lean, Y.; Zahri, N.; Azemi, S. The Performance Analysis of Transfer Learning for Steel Defect Detection by Using Deep Learning. J. Phys. Conf. Ser. 2021, 1755, 012041. [Google Scholar] [CrossRef]
- Ma, J.; Liu, M.; Hu, S.; Fu, J.; Chen, G.; Yang, A. A Novel CNN Ensemble Framework for Bearing Surface Defects Classification Based on Transfer Learning. Meas. Sci. Technol. 2022, 34, 025902. [Google Scholar] [CrossRef]
- Wu, Y.; Wang, Y.; Li, D.; Zhang, J. Two-Step Detection of Concrete Internal Condition Using Array Ultrasound and Deep Learning. NDT E Int. 2023, 139, 102945. [Google Scholar] [CrossRef]
- Wu, Y.; Zhang, J.; Gao, C.; Xu, J. Internal Defect Detection, Quantification, and Three-Dimensional Localization Based on Impact Echo and Classification Learning Model. Measurement 2023, 218, 113153. [Google Scholar] [CrossRef]
- Ding, J.; Cai, B.; Li, W.; Yin, X.; Li, X.; Chen, Q.; Wang, G. 3D Visual Reconstruction of Corrosion in Underwater Structures Using Alternating Current Field Measurement Technique. Ocean Eng. 2024, 308, 118294. [Google Scholar]
- Wei, M.; Tu, F.; Zhang, P.; Jiang, L.; Jiang, P.; Jing, Y. Composite Excitation Multi-Extension Direction Defect Magnetic Flux Leakage Detection Technology. J. Meas. Sci. Instrum. 2022, 13, 156–165. [Google Scholar] [CrossRef]
- Geng, H.; Xia, H.; Wang, G. Study on Defect Location Method of Inner and Outer Wall of Pipeline during High-Speed Magnetic Flux Leakage Testing. Chin. J. Sci. Instrum. 2022, 43, 70–78. [Google Scholar]
- Chen, H.; Wang, C.; Zuo, X. Research on Methods of Defect Classification Based on Metal Magnetic Memory. NDT E Int. 2017, 92, 82–87. [Google Scholar] [CrossRef]
- Liu, Z.; Mao, H.; Wu, C.Y.; Feichtenhofer, C.; Darrell, T.; Xie, S. A ConvNet for the 2020s. In Proceedings of the IEEE/CVF Conference on Computer Vision and Pattern Recognition, New Orleans, LA, USA, 19–24 June 2022; pp. 11976–11986. [Google Scholar]
- Li, X.; Wang, W.; Hu, X.; Yang, J. Selective Kernel Networks. In Proceedings of the IEEE/CVF Conference on Computer Vision and Pattern Recognition, Long Beach, CA, USA, 16–20 June 2019; pp. 510–519. [Google Scholar]
- Liu, Z.; Wang, Y.; Vaidya, S.; Ruehle, F.; Halverson, J.; Soljačić, M.; Hou, T.Y.; Tegmark, M. KAN: Kolmogorov-Arnold Networks. arXiv 2024, arXiv:2404.19756. [Google Scholar]
- Naidu, G.; Zuva, T.; Sibanda, E.M. A Review of Evaluation Metrics in Machine Learning Algorithms. In Proceedings of the Computer Science On-Line Conference, Cham, Switzerland, 26–28 April 2023; Springer International Publishing: Cham, Switzerland, 2023; pp. 15–25. [Google Scholar]
- Kee, E.; Chong, J.J.; Choong, Z.J.; Lau, M. A Comparative Analysis of Cross-Validation Techniques for a Smart and Lean Pick and Place Solution with Deep Learning. Electronics 2023, 12, 2371. [Google Scholar] [CrossRef]
- Li, Z.; Wei, X.; Hassaballah, M.; Li, Y.; Jiang, X. A Deep Learning Model for Steel Surface Defect Detection. Complex Intell. Syst. 2024, 10, 885–897. [Google Scholar] [CrossRef]
- Zhou, M.; Lu, W.; Jia, J.; Wang, Y. Defect Detection in Steel Using a Hybrid Attention Network. Sensors 2023, 23, 6982. [Google Scholar] [CrossRef]


| Institution | Detector | Method | Type | Features |
|---|---|---|---|---|
| Dutch scholar | RTD | Pulsed Eddy Current | External inspection | Water depth of 150 m |
| Brazil | SIRIS | Visual, Ultrasonic, Radiographic | External inspection | Water depth of 250 m |
| TechnipFMC | IRIS | Electromagnetic, Ultrasonic, and X-ray Inspection | External inspection | Production platforms |
| Weatherford | ORIS | Ultrasonic Testing | Internal inspection | In situ inspection |
| UPC | ACFM | Alternating Current Field Measurement | External inspection | In situ inspection |
| CUP | MMM | Metal Magnetic Memory | Internal inspection | Offline inspection |
| Output Size | ResNet-50 | ConvNeXt-T | |
|---|---|---|---|
| stem | 56 × 56 | 7 × 7, 64, stride 2 3 × 3 max pool, stride 2 | 4 × 4, 96, stride 4 |
| Stage1 | 28 × 28 | ||
| Stage2 | 14 × 14 | ||
| Stage3 | 56 × 56 | ||
| Stage4 | 7 × 7 | ||
| FLOPS |
| Experimental | Configuration | Training Options | Value |
|---|---|---|---|
| Deep Learning Frameworks | PyTorch 1.10.0 | Optimizer | AdamW |
| Programming Language | Python 3.8 | Loss Function | Cross-Entropy |
| CPU | Intel® Core (TM) I5-13500H | Epoch | 100 |
| GPU | NVIDIA GeForce RTX 3060 (6 GB) | Batch size | 16 |
| RAM | 32 GB | Initial Learning Rate | 0.0005 |
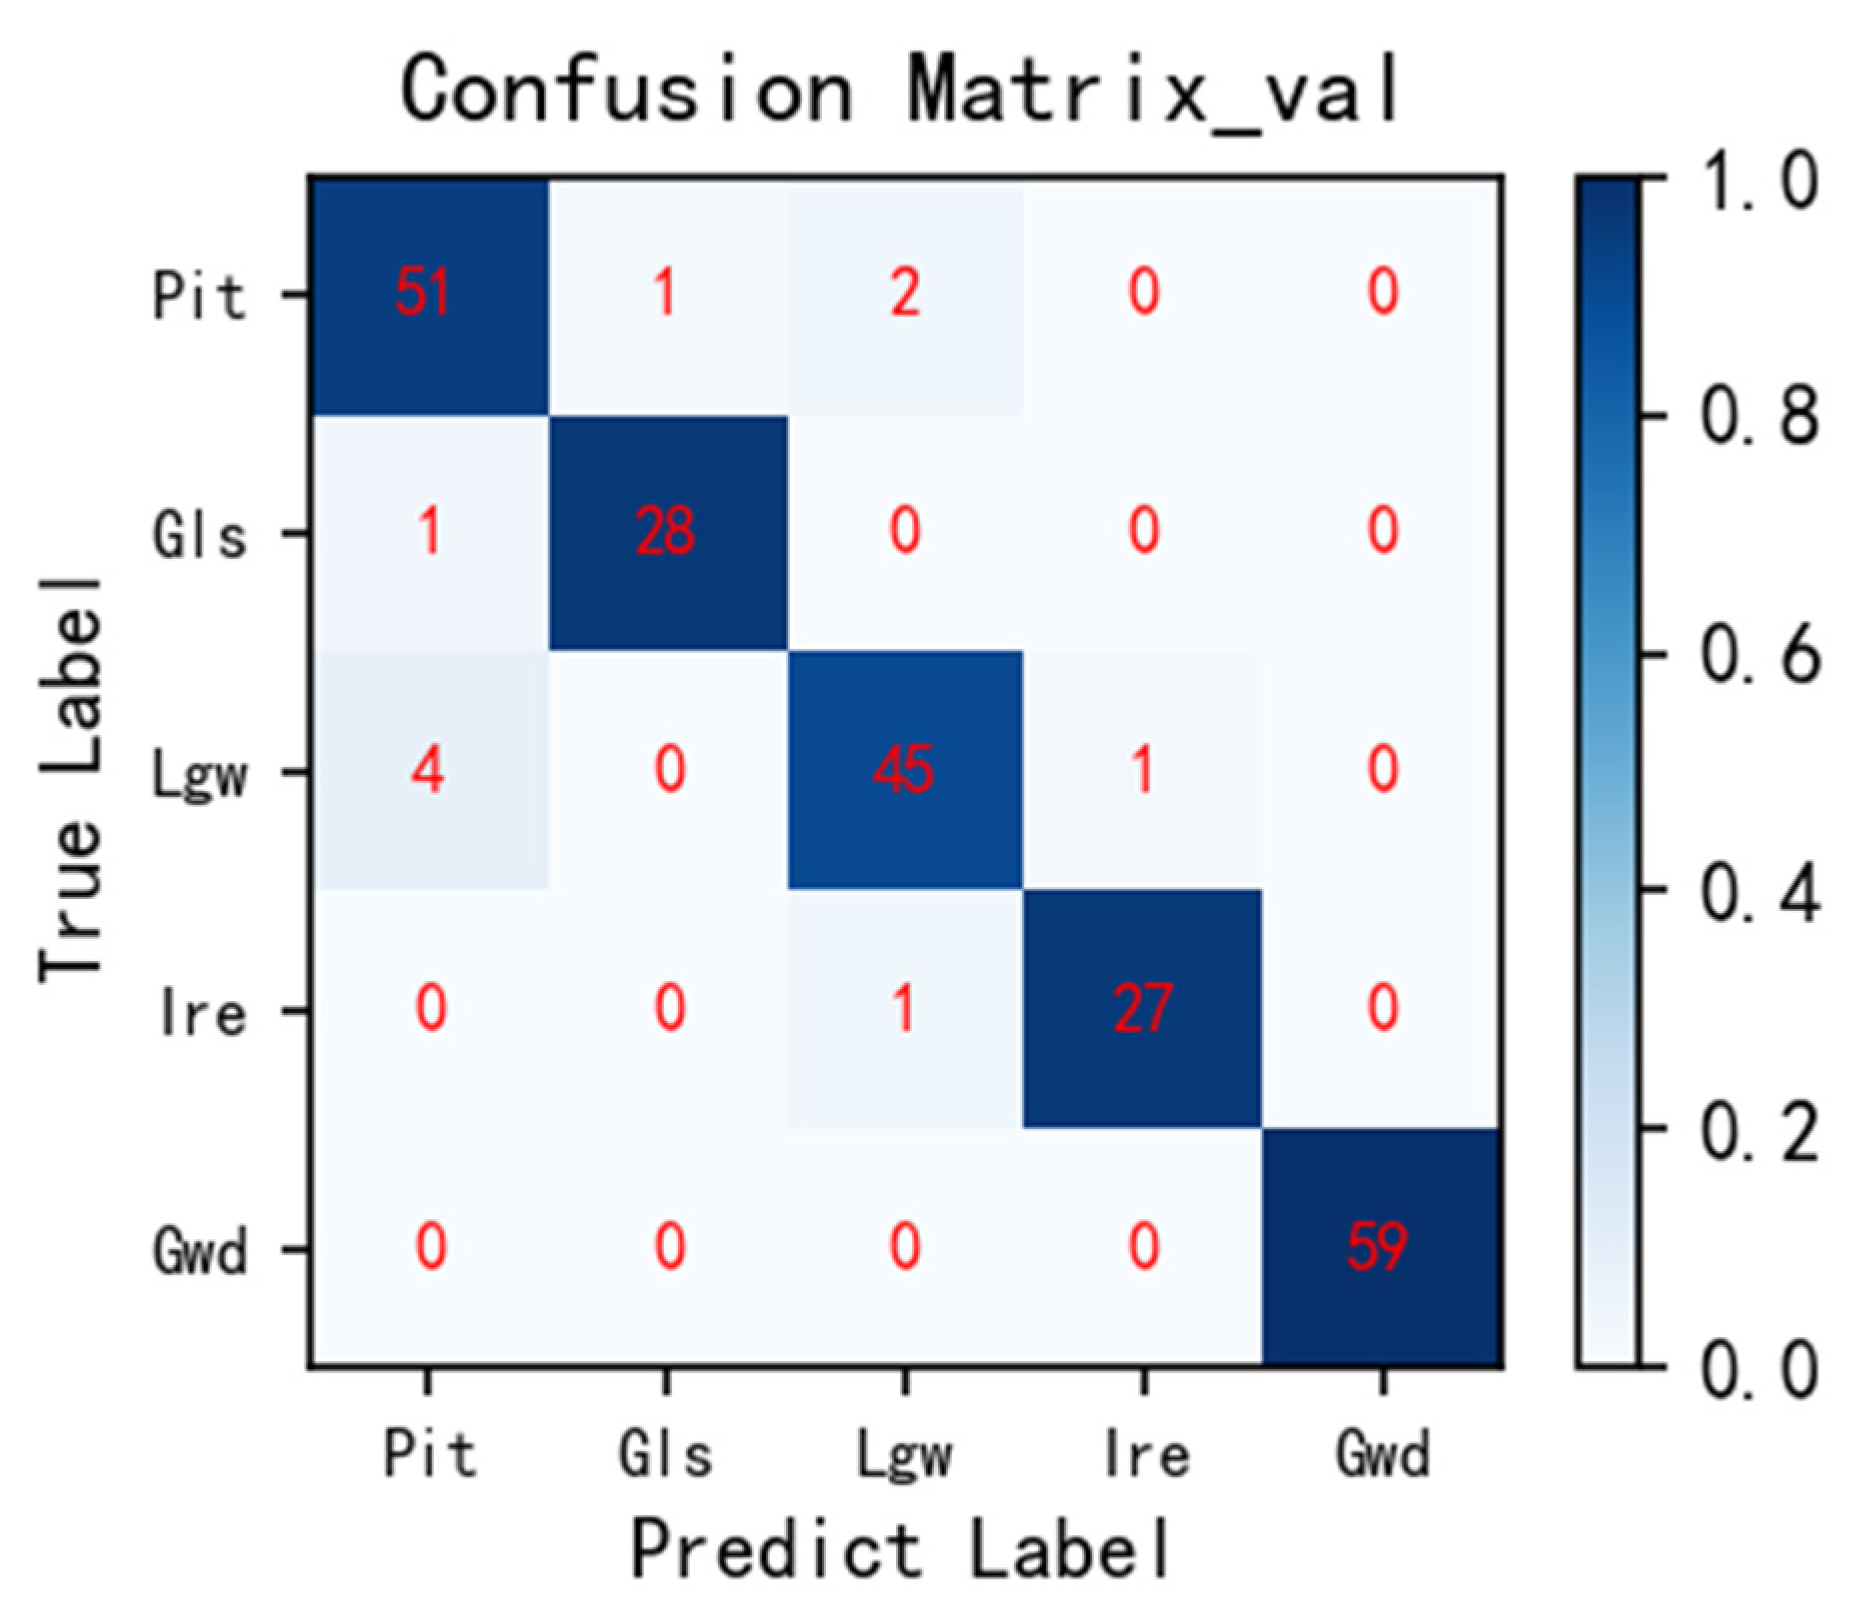
| No. | Label | Defect Types | Number | Proportion |
|---|---|---|---|---|
| 1 | Pit | Pitting | 270 | 24.3% |
| 2 | Gls | Groove Loss | 148 | 13.3% |
| 3 | Lgw | Longitudinal Wear | 252 | 22.7% |
| 4 | Ire | Irregular Flaw | 141 | 12.7% |
| 5 | Gwd | Girth Weld | 299 | 26.9% |
| Total | 1110 | 100% | ||
| Model | Training Accuracy (%) | Validation Accuracy (%) |
|---|---|---|
| GoogLeNet | 97.6 | 83.4 |
| ResNet-50 | 94.6 | 90.7 |
| ViT | 90.4 | 90.4 |
| Swin-T | 84.1 | 92.3 |
| ConvNeXt | 91.2 | 91.8 |
| SK-ConvNeXt-KAN | 94.5 | 95.4 |
| Model | Accuracy (%) | Precision (%) | Recall (%) | F1 Score |
|---|---|---|---|---|
| Baseline | 91.8 | 88.43 | 88.55 | 0.884 |
| SK-ConvNeXt | 93.6 | 90.86 | 90.57 | 0.907 |
| ConvNeXt-KAN | 92.7 | 90.03 | 89.13 | 0.895 |
| SK-ConvNeXt-KAN | 95.4 | 91.68 | 91.88 | 0.917 |
| Experiment | Accuracy (%) | Precision (%) | Recall (%) | F1 Score |
|---|---|---|---|---|
| Fold-1 | 94.55 | 91.55 | 91.53 | 0.915 |
| Fold-2 | 95.45 | 93.66 | 92.50 | 0.930 |
| Fold-3 | 95.00 | 92.70 | 92.54 | 0.926 |
| Fold-4 | 94.09 | 91.01 | 91.13 | 0.910 |
| Fold-5 | 95.91 | 93.93 | 92.61 | 0.932 |
| Average | 95.00 | 92.57 | 92.06 | 0.923 |
| No. | Label | Defect Types | Train_Num | Validate_Num |
|---|---|---|---|---|
| 1 | In | Inclusions | 240 | 60 |
| 2 | Pa | Patches | 240 | 60 |
| 3 | Cr | Cracks | 240 | 60 |
| 4 | PS | Pitted Surfaces | 240 | 60 |
| 5 | RS | Rolled-in Scale | 240 | 60 |
| 6 | Sc | Scratches | 240 | 60 |
| Total | 1800 | |||
Disclaimer/Publisher’s Note: The statements, opinions and data contained in all publications are solely those of the individual author(s) and contributor(s) and not of MDPI and/or the editor(s). MDPI and/or the editor(s) disclaim responsibility for any injury to people or property resulting from any ideas, methods, instructions or products referred to in the content. |
© 2024 by the authors. Licensee MDPI, Basel, Switzerland. This article is an open access article distributed under the terms and conditions of the Creative Commons Attribution (CC BY) license (https://creativecommons.org/licenses/by/4.0/).
Share and Cite
Liu, X.; Fan, J. Research on Nondestructive Testing Technology for Drilling Risers Based on Magnetic Memory and Deep Learning. Sustainability 2024, 16, 7389. https://doi.org/10.3390/su16177389
Liu X, Fan J. Research on Nondestructive Testing Technology for Drilling Risers Based on Magnetic Memory and Deep Learning. Sustainability. 2024; 16(17):7389. https://doi.org/10.3390/su16177389
Chicago/Turabian StyleLiu, Xiangyuan, and Jianchun Fan. 2024. "Research on Nondestructive Testing Technology for Drilling Risers Based on Magnetic Memory and Deep Learning" Sustainability 16, no. 17: 7389. https://doi.org/10.3390/su16177389