Article

Trends in Emissions from Road Traffic in Rapidly Urbanizing Areas

College of Transportation and Civil Engineering, Fujian Agriculture and Forestry University, Fuzhou 350002, China
*
Author to whom correspondence should be addressed.
Sustainability 2024, 16(17), 7400; https://doi.org/10.3390/su16177400
Submission received: 18 July 2024 / Revised: 12 August 2024 / Accepted: 19 August 2024 / Published: 28 August 2024

Abstract

:
The process of urbanization has facilitated the exponential growth in demand for road traffic, consequently leading to substantial emissions of CO2 and pollutants. However, with the development of urbanization and the expansion of the road network, the distribution and emission characteristics of CO2 and pollutant emissions are still unclear. In this study, a bottom-up approach was initially employed to develop high-resolution emission inventories for CO2 and pollutant emissions (NOx, CO, and HC) from primary, secondary, trunk, and tertiary roads in rapidly urbanizing regions of China based on localized emission factor data. Subsequently, the standard road length method was utilized to analyze the spatiotemporal distribution of CO2 emissions and pollutant emissions across different road networks while exploring their spatiotemporal heterogeneity. Finally, the influence of elevation and surface vegetation cover on traffic-related CO2 and pollutant emissions was taken into consideration. The results indicated that CO2, CO, HC, and NOx emissions increased significantly in 2020 compared to those in 2017 on trunk roads, and the distribution of CO2 and pollutant emissions in Fuzhou was uneven; in 2017, areas of high emissions were predominantly concentrated in the central regions with low vegetation coverage levels and low topography but expanded significantly in 2020. This study enhances our comprehension of the spatiotemporal variations in carbon and pollutant emissions resulting from regional road network expansion, offering valuable insights and case studies for regions worldwide undergoing similar infrastructure development.

1. Introduction

Global warming influences the survival and development of humankind and has become a major challenge faced by all countries worldwide [1,2]. Recent research shows that global surface temperatures have risen faster in the past 50 years [3]. Each trillion tons of CO2 emissions leads to a 0.45 °C temperature rise, making it a key contributor to global warming [4]. A 2 °C rise in global temperatures will lead to more frequent extreme heat events that can threaten human life, production, and health [5]. China, as the largest developing country, has generated high CO2 emissions during the process of its economic construction. China became the top CO2 emitter in 2006, accounting for 31% of global emissions by 2020 [6], indicative of a major contributor to carbon emissions and expected to increase [7]. By 2030, it is projected that the transport sector’s CO2 emissions will exceed four times the levels observed in 2000 [8]. In addition to the grave issue of CO2 emissions, it is imperative not to overlook the pollutant emissions generated from the transport sector [9,10]. In 2021, 35.7% of China’s 339 cities and above could not reach the standard of urban ambient air quality [11]. Being in an environment with substandard air quality for long durations hampers the health of the human respiratory system, resulting in chronic bronchitis, bronchitis, and respiratory disorders, seriously endangering human health [12,13,14]. In response to these problems, China has implemented a serious of laws to regulate CO2 and pollutant emissions in order to address environmental issues, which emphasizes the need to regulate CO2 emissions and pollutants as a priority [15,16,17,18].
In the entire transportation sector, road transportation has become an important contributor to CO2 emissions [8,19]. Road transportation is responsible for 24% of CO2 emissions from the transportation sector, with road passenger transportation being the main contributor [20]. Urbanization has led to faster road construction, worsening environmental issues related to urban road networks. However, the relationship between the emission characteristics of road networks and the built environment resulting from urban construction remains unclear. Although traffic emissions resulting from road network construction have been investigated, most of these studies were conducted at a macroscopic scale, such as province or country level [7,21]. Some scholars have studied the built environment at a micro-level; however, there has been little attention given to different types of roads [22] or to the influence of environmental factors on vehicle emissions [23]. Macro-level studies can only capture the changing patterns of overall regional emissions and do not consider the specific dynamics of environmental issues emerging due to urban development. Furthermore, the majority of studies pertaining to the built environment have not considered the evolutionary characteristics of emissions generated by the built environment within specific urban road networks. However, due to substantial variations in the capacity and velocity of different urban roads, there are also notable disparities in emissions generated by distinct road types. As acknowledged universally, a one-size-fits-all approach is inadequate. Hence, for more targeted control of carbon and pollutant emissions from road traffic, comprehensive research on diverse road categories should be conducted. Consequently, studying the spatial and temporal distribution patterns of carbon and pollutant emissions in various road types holds immense practical significance for relevant authorities to formulate more detailed measures for emission reduction [24,25]. Moreover, it contributes to the realization of sustainable urban development amidst rapid economic growth.
In conclusion, to conduct an in-depth analysis of carbon and pollutant emissions on specific roads within the city, with the aim of promoting sustainable urban development, the purpose of this study is to address the following issues: (1) How will urban construction affect the environment over time? (2) What is the impact of the built environment on urban road networks, in terms of space and time? (3) What disparities exist in the effects of road expansion on CO2 and pollutant emissions? To fill the aforementioned research gaps and questions, this study employed a bottom-up approach to establish CO2, HC, NOx, and CO emission inventories at a high resolution. Additionally, this study delved into the spatial and temporal distribution patterns of traffic emissions in specific road networks associated with urban construction projects. Relevant policy recommendations can be proposed to address traffic-related environmental challenges arising from urban construction and expansion based on the findings of this study.

2. Literature Review

2.1. Emission Inventory Research

The emissions of CO2 and pollutants within a region can be effectively quantified to enable a more accurate understanding of emission trends. Thus, the establishment of emission inventories has received significant research attention in recent years [26,27,28,29]. Vehicle emission factor data have been obtained using methods such as on-road measurements, laboratory testing, or model simulations, and these have been used to create corresponding emission inventories. For example, Xu et al. derived vehicle emission factors by considering parameters such as vehicle fuel consumption and conversion coefficients for emission factors. Utilizing the emission factor methodology, a high-resolution inventory of CO emissions from vehicles was established [28]. Zhang et al. investigated the latest VOC and IVOC emission factor data obtained through road measurements and chassis dynamometer tests and constructed an emission inventory in Beijing for 2020–2035 [30]. Das et al. conducted an experimental study, ascertained the emission factors of trucks and various types of buses, and developed an emission inventory for vehicles in Nepal [31]. Rojas et al. utilized the COPERT model to calculate the emission factors for various vehicle types, resulting in the creation of a detailed pollutant emission inventory [29]. Jiang et al. also used the COPERT model to create pollutant emission inventories in 152 cities in the research area [32]. Huy et al. collected vehicle technical information distribution data through parking surveys, traffic video surveys, and GPS surveys, after establishing a vehicle emission inventory for Greater Yangon based on the international vehicle emission model (IVE) model in 2015 [33]. Hakkim et al. quantified the emission factors of volatile organic compounds in vehicles, using different fuels in India and established the emission inventories of these compounds [34]. Patiño-Aroca et al. applied a top-down approach to establish detailed emission inventories for Guayaquil’s roads, focusing on vehicles with high emissions [35]. Chen et al. constructed the Moves-Beijing model and established inventories of the spatiotemporal characteristics of ammonia emissions from different vehicle types, filling the gap in ammonia control policies in Beijing [36].
To sum up, most scholars have mainly established macro-level emission inventories, such as those at the city level or national level [37,38], whereas only a few scholars have established vehicle emission inventories for different road types (primary, secondary, trunk, and tertiary roads). However, conducting emission studies on specific roads can assist relevant departments in formulating more detailed strategies for mitigating traffic emissions. Furthermore, in the context of microcosmic research on traffic emissions, a predominant approach employed by scholars is the adoption of a top-down methodology for establishing traffic emission inventories. However, these inventories often rely on emission factor data sourced from statistical yearbooks or adjusted using models such as the COPERT and MOVES model. It should be noted that these models have been developed by foreign scholars, which poses challenges when applying them to research conducted in China due to difficulties in parameter localization. Therefore, this study aims to enhance the accuracy of established emission inventories by constructing a traffic emission inventory based on previously obtained emission factor data based on PEMS.

2.2. Spatiotemporal Characteristics

In recent years, the Geographic Information System (GIS) platform has been widely utilized by scholars to investigate the spatiotemporal characteristics of vehicle emissions due to its inherent intuitiveness [29,35,36]. For example, Chen et al. utilized GIS data to analyze ammonia emissions in Beijing, with high spatiotemporal resolution [36]. Dai et al. determined the real-time emissions of CO2 and other pollutants from vehicles in Shanghai, analyzing the spatial and temporal dynamics and co-benefits [39]. To investigate the spatiotemporal characteristics of freight transportation, Zhao et al. constructed a detailed emission inventory with a high resolution of road freight in Shenzhen, using a bottom-up model [40]. Zhou et al. proposed a model to estimate CO2 emissions by utilizing vehicle trajectories and applied multiscale geographically weighted regression to analyze the spatiotemporal patterns of CO2 emissions originating from traffic [41]. Wu et al. investigated the spatiotemporal distributions of carbon emissions from traffic, covering both weekdays and weekends, and various urban areas, while also examining the spatiotemporal relationship between traffic carbon emissions and land use [42]. Shi et al. studied the influence of urban form on CO2 emissions in 256 Chinese cities from 2000 to 2018 [43]. Cheng et al. created a detailed emission inventory of heavy-duty diesel trucks in Beijing to show their distribution pattens over time and space [44]. Cheng et al. investigated the distribution and evolution mechanisms of heavy-duty trunk emissions in Tianjin [45].
To sum up, the majority of scholars have primarily examined the overall regional emissions and their spatiotemporal distribution patterns, with limited studies conducted on specific road types. Furthermore, scholarly focus has predominantly centered around the characteristics of CO2 or pollutant emissions in specific regions, neglecting collaborative research on reducing road traffic pollution and CO2 emissions. Additionally, there is a dearth of studies investigating the spatial and temporal patterns of CO2 emissions and pollutants across different road types. However, considering the varying vehicle capacities among different classes of roads, significant disparities are expected in the distribution characteristics of carbon dioxide and pollutant emissions. Therefore, this study employs ArcGIS to explore the spatiotemporal differentiation pattern of CO2 and pollutant emissions for various road types.

2.3. Influencing Factors

Revealing the factors that influence emissions is pivotal for effectively managing road passenger transportation emissions and attaining timely carbon peak and pollutant reduction. Most scholars have applied policy implications to identify the factors influencing emissions [46,47,48]. For example, considering policy implications, Zhu and Xiong suggested that policy-makers increase the price of diesel to achieve the emission reduction goal at the earliest [46]. Pita et al. analyzed the factors affecting energy use and CO2 emissions in road passenger transportation, including fuel share and vehicle types, providing insights for policy-makers [47]. Chaves et al. used the SD model and adopted specific policies in Brazil to evaluate the influence of policies on road transport emissions [48]. Peiseler and Serrenho analyzed German and EU policies on electric vehicles to identify ways to reduce CO2 emissions in road transportation [49]. Raparthi et al. derived vehicle emission factors from measures near roads in India and provided valuable suggestions [50].
To sum up, scholars have primarily focused on policy implications, with limited attention given to natural factors. In conclusion, the ongoing acceleration of economic development and urbanization has resulted in a continuous expansion of road networks’ construction and spatial layout, inevitably exacerbating pollution and facilitating its diffusion. In conclusion, investigating the relationship between CO2 and pollutant emissions and natural factors such as elevation, slope, and surface vegetation cover can provide valuable insights into the scale and trajectory of traffic-related pollution expansion. This knowledge will assist relevant authorities in formulating more effective strategies for reducing emissions to mitigate the further spread of pollution associated with traffic.
This study aims to delve into the following aspects: ① To establish high-resolution emission inventories, it is postulated that the traffic-related environmental challenges arising from urban development and the expansion of road networks result in distinct emission patterns across various types of roads; this hypothesis was verified by establishing emission inventories of CO2, CO, HC, and NOx for distinct road types. ② To determine the spatiotemporal characteristics of emissions, this study analyzes emissions from various road types (including primary, secondary, trunk, and tertiary roads) in Fuzhou, to understand their spatiotemporal patterns and the factors influencing them.

3. Materials and Methods
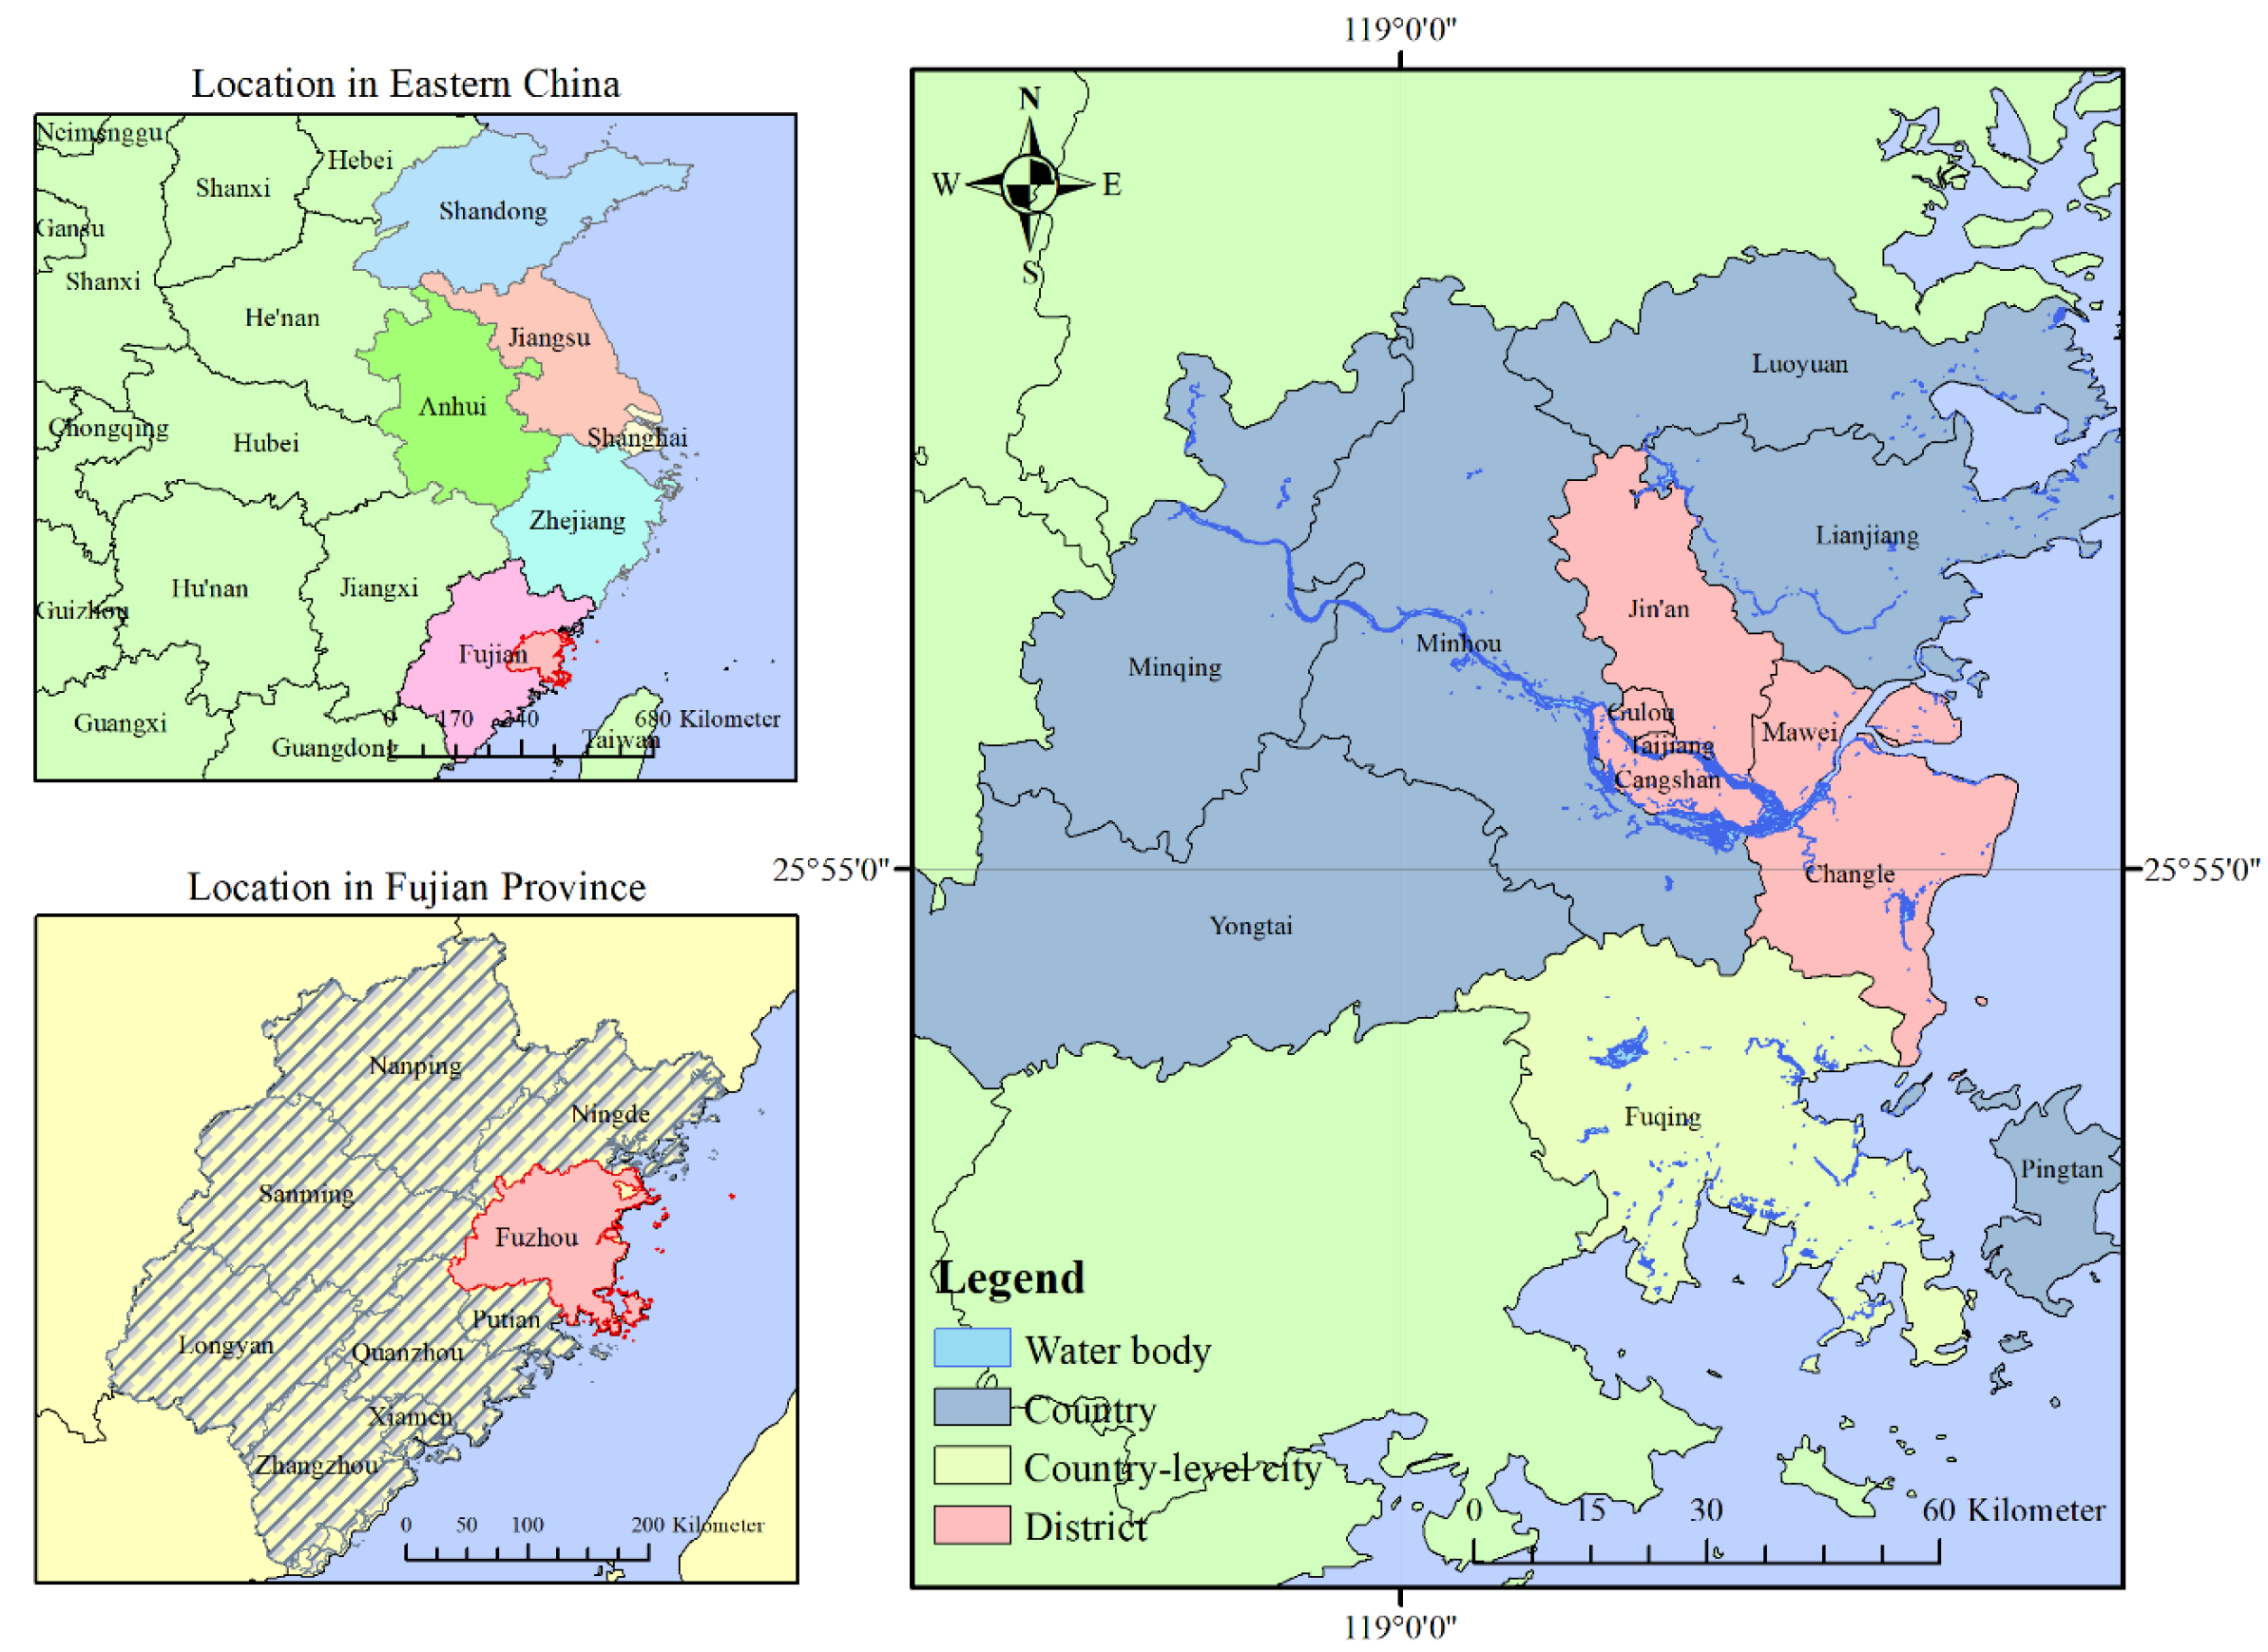
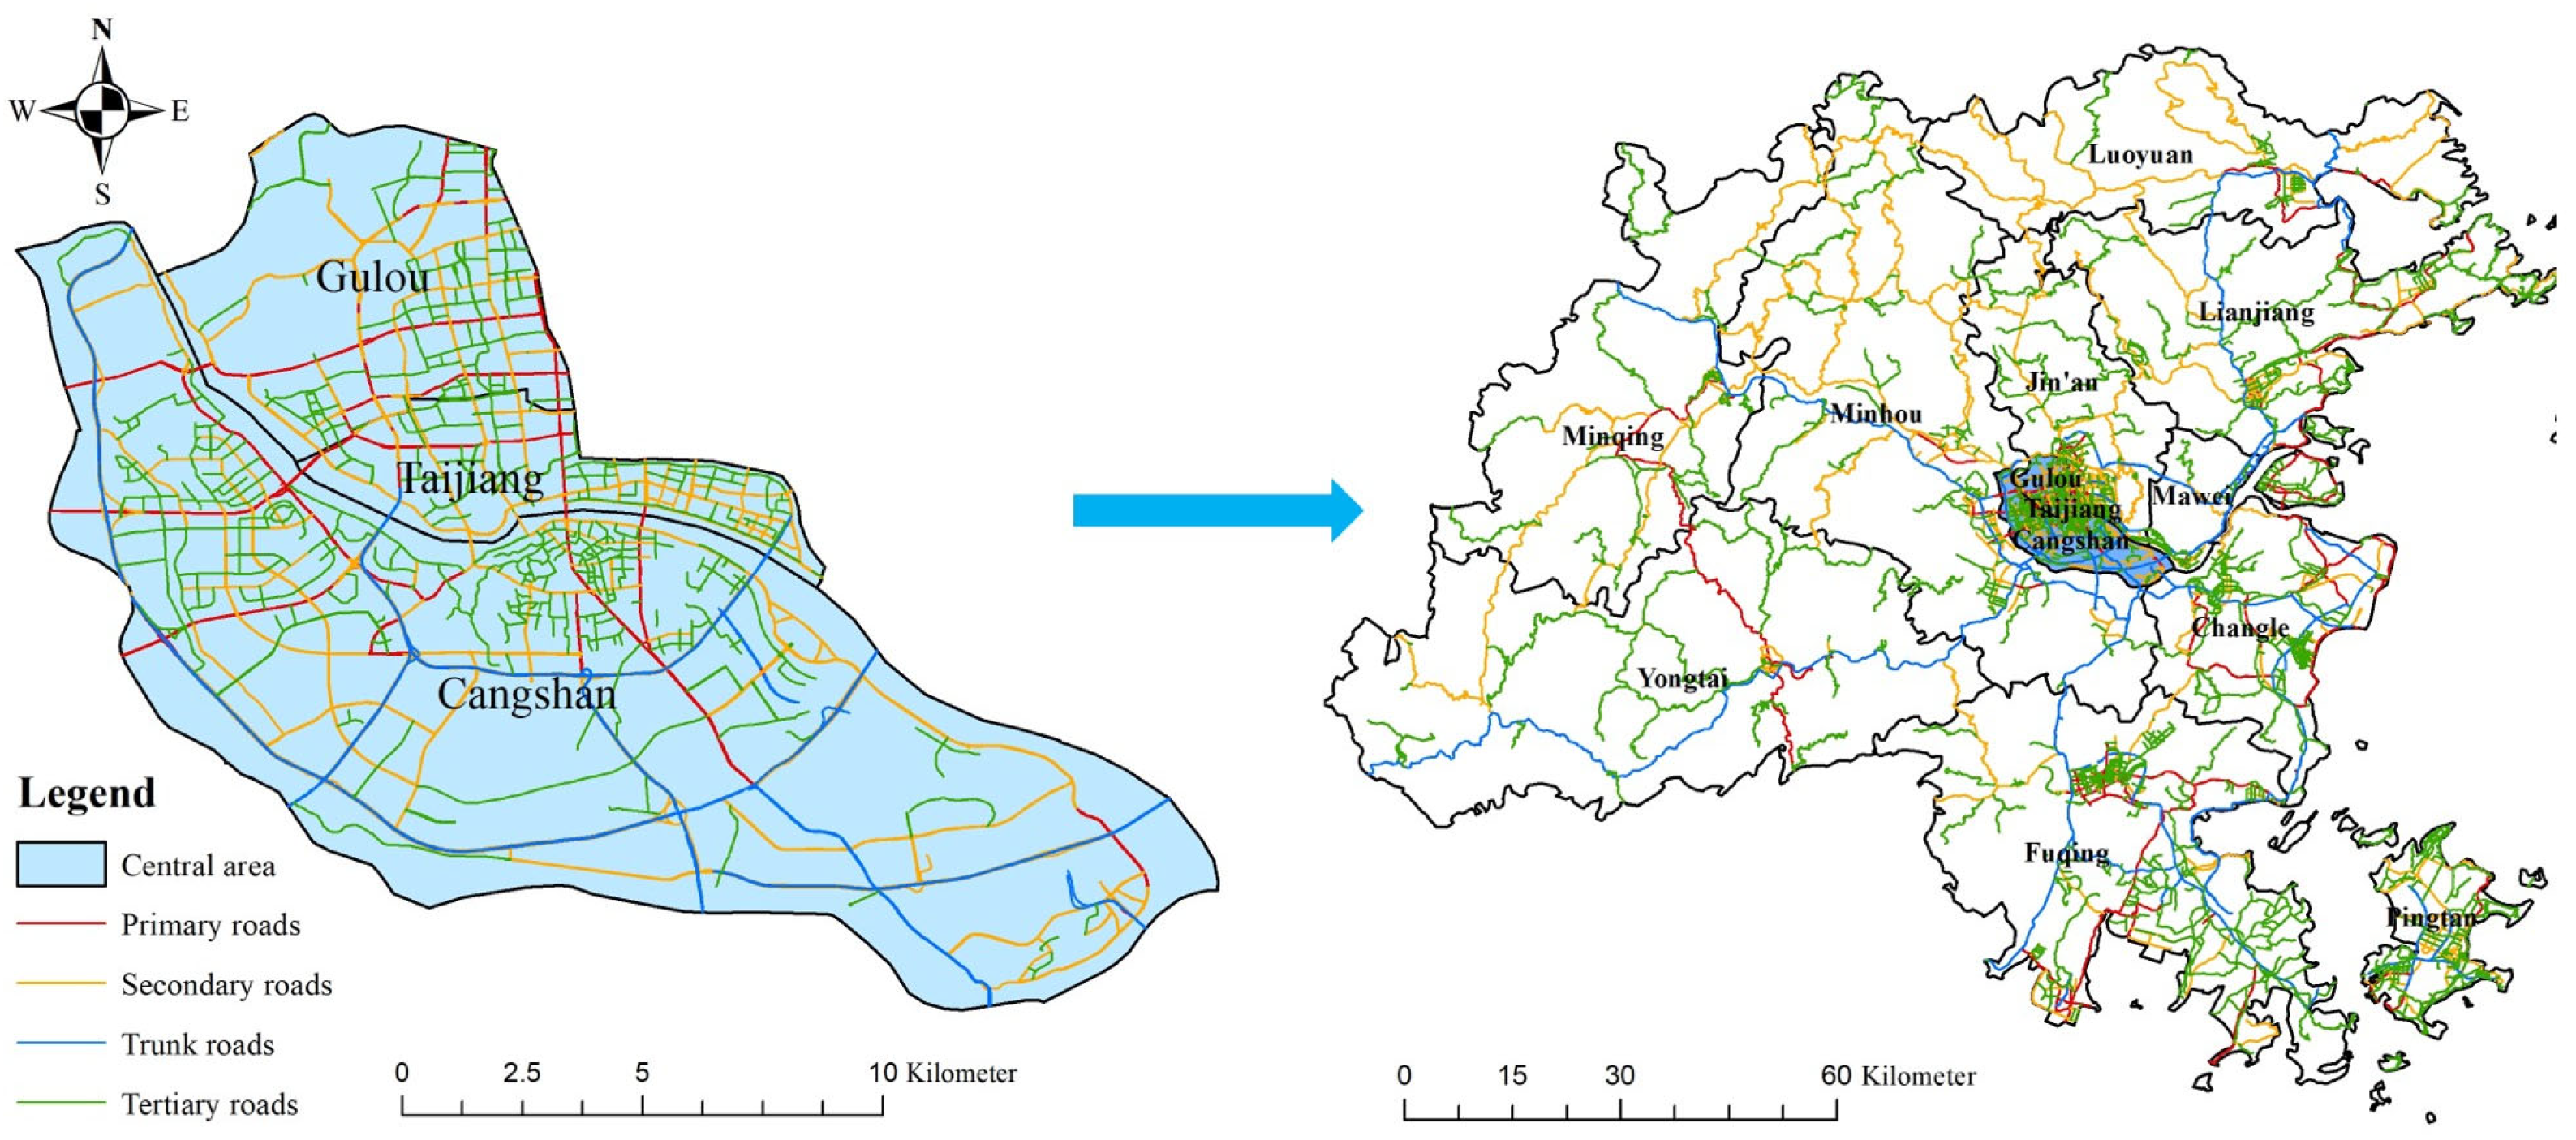
3.1. Research Area

Fuzhou is situated on the southeast coast of China, with coordinates of 25.15°–26.39° north latitude and 118.08°–120.31° east longitude. The total area of the city is 11,968.53 km2. Figure 1 shows the location of the study area. Fuzhou city, which emerged as the world’s inaugural sustainable city in 2023, stood out as the sole Chinese representative among the five victorious cities globally. Despite this accolade, the region still grapples with grave vehicular emissions predicaments and persistent environmental issues. The quantity of motor vehicles in Fuzhou has witnessed a steady increase, rising from 1.17 million in 2011 to 1.55 million in 2020, with an average annual growth rate of 3.25%, which has exacerbated environmental problems. Therefore, the government has implemented measures to safeguard the environment and reduce pollutants and carbon emissions in the transportation sector through various policies [51].
In the initial years, the core area of Fuzhou encompassed three historic urban districts, namely Gulou, Taijiang, and Cangshan. Among them, Gulou serves as the political, economic, and cultural nucleus of Fuzhou, representing its core city. By 2022, the combined GDP of Gulou, Taijiang, and Cangshan surged to 405.1 billion yuan, constituting approximately 36% of Fuzhou’s total GDP. Moreover, due to its status as the central urban area of Fuzhou, this region exhibits a relatively high population density with an estimated permanent resident count reaching 2.269 million by 2022—equivalent to around 27% of Fuzhou’s overall permanent population.
However, with further economic development and urbanization initiatives, the road network in Gulou, Taijiang, and Cangshan has undergone substantial expansion, which has contributed to its present intricate configuration (Figure 2).
In 2017, the total lengths of Fuzhou’s primary, secondary, and tertiary roads were 87.155 km, 885.622 km, and 1068.436 km, respectively. Specifically, within the downtown area, the lengths of primary, secondary, and tertiary roads were 53.269 km, 206.21 km, and 216.057 km, accounting for 61.12%, 23.28%, and 20.22% of the total road lengths in Fuzhou, respectively. By 2020, the total lengths of Fuzhou’s primary, secondary, and tertiary roads had increased to 116.583 km, 1054.637 km, and 1109.341 km, representing growth rates of 33.77%, 19.08%, and 3.8% compared to 2017. Concurrently, the road lengths within the city center also expanded, with the lengths of primary, secondary, and tertiary roads reaching 84.621 km, 253.855 km, and 211.194 km, respectively. Given the rapid economic development and advancements in road infrastructure construction during 2017–2020, it becomes imperative to comprehensively understand the impact of such construction on vehicle emissions and its spatiotemporal evolution.
Consequently, this study aimed to estimate exhaust emissions pertaining to on-road passenger transportation during the years 2017 and 2020. Adopting a bottom-up approach, the estimation of emissions was based on quantifying the activity level (annual kilometers traveled and number of vehicles) as well as considering the emission factor for CO2 and pollutants, taking into account vehicle category and fuel type [47,52,53]. These estimated emissions were disaggregated at a high resolution (1 km × 1 km) for the city.

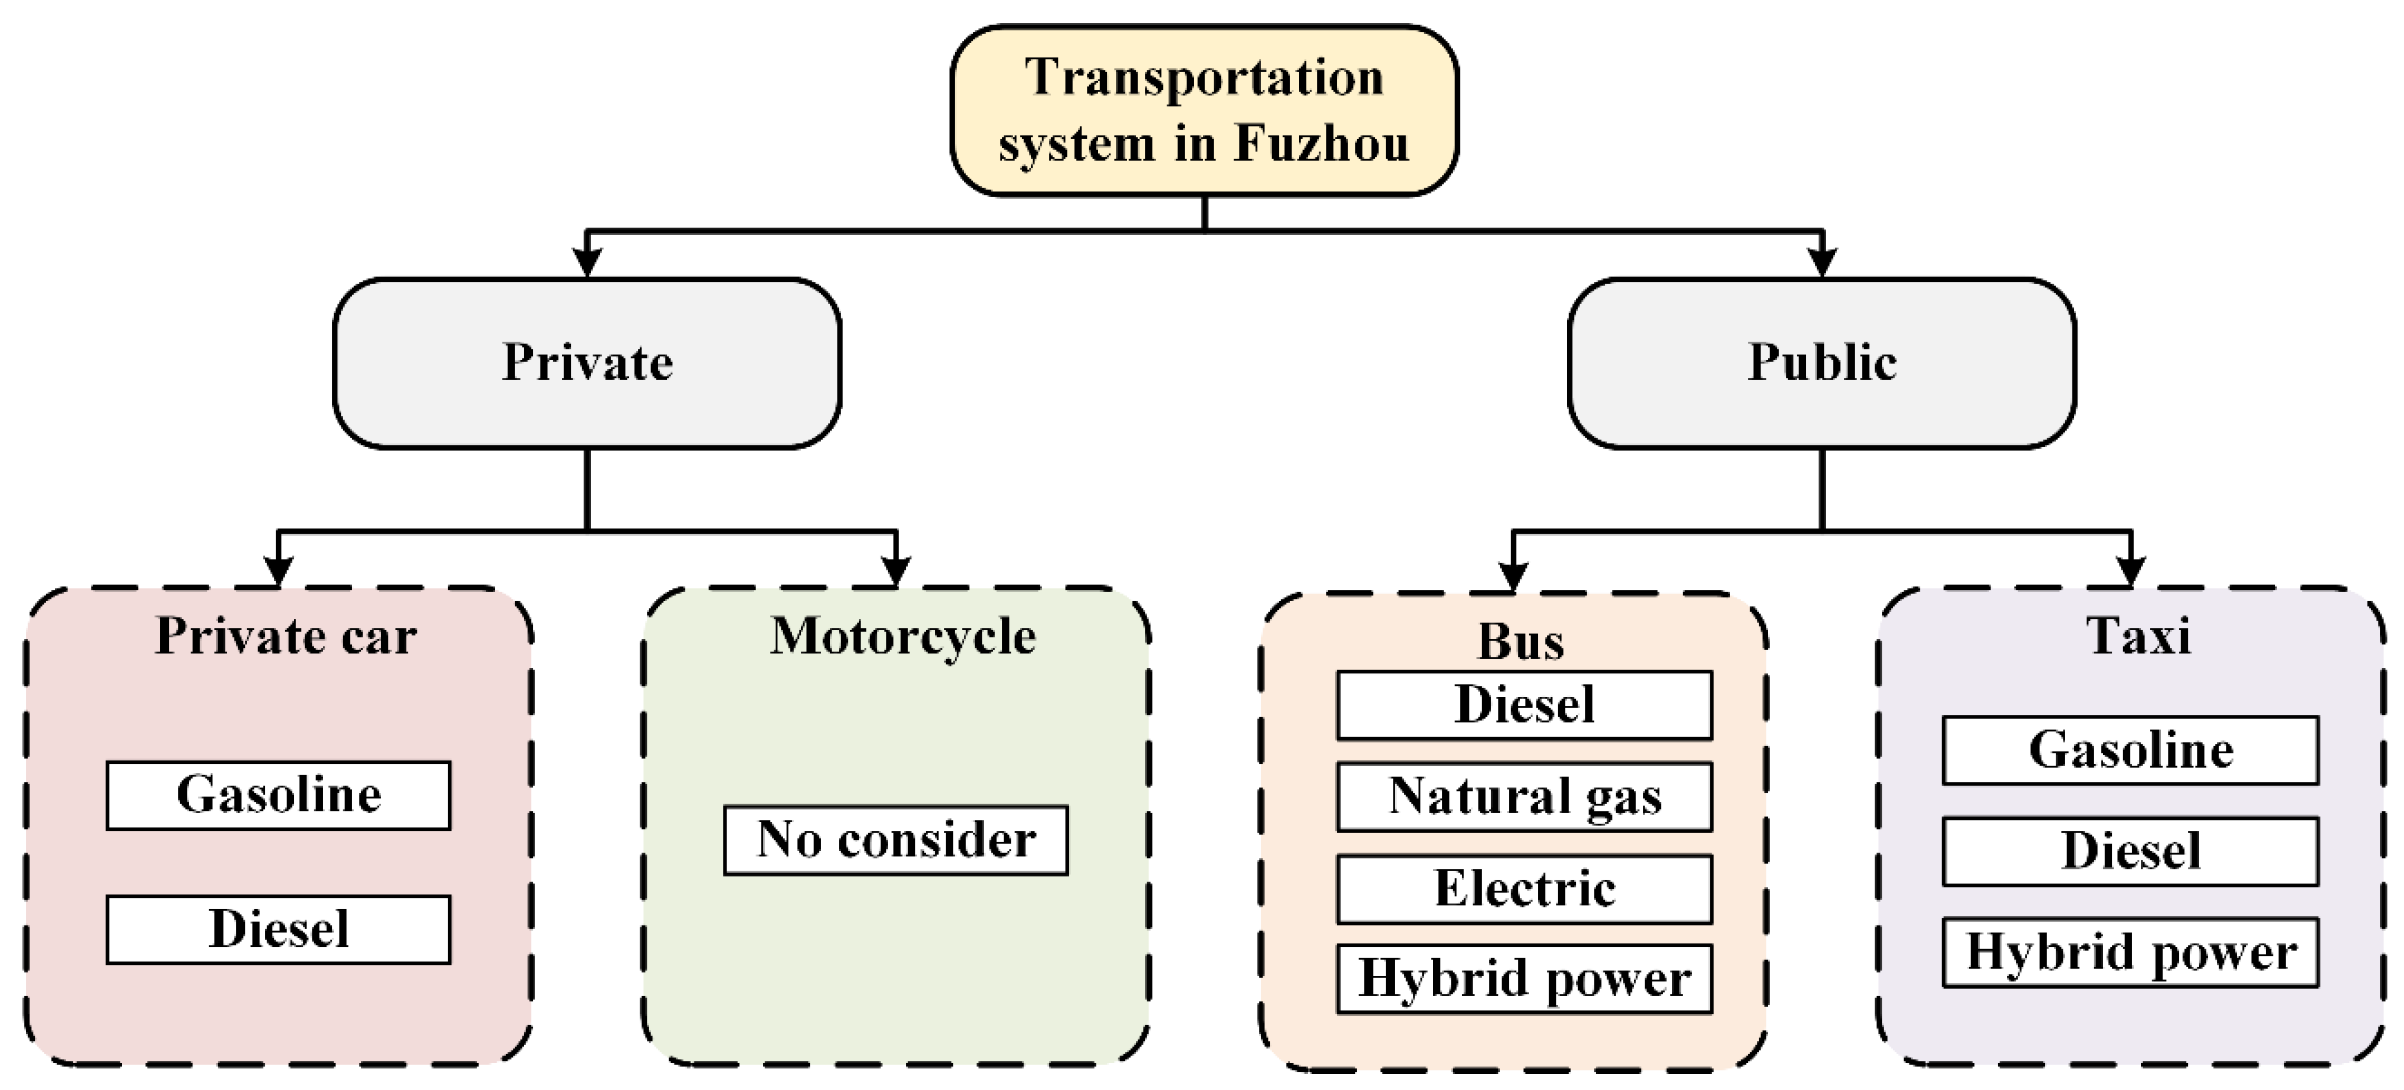
3.2. Vehicle Fleet Profile of Research Area

Due to the absence of official datasets on active vehicles, we obtained the data from reliable sources such as the Fuzhou Statistical Yearbook, China Transportation Statistical Yearbook, and our previous research [21], all of which have a sizable database of data on most vehicles.
According to the Fuzhou Statistical Yearbook, Fuzhou’s vehicle fleet was classified into four categories, namely private car, motorcycle, bus, and taxi (Figure 3).

3.3. Vehicle Emissions Estimation

The emission factor method was utilized to quantify the emissions of CO2 and pollutants [35]. The specifics are presented in Equation (1):
E i = i = 1 q V K T j × N j × E F i , j
where Ei is the emission of CO2 or pollutant emission of type i, VKTj represents the annual kilometers traveled by vehicles of type i, Nj denotes the number of vehicles of type i, and EFi,j is the emission factor of CO2 or pollutant type i with vehicles of type j.
(1)
Number of vehicles
In this study, the fleet was assembled in Fuzhou according to national regulations and with the aim of meeting international emission standards, under the assumption that all vehicles in Fuzhou adhere to established standards. The details are presented in Table 1.
(2)
Vehicle emission factors
The CO2 and pollutants’ (HC, CO, and NOx) emission factors utilized in this study were derived from the Portable Emissions Measurement System (PEMS) according to our previous research [21,54]. We used PEMS to collected detailed emission data every second. The SEMTECH ECOSTAR system includes the SEMTECH Fuel Economy Meter (FEM), SEMTECH Flame Ionization Detector (FID), and SEMTECH NOx [55]. The emissions of CO2 and pollutants (CO, HC, and NOx) were measured by PEMS. The emission factors of all vehicles involved in this study were determined through PEMS.
(3)
Annual kilometers traveled (VKT)
The VKT data in this study are derived from statistical data and research conducted by other scholars, as illustrated in Table 2. Given the relevance of the table’s values to the age distribution of motor vehicles, this study establishes a vehicle age distribution model in Fuzhou based on the two-parameter microblog distribution, as depicted in Equations (2) and (3):
V P y , s = N y · r y t , s s 0 T y s s 0 V P y , s , s = s 0
r y t = e x p y t + b Z b
where y is year, s represents the age of vehicle, t denotes the year of registration for the newly acquired vehicle, r(yt) exists the survival probability of vehicles at age (yt), Ny denotes the annual count of newly registered vehicles in year y, S0 indicates the year 2004 and before, Ty represents the number of cars in year y, b exists the failure slope, and Z is the duration of serviceability for the vehicle.
The age distribution of vehicles in Fuzhou is obtained based on Equations (2) and (3), as depicted in Figure 4.
The collection age is determined to be 3 years based on the findings presented in Figure 4, and the details are presented in Table 2.
According to the research conducted by other scholars and local statistical data, the error rate of VKT data for private cars and taxis is relatively low. However, it is crucial to acknowledge the existence of a substantial disparity in the VKT data pertaining to buses. Therefore, this study employs the median value from statistical yearbooks and previous scholarly studies to mitigate potential research errors arising from such data gaps.

3.4. Vehicle Emissions’ Spatial Differentiation Methods

Fuzhou’s road network was obtained from OpenStreetMap. To simplify calculations, four main categories of roads were identified, namely primary, secondary, trunk, and tertiary. The classification of each road type was based on its inherent characteristics and functional attributes [29].
The lengths of various road types in each cell were assigned using the standard road length method. The specific methods and steps are as follows [53].

3.4.1. Calculation of the Standard Road Length

According to the road conversion coefficient, the actual length of different road types was converted into the standard road length, and the total standard road length was obtained (Equations (4) and (5)):
T i = T F i S F
T L = i = 1 4 T i × R L i
where Ti is the standard road conversion coefficient of road type i, TFi is the average hourly traffic volume of road type i, SF represents the custom content (herein, the value was set to 1000), and RLi denotes the physical length of road type i. Specifically, Ti refers to the research conducted by Wang et al. [58] and assigns weight coefficients to roads of varying grades, as illustrated in Table 3.

3.4.2. Calculation of the Standard Road Emission Intensity

According to the total emissions in the study area and the standard road length, the standard road emission intensity was obtained (Equation (6)).
T E F i = E F i T L
where TEFi is the standard intensity of the road for CO2 or pollutant type i, EFi is the total emission of CO2 or pollutant type i, and TL is the total standard road length of the study area.

3.4.3. Calculation of Grid Emissions

By integrating the standard emission intensity with standard road lengths within a specific grid, emissions within the grid were computed (Equation (7)):
E Q i , j = Q T L j × T E F i
where EQi,j represents the emissions of CO2 or pollutants of type i in grid j, and QTLj is the standard road length in grid j.
Based on the above, we obtained an emission database for CO2, CO, HC, and NOx for each road type during 2017 and 2020 (Table 4).

4. Results and Discussion

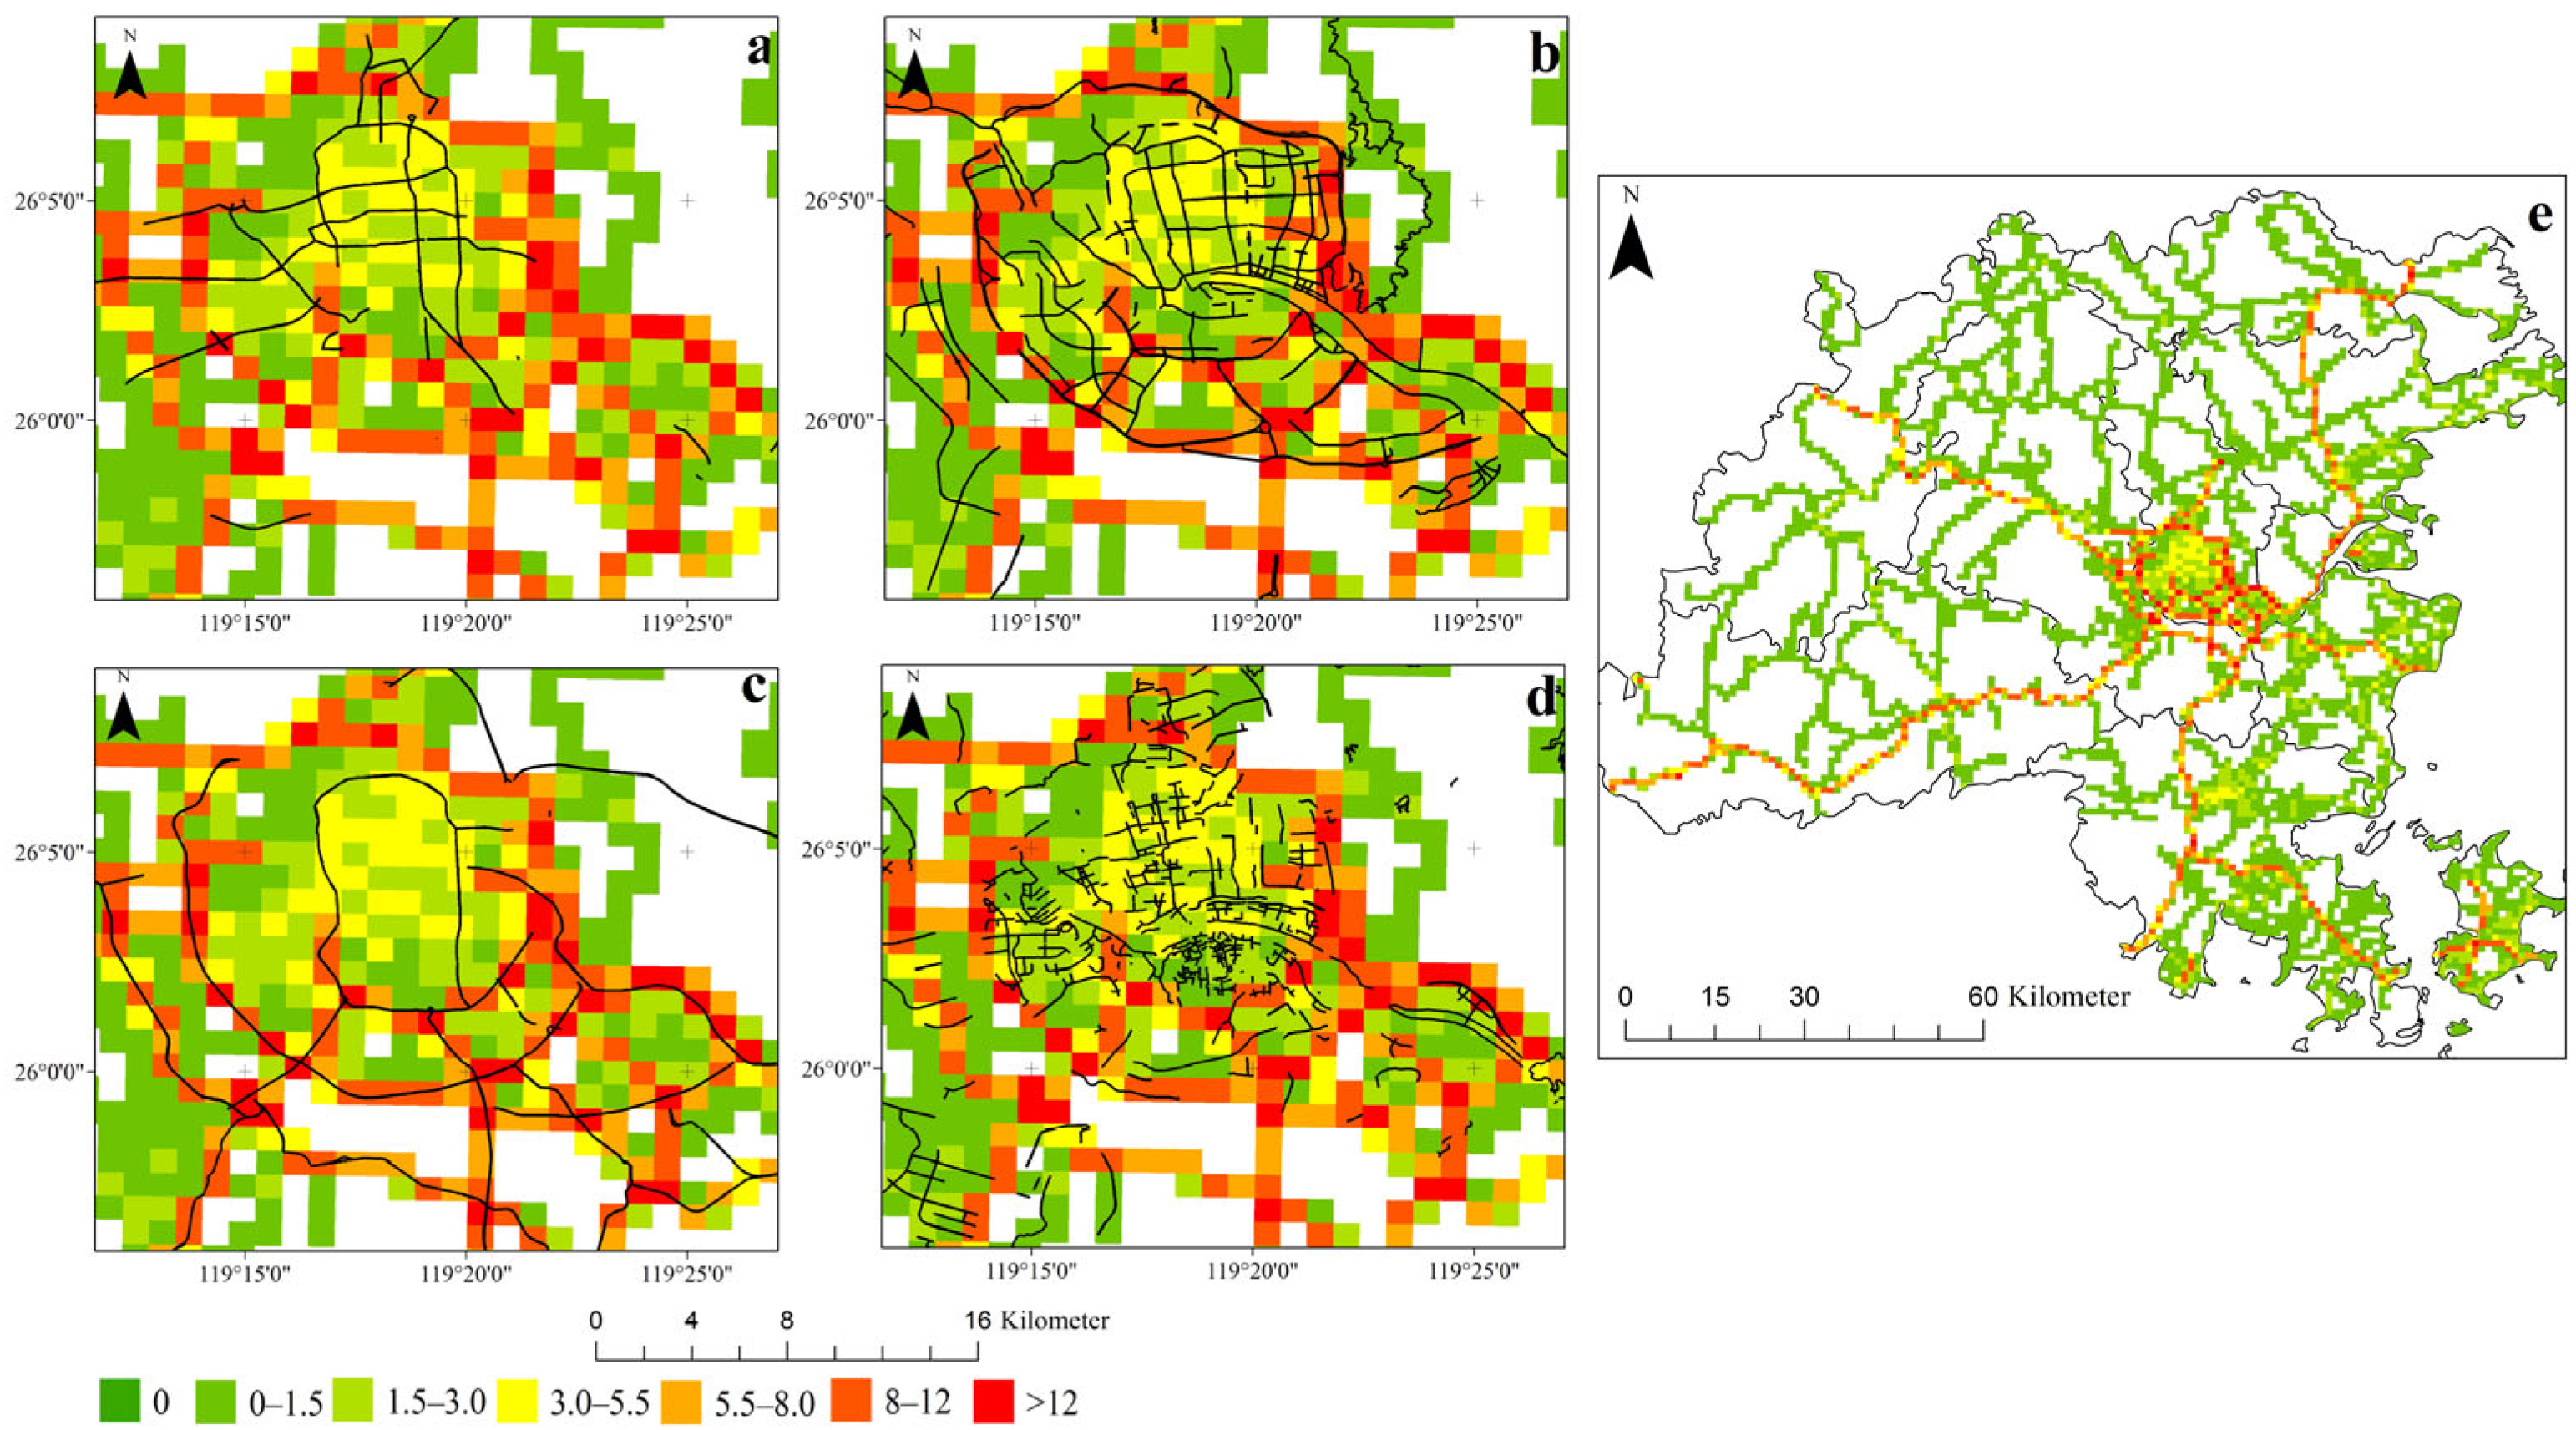
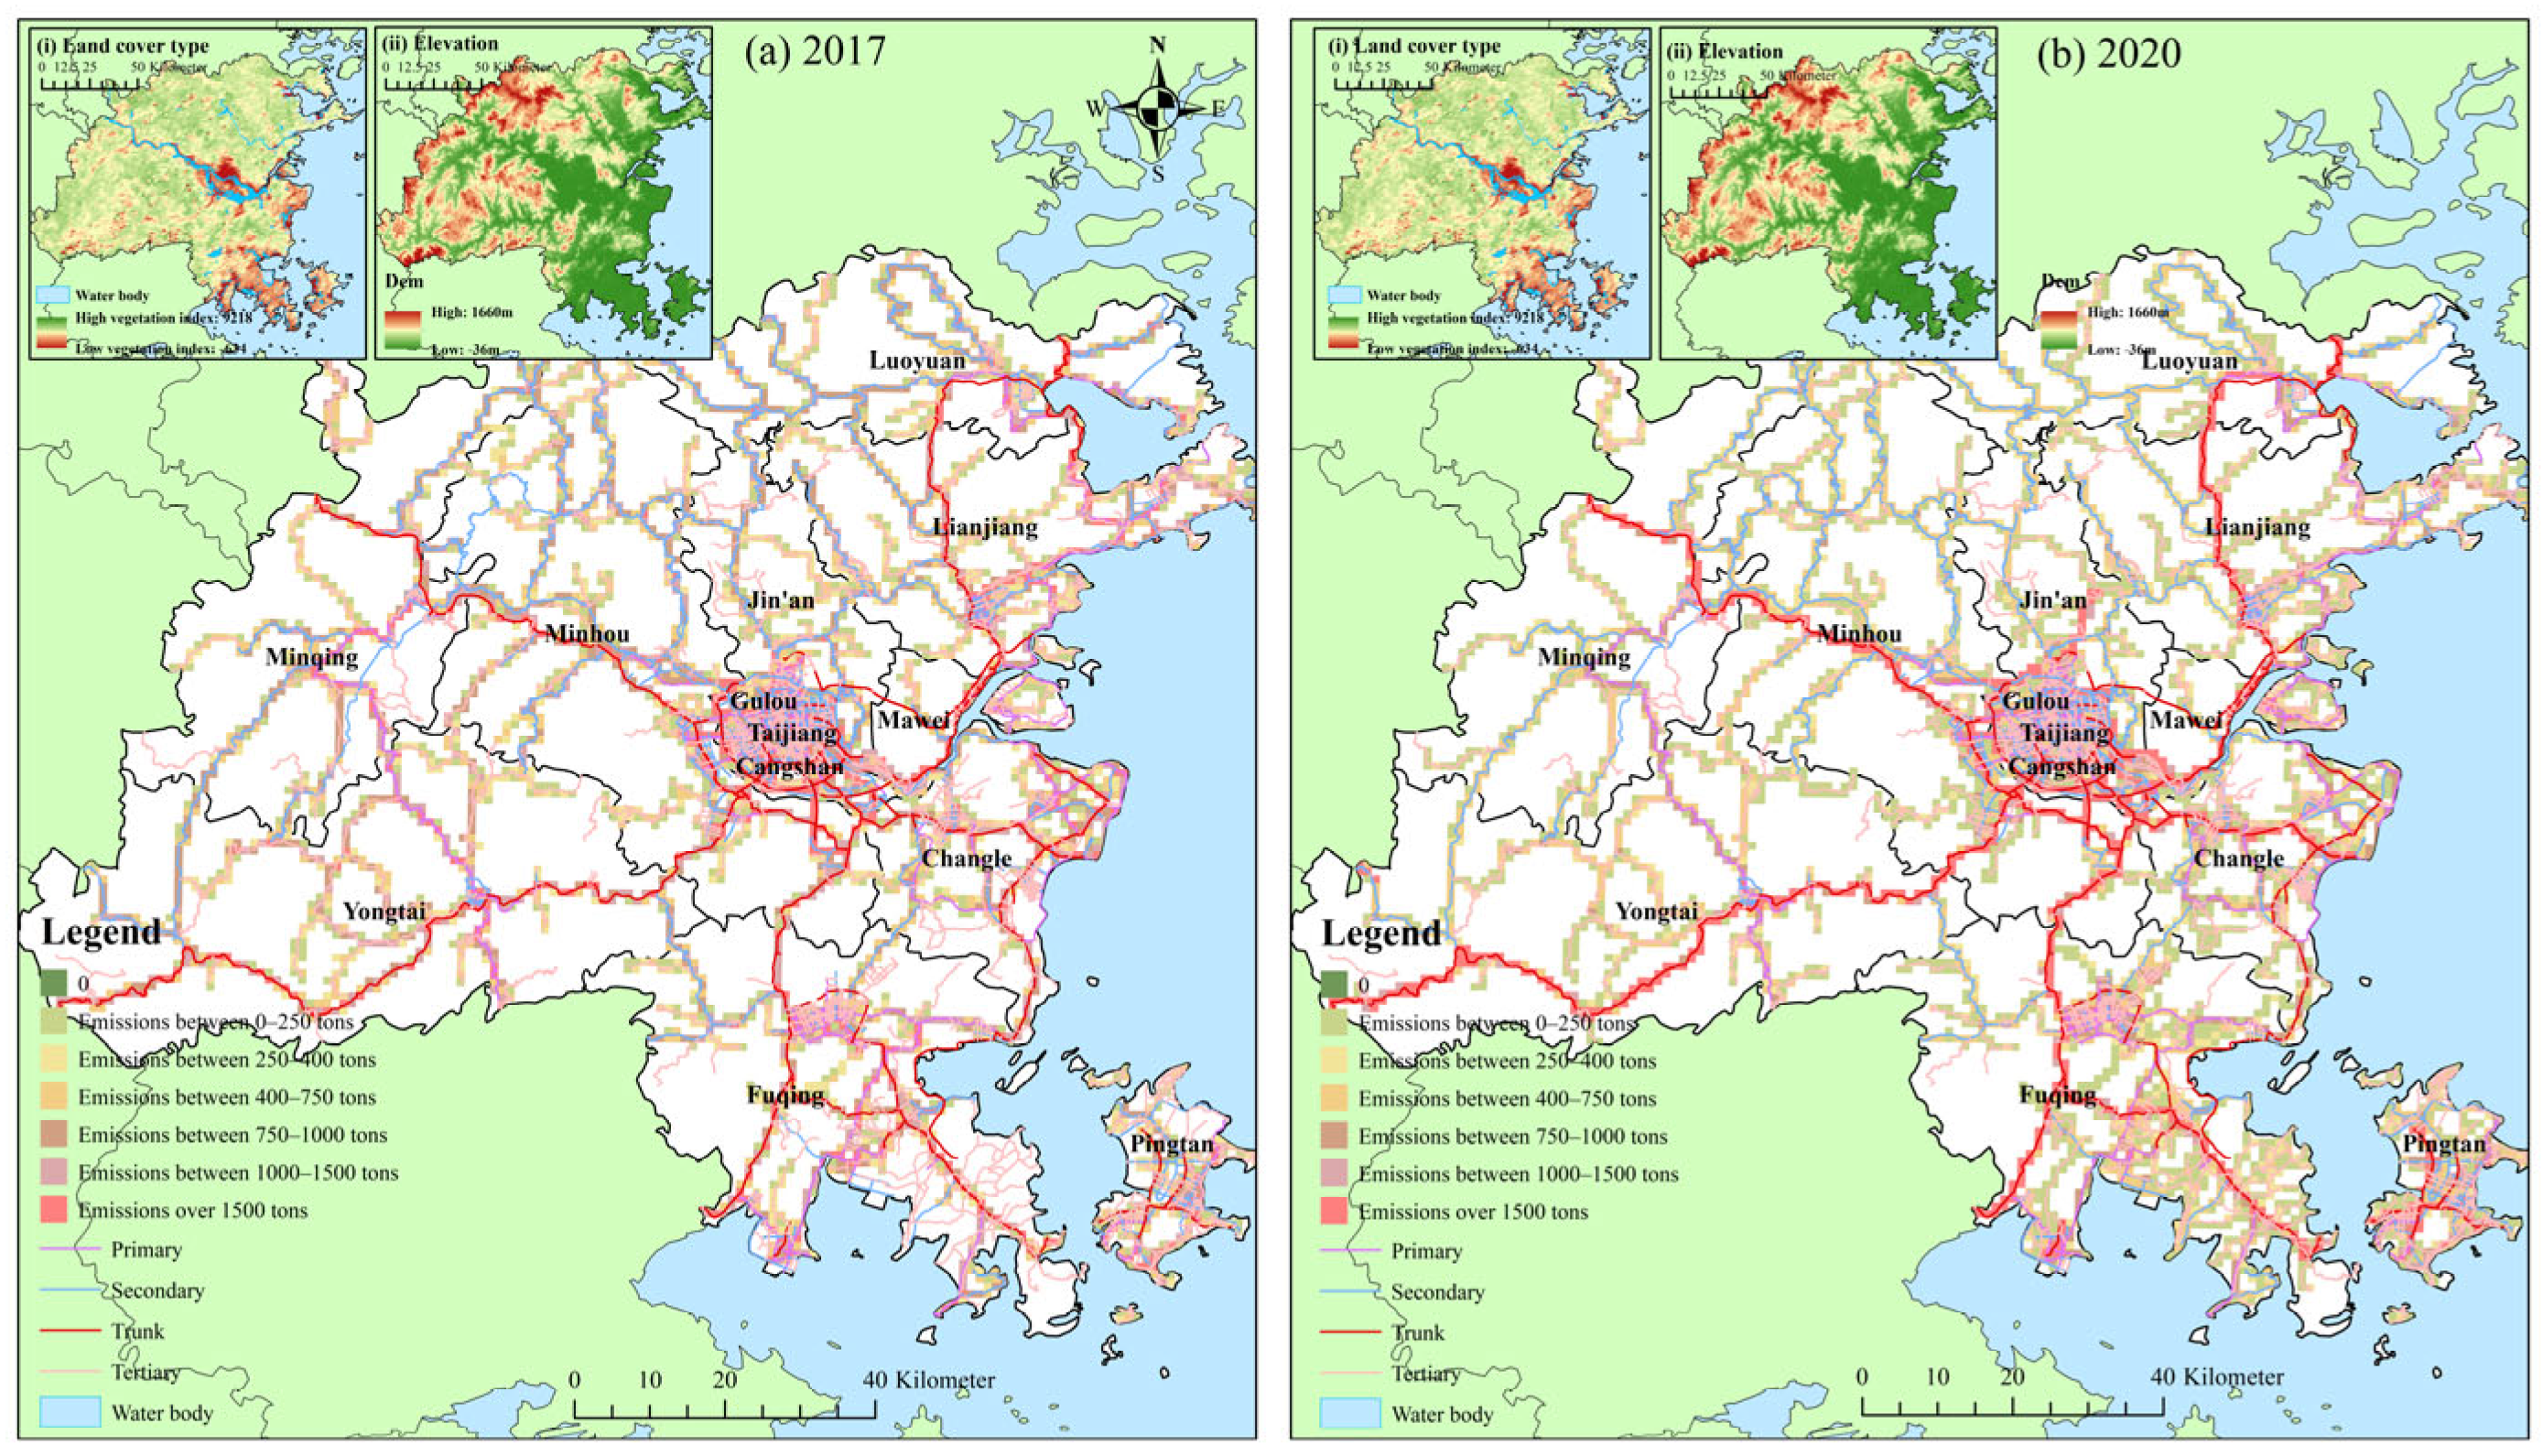
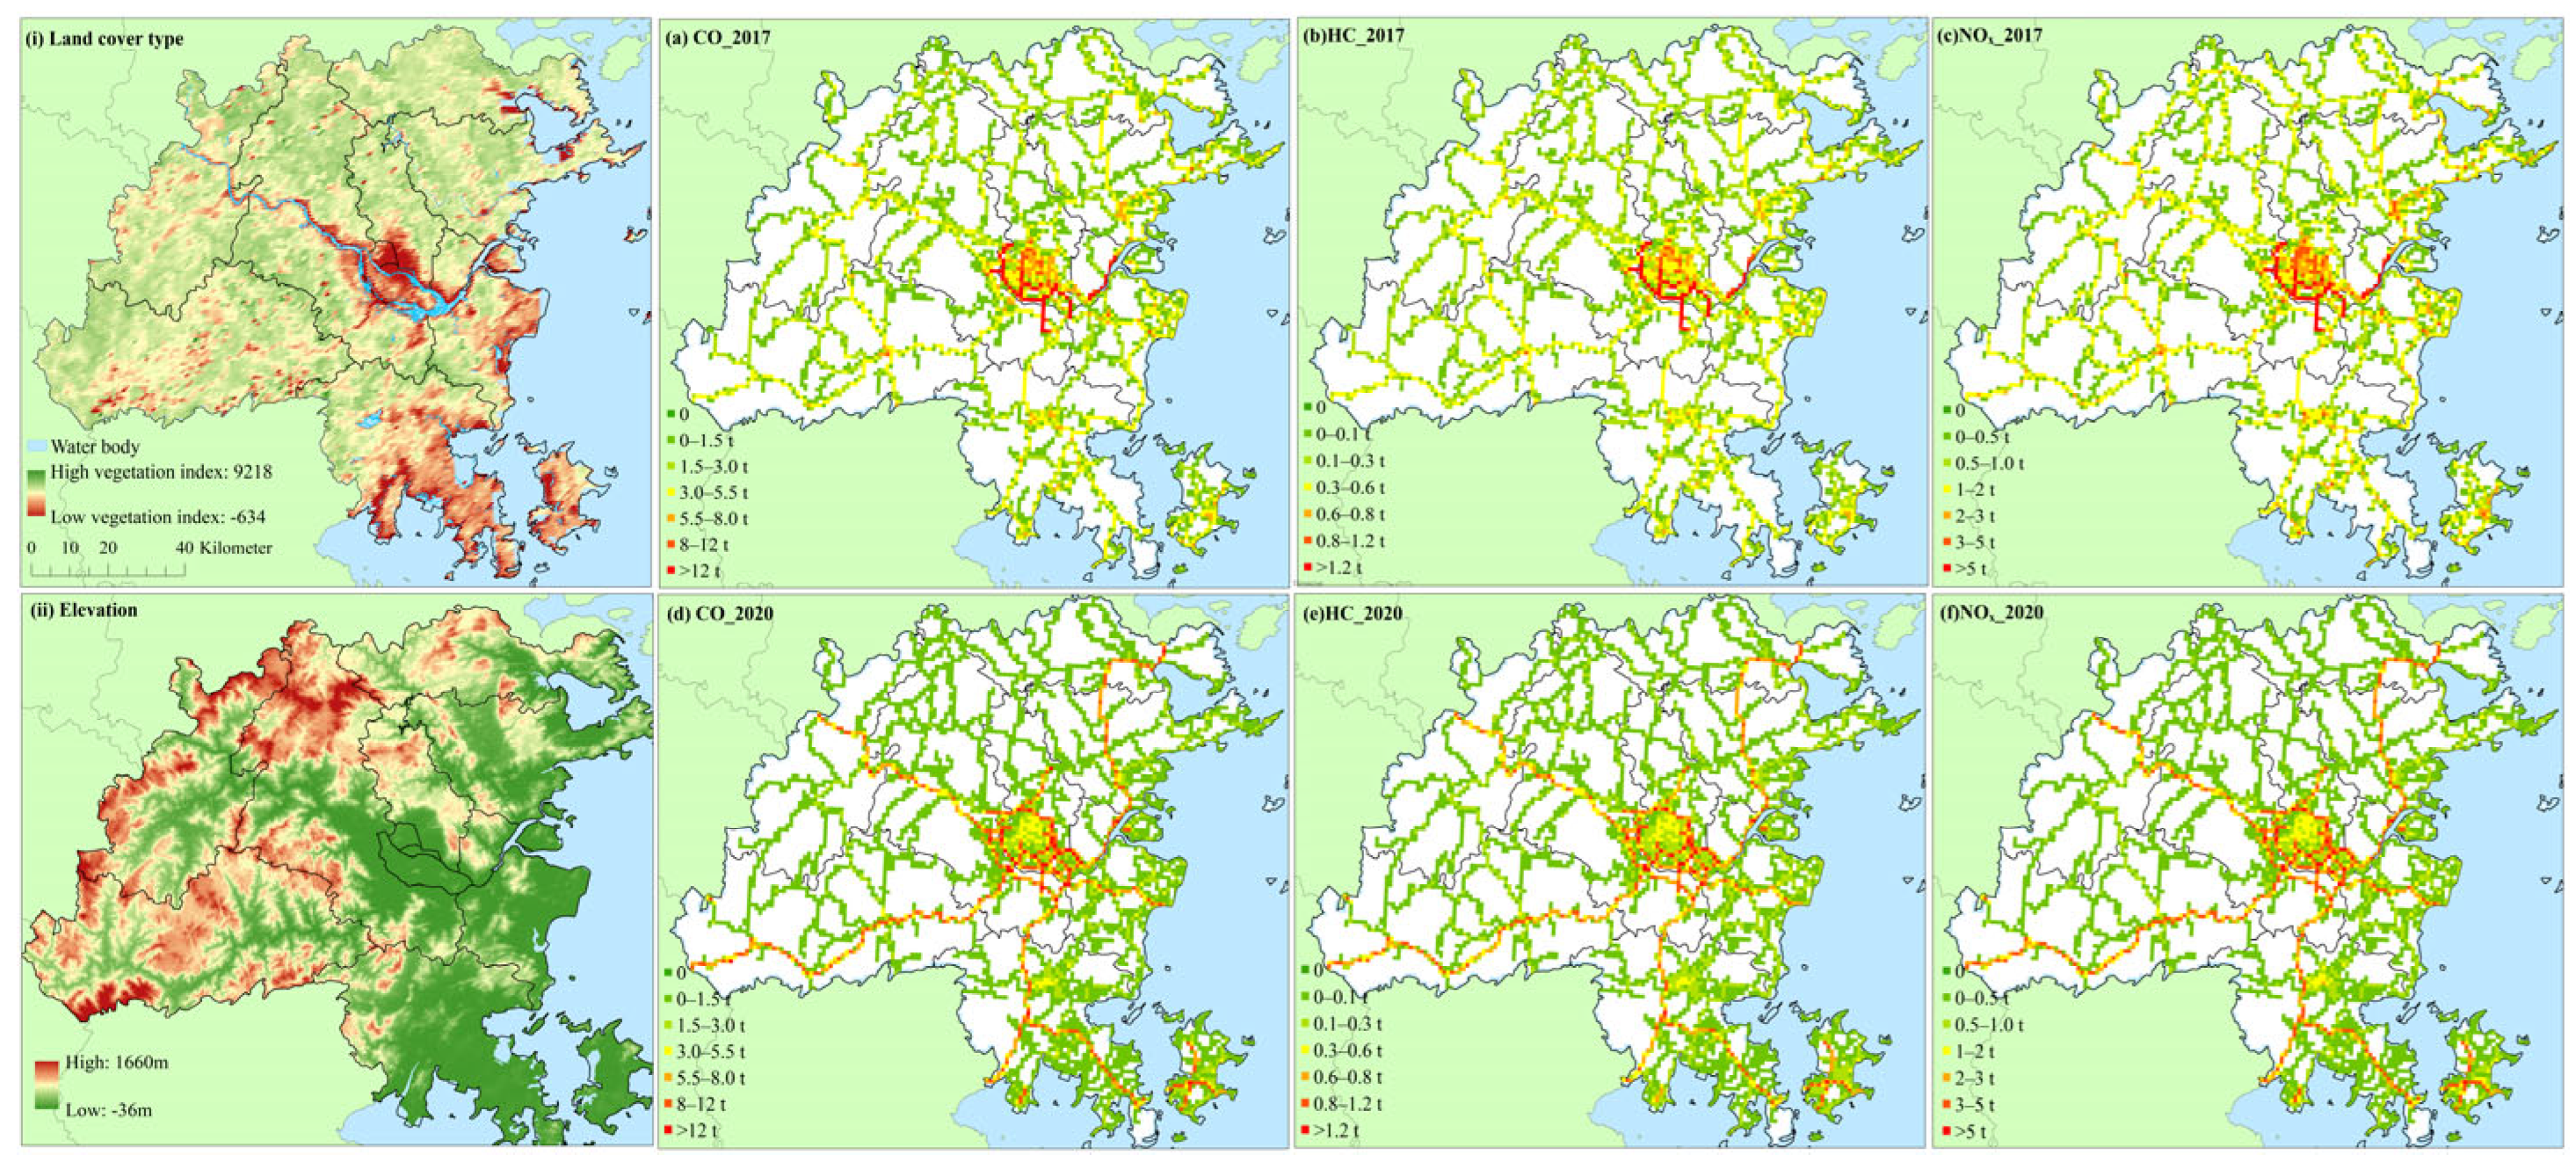
4.1. Spatiotemporal Characteristics

Transport emissions was ascertained by allocating the emissions from each road network annually to individual cells within a 1 km × 1 km grid that encompasses the entire city [59]. The distribution is determined by the road types and the standard length of roads within each cell.
Emissions were concentrated in the city center and on four specific road types. Figure 5 and Figure 6 depicts the CO2 emissions over cells of size 1 km × 1 km [28,34] for 2017 and 2020. From a spatial perspective, the central region had higher CO2 emissions (Figure 5b). From a temporal perspective, the two cells with the highest emissions were selected (Figure 5c and Figure 6c). In comparison to 2017, the year 2020 witnessed a substantial decline in CO2 emissions within the central region. Furthermore, the cells in the primary road area exhibited the highest emissions in the urban central region in 2017 (Figure 5c), whereas the cells in trunk road area demonstrated the highest emissions in the same region in 2020 (Figure 6c). Concurrently, there was a notable expansion trend of overall CO2 emission on the trunk roads within Fuzhou.
Figure 7 displays the CO2 emissions for four road types in Fuzhou city in 2017 and 2020, allowing the identification of the emissions in terms of road types and the emission ratios for all road types. The same color scheme and size scale were used for emissions for different road types, which facilitated the determination of emission characteristics for each road type in Fuzhou city. In 2017, high-value areas were primarily associated with primary and secondary roads, but in 2020, the focus shifted to trunk roads.
Figure 8 and Figure 9 shows the spatial and temporal changes in CO concentrations in Fuzhou city from 2017 to 2020. The figure employs a consistent color palette to facilitate the visual comprehension of temporal variations in CO emissions. Most of the HC emission were concentrated in the city center (Figure 8e). Figure 8a–d illustrate the emission characteristics of HC on the primary roads, secondary road, trunk roads, and tertiary roads within the urban central area, respectively. In 2017, emissions from the main road in the urban center were not significantly prominent (Figure 8a); instead, they were mainly concentrated in the median area. Notably higher levels of HC emissions were observed on secondary roads (Figure 8b) and trunk roads (Figure 8c) which predominantly occurred within areas of elevated values. Due to its dense and intricate network structure, tertiary roads (Figure 8d) exhibited comparatively higher levels of HC emissions.
Compared to 2017, there is an overall trend of attenuation in CO emissions, with the general city area transitioning from yellow (representing median emissions) in 2017 to green (indicating low emissions) in 2020 (Figure 9e). Regarding the specific road network, there is a slight reduction trend observed for CO emissions on primary roads (Figure 9a), secondary roads (Figure 9b), and tertiary roads (Figure 9c) within the central area. However, when considering trunk roads (Figure 9d) as a whole within the study area, although there is a certain decline in CO emissions observed in the central region, trunk roads exhibit a relatively significant growth trend across the entire study area.
The emissions of HC and the probability distribution in all grids within the study area are depicted in Figure 10 for the years 2017 and 2020. In 2017, most HC emissions on primary roads were between 0 t and 2 t, with some higher values falling within [2 t, 3 t] (Figure 10a). However, by 2020, there was a significant reduction in overall HC emissions, and high emission areas were mainly concentrated around 2 t (Figure 10b). For secondary roads, the high emission area for HC decreased to approximately 2 t per grid in 2020 (Figure 10d), representing a reduction of about 33% compared to the value of 3 t per grid observed in 2017 (Figure 10c). Trunk roads exhibited the most substantial decrease in HC emissions among all four road types; the emission levels dropped from ranging between 3 and 6 t per grid in 2017 (Figure 10e) to only reaching between 1 and 2 t per grid by the end of 2020 (Figure 10f). Similarly, tertiary roads displayed similar characteristics as secondary roads with a decreasing trend; however, most grids still had concentrations of HC emissions ranging from 0 t to 2 t (Figure 10g,h).
The NOx emission characteristics of the study area in 2017 (Figure 11a) and 2020 (Figure 11b) are presented in Figure 11. The downtown area of the study site exhibits a notable concentration of high NOx emissions. However, despite a decrease in NOx emissions in 2020, there is evidence of spatial expansion due to road network construction and expansion. Figure 11c,d illustrate the distribution of NOx emissions across all grids within the study area. In 2017, NOx emissions from primary roads, secondary roads, trunk roads, and tertiary roads were primarily within the range (0 t, 7 t], with most grids emitting less than 5 t. By contrast, in 2020, there was a significant reduction in NOx emissions throughout the study area; all grid types exhibited concentrations within the interval (0 t, 6 t], with an average emission per grid below 4 t.

4.2. Factors Influencing Analysis

(1)
Implications of natural conditions
We considered two main natural factors, namely, land cover type and elevation, to evaluate the emission characteristics of on-road transport CO2 (Figure 12) and pollutants (Figure 13). Throughout the study period, the high values were predominantly concentrated within the central urban area [37], where vegetation coverage levels and topography were low.
Figure 13 displays the emission characteristics of CO (Figure 13a,d), HC (Figure 13b,e), and NOx (Figure 13c,f) from 2017 to 2020 in Fuzhou. To enable the observation of the characteristics of emissions in Fuzhou, we used an identical color palette throughout the study period. The trends and characteristics were comparable to those of CO2, and these high-emission areas were mostly concentrated on land with low vegetation coverage levels and topography. The high commercialization level in central Fuzhou resulted in lower vegetation coverage than in the surrounding areas. Additionally, higher population density in plain areas compared with that in mountainous regions further contributed to higher emissions. According to Zhang et al. [30], to some extent, urban expansion influences the emission levels, which explains the reason for high emissions in high topographic areas as well as in 2020 [60,61].
(2)
Implications of existing policies
Cavallaro and Nocera assessed the impact of factors such as public health and economic activities on emissions [62]. Compared with the benchmark year 2017, air pollution had reduced substantially by 2020 in Fuzhou. This finding suggests that policy interventions can effectively manage air pollution, as evidenced by the significant reduction in pollution levels resulting from the rigorous anti-epidemic measures implemented to combat the COVID-19 pandemic [37].
In 2017, the Fuzhou Municipal People’s Government issued a Notice regarding the Implementation of the Fifth Phase of Vehicle Emission Standards. Since then, road transport environmental protection supervision in the Fuzhou city area has gradually strengthened, and pollution treatments have been greatly improved, indicating a significant inhibitory effect of the Notice on pollutant emissions. However, the Notice mainly focuses on controlling the emission of pollutants, with some lags in the control of CO2 emissions, which explains why the CO2 emission reduction effects of primary, secondary, trunk, and tertiary roads in Fuzhou city in 2020 were not as strong as those for other pollutants.

4.3. Comparison with Other Studies

The findings of this investigation are juxtaposed with those of other scholars. In general, the emissions in coastal areas were greater than those in the interior. Hu et al. found that CO2 emissions increased in countries and cities along the “Belt and Road” due to development, leading to higher overall emissions [63].
In this study, the magnitude of total pollutant emissions was much lower than that of CO2 emissions. According to Rojas et al. [29], CO emissions are closely associated with the use of motorcycles. This reduction in CO emissions can be attributed to the “restriction on motorcycles and electric vehicles” measure in Fuzhou. The network of trunk roads in Fuzhou city grew more robust by 2020 compared with that in 2017, which resulted in a rapid increase in CO emissions from trunk roads [64]. Similarly, we observed a significant decrease in HC and NOx emissions by 2020. Wang et al.’s research indicated a close correlation between HC emissions and fuel types used in vehicles, with vehicles powered by compressed natural gas having lower HC emission levels than those using gasoline [65]. Therefore, the overall decline in HC emissions observed in Fuzhou during 2020 can be attributed to the local government’s efforts to encourage the use of new energy vehicles. As stated by McCaffery et al. [66], diesel vehicles contributed to a faster increase in NOx emissions. Thus, the reduction in NOx emissions in Fuzhou may also be explained by the promotion of new energy vehicles. Furthermore, related studies have shown that vehicles operating at low speeds tend to produce higher NOx emissions [67]. Because of the population density and traffic volume being higher in urban center areas than in the outskirts of the city, vehicles in the central urban areas of Fuzhou tend to have lower average speeds. This may also explain why passenger transportation NOx emissions in Fuzhou exhibited higher values in the central area and lower values in the peripheral areas.

5. Conclusions and Policy Implications

5.1. Conclusions

This study examined the emissions from road passenger transportation in Fuzhou city from 2017 to 2020, focusing on different types of roads (primary, secondary, trunk, and tertiary roads). CO2, CO, NOx, and HC emissions were estimated using a bottom-up method. The evolution characteristics of CO2 and other pollutants from road transport traffic were also investigated. Based on the standard road length method and ArcGIS, a comprehensive analysis was conducted to examine the spatiotemporal characteristics of emissions from road passenger transportation. Based on the findings, an analysis was conducted to identify the factors that influence CO2 and pollutant emissions. The conclusions are as follows:
First, CO2 emissions from road-based passenger transportation in Fuzhou city rose steadily yearly from 2017 to 2020. CO2 emissions from road passenger transportation within Fuzhou exhibited a pattern of central–high, surrounding–low. The top CO2 emitters were Gulou, Taijiang, and Jin’an districts. The overall CO2 emissions from road passenger transportation in Fuzhou city exhibited significantly high levels for primary and secondary roads in 2017; however, in 2020, CO2 emission levels were higher for trunk roads in Fuzhou city.
Second, spatiotemporal characteristics revealed a positive correlation between the time of day and emissions of pollutants (HC, CO, and NOx) within the study area. Moreover, the emission inventories confirmed a strong correlation between the emission levels and pollutant types. Among all pollutants, the HC emissions of road passenger transportation were consistently low and mainly concentrated in central Fuzhou during the entire study period; CO exhibited the highest level of road passenger transportation during 2017 and 2020. The distribution characteristics of CO, HC, and NOx showed a similar pattern to those of CO2, with the emission levels for primary and secondary roads in 2017 and for trunk roads in Fuzhou city in 2020 being remarkably high.
Lastly, the analysis of factors influencing emissions showed that road passenger transportation for CO2 and other pollutants has a negative impact on emissions. Specifically, in 2017, CO2, CO, HC, and NOx emissions were concentrated mainly in the central area in Fuzhou city, which had low vegetation coverage levels and low topography. Notably, CO2, CO, HC, and NOx emissions showed a significant increase compared with the surrounding areas in 2020. This phenomenon warns us about the grim situation of urban expansion during the study period and that may persist in the future if effective control measures are not implemented as soon as possible.

5.2. Policy Implications

We put forth the subsequent policy recommendations on how to reduce the CO2, CO, HC, and NOx emissions of road passenger transportation in Fuzhou city:
(1)
The government has prioritized controlling pollutants but has not taken significant action to reduce CO2 emissions, resulting in an overall increase in CO2 levels. Therefore, policy-makers should formulate specific measures to target CO2 emissions from vehicles, refrain from the usage of high-emission vehicles, and provide subsidies for the acquisition of new clean-energy vehicles. In addition to vehicle control, governments should implement measures to expand the coverage area of green plants.
(2)
Significant CO2 and pollutants emissions in trunk roads are attributed to the expansion of roads and road networks. Trunk roads provide faster channels for vehicles and attract more traffic flow, resulting in remarkable emissions. Therefore, policy-makers should limit traffic flow on trunk roads and prohibit vehicles powered by highly polluting fuels. Moreover, more roads should be developed to provide more options in residential areas, thereby relieving the emission pressure on trunk roads.
(3)
Emissions from vehicles have expanded from the lower elevations of the city to higher regions, showing a significant trend of urban expansion. Therefore, policy-makers should concentrate on urban migration, land utilization, and road expansion, as well as on slowing down urban expansion and protecting areas that are not contaminated currently.
Building upon previous research, this study examines the emission characteristics and spatiotemporal evolution trends of pollutants resulting from road network construction. Furthermore, this study considers the distribution characteristics of traffic emissions across different types of roads and analyzes variations in CO2 emissions and pollutant distribution. Consequently, this study enhances the accuracy of traffic emission inventories by accounting for the impact of road network construction while also investigating disparities in CO2 and pollutant emissions. While our study offers valuable insights into the road passenger transportation in Fuzhou, it has certain limitations that should be addressed. Owing to limitations in data availability, we considered only gasoline, diesel, electric, natural gas, and hybrid power as the main fuel types. Future research can explore alternative energy sources [68].

Author Contributions

All authors contributed to the study conception and design. Y.X.: Conceptualization, investigation, formal analysis, writing—original draft. D.W.: Conceptualization, investigation, formal analysis. S.W.: Data curation, investigation, software, visualization. Q.G.: Data curation, investigation, visualization. X.H.: Data curation, investigation. Z.W.: Data curation, investigation. L.Z.: Funding acquisition, conceptualization, formal analysis, writing—original draft. All authors have read and agreed to the published version of the manuscript.

Funding

This study was sponsored by Natural Science Foundation of Fujian Province, China (2023J01475); Social Science Planning Project of Fujian Province, China (FJ2022B065); Science and Technology Innovation Strategy Research Joint Project of Fujian Province, China (2022R0137); Outstanding Young Research Talents Program (Social Science), Fujian Agriculture and Forestry University, China (xjq2020S4); Science and Technology Innovation Project, Fujian Agriculture and Forestry University, China (KFb22101XA); China’s National Innovation and Entrepreneurship Training Program for College Students (202410389030, 202410389034).

Institutional Review Board Statement

Not applicable.

Informed Consent Statement

Not applicable.

Data Availability Statement

All relevant data are indicated within the paper.

Acknowledgments

We would like to thank the editorial committee and the peer reviewers for their valuable comments. The contents of this paper are solely the responsibility of the authors and do not necessarily represent the official views of the sponsors.

Conflicts of Interest

The authors declare no conflicts of interest.

References

  1. Santos, R.M.; Bakhshoodeh, R. Climate change/global warming/climate emergency versus general climate research: Comparative bibliometric trends of publications. Heliyon 2021, 7, e8219. [Google Scholar]
  2. Mentaschi, L.; Duveiller, G.; Zulian, G.; Corbane, C.; Pesaresi, M.; Maes, J.; Stocchino, A.; Luc, F. Global long-term mapping of surface temperature shows intensified intra-city urban heat island extremes. Glob. Environ. Chang. 2022, 72, 102441. [Google Scholar]
  3. Min, R.; Gu, X.; Guan, Y.; Zhang, X. Increasing likelihood of global compound hot-dry extremes from temperature and runoff during the past 120 years. J. Hydrol. 2023, 621, 129553. [Google Scholar]
  4. Naď, M.; Brummer, V.; Lošák, P.; Máša, V.; Sukačová, K.; Tatarová, D.; Pernica, M.; Procházková, M. Waste-to-energy plants flue gas CO2 mitigation using a novel tubular photobioreactor while producing Chlorella algae. J. Clean. Prod. 2023, 385, 135721. [Google Scholar]
  5. Tian, C.; Yue, X.; Zhu, J.; Liao, H.; Yang, Y.; Chen, L.; Zhou, X.; Lei, Y.; Zhou, H.; Cao, Y. Projections of fire emissions and the consequent impacts on air quality under 1.5 °C and 2 °C global warming. Environ. Pollut. 2023, 323, 121311. [Google Scholar] [PubMed]
  6. Miao, L.; Tang, S.; Li, X.; Yu, D.; Deng, Y.; Hang, T.; Yang, H.; Liang, Y.; Kwan, M.; Huang, L. Estimating the CO2 emissions of Chinese cities from 2011 to 2020 based on SPNN-GNNWR. Environ. Res. 2023, 218, 115060. [Google Scholar]
  7. Zhang, L.; Weng, D.; Xu, Y.; Hong, B.; Wang, S.; Hu, X.; Zhang, Y.; Wang, Z. Spatio-temporal evolution characteristics of carbon emissions from road transportation in the mainland of China from 2006 to 2021. Sci. Total Environ. 2024, 917, 170430. [Google Scholar]
  8. Li, X.; Yu, B. Peaking CO2 emissions for China’s urban passenger transport sector. Energy Policy 2019, 133, 110913. [Google Scholar]
  9. Yu, C.; Long, H.; Zhang, X.; Tan, Y.; Zhou, Y.; Zang, C.; Tu, C. The interaction effect between public environmental concern and air pollution: Evidence from China. J. Clean. Prod. 2023, 391, 136231. [Google Scholar]
  10. Hao, Y.; Gai, Z.; Yan, G.; Yan, G.; Wu, H.; Irfan, M. The spatial spillover effect and nonlinear relationship analysis between environmental decentralization, government corruption and air pollution: Evidence from China. Sci. Total Environ. 2021, 763, 144183. [Google Scholar]
  11. Shen, Y.; Zhang, X. Intelligent manufacturing, green technological innovation and environmental pollution. J. Innov. Knowl. 2023, 8, 100384. [Google Scholar]
  12. Zhao, N.; Elshareef, H.; Li, B.; Wang, B.; Jia, Z.; Zhou, L.; Liu, Y.; Sultan, M.; Dong, R.; Zhou, Y. The efforts of China to combat air pollution during the period of 2015–2018: A case study assessing the environmental, health and economic benefits in the Beijing-Tianjin-Hebei and surrounding “2 + 26” regions. Sci. Total Environ. 2022, 853, 158437. [Google Scholar] [PubMed]
  13. Seaton, M.; O’Neill, J.; Bien, B.; Hood, C.; Jackson, M.; Jackson, R.; Johnson, K.; Oades, M.; Stidworthy, A.; Stocker, J.; et al. A Multi-model Air Quality System for Health Research: Road model development and evaluation. Environ. Model. Softw. 2022, 155, 105455. [Google Scholar]
  14. Liu, X.; Wang, Y.; Zhu, R.; Wei, Y.; Hu, J. Complex temperature dependence of vehicular emissions: Evidence from a global meta-analysis. Environ. Res. 2023, 237, 116890. [Google Scholar] [PubMed]
  15. Luo, Y.; Zeng, W.; Hu, X.; Yang, H.; Shao, L. Coupling the driving forces of urban CO2 emission in Shanghai with logarithmic mean Divisia index method and Granger causality inference. J. Clean. Prod. 2021, 298, 126843. [Google Scholar]
  16. Shen, J.; Tang, P.; Zeng, H.; Cheng, J.; Liu, X. Does emission trading system reduce mining cities’ pollution emissions? A quasi-natural experiment based on Chinese prefecture-level cities. Resour. Policy 2023, 81, 103293. [Google Scholar]
  17. Shao, W.; Li, F.; Cao, X.; Tang, Z.; Bai, Y.; Yang, S. Reducing export-driven CO2 and PM emissions in China’s provinces: A structural decomposition and coordinated effects analysis. J. Clean. Prod. 2020, 274, 123101. [Google Scholar]
  18. Oreggioni, G.D.; Mahiques, O.; Monforti-Ferrario, F.; Schaaf, E.; Muntean, M.; Guizzardi, D.; Vignati, E.; Crippa, M. The impacts of technological changes and regulatory frameworks on global air pollutant emissions from the energy industry and road transport. Energy Policy 2022, 168, 113021. [Google Scholar]
  19. Zhu, L. Comparative evaluation of CO2 emissions from transportation in countries around the world. J. Transp. Geogr. 2023, 110, 103609. [Google Scholar]
  20. Liu, J.; Li, J.; Chen, Y.; Lian, S.; Zeng, J.; Geng, M.; Zheng, S.; Dong, Y.; He, Y.; Huang, P.; et al. Multi-scale urban passenger transportation CO2 emission calculation platform for smart mobility management. Appl. Energy 2023, 331, 120407. [Google Scholar]
  21. Zhang, L.; Lin, J.; Qiu, R. Characterizing the toxic gaseous emissions of gasoline and diesel vehicles based on a real-world on-road investigation. J. Clean. Prod. 2021, 286, 124957. [Google Scholar]
  22. Zhao, H.; He, H.; Lu, D.; Zhou, D.; Lu, C.; Fang, X.; Peng, Z. Evaluation of CO2 and NOx emissions from container diesel trucks using a portable emissions measurement system. Build. Environ. 2024, 252, 111266. [Google Scholar]
  23. Liu, K.; Lin, X.; Xu, J.; Ma, F.; Yang, W.; Cao, R.; Hu, X.; Wei, Y.; Jiang, L.; Wang, Z. Investigating the influence of platform design on the distribution of traffic particulate matter at the bus stop. Build. Environ. 2024, 255, 111395. [Google Scholar]
  24. Yang, J.N.; Wen, Y.F.; Wang, Y.; Seinfeld, J.H. From COVID-19 to future electrification: Assessing traffic impacts on air quality by a machine-learning model. Proc. Natl. Acad. Sci. USA 2021, 118, e2102705118. [Google Scholar]
  25. Duan, S.; Qiu, Z.; Liu, Z.; Liu, L. Impact assessment of vehicle electrification pathways on emissions of CO2 and air pollution in Xi’an, China. Sci. Total Environ. 2023, 893, 164856. [Google Scholar]
  26. Lv, Z.; Zhang, Y.; Ji, Z.; Deng, F.; Shi, M.; Li, Q.; He, M.; Xiao, L.; Huang, Y.; Liu, H.; et al. A real-time NOx emission inventory from heavy-duty vehicles based on on-board diagnostics big data with acceptable quality in China. J. Clean. Prod. 2023, 422, 138592. [Google Scholar]
  27. Krecl, P.; Oukawa, G.Y.; Charres, I.; Targino, A.; Grauer, A.; Silva, D. Compilation of a city-scale black carbon emission inventory: Challenges in developing countries based on a case study in Brazil. Sci. Total Environ. 2022, 839, 156332. [Google Scholar] [PubMed]
  28. Xu, Y.; Liu, Z.; Xue, W.; Yan, G.; Zhao, D.; Zhang, Y.; Lei, Y.; Wang, J. Identification of on-road vehicle CO2 emission pattern in China: A study based on a high-resolution emission inventory. Resour. Conserv. Recycl. 2021, 175, 105891. [Google Scholar]
  29. Rojas, N.Y.; Mangones, S.C.; Osses, M.; Granier, C.; Laengle, I.; Alfonso, J.V.; Mendez, J.A. Road transport exhaust emissions in Colombia. 1990–2020 trends and spatial disaggregation. Transp. Res. Part D Transp. Environ. 2023, 121, 103780. [Google Scholar]
  30. Zhang, B.; Yin, S.; Lu, X.; Wang, S.; Xu, Y. Development of city-scale air pollutants and greenhouse gases emission inventory and mitigation strategies assessment: A case in Zhengzhou, Central China. Urban Clim. 2023, 48, 101419. [Google Scholar]
  31. Das, B.; Bhave, P.V.; Puppala, S.P.; Adhikari, S.; Sainju, S.; Mool, E.; Byanju, R.M. Emission factors and emission inventory of diesel vehicles in Nepal. Sci. Total Environ. 2022, 812, 152539. [Google Scholar]
  32. Jiang, P.; Zhong, X.; Li, L. On-road vehicle emission inventory and its spatio-temporal variations in North China Plain. Environ. Pollut. 2020, 267, 115639. [Google Scholar]
  33. Huy, L.N.; Kim Oanh, N.T.; Htut, T.T.; Hlaing, O.M.T. Emission inventory for on-road traffic fleets in Greater Yangon, Myanmar. Atmos. Pollut. Res. 2020, 11, 702–713. [Google Scholar]
  34. Hakkim, H.; Kumar, A.; Annadate, S.; Sinha, B.; Sinha, V. RTEII: A new high-resolution (0.1° × 0.1°) road transport emission inventory for India of 74 speciated NMVOCs, CO, NOx, NH3, CH4, CO2, PM2.5 reveals massive overestimation of NOx and CO and missing nitromethane emissions by existing inventories. Atmos. Environ. X 2021, 11, 100118. [Google Scholar]
  35. Patiño-Aroca, M.; Parra, A.; Borge, R. On-road vehicle emission inventory and its spatial and temporal distribution in the city of Guayaquil, Ecuador. Sci. Total Environ. 2022, 848, 157664. [Google Scholar]
  36. Chen, S.; Du, Z.; Shi, X.; Liu, Y.; Li, S.; Shao, C.; Steve-Harold, K. MOVES-Beijing-based high spatial and temporal resolution ammonia emissions from road traffic in Beijing. Atmos. Environ. 2021, 256, 118443. [Google Scholar]
  37. Deng, X.; Chen, W.; Zhou, Q.; Zheng, Y.; Li, H.; Liao, S.; Biljecki, F. Exploring spatiotemporal pattern and agglomeration of road CO2 emissions in Guangdong, China. Sci. Total Environ. 2023, 871, 162134. [Google Scholar]
  38. Zhu, C.; Qu, X.; Qiu, M.; Zhu, C.; Wang, C.; Wang, B.; Sun, L.; Yang, N.; Yan, G.; Xu, C.; et al. High spatiotemporal resolution vehicular emission inventory in Beijing-Tianjin-Hebei and its surrounding areas (BTHSA) during 2000–2020, China. Sci. Total Environ. 2023, 873, 162389. [Google Scholar] [PubMed]
  39. Dai, Y.; Shi, X.; Huang, Z.; Du, W.; Cheng, J. Proposal of policies based on temporal-spatial dynamic characteristics and co-benefits of CO2 and air pollutants from vehicles in Shanghai, China. J. Environ. Manag. 2024, 351, 119736. [Google Scholar]
  40. Zhao, P.; Li, Z.; Xiao, Z.; Jiang, S.; He, Z.; Zhang, M. Spatiotemporal characteristics and driving factors of CO2 emissions from road freight transportation. Transp. Res. Part D Transp. Environ. 2023, 125, 103983. [Google Scholar]
  41. Zhou, X.; Wang, H.; Huang, Z.; Bao, Y.; Zhou, G.; Liu, Y. Identifying spatiotemporal characteristics and driving factors for road traffic CO2 emissions. Sci. Total Environ. 2022, 834, 155270. [Google Scholar]
  42. Wu, J.; Jia, P.; Feng, T.; Li, H.; Kuang, H.; Zhang, J. Uncovering the spatiotemporal impacts of built environment on traffic carbon emissions using multi-source big data. Land Use Policy 2023, 129, 106621. [Google Scholar]
  43. Shi, F.; Liao, X.; Shen, L.; Meng, C.; Lai, Y. Exploring the spatiotemporal impacts of urban form on CO2 emissions: Evidence and implications from 256 Chinese cities. Environ. Impact Assess. Rev. 2022, 96, 106850. [Google Scholar]
  44. Cheng, S.; Zhang, B.; Zhao, Y.; Peng, P.; Lu, F. Multiscale spatiotemporal variations of NOx emissions from heavy duty diesel trucks in the Beijing-Tianjin-Hebei region. Sci. Total Environ. 2023, 854, 158753. [Google Scholar] [PubMed]
  45. Cheng, S.; Zhang, B.; Peng, P.; Yang, Z.; Lu, F. Spatiotemporal evolution pattern detection for heavy-duty diesel truck emissions using trajectory mining: A case study of Tianjin, China. J. Clean. Prod. 2020, 244, 118654. [Google Scholar]
  46. Zhu, L.; Xiong, Q. Key influencing factor and future scenario simulation of China’s CO2 emissions from road freight transportation. Sustain. Prod. Consum. 2023, 37, 11–25. [Google Scholar]
  47. Pita, P.; Winyuchakrit, P.; Limmeechokchai, B. Analysis of factors affecting energy consumption and CO2 emissions in Thailand’s road passenger transport. Heliyon 2020, 6, e5112. [Google Scholar]
  48. Chaves GD, L.D.; Nascimento Boldrini, O.; de Alvarenga Rosa, R.; Ghisolfi, V.; Mattos Ribeiro, G. Policy influence in the dynamic of energy and carbon dioxide emissions intensity of Brazilian road transport. Case Stud. Transp. Policy 2021, 9, 1868–1878. [Google Scholar]
  49. Peiseler, L.; Cabrera Serrenho, A. How can current German and EU policies be improved to enhance the reduction of CO2 emissions of road transport? Revising policies on electric vehicles informed by stakeholder and technical assessments. Energy Policy 2022, 168, 113124. [Google Scholar]
  50. Raparthi, N.; Barudgar, A.; Chu, M.; Ning, Z.; Phuleria, H.C. Estimating individual vehicle emission factors from near-road measurements in India. Atmos. Environ. 2023, 308, 119869. [Google Scholar]
  51. Dong, Y.; Peng, F.; Bao, Z.; Qiao, Y. Identification of the spatial distribution pattern and driving forces of underground parking space based on multi-source data: A case study of Fuzhou City in China. Sustain. Cities Soc. 2021, 72, 103084. [Google Scholar]
  52. Xiao, S.; Zhang, Y.; Zhang, Z.; Song, W.; Pei, C.; Chen, D.; Wang, X. The contributions of non-methane hydrocarbon emissions by different fuel type on-road vehicles based on tests in a heavily trafficked urban tunnel. Sci. Total Environ. 2023, 873, 162432. [Google Scholar]
  53. Swarnkar, A.; Gurjar, B.R. GIS-based emission inventory of heavy metals from road transport and NMVOCs associated with biomass burning for megacity Delhi. Urban Clim. 2023, 51, 101600. [Google Scholar]
  54. Zhang, L.; Hu, X.; Qiu, R.; Lin, J. Comparison of real-world emissions of LDGVs of different vehicle emission standards on both mountainous and level roads in China. Transp. Res. Part D Transp. Environ. 2019, 69, 24–39. [Google Scholar]
  55. Wang, X.; Qiu, Z.; Liu, Z.; Liu, L. Real-world black carbon emissions of gasoline vehicles at urban intersections. Urban Clim. 2024, 55, 101968. [Google Scholar]
  56. Sun, S.; Sun, L.; Liu, G.; Zou, C.; Wang, Y.; Wu, L.; Mao, H. Developing a vehicle emission inventory with high temporal-spatial resolution in Tianjin, China. Sci. Total Environ. 2021, 776, 145873. [Google Scholar]
  57. Wang, H.K.; He, X.J.; Liang, X.Y.; Evans, J.S. Health benefits of on-road transportation pollution control programs in China. Proc. Natl. Acad. Sci. USA 2020, 117, 25370–25377. [Google Scholar] [PubMed]
  58. Wang, H.; Wu, Z.; Wu, Z.; Hou, Q. Urban network noise control based on road grade optimization considering comprehensive traffic environment benefit. J. Environ. Manag. 2024, 364, 121451. [Google Scholar]
  59. Gómez, C.D.; González, C.M.; Osses, M.; Aristizábal, B.H. Spatial and temporal disaggregation of the on-road vehicle emission inventory in a medium-sized Andean city. Comparison of GIS-based top-down methodologies. Atmos. Environ. 2018, 179, 142–155. [Google Scholar]
  60. Bucala-Hrabia, A. Reflections on land use and land cover change under different socio-economic regimes in the Polish Western Carpathians. Reg. Environ. Chang. 2024, 24, 28. [Google Scholar]
  61. Ru, X.; Qiao, L.; Zhang, H.; Bai, T.; Min, R.; Wang, Y.; Wang, Q.; Song, H. Effects of land use and land cover change under shared socioeconomic pathways on future climate in the Yellow River basin, China. Urban Clim. 2024, 55, 101867. [Google Scholar]
  62. Cavallaro, F.; Nocera, S. COVID-19 effects on transport-related air pollutants: Insights, evaluations, and policy perspectives. Transp. Rev. 2024, 44, 484–517. [Google Scholar]
  63. Hu, M.; Li, R.; You, W.; Liu, Y.; Lee, C. Spatiotemporal evolution of decoupling and driving forces of CO2 emissions on economic growth along the Belt and Road. J. Clean. Prod. 2020, 277, 123272. [Google Scholar]
  64. Li, X.; Gu, D.; Hohenberger, T.L.; Fung, Y.; Fung, J.H.; Lau, A.K.; Liang, Z. Dynamic quantification of on-road emissions in Hong Kong: Impact from traffic congestion and fleet composition variation. Atmos. Environ. 2023, 313, 120059. [Google Scholar]
  65. Wang, Y.; Xing, Z.; Zhang, H.; Wang, Y.; Du, K. On-road mileage-based emission factors of gaseous pollutants from bi-fuel taxi fleets in China: The influence of fuel type, vehicle speed, and accumulated mileage. Sci. Total Environ. 2022, 819, 151999. [Google Scholar]
  66. McCaffery, C.; Zhu, H.W.; Tang, T.B.; Li, C.G.; Karavalakis, G.; Cao, S.; Oshnuga, A.; Burnette, A.; Johnson, K.C.; Durbin, T.D. Real-world NOx emissions from heavy-duty diesel, natural gas, and diesel hybrid electric vehicles of different vocations on California roadways. Sci. Total Environ. 2021, 784, 147224. [Google Scholar] [PubMed]
  67. Jaiprakash; Habib, G. On-road assessment of light duty vehicles in Delhi city: Emission factors of CO, CO2 and NOx. Atmos. Environ. 2018, 174, 132–139. [Google Scholar]
  68. Wang, M.L.; Li, S.Y.; Zhu, R.C.; Zhang, R.; Zu, L.; Wang, Y.; Bao, X. On-road tailpipe emission characteristics and ozone formation potentials of VOCs from gasoline, diesel and liquefied petroleum gas fueled vehicles. Atmos. Environ. 2020, 223, 117294. [Google Scholar]
Figure 1. Location of research area.
Sustainability 16 07400 g001
Figure 2. Expansion of road network in Fuzhou.
Sustainability 16 07400 g002
Figure 3. Vehicle fleet in Fuzhou. Annotation: According to the “Restriction on motorcycles” measure in Fuzhou city, this study did not consider motorcycles.
Sustainability 16 07400 g003
Figure 4. Age distribution of vehicles.
Sustainability 16 07400 g004
Figure 5. Spatially distributed CO2 emissions from on-road vehicles in 2017. (a) Spatially distributed CO2 emissions from road passenger transportation in Fuzhou during 2017. (b) Spatially distributed CO2 emissions from road passenger transportation in the central area of Fuzhou in 2017. (c) The highest grid value of CO2 emissions from road passenger transportation of Fuzhou in 2017.
Sustainability 16 07400 g005
Figure 6. Spatially distributed CO2 emissions from on-road vehicles in 2020. (a) Spatially distributed CO2 emissions from road passenger transportation in Fuzhou during 2020. (b) Spatial distribution of CO2 emissions from passenger transportation on specific roads in Fuzhou in 2020. (c) The highest grid value of CO2 emissions from road passenger transportation of Fuzhou in 2020.
Sustainability 16 07400 g006
Figure 7. On-road transport CO2 emission characteristics of different road types.
Sustainability 16 07400 g007
Figure 8. Differences in the high-resolution map of CO emissions in each road type in 2017. (a) CO emissions in primary roads in 2017. (b) CO emissions in secondary roads in 2017. (c) CO emissions in trunk roads in 2017. (d) CO emissions in tertiary roads in 2017. (e) Spatially distributed CO emissions in the entire city in 2017.
Sustainability 16 07400 g008
Figure 9. Differences in the high-resolution map of CO emissions in each road type in 2020. Annotation: (a) CO emissions in primary roads in 2020. (b) CO emissions in secondary roads in 2020. (c) CO emissions in trunk roads in 2020. (d) CO emissions in tertiary roads in 2020. (e) Spatially distributed CO emissions in the entire city in 2020.
Sustainability 16 07400 g009
Figure 10. HC emissions and the probability distribution in all grids in 2017 and 2020.
Sustainability 16 07400 g010
Figure 11. NOx emissions and the probability distribution in all grids in 2017 and 2020. (a) Spatially distributed NOx emissions from road passenger transportation in Fuzhou during 2017. (b) Spatially distributed NOx emissions from road passenger transportation in Fuzhou during 2020. (c) NOx emissions from road passenger transportation in Fuzhou within all grids in 2017. (d) NOx emissions from road passenger transportation in Fuzhou within all grids in 2020.
Sustainability 16 07400 g011
Figure 12. Influence of natural factors on the CO2 emission characteristics during 2017–2020.
Sustainability 16 07400 g012
Figure 13. Influence of natural factors on the pollutant emission characteristics during 2017–2020.
Sustainability 16 07400 g013
Table 1. Number of vehicles of different types in Fuzhou.
YearPrivate CarBusTaxi
Fuel Type
GasolineDieselElectricNatural GasDieselHybrid PowerGasolineDieselHybrid Power
2017825,448122,253139848416269774996505789
20201,038,184144,2583233277310110001116494
Table 2. The VKT data of various vehicle categories in this study and other related research.
Vehicle TypeFuel TypeVKT in This StudyStatistical Data Error RateSun et al. [56]Error RateWang et al. [57] Error Rate
Private carGasoline
Diesel
18,000
km
18,000
km
0%18,707
km
3.9%16,128
km
10.4%
19,255
km
7.0%
BusElectric
Natural gas
Diesel
Hybrid power
74,000
km
60,000
km
18.9% 52,330
km
29.3%
90,202
km
21.9%
TaxiGasoline
Diesel
Hybrid power
120,000
km
12,000
km
0%107,448 km10.5%120,000 km0%
Table 3. Setting of weight parameters for different road types.
Road GradeRoad Volume
(pcu/h)
Vehicle Speed
(km/h)
Setting of Weight Parameters
Primary12,600600.35
Secondary8250400.20
Trunk6500800.30
Tertiary4800300.15
Table 4. Annual on-road transportation exhaust emissions (t) in Fuzhou for the years 2017 and 2020.
Road Type20172020
CO2COHCNOxCO2COHCNOx
Primary1,946,410485347020871,072,1031927182727
Secondary1,906,571475446020451,973,66035563351342
Trunk741,03918481797952,999,95953915092034
Tertiary1,433,921357534615382,044,08036763471387
Disclaimer/Publisher’s Note: The statements, opinions and data contained in all publications are solely those of the individual author(s) and contributor(s) and not of MDPI and/or the editor(s). MDPI and/or the editor(s) disclaim responsibility for any injury to people or property resulting from any ideas, methods, instructions or products referred to in the content.

