Abstract
Even though active mobility is considered a sustainable way of travelling in urban environments, this might not always be the case because of a lack of infrastructure and poor road safety standards. This study assesses, under an economic point of view, the health benefits of a shift from private cars to active mobility for urban travels in Italy, considering both mortality and morbidity effects. The overall health effect is the result of positive (increased physical activity) and negative effects (increased air pollutant intake and increased road injury risk). Health impacts are measured using disability-adjusted life years and translated into monetary terms using either the value of a life year or the value of a statistical life. On average, the overall health effect of the modal shift is negative. This is largely due to the very high pedestrian and bike road injury rates in Italian cities. The negative effect of increased air pollution intake is negligible if compared with the effect of road injuries. In the case of bikes/e-bikes, the overall health effect is positive in cities characterised by good cycling infrastructure.
1. Introduction
Increasing active mobility in urban areas, which includes walking and cycling, positively affects urban sustainability by providing environmental, health, economic and social benefits, in addition to promoting the efficient use of land. The environmental benefits include reduced air and noise pollution as well as a lower energy consumption in the transport sector. The main health benefits are due to the increase in physical activity, which, in turn, implies improved public health, better mental well-being and lower health care costs. The economic benefits yielded by active mobility are a reduction in the transportation cost for individuals, increased commercial activity in traffic-limited areas and job creation in the construction sector (for building cycling and walking infrastructure). The social benefits include enhanced social interactions between pedestrians and cyclists, equity among urban travellers and improved safety through a reduction in fatal and non-fatal road accidents (provided that a substantial share of total travels shift from passive to active mobility). Finally, active mobility can also have positive repercussions in terms of urban planning since it requires less space than cars, freeing up urban land for other uses such as parks, recreational areas, and green spaces. In the long term, active mobility could reduce reliance on cars and decrease the need for extensive road networks and parking facilities, leading to significant savings in infrastructure costs. Reduced traffic congestion can make urban transportation systems more efficient and resilient to disruptions.
This work assesses whether a shift from passive to active mobility really provides health benefits, therefore contributing to improving urban sustainability in Italian cities. To do so, this study builds on Mela and Girardi [1], in which the authors quantified—under an economic point of view—the health effects of active mobility for some Italian cities. The authors developed a 10-year commuting mode-changing scenario (given percentages of passive commuters would shift to active transport such as walking, biking and e-biking), and they estimated the overall impact of such a scenario on health, taking into account the positive effect of increased physical activity but also negative effects such as increased air pollution intake and road injury risk. The main limitation of that study was that only the effects on all-cause mortality were considered, while morbidity is also affected. The present work aims at overcoming this limitation, common to most of the literature on this topic, including the effects on morbidity in the assessment. Disease-specific dose-response functions are also used, such as the most up-to-date information on disease length, life expectancy by age and health status, city-specific air pollution levels, disease and road injury incidence and short- and long-term disability weights; these are parameters that were not always considered in Mela and Girardi [1].
To make the results of this work easily available to the scientific community, an R package has been developed, allowing the user to calculate unit benefit factors for each Italian province capital depending on a fully customisable array of variables (i.e., transportation modes or the share of total commuters switching transportation modes). The package can be requested by contacting the authors.
Even though it is well-established that physical inactivity is linked with higher mortality and morbidity rates [2], the fact that a shift from passive to active mobility leads to a decrease in both mortality and morbidity is not always straightforward. Walking or biking in an urban environment translates into an increase in air pollutant intake due to longer commuting times in polluted areas (such as urban streets) or higher ventilation rates [3]. Moreover, pedestrians and cyclists are more likely to suffer bad consequences from a road injury than people travelling by car or public transport. The combined effect of increased air pollutant intake and road injury risk might offset the benefits yielded by increased physical activity, as already pointed out by Mela and Girardi [1] for some Italian cities characterised by high pollution levels.
Taking morbidity effects into consideration might make the offsetting effect even worse. This study quantifies the health benefits linked with a shift from passive to active mobility for some selected Italian cities and aims at answering the following questions:
- Does a shift from passive to active mobility always yield a positive effect on health?
- Do health effects differ across the transportation modes considered (walking, bike, e-bike)?
- Are the health effects of such a shift the same across Italian province capitals?
The increase in physical activity is expected to have a positive effect on the health of those people switching transportation modes, while increased air pollution is expected to have a negative effect, albeit of a lower magnitude. A priori, it is more difficult to tell which is the effect of a change in road injury risk, because the modal shift might affect such road injury rates.
The unit monetary factors per kilometre travelled walking or riding a bike/e-bike are therefore estimated, which can be useful for mobility planning at the municipality level or a cost-benefit analysis. Even though many studies have assessed the health effects of a modal shift from passive to active mobility, most of them focus only on the physical effects, overlooking their economic value, a weakness that this work aims to overcome. This paper is organised as follows: Section 2 provides a review of the literature and an overview of the methodology developed and used. Section 3 illustrates the results, while Section 4 discusses them and Section 5 concludes.
2. Material and Methods
2.1. Literature Review
The literature on the health effects of active mobility is vast and expanding rapidly; for this reason, this section covers relatively recent works (since 2010) and focuses on those that consider morbidity other than just mortality effects.
Most of the literature is about the quantification of premature deaths or life years lost/gained in physical terms, without carrying out any economic evaluation, except for those works that estimate the effect on government health expenditure. Examples of studies focusing on the effects on general mortality are Deenihan and Caulfield [4], Edwards and Mason [5], Boarnet et al. [6], de Hartog et al. [7], Lindsay et al. [8], Rabl and de Nazelle [9], Grabow et al. [10], Rojas-Rueda et al. [11], Olabarria et al. [12] and Guariso and Malvestiti [13].
Similarly, morbidity is taken into account by Cobiac et al. [14], Götschi [15], Holm et al. [16], Maizlish et al. [17], Rojas-Rueda et al. [18], Xia et al. [19], Kriit et al. [20] and Rodrigues et al. [21]. Most of these studies quantify the impacts in terms of avoided deaths or avoided disability-adjusted life years (DALYs) and only some translate such impacts into monetary terms: Boarnet et al. [6], Cobiac et al. [14], Götschi [15], Lindsay et al. [8], Rabl and de Nazelle [9], Grabow et al. [10], Mulley et al. [22], Olabarria et al. [12], Deenihan and Caulfield [4], Guariso and Malvestiti [13], Rodrigues et al. [21], and Götschi et al. [23].
Jarrett et al. [24], Taddei et al. [25] and Kriit et al. [20] carry out the monetary assessment from a taxpayer’s point of view (change in government expenditure in health) and Guariso and Malvestiti [13] from a societal point of view, providing an economic estimate of the impacts of alternative active mobility scenarios in Milan, Italy.
An extensive literature review of the effects of active mobility on health can be found in Scheepers et al. [26] and Mueller et al. [27]. Mela and Girardi [1] provides unit benefit factors for kilometre walked or cycled (by both bike and e-bike) instead of driving a private car/motorbike for the main Italian cities, taking into account (like Taddei et al. [25] and Guariso and Malvestiti [13]) the negative effects of increased air pollutant intake and increased road injury risk. It is one of the very few studies providing such estimates while considering effects on mortality only and adopting a simplified approach for road injuries. All studies find a positive effect of active mobility on health since, usually, the positive effect of increased physical activity more than outweighs the negative effects of pollutant intake and road injury risk. E-bikes have almost never been included in studies assessing health impacts of active mobility, except for Mela and Girardi [1].
This work aims at overcoming most of the limitations that have been found reviewing the literature by quantifying the effects of both morbidity and mortality, expressing benefits/damages in economic terms, employing the most up-to-date and city-specific data on urban travels, road injuries and pollution, and taking into account the underlying physical activity levels.
The results of this work could be used to improve active mobility policies implemented by local governments aimed at reducing traffic congestion, enhance air quality and generate health benefits for the population. Even though the benefits of active mobility are often clear, policy-makers struggle in defining effective implementation policies as resources are scarce, people’s habits are die-hard and fossil fuel lobbies are powerful. Sarri et al. [28] show that the implementation of active travel programs often requires a combined solution and constant confrontation between local communities, policy-makers and stakeholders; this work aims at providing an additional tool to help policy-makers to find the right policy combination.
2.2. Methodology
2.2.1. General Methodology and Data Sources
The methodology followed to quantify the effects (either positive or negative) of additional physical activity and increased air pollutant intake is quite similar. The first step is the identification of diseases linked to either inactivity or air pollution (for simplicity reasons, only diseases linked to PM2.5 intake are considered [29]) and the dose-response functions linking the outcome (disease) to the exposure to a given condition (physical inactivity and air pollution). Such functions are then applied to the mean incidence of the diseases of interest in Italy. Incidence data are from the The Institute for Health Metrics and Evaluation [30] and are available for each age class between 18 and 64 years of age, even though at national level only. In this way, it is possible to calculate disease incidence before and after the treatment. Impacts on health are quantified with disability-adjusted life years (DALYs), a measure that combines life years lost to premature mortality (YLLs) and years lived in states of less than full health (years lost to disability or YLDs). One DALY represents the loss of the equivalent of one year of full health [31].
Average disease length, for each disease, is one of the parameters needed to estimate both YLLs and YLDs: a disease can lead to a premature death (or, in other words, shorten a person’s life expectancy) and/or force a person to a state of disability before death or full recovery. The main diseases linked to physical inactivity are stroke, ischemic heart disease, diabetes mellitus type 2, breast cancer, colon and rectal cancer and dementia; while diseases linked to air pollution are lung cancer, ischemic heart disease, stroke, diabetes mellitus type 2 and chronic respiratory disease.
In the case of stroke, data on life expectancy after diagnosis are from Peng et al. [32]. For lung cancer, data vary depending on several variables (i.e., time of diagnosis, treatment, etc.); an average length of 5.6 years is used [33]. In the case of ischemic heart disease, data are from Sommar et al. [34]; disease length is assumed to be of one year, with no changes in life expectancy. According to Rosenquist and Fox [35], if treated, diabetes mellitus type 2 does not affect quality of life significantly but can reduce life expectancy (6 years for people over 50 years of age, 15 years for people with diagnoses occurring at a younger age). Chronic bronchitis belongs to a broad group of diseases (chronic obstructive pulmonary disease or COPD); for people older than 65, a 2.5-year reduction in life expectancy is assumed, following Shavelle et al. [36] and Whitbourne [37]. In the case of breast cancer, it is not easy to find information on life expectancy after diagnosis and successful treatment of the disease. Therefore, a disease length of one year is assumed, with no consequences in terms of life expectancy [38]. Despite colon cancer, if diagnosed in the initial stages, having high survival rates and life expectancy, average values (across all disease stages and sexes) are used [39]. A life expectancy of 25 years for people younger than 50 years of age, 13 years for people between 50 and 64 years of age and further decreasing for older people is assumed. In the case of dementia, life expectancy referring to people suffering from Alzheimer’s disease is used: 10 years for people younger than 70 years of age, 5 years for older people [40].
To compute YLDs, data on disease length must be complemented with data on disease severity. A disability caused by a stroke is much more serious than a disability caused by a broken arm. Disability weights, for each disease considered, are from the 2019 edition of the Global Burden of Disease [30]. Since disability weights vary according to the severity of the illness and whether it is treated or not, assumptions were made: the illness is assumed to be treated with the best treatment available and—when appropriate—a medium level of severity is assumed. For most diseases, two disability weights are considered: one, generally higher, for the acute phase (first year or first months) and another for the chronic phase (if present). The relative risk associated with the business-as-usual (BAU) and the active commuting (ACT) scenarios are calculated using disease-specific dose-response functions (see Section 2.2.2 and Section 2.2.3), therefore the relative risk associated with the commuting mode change is given by:
where is the relative risk associated with the the active commuting scenario (i.e., walking instead of driving a car) and is the relative risk associated with the business-as-usual scenario (i.e., commuting by private car). is then applied to the total number of individuals shifting to active mobility to calculate the number of avoided (additional) cases of the diseases considered. Incidence of road injuries (involving both pedestrians and cyclists) in Italy is from the 2019 Global Burden of Disease [30] but data on disability weights are from the 2015 edition [41] and, for some outcomes, from Lapostolle et al. [42].
Assumptions were made about injury severity and short- and long-term disability as well for road injuries. More specifically, in the case of amputations, for the first year after injury non-treatment, disability weights are considered (i.e., crutches instead of prosthesis), while for the second year onward, treatment disability weights are considered. Amputations are assumed not to influence life expectancy. In the case of fractures, for the short term (usually one or a few months), disability factors from the Global Burden of Disease are used, while for the long-term, no complications are assumed and therefore a generic long-term disability factor is used (“fractures, treated (long term)”). For multiple fractures, an average disability weight is used (acute period of two months). Wound disability weights are used for contusions (length of one month). Traumatic brain injuries (TBIs) are among the most dangerous injuries that pedestrians and cyclists can incur and probably the most difficult to model in our work. TBIs can either have lifelong consequences or not, but that does not necessarily depend on their severity; mild TBIs can have lifelong consequences and a severe TBI might not, and vice versa. In the case of TBIs, data on disease length, severity and disability weights are from Haagsma et al. [43], who provides data on the share of mild/severe TBIs with lifelong consequences and the share of mild/severe TBIs without lifelong consequences. Such shares are applied to the TBI incidence data from the Global Burden of Disease. Average disease length is assumed to be equal to 3 months for mild TBIs and 2.5 years for moderate/severe TBIs that do not generate permanent damage. Lifelong consequences are instead assumed for mild TBIs (with permanent damage), while for severe TBIs with permanent damage, other than lifelong consequences, a nine-year reduction in life expectancy is also assumed. Finally, in case of muscular injuries, we assumed an illness length of two months and no change in life expectancy.
Mortality and morbidity impacts from increased physical activity and air pollutant intake are measured in DALYs and translated into monetary units using the value of a life year (VOLY). The EU Handbook on the External Costs of Transport recommends to use the VOLY to evaluate a change in life expectancy [44]. The VOLY is also used to quantify—under an economic point of view—the morbidity impact of road injuries, while the value of a statistical life (VSL) is preferred to evaluate premature deaths generated by road injuries [44]. VOLY and VSL data refer to the European Union [44] and are transferred to the Italian context with value transfer techniques [45]. Since the health effects of a shift from passive to active mobility materialise in the future, their economic values are discounted to the present with Italy’s social discount rate (2.4%), calculated following Ramsey [46]. Discounting is relatively easy for years lost to disability, while for years of life lost, it is more complicated. Premature death occurs after a certain number of years of illness (lived with disability); therefore, years of life lost are calculated considering the age at which the disease is diagnosed (year zero), the number of years of illness and the difference between the life expectancy at the age of death and the age of death itself.
Commuting data are from the Italian commuting matrix [47], which provides data on the number of commuters (either for work or education reasons) for all Italian municipalities. Data include reason for travelling, sex, transportation mode, commuting time slots and travel length in kilometres. Data refer to 29 million individuals in 2011, the most recent year for which data are available. Starting from commuting data, it is possible to build different scenarios of commuting mode change. For example, one could be interested in the health impacts of the shift of 20% of private car commuters (in, say, the 3–10 km round-trip commuting distance range) to bikes in Florence.
The authors developed an R package to carry out this study. The package allows the user to estimate the economic impact of a mobility shift on health for all Italian province capitals using fully customisable scenarios. Impacts refer to a year in which the health effects of the modal shift are fully effective. The package is available upon request to the authors.
The assumptions made to develop the mobility-change scenario for this study vary according to city topography (hilly towns and cities are less suitable to active commuting) and are shown in Table 1. It is assumed that the modal shift is, for all cities, from private cars to a variable proportion of walking/bike/e-bike.

Table 1.
Shares of total commuters shifting from private cars to active mobility.
A town is defined “hilly” if it meets the following criteria:
- The altitude of the city centre is at or above 300 m above sea level,
- The altitude of the city centre is below 300 m, but the ratio between the median altitude of the whole municipality and the altitude of the city centre is higher than 3.
The latter is to take into account coastal towns with hilly topography, such as Naples or Genoa. The list is, however, adjusted to exclude towns that meet the second criteria only because their municipality area is very large and, therefore, includes mountainous areas, but with the city centre located in the plain (i.e., Palermo, Reggio Calabria, Pistoia, etc.).
2.2.2. Physical Activity and Disease Incidence
The scientific literature identifies six diseases for which there is evidence of an inverse relationship between relative risk (RR) and amount of weekly physical activity [48]: ischemic heart disease, stroke, diabetes mellitus type 2, breast cancer, colon and rectal cancer and Alzheimer’s disease and other dementias. Dose-response functions (dose-response functions relate exposure to physical activity to health outcomes (namely incidence of some non-communicable diseases)) are extrapolated from Woodcock et al. [49], except for stroke [34]. For all diseases considered, dose-response functions are assumed to be curvilinear (following Woodcock et al. [49]): in other words, changes in disease risk are log-linearly associated with a power transformation of exposure to physical activity (measured in metabolic equivalent- or MET-hours per week).
where is relative risk, is the amount of weekly physical activity expressed in MET, b is a disease-specific coefficient and e is a power transformation. Following Woodcock et al. [49] and Sommar et al. [34], e is assumed equal to for diabetes mellitus type 2 and equal to for all other diseases considered. Table 2 summarises all parameters considered.
Table 2.
Physical activity dose-response functions used by disease considered.
The b parameter can be calculated, for each disease, from Equation (2), plugging in the parameters shown in Table 2, which refer to the relative risk associated with a change from 0 to the amount of weekly MET reported in the “Exposure corresponding to RR” column. To compute the amount of physical activity in the two commuting scenarios, the underlying levels of age-specific physical activity are taken into account [50].
2.2.3. Air Pollution
The (negative) effects of increased air pollutant intake are quantified with dose-response functions similar to Equation (2) but with as in Guariso and Malvestiti [13] and Mela and Girardi [1], making it a linear relationship. Even though many air pollutants have negative effects on human health, this study considers the effects of particulate matter (PM2.5) only, which is one of the pollutants on which the literature have focused the most [7,13,51]. Inhaled doses are computed considering the background PM2.5 concentrations in Italian municipalities [52] and other parameters such as ventilation rate (the amount of air inhaled per unit of time, which depends on the underlying physical activity) and exposure time. Ventilation rate data are from the literature [7,13,51,53,54]. Time spent commuting is approximated using mode-specific average speeds in an urban environment [55]. Activity-specific coefficients [51] are used to take into account the fact that some activities take place at air pollutant concentrations that are higher than background concentrations (i.e., cycling or walking in an urban environment). Minimum doses of PM2.5 needed to have an effect on human health are disease-specific. Inhaled doses are calculated following Guariso and Malvestiti [13] with the following formula:
where is the ventilation rate of each m activity carried out during the day, is the time spent in each activity and is the PM2.5 concentration (background concentration adjusted with a specific correction factor) in the atmosphere while performing activity m. Activities considered during the day are: sleep (eight hours), commuting (time depending on distance and transportation mode), leisure physical activity (time varies according to individual preferences, approximated with Eurostat data [50]) and work/rest (all remaining time). Parameters of dose-response functions are summarised in Table 3.
Table 3.
Air pollution dose-response functions used by disease considered.
2.2.4. Injury Risk
A shift from passive to active travelling might translate into an increase in road injury risk, especially if it is assumed that the shift is not large enough to significantly reduce motorised traffic. The assessment is carried out adopting the relatively simple approach proposed by Kahlmeier et al. [51], who use road injury rates (total number of road injuries involving pedestrians or cyclists on total distance travelled) to estimate the number of additional road injuries caused by an increase in active commuters. Injury rates, however, do not refer to a country as a whole, like in Mela and Girardi [1] or Kahlmeier et al. [51], but are calculated for each of the Italian province capitals. The total number of fatal and non-fatal road injuries involving pedestrians and/or cyclists, for each city, are from Istat [57]. Only road injuries that took place on urban roads are considered. Data are available from 2018 to 2021 (average figures are used) by age class. The total amount of kilometres travelled on foot and by bike in a given year is estimated with Equation (4).
where is the number of kilometres travelled per year in a given municipality, is municipality population, is the share of total population travelling on any given day, is the number of of all-mode trips per person per day, is the share of walking/bike trips on total trips and is the average length of such trips. Data on , and are from Isfort (Istituto superiore di formazione e ricerca per i trasporti) reports on mobility habits in Italy [55,58,59,60]. Isfort data are at NUTS1 level, except those on mobility demand (), which are at national level only. Road injury rates for e-bikes are assumed to be the same as those referring to conventional bikes. Road injuries involving cyclists have a frequency that varies significantly across Italian province capitals, as shown in Figure 1, in which the relationship between non-fatal injury road rate involving bikes and bike paths per capita is pictured. Non-fatal road injury rates seem to be inversely related to the presence of bike lanes. The picture also looks similar when considering fatal road injuries only.
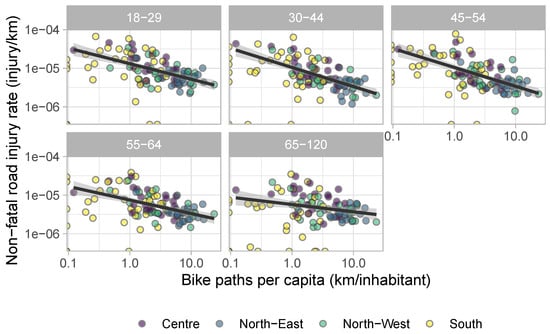
Figure 1.
Relationship between non-fatal road injuries and bike path extension in some Italian cities by age group (log scale).
Figure 2 illustrates the relationship between population density and fatal road injuries involving pedestrians. Population density is often found positively correlated with road safety [61]; this is likely due to lower vehicle speed in urban areas and greater use of public transport. This does not mean that cities are a “safe” place for pedestrians since, in absolute terms, the majority of casualties occur in urban environments. Cities are also places where active mobility could be more easily implemented since most trips are short enough to be walked or cycled [61]. Data from Italian cities confirm this hypothesis, at least for fatal injuries. When it comes to non-fatal injuries, the relationship is no longer straightforward. This is probably because impacts—in urban areas—occur at a lower speed than in extra-urban environments and—albeit more common—are less often lethal.
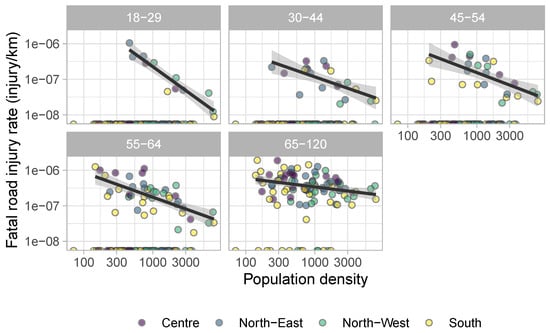
Figure 2.
Relationship between pedestrian fatal road injuries and population density in some Italian cities by age group (log scale).
Data on road injury incidence are broken down into all different injury types (i.e., fractures, concussions, etc.) using data from the 2019 Global Burden of Disease [30]. Data refer to the relative incidence of individual injury types to total injuries for pedestrians and cyclists, respectively. Disability weights of road injuries are from The Institute for Health Metrics and Evaluation [41] and Lapostolle et al. [42]. Life expectancy is assumed not to change after an injury, even a serious one (except for traumatic brain injuries). As shown in Section 3, traumatic brain injuries (TBI) are the injury type responsible for most of the damage associated with road injuries. To avoid overestimating the damage from TBIs, however, incidence data from the Global Burden of Disease are broken down into injuries with and without permanent damage, as illustrated in Section 2.2.1.
3. Results
The evaluation is carried out for all Italian regional capitals, divided between plain and hilly towns.
On average, the overall health impact of a shift from passive to active mobility is negative for all active transportation modes considered, as Figure 3 shows. Each km travelled by bike/e-bike or walking instead of by private car/motorbike generates an overall health effect of −0.245, −0.301 and −0.251 euro/km, respectively.
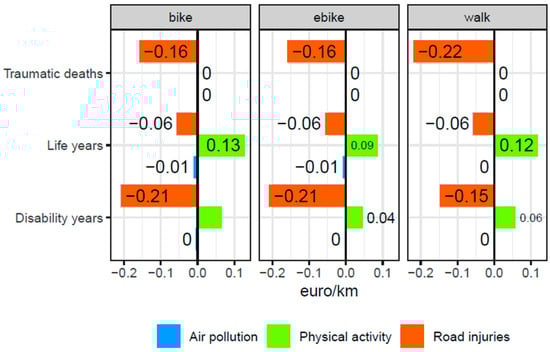
Figure 3.
Health effects of active mobility—average values.
This result is mainly due to the sharp increase in road injury risk associated with the modal shift. If the risk were null, the overall impacts would be all positive and equal to 0.178, 0.121 and 0.172 euro/km for bike, e-bike and walking, respectively. Therefore, the low safety of Italian roads leads to counter-intuitive results: on average, it is better for someone’s health to travel by car rather than by bike/e-bike or on foot. The picture, however, is not the same in every Italian province capital, as Figure 4 shows.
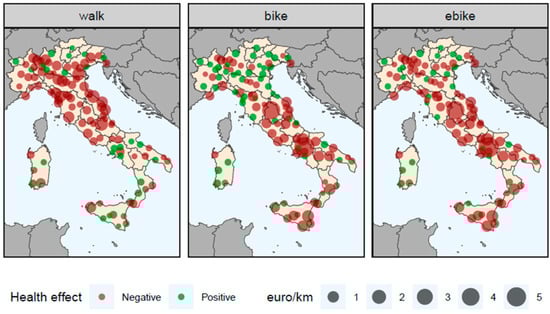
Figure 4.
Overall health effects of a shift from passive to active mobility.
If road injury risk is considered, a shift from passive to active mobility is likely to lead to negative health effects in most Italian cities and towns, depending on the underlying road injury rates.
A shift from private cars to walking is more likely to yield positive health effects in cities/towns in the south of the country, while the opposite is true for bikes and e-bikes. The switch from passive to active mobility triggers a strong increase in road injury risk which, together with increased air pollution intake, more than offsets the positive effects due to increased physical activity.
As shown in Figure 5, non-fatal injury rates per km travelled are much higher than car injury rates in every Italian NUTS3 region. In the case of bikes, non-fatal injury rates are particularly high in rural regions where bike or walking infrastructure is scarce and the average vehicle speed is high, making collision consequences worse. In the case of walking, non-fatal injury rates tend to be higher in provinces with a high degree of urbanisation, where collisions are more likely to happen.
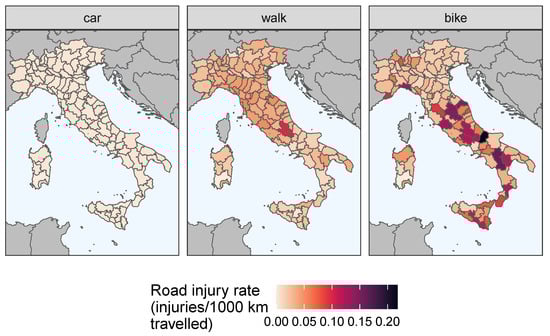
Figure 5.
Non-fatal road injury rate in Italian NUTS3 regions (injuries/1000 km travelled).
The picture looks similar if fatal injury rates are considered (Figure 6): biking and walking have, on average, higher rates than cars, even though the difference is less striking with respect to non-fatal injuries.
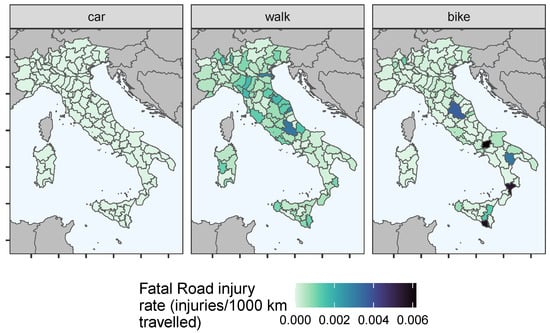
Figure 6.
Fatal road injury rate in Italian NUTS3 regions (injuries/1000 km travelled).
Figure 7 illustrates the results for the main Italian cities: the asterisks denote the level of positive health effects that would counterbalance the negative health effects due to air pollution and road injuries. The negative impact of air pollution is almost negligible for all cities, even the most polluted ones (Milan, Turin, Bologna). The impact of physical activity tends to be higher in hilly cities like Genoa and Naples. The importance of road injuries is always high and, in most cases, the negative effect of increased road injury risk offsets the positive effect of increased physical activity. Nonetheless, in big cities, overall positive effects of a modal change are possible in the following circumstances and cities:
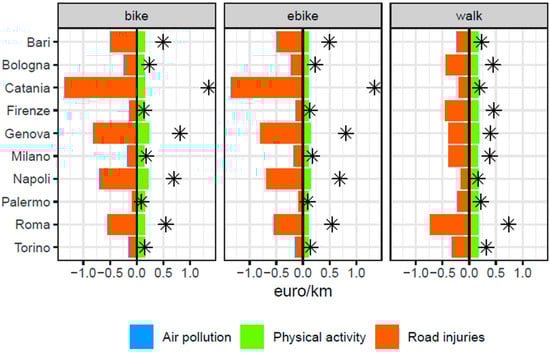
Figure 7.
Health effects of a shift from passive to active mobility for selected cities (the asterisks denote the level of positive health effects that would counterbalance the negative health effects due to air pollution and road injuries).
- From cars to walking: Naples;
- From cars to conventional bikes: Palermo and Florence;
- From cars to e-bikes: Palermo.
When road injuries are not taken into account—see Figure 8—the overall impact of active mobility on health is positive in all Italian cities considered, underlining the great role road injury risk has in affecting the results.
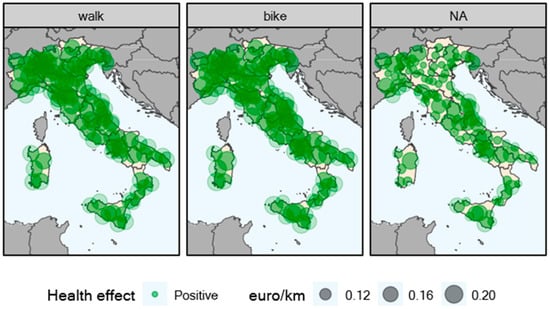
Figure 8.
Health effects of a shift from passive to active mobility (physical activity and air pollution only).
The health conditions that impacted the final value of the indicator the most are displayed in Figure 9.
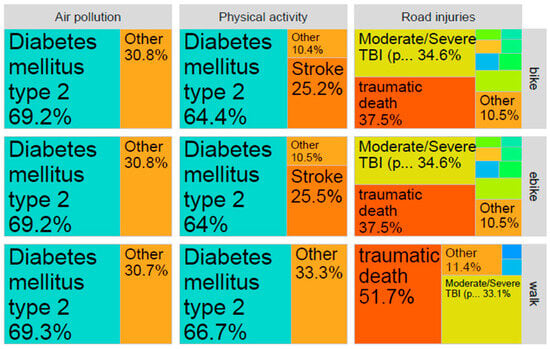
Figure 9.
Health conditions: relative importance of individual outcomes for every dimension considered.
The outcomes that affect health the most are the same across all three active modes considered. The positive effect of physical activity on health is mainly due to the reduction in the number of people contracting or dying from diabetes mellitus (type 2). Diabetes mellitus (type 2) is also the health outcome responsible for most of the damage caused by increased air pollutant intake. The picture changes when it comes to road injuries, however. The outcomes that make the most of the overall health damage caused by increased road injury risk are traumatic deaths and moderate/severe TBI with permanent damage. The former is especially important in the case of pedestrians.
4. Discussion
This work quantifies the benefit factors per kilometre travelled associated with a shift from passive (private car) to active (walking, bike, e-bike) mobility, considering the effects on both morbidity and mortality.
The overall effect is, on average, negative, due to the very high road injury rates in Italy. This is an important result since previous works have usually found a positive impact. The literature on the health effects of active mobility is ample, even though relatively few works have tried to attach a monetary value to such effects. Moreover, a comparison with the existing literature is not straightforward since the starting assumptions and countries considered are rarely similar across studies. Some studies consider health effects on mortality only [8,13,23] and use the value of a statistical life for monetisation instead of the value of a life year as it seems more appropriate for traumatic deaths [44]. Finally, not all studies providing monetary estimates take into account changes in road injury risk or costs for the health service, as Genter et al. [48] and Mulley et al. [22] instead do. Figure 10 shows a comparison between the results of this study and the studies providing an economic valuation found in the literature. Such a comparison is, however, difficult because of the very different working assumptions. Genter et al. [48] and Mulley et al. [22] seem to be the works more easily comparable to this one because they consider both mortality and morbidity as well as changes in road injury risk and in the expenditure of the national health service. Mela and Girardi [1], Guariso and Malvestiti [13] and Lindsay et al. [8] consider the effects on mortality only. In any case, this work is the only one finding a negative overall impact on health (on average over all Italian province capitals). This negative effect is largely due to the very high road injury rates in Italian cities.
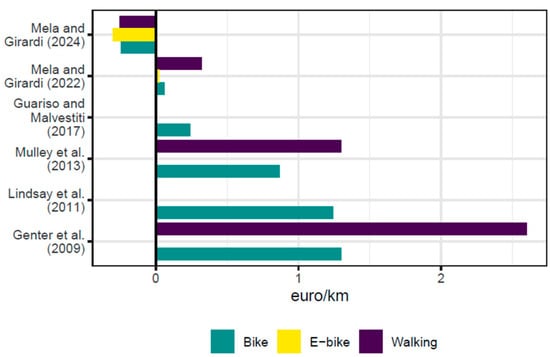
Figure 10.
Health effects of a shift from passive to active mobility in comparison with the literature [1,8,13,22,48].
This work contributes to the existing literature in many ways. First, it provides benefit factors of e-bikes, other than conventional bikes and walking. Second, it uses the VOLY for the monetisation of health impacts, except for traumatic deaths following road injuries, in full accordance with the approach proposed by the Handbook on the External Costs of Transports. Third, it provides unit factors (per km travelled) which can be used by policy makers and urban planners in Italy. Some of these features are shared with Mela and Girardi [1], although the latter considers the effects on mortality only.
Strengths and Limitations
The main strength of this work is that it combines several elements that can be found in many different works on the health effects of active mobility to develop unit benefit factors encompassing morbidity and mortality effects while considering city-specific air pollution levels, road injury rates, life expectancy, demographic structure data and mode shares. Data on the underlying physical activity levels of the population, commuting data other than mode shares and the composition of road injuries by type (i.e., concussion, broken leg, etc.) are at higher aggregation levels. The methodology developed is fully integrated with the approach proposed by the Handbook on the External Costs of Transport of the European Commission. Finally, the development of a freely available R package allows researchers to use values tailor-made to their policy site and might spur suggestions on methodological improvements from the user community.
Even though the results might seem discouraging, as they show that travelling by bike or walking (instead of by car), in Italy, does not provide health benefits, they should be used to spur a radical change in urban planning. Better bike and pedestrian infrastructure and a 30 km/h speed limit in urban areas could significantly reduce road injury rates and make the overall balance positive, as already happens in many European cities. The room for improvement is very large, as Figure 11 shows (data are from International Transport Forum [61]): Italian cities are among those with the highest fatal bike road injury rates in the countries surveyed by International Transport Forum [61], one and sometimes two orders of magnitude higher than those of the safest cities. Data on non-fatal bike injuries and on pedestrian injuries are likely to be similar.
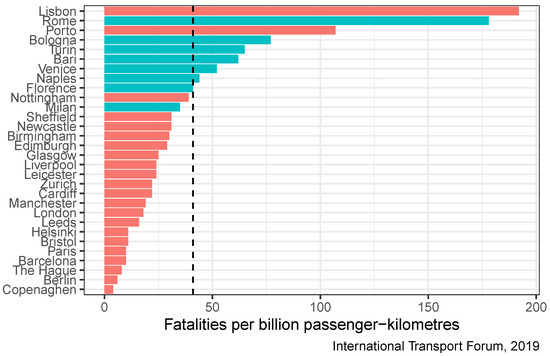
Figure 11.
Bike road injury rates in selected European cities (Fatalities per billion passenger-kilometres). The dashed line is the sample average, blue bars denote Italian cities [61].
This work is characterised by a high degree of uncertainty in some variables and their interaction, which undermines, at least partially, the robustness of the results. The highest level of uncertainty concerns road injury rates after the modal shift, as no changes in road injury rates are assumed. In other words, even though the share of people travelling by bike increases and the share of people driving decreases, road injury rates are assumed to be constant, while, a priori, it is reasonable to expect, when the numbers become significant, a decrease in road injury risk, both in number and in severity. This omission is not desired nor wanted, but we have not, at our disposal, urban traffic models that would allow us to take this important factor into account. A change in mode shares could also affect overall air pollution concentrations, even though the negative effect of air pollutant intake on health is much lower than that of injuries. Another minor limitation is that the health impacts of increased physical activity and air pollutant intake are assumed to be the same across all age groups. These problems could be overcome by accessing more detailed data and/or adopting a Bayesian modelling approach to produce a set of results depending on the variation within the data and the likelihood of interaction between the variables themselves.
5. Conclusions
This study quantifies the health effects of a shift from passive private mobility to active mobility (walking, bike, e-bike) for Italian province capitals, considering the effects on both mortality and morbidity.
The health effects are assessed across three dimensions: increased physical activity (positive effect), increased air pollutant intake (negative effect) and increased road injury risk (negative effect). The health effects are expressed in monetary units (using the VLS and the VOLY) per kilometre travelled, a useful measure for policy-makers and urban planners.
The results show that, taking into account road injury risk, the overall effect is negative for most cities and all three active modes considered. Positive values, in the case of walking, occur mostly in the south of Italy, and, in the case of bikes and e-bikes, in the north, where the cycling infrastructure is better. This is due to the very high road injury rates, which, for most Italian cities, are amongst the highest in the European Union. Increased physical activity improves health mainly through reduced incidence of diabetes mellitus type 2, while most of the damage carried by road injuries is due to traumatic deaths and traumatic brain injury (with permanent damage), highlighting the importance, at least for cyclists, to wear helmets while travelling.
Author Contributions
G.M.: Conceptualization, Investigation, Supervision, Methodology, Formal analysis, Writing—review and editing; P.G.: Project administration, Supervision, Writing—review and editing. All authors have read and agreed to the published version of the manuscript.
Funding
The authors did not receive any specific funding for this work.
Data Availability Statement
Research data may be made available by the authors upon request.
Acknowledgments
This work has been financed by the Research Fund for the Italian Electrical System under the Three-Year Research Plan 2022–2024 (DM MITE n. 337, 15.09.2022) in compliance with the Decree of 16 April 2018.
Conflicts of Interest
Authors Giulio Mela and Pierpaolo Girardi were employed by Sviluppo Sostenibile e Fonti Energetiche, Ricerca sul Settore Energetico (RSE). The remaining authors declare that the research was conducted in the absence of any commercial or financial relationships that could be construed as a potential conflict of interest.
References
- Mela, G.; Girardi, P. Health Effects of Active Mobility and Their Economic Value: Unit Benefit Factor Estimates for Italy. J. Transp. Health 2022, 26, 101487. [Google Scholar] [CrossRef]
- Ezzati, M.; Hoorn, S.V.; Lopez, A.D.; Danaei, G.; Rodgers, A.; Mathers, C.D.; Murray, C.J.L. Comparative Quantification of Mortality and Burden of Disease Attributable to Selected Risk Factors. In Global Burden of Disease and Risk Factors; Lopez, A.D., Mathers, C.D., Ezzati, M., Jamison, D.T., Murray, C.J., Eds.; World Bank: Washington, DC, USA, 2006. [Google Scholar]
- Dons, E.; Laeremans, M.; Orjuela, J.P.; Avila-Palencia, I.; Carrasco-Turigas, G.; Cole-Hunter, T.; Anaya-Boig, E.; Standaert, A.; De Boever, P.; Nawrot, T.; et al. Wearable Sensors for Personal Monitoring and Estimation of Inhaled Traffic-Related Air Pollution: Evaluation of Methods. Environ. Sci. Technol. 2017, 51, 1859–1867. [Google Scholar] [CrossRef]
- Deenihan, G.; Caulfield, B. Estimating the Health Economic Benefits of Cycling. J. Transp. Health 2014, 1, 141–149. [Google Scholar] [CrossRef]
- Edwards, R.D.; Mason, C.N. Spinning the Wheels and Rolling the Dice: Life-cycle Risks and Benefits of Bicycle Commuting in the U.S. Prev. Med. 2014, 64, 8–13. [Google Scholar] [CrossRef]
- Boarnet, M.G.; Greenwald, M.; McMillan, T.E. Walking, Urban Design, and Health: Toward a Cost-Benefit Analysis Framework. J. Plan. Educ. Res. 2008, 27, 341–358. [Google Scholar] [CrossRef]
- De Hartog, J.J.; Boogaard, H.; Nijland, H.; Hoek, G. Do the Health Benefits of Cycling Outweigh the Risks? Environ. Health Perspect. 2010, 118, 1109–1116. [Google Scholar] [CrossRef] [PubMed]
- Lindsay, G.; Macmillan, A.; Woodward, A. Moving Urban Trips from Cars to Bicycles: Impact on Health and Emissions. Aust. N. Z. J. Public Health 2011, 35, 54–60. [Google Scholar] [CrossRef]
- Rabl, A.; de Nazelle, A. Benefits of Shift from Car to Active Transport. Transp. Policy 2012, 19, 121–131. [Google Scholar] [CrossRef]
- Grabow, M.L.; Spak, S.N.; Holloway, T.; Stone, B.; Mednick, A.C.; Patz, J.A. Air Quality and Exercise-Related Health Benefits from Reduced Car Travel in the Midwestern United States. Environ. Health Perspect. 2012, 120, 68–76. [Google Scholar] [CrossRef]
- Rojas-Rueda, D.; de Nazelle, A.; Teixidó, O.; Nieuwenhuijsen, M. Replacing Car Trips by Increasing Bike and Public Transport in the Greater Barcelona Metropolitan Area: A Health Impact Assessment Study. Environ. Int. 2012, 49, 100–109. [Google Scholar] [CrossRef]
- Olabarria, M.; Perez, K.; Santamarina-Rubio, E.; Novoa, A.M.; Racioppi, F. Health Impact of Motorised Trips That Could Be Replaced by Walking. Eur. J. Public Health 2013, 23, 217–222. [Google Scholar] [CrossRef]
- Guariso, G.; Malvestiti, G. Assessing the Value of Systematic Cycling in a Polluted Urban Environment. Climate 2017, 5, 65. [Google Scholar] [CrossRef]
- Cobiac, L.J.; Vos, T.; Barendregt, J.J. Cost-Effectiveness of Interventions to Promote Physical Activity: A Modelling Study. PLoS Med. 2009, 6, e1000110. [Google Scholar] [CrossRef] [PubMed]
- Götschi, T. Costs and Benefits of Bicycling Investments in Portland, Oregon. J. Phys. Act. Health 2011, 8, S49–S58. [Google Scholar] [CrossRef] [PubMed]
- Holm, A.L.; Glümer, C.; Diderichsen, F. Health Impact Assessment of Increased Cycling to Place of Work or Education in Copenhagen. BMJ Open 2012, 2, e001135. [Google Scholar] [CrossRef] [PubMed]
- Maizlish, N.; Woodcock, J.; Co, S.; Ostro, B.; Fanai, A.; Fairley, D. Health Cobenefits and Transportation-Related Reductions in Greenhouse Gas Emissions in the San Francisco Bay Area. Am. J. Public Health 2013, 103, 703–709. [Google Scholar] [CrossRef]
- Rojas-Rueda, D.; de Nazelle, A.; Teixidó, O.; Nieuwenhuijsen, M.J. Health Impact Assessment of Increasing Public Transport and Cycling Use in Barcelona: A Morbidity and Burden of Disease Approach. Prev. Med. 2013, 57, 573–579. [Google Scholar] [CrossRef] [PubMed]
- Xia, T.; Nitschke, M.; Zhang, Y.; Shah, P.; Crabb, S.; Hansen, A. Traffic-Related Air Pollution and Health Co-Benefits of Alternative Transport in Adelaide, South Australia. Environ. Int. 2015, 74, 281–290. [Google Scholar] [CrossRef]
- Kriit, H.K.; Williams, J.S.; Lindholm, L.; Forsberg, B.; Sommar, J.N. Health Economic Assessment of a Scenario to Promote Bicycling as Active Transport in Stockholm, Sweden. BMJ Open 2019, 9, e030466. [Google Scholar] [CrossRef]
- Rodrigues, P.; Alvim-Ferraz, M.; Martins, F.; Saldiva, P.; Sá, T.; Sousa, S. Health Economic Assessment of a Shift to Active Transport. Environ. Pollut. 2020, 258, 113745. [Google Scholar] [CrossRef]
- Mulley, C.; Tyson, R.; McCue, P.; Rissel, C.; Munro, C. Valuing Active Travel: Including the Health Benefits of Sustainable Transport in Transportation Appraisal Frameworks. Res. Transp. Bus. Manag. 2013, 7, 27–34. [Google Scholar] [CrossRef]
- Götschi, T.; Kahlmeier, S.; Castro, A.; Brand, C.; Cavill, N.; Kelly, P.; Lieb, C.; Rojas-Rueda, D.; Woodcock, J.; Racioppi, F. Integrated Impact Assessment of Active Travel: Expanding the Scope of the Health Economic Assessment Tool (HEAT) for Walking and Cycling. Int. J. Environ. Res. Public Health 2020, 17, 7361. [Google Scholar] [CrossRef] [PubMed]
- Jarrett, J.; Woodcock, J.; Griffiths, U.K.; Chalabi, Z.; Edwards, P.; Roberts, I.; Haines, A. Effect of Increasing Active Travel in Urban England and Wales on Costs to the National Health Service. Lancet 2012, 379, 2198–2205. [Google Scholar] [CrossRef] [PubMed]
- Taddei, C.; Gnesotto, R.; Forni, S.; Bonaccorsi, G.; Vannucci, A.; Garofalo, G. Cycling Promotion and Non-Communicable Disease Prevention: Health Impact Assessment and Economic Evaluation of Cycling to Work or School in Florence. PLoS ONE 2015, 10, e0125491. [Google Scholar] [CrossRef] [PubMed]
- Scheepers, C.; Wendel-Vos, G.; den Broeder, J.; van Kempen, E.; van Wesemael, P.; Schuit, A. Shifting from Car to Active Transport: A Systematic Review of the Effectiveness of Interventions. Transp. Res. Part A Policy Pract. 2014, 70, 264–280. [Google Scholar] [CrossRef]
- Mueller, N.; Rojas-Rueda, D.; Cole-Hunter, T.; de Nazelle, A.; Dons, E.; Gerike, R.; Götschi, T.; Int Panis, L.; Kahlmeier, S.; Nieuwenhuijsen, M. Health Impact Assessment of Active Transportation: A Systematic Review. Prev. Med. 2015, 76, 103–114. [Google Scholar] [CrossRef]
- Sarri, P.; Tzouras, P.G.; Tsigdinos, S.; Kaparias, I.; Kepaptsoglou, K. Incorporating Land Use and Transport Interaction Models to Evaluate Active Mobility Measures and Interventions in Urban Areas: A Case Study in Southampton, UK. Sustain. Cities Soc. 2024, 105, 105330. [Google Scholar] [CrossRef]
- Yang, S.; Fang, D.; Chen, B. Human Health Impact and Economic Effect for PM2.5 Exposure in Typical Cities. Appl. Energy 2019, 249, 316–325. [Google Scholar] [CrossRef]
- The Institute for Health Metrics and Evaluation. Global Burden of Disease (GBD). 2023. Available online: https://www.healthdata.org/research-analysis/gbd (accessed on 28 August 2023).
- World Health Organization. Global Health Observatory—Disability-Adjusted Life Years (DALYs). 2021. Available online: https://www.who.int/data/gho/indicator-metadata-registry/imr-details/158 (accessed on 21 June 2021).
- Peng, Y.; Ngo, L.; Hay, K.; Alghamry, A.; Colebourne, K.; Ranasinghe, I. Long-Term Survival, Stroke Recurrence, and Life Expectancy After an Acute Stroke in Australia and New Zealand From 2008–2017: A Population-Wide Cohort Study. Stroke 2022, 53, 2538–2548. [Google Scholar] [CrossRef]
- Cancer Research UK. Survival for Lung Cancer. 2023. Available online: https://www.cancerresearchuk.org/about-cancer/lung-cancer/survival (accessed on 28 August 2023).
- Sommar, J.N.; Johansson, C.; Lövenheim, B.; Schantz, P.; Markstedt, A.; Strömgren, M.; Stigson, H.; Forsberg, B. Overall Health Impacts of a Potential Increase in Cycle Commuting in Stockholm, Sweden. Scand. J. Public Health 2022, 50, 552–564. [Google Scholar] [CrossRef]
- Rosenquist, K.J.; Fox, C.S. Mortality Trends in Type 2 Diabetes. In Diabetes in America, 3rd ed.; Cowie, C.C., Casagrande, S.S., Menke, A., Cissell, M.A., Eberhardt, M.S., Meigs, J.B., Gregg, E.W., Knowler, W.C., Barrett-Connor, E., Becker, D.J., et al., Eds.; National Institute of Diabetes and Digestive and Kidney Diseases (US): Bethesda, MD, USA, 2018. [Google Scholar]
- Shavelle, R.M.; Paculdo, D.R.; Kush, S.J.; Mannino, D.M.; Strauss, D.J. Life Expectancy and Years of Life Lost in Chronic Obstructive Pulmonary Disease: Findings from the NHANES III Follow-up Study. Int. J. Chronic Obstr. Pulm. Dis. 2009, 4, 137–148. [Google Scholar] [CrossRef] [PubMed]
- Whitbourne, K. Life Expectancy With COPD. 2023. Available online: https://www.webmd.com/lung/copd/features/copd-life-expectancy (accessed on 28 August 2023).
- Cancer Research UK. Breast Cancer Survival Statistics. 2015. Available online: https://www.cancerresearchuk.org/health-professional/cancer-statistics/statistics-by-cancer-type/breast-cancer/survival (accessed on 28 August 2023).
- Soerjomataram, I.; Thong, M.S.Y.; Ezzati, M.; Lamont, E.B.; Nusselder, W.J.; van de Poll-Franse, L.V. Most Colorectal Cancer Survivors Live a Large Proportion of Their Remaining Life in Good Health. Cancer Causes Control 2012, 23, 1421–1428. [Google Scholar] [CrossRef] [PubMed][Green Version]
- Alzheimer’s Society. The Later Stage of Dementia|Alzheimer’s Society. 2021. Available online: https://www.alzheimers.org.uk/about-dementia/symptoms-and-diagnosis/how-dementia-progresses/later-stages-dementia (accessed on 28 August 2023).
- The Institute for Health Metrics and Evaluation. Global Burden of Disease Study 2015 (GBD 2015) Disability Weights|GHDx. 2015. Available online: https://ghdx.healthdata.org/record/ihme-data/gbd-2015-disability-weights (accessed on 28 August 2023).
- Lapostolle, A.; Gadegbeku, B.; Ndiaye, A.; Amoros, E.; Chiron, M.; Spira, A.; Laumon, B. The Burden of Road Traffic Accidents in a French Departement: The Description of the Injuries and Recent Changes. BMC Public Health 2009, 9, 386. [Google Scholar] [CrossRef] [PubMed]
- Haagsma, J.A.; Polinder, S.; Lyons, R.A.; Lund, J.; Ditsuwan, V.; Prinsloo, M.; Veerman, J.L.; van Beeck, E.F. Improved and Standardized Method for Assessing Years Lived with Disability after Injury. Bull. World Health Organ. 2012, 90, 513–521. [Google Scholar] [CrossRef]
- European Commission. Handbook on the External Costs of Transport: Version 2019; Publications Office: Luxemburg, 2019. [Google Scholar]
- Navrud, S.; Ready, R. (Eds.) Environmental Value Transfer: Issues and Methods; Springer: Dordrecht, The Netherlands, 2007. [Google Scholar]
- Ramsey, F.P. A Mathematical Theory of Saving. Econ. J. 1928, 38, 543–559. [Google Scholar] [CrossRef]
- Istat. Matrici del pendolarismo. 2014. Available online: https://www.istat.it/it/archivio/139381 (accessed on 29 August 2023).
- Genter, J.A.; Donovan, S.; Petrenas, B.; Badland, H. Valuing the Health Benefits of Active Transport Modes; Technical Report 359; New Zealand Transport Agency: Auckland, New Zealand, 2009. [Google Scholar]
- Woodcock, J.; Givoni, M.; Morgan, A.S. Health Impact Modelling of Active Travel Visions for England and Wales Using an Integrated Transport and Health Impact Modelling Tool (ITHIM). PLoS ONE 2013, 8, e51462. [Google Scholar] [CrossRef]
- Eurostat. Time Spent on Health-Enhancing (Non-Work-Related) Aerobic Physical Activity by Sex, Age and Educational Attainment Level. 2014. Available online: https://ec.europa.eu/eurostat/data/database (accessed on 18 June 2021).
- Kahlmeier, S.; Castro, A.; Brand, C. Health Economic Assessment Tool (HEAT) for Walking and for Cycling Methods and User Guide on Physical Activity, Air; Technical Report December; Univeristy of Zurich: Zurich, Switzerland, 2017. [Google Scholar]
- World Health Organization. Air Quality Database. 2022. Available online: https://www.who.int/data/gho/data/themes/air-pollution/who-air-quality-database (accessed on 7 November 2022).
- PT Direct. Respiratory Responses to Exercise—PT Direct. 2021. Available online: https://www.ptdirect.com/training-design/anatomy-and-physiology/acute-respiratory-responses (accessed on 28 June 2021).
- Sperlich, B.; Zinner, C.; Hebert-Losier, K.; Born, D.P.; Holmberg, H.C. Biomechanical, Cardiorespiratory, Metabolic and Perceived Responses to Electrically Assisted Cycling. Eur. J. Appl. Physiol. 2012, 112, 4015–4025. [Google Scholar] [CrossRef]
- Isfort. 18° Rapporto sulla Mobilità degli Italiani—Governare le Transizioni per Una Ripresa Sostenibile; Technical report; Istituto Superiore di Formazione e Ricerca per i Trasporti (Isfort): Rome, Italy, 2021. [Google Scholar]
- Kienzler, S.; Soares, J.; González Ortiz, A.; Plass, D. Estimating the Morbidity Related Environmental Burden of Disease 625 Due to Exposure to PM2.5, NO2 and O3 in Outdoor Ambient Air. Eionet Report—ETC HE Report 2022/11, European 626 Topic Centre on Human Health and the Environment. 2022. Available online: https://www.eionet.europa.eu/etcs/etc-he/products/etc-he-products/etc-he-reports/etc-he-report-2022-11-estimating-the-morbidity-related-environmental-burden-of-disease-due-to-exposure-to-pm2-5-no2-and-o3-in-outdoor-ambient-air (accessed on 13 August 2024).
- Istat. Survey on Road Accidents Resulting in Death or Injury: Public Use Micro. 2021. Available online: https://www.istat.it/en/archivio/87804 (accessed on 29 August 2023).
- Isfort. 15° Rapporto Sulla Mobilità Degli Italiani; Technical report; Istituto Superiore di Formazione e Ricerca per i Trasporti (Isfort): Rome, Italy, 2018. [Google Scholar]
- Isfort. 16° Rapporto Sulla Mobilità Degli Italiani; Technical report; Istituto Superiore di Formazione e Ricerca per i Trasporti (Isfort): Rome, Italy, 2019. [Google Scholar]
- Isfort. 17° Rapporto sulla Mobilità degli Italiani—Tra Gestione del Presente e Strategie per il futuro; Technical report; Istituto Superiore di Formazione e Ricerca per i Trasporti (Isfort): Rome, Italy, 2020. [Google Scholar]
- International Transport Forum. Road Safety in European Cities Performance Indicators and Governance Solutions; Technical Report 67; OECD Publishing: Paris, France, 2019. [Google Scholar]
Disclaimer/Publisher’s Note: The statements, opinions and data contained in all publications are solely those of the individual author(s) and contributor(s) and not of MDPI and/or the editor(s). MDPI and/or the editor(s) disclaim responsibility for any injury to people or property resulting from any ideas, methods, instructions or products referred to in the content. |
© 2024 by the authors. Licensee MDPI, Basel, Switzerland. This article is an open access article distributed under the terms and conditions of the Creative Commons Attribution (CC BY) license (https://creativecommons.org/licenses/by/4.0/).