Abstract
In response to ever-increasing pressure from stakeholders to reduce the impact of their operations and supply chain on the natural environment, firms frequently make public commitments to improve environmental performance. However, the commitments are difficult to validate and thus of unknown quality. Understanding whether and when the commitments are valid proxies for action is essential because they are used by environmentally conscious stakeholders to assess firm environmental performance in anticipation of buying from, investing in, working for, or selling to a firm. Results from examining 442 U.S. manufacturing firms show that firms generally follow through on such commitments. Larger firms and firms with better environmental performance are more likely to follow through. However, firms tend not to follow through if they are experiencing negative environmental publicity or resource constraints at the time of the commitment. The results provide important insights for environmentally conscious stakeholders who use the commitments to determine whether to buy from, invest in, work for, or supply to a firm. The study also highlights the benefits to firm leaders of following through and provides input towards ideas that can increase follow-through. Finally, the study contributes to several streams of the research literature, including the literature evaluating environmental management, environment commitments, and environmental accidents.
1. Introduction
Since the beginning of the conservation movement in the 1960s, firm leaders have increasingly prioritized the impact of company operations on the natural environment. To address stakeholder concerns, senior leaders often make public “environmental commitments” to (a) reduce the use of water, energy, and materials (process inputs) or (b) reduce greenhouse gases and hazardous emissions (process outputs). These commitments appear to bind a firm to a specific course of action [1], thereby increasing the likelihood of follow-through. Over the past two decades, they have gained popularity as environmentally conscious stakeholders exert growing pressure on firms to act responsibly towards the environment [2,3]. These commitments are publicized through forums frequented by stakeholders, such as sustainability reports, company websites, and 10-K filings. Commitments to reduce greenhouse gases (GHGs) have become especially popular since the 2015 United Nations climate change conference in Paris (COP21). Agreements made at the conference led to GHG reduction pledges by nations that together account for more than half of the world’s GHG emissions. As of 2022, approximately 75% of the world’s companies had made emission reduction commitments [4], including 71% of the world’s largest 100 companies and 80% of the world’s largest 250 companies.
While commitments to reduce hazardous emissions are particularly popular, firms regularly make both types of commitments, i.e., commitments to reduce the use of process inputs and commitments to reduce harmful process outputs. For example, in the United States (the focus of this study), 76% of Fortune 100 companies and 60% of Fortune 500 companies had made a commitment of one or both types by 2021 [5]. While environmental commitments convey firm intentions to external stakeholders, they are difficult to validate and thus of unknown quality [6]. Understanding whether and when firms follow through on environmental commitments is important because they are central to performance assessments made by environmentally conscious investors, customers, suppliers, and employees who want to invest in, buy from, sell to, or work for environmentally responsible firms.
To our knowledge, no study has yet evaluated whether firms follow through on environmental commitments. Recent studies focus on “targets” and show that firms follow through on emission reduction targets when the targets are harder to achieve [7,8], have a longer target time frame, and are measured as absolute emission reductions [8]. As opposed to a “target”, which carries no stated or implied guarantee, a commitment is an implied guarantee and may thus be associated with greater follow-through. If true, and given the frequency of the commitments, they may be valuable to stakeholders as predictors of future firm environmental performance. As part of our investigation, we separately evaluate both types of commitments, i.e., “emission reduction” commitments and “resource reduction” commitments. While reducing hazardous emissions is needed to address global warming and improve human health, conservationists have long understood the importance of reducing process inputs, i.e., water, energy, and materials [9]. Water is non-renewable and scarce in many parts of the world, energy usage increases GHG emissions, and raw materials often end up in landfills. We also evaluate factors that influence the validity of a commitment. Given that firms have significant discretion over the decision to follow through, contextual conditions at the time of the commitment may affect commitment quality. Finally, we evaluate which firm attributes promote follow-through. Such knowledge would be valuable to firms wanting to increase follow-through and for environmental stakeholders developing interventions to increase follow-through.
Follow-through in the study is measured as increases in the number of environmental management practices (EMPs) a firm adopts. EMPs, such as revising processes, conducting audits, and changing supplier selection criteria, are the operational changes firms make to improve environmental performance. Adopting EMPs is thus how a firm would follow through on an environmental commitment. Further, since EMP adoption is directly associated with environmental performance (e.g., [10,11,12,13,14]), it is a proxy for, and leading indicator of, environmental performance. Using a novel panel dataset compiled from multiple sources and representing 442 public U.S. manufacturing firms, we find that firms generally follow through on an environmental commitment, whether the commitment is to reduce resource consumption or reduce hazardous emissions. We next evaluate the robustness of an environmental commitment by testing whether firms follow through after experiencing an environmental accident (EA). EAs damage a firm’s reputation [15], increasing pressure to make a commitment to bolster their reputation. However, EAs require often-significant capital and labor resources for clean-up and fine payment [16], which may impact a firm’s ability to follow through. Results show that firms tend not to follow through on a commitment should they have recently experienced an EA. This suggests that commitment quality depends on the contextual conditions at the time of the commitment. Finally, we evaluate two firm attributes that may promote follow-through, even after an EA: firm environmental performance and firm size. Good environmental performers have better environmental reputations and thus more to lose should they fail to follow through on a commitment. Larger firms are more visible to stakeholders and possess more resources. Visibility would increase reputational pressure to follow through and resources could address resource constraints caused by an EA. The results support both proposals, i.e., better environmental performers and larger firms are more likely to follow through on an environmental commitment, even after an EA. The conclusions are robust to endogeneity, econometric method, and an alternate approach for measuring EMP adoption.
This study makes important contributions to practice and theory. For environmentally conscious stakeholders, the results provide an understanding of whether and when firms follow through on an environmental commitment. Firms frequently make such commitments and stakeholders use the commitments to determine whether to buy from, invest in, work for, or supply to a firm. Should commitment quality be affected by firm events other than an EA, which similarly cause stress and resource constraints, such as a product recall, commitment reliability would diminish further. The results from investigating firm size lead to several ideas to promote follow-through, including publicly promoting firms that report environmental impact data to CDP, publicizing firms that do not, and mandating public disclosure for all forms of environmental impact (see Section 5.1 for details). For firm leaders, the study highlights the benefits of following through on a commitment and provides suggestions for those wishing to follow through but lacking resources or know-how (see Section 5.1). For firm leaders who make environmental commitments without intending to follow through, the study serves as a caution that a motivated stakeholder could assess follow-through using the methods in this study.
The study also contributes to several streams of the literature. A nascent but growing literature on environmental commitments has examined follow-through on emission reduction targets [7,8]. This study extends that literature by evaluating environmental commitments, including commitments to reduce resource usage (such as water, energy, and material), and examining how contextual conditions at the time of the commitment affect commitment quality. The study also contributes to the environmental management literature by identifying a new driver of firm environmental management activity, an “internal” commitment to improve environmental performance. Prior studies have primarily evaluated how “external” pressure from stakeholders impacts firm environmental activity (e.g., [17,18,19]). Finally, the study contributes to the environmental accident literature by showing that environmental accidents influence operational decision making and to a growing greenwashing literature that evaluates the conditions under which firms share incomplete information about their environmental actions and intentions to promote a “green” image to stakeholders [20,21].
2. Literature Review and Hypotheses Development
2.1. Environmental Commitments
Despite the popularity of environmental commitments, no peer-reviewed study (to our knowledge) has evaluated whether firms follow through on them. In a preprint study, ref. [22] evaluate the drivers of emission reduction commitments and find that commitments are more likely to be made by firms that are already good environmental performers, already publicly disclose emissions data, and operate in industries with higher levels of commitment. Regarding environmental “targets”, ref. [7] find that firms are more likely to follow through on emission reduction targets if the targets are more difficult to achieve. Ref. [8] confirm the Ioannou finding and additionally find that emission reduction targets are more likely to lead to reductions if they have a longer time frame and are measured as absolute emission reductions. Finally, ref. [23] find that follow-through on corporate environmental “policy” commitments varies by industry.
2.2. Do Firms Follow through on Environmental Commitments?
Firms regularly make public statements to convey private information about their business and intentions to the public. Commitments are a powerful type of public statement because they seemingly bind an organization to a future course of action [1]. External stakeholders interpret environmental commitments as signals of a firm’s intent to change practices, processes, strategies, and other aspects of their business operations [24]. Firms that follow through on commitments build good reputations [25], and a good reputation provides a difficult-to-imitate competitive advantage [26,27] and increases trust with stakeholders [28]. Trust and reputation increase the reliability of firm reputational signals important to potential consumers, suppliers, investors, employees, and NGOs, creating a virtuous cycle.
A firm that follows through on an environmental commitment builds a reputation as environmentally responsible [29,30], and environmentally responsible firms find it easier to attract customers and employees [31,32]. A good environmental reputation also reduces the cost of capital, potentially increasing valuation and making it easier to attract investors [29,33,34]. Also, by conforming to societal expectations, firms with a good environmental reputation obtain legitimacy and a “license to operate” (Ref. [35], p. 81). In sum, the reputational benefits realized from following through on an environmental commitment should motivate firms to follow through. However, additional motivation may be found in a firm’s desire to avoid the consequences of not following through. Perceived “greenwashers”, whether fair or not, lose customer and employee trust [36,37], leading to unhappy customers [38]. They also suffer reputational losses [39] and reduced financial performance [37].
Additional support for concluding that firms will typically follow through on an environmental commitment is found in the fact that commitments initiate internal firm actions that promote follow-through. Commitment from top management is a critical antecedent to adopting and implementing management programs and initiatives [40], such as quality improvement programs [41,42], just-in-time [43,44], ISO 9000 [45], and information technology initiatives [46]. In the context of the natural environment, senior management commitment has been connected to an organization’s pro-environmental orientation [47], higher levels of commitment by subordinate managers [48], and managers increased appreciation for the importance of environmental management, especially in dirtier industries [49]. The cascading commitments and actions should result in greater follow-through on firm environmental commitments. Taken together, we conclude that firms will typically follow through on an environmental commitment because they realize significant advantages from following through, suffer severe consequences if they do not, and a commitment initiates internal firm actions that promote follow-through.
Hypothesis 1 (H1).
Most firms will follow through on a corporate commitment to improve environmental performance.
2.3. The Robustness of Environmental Commitments
While we expect most firms to follow through on an environmental commitment, information asymmetry between firms and stakeholders makes it difficult for stakeholders to validate follow-through. Given the significant discretion firms are afforded over the follow-through decision, the reliability of an environmental commitment may be sensitive to contextual conditions at the time of the commitment. To evaluate the robustness of an environmental commitment, we test whether firms follow through after experiencing an environmental accident (EA). EAs occur frequently and can damage a firm’s reputation and legitimacy [15,50]. This might increase pressure on a firm to make a commitment to bolster their environmental reputation. In fact, research shows that firms can manage negative perceptions of their reputation and legitimacy just by making an environmental commitment, i.e., “talking trash” [51,52]. At the same time, EAs may hinder a firm’s ability to follow through because they require often-significant labor and capital resources for clean-up and fine payment [16]. Given that adopting EMPs also requires resource investments [14], the resources needed to follow through on an environmental commitment following an EA may already be committed to resolving the EA. An EA may also draw attention and resources away from regular environmental management activities [53] or cause a firm to pause adoption while it investigates the efficacy of existing EMPs to prevent a future EA [10]. Thus, while an EA may motivate a firm to make an environmental commitment, it likely reduces a firm’s ability or desire to follow through. Given the benefits of making environmental commitments, the challenges of following through, and the significant discretion firms have over the follow-through decision, we conclude that most firms will not follow through on an environmental commitment following an EA.
Hypothesis 2 (H2).
Following an environmental accident, firms are less likely to follow through on a corporate commitment to improve environmental performance.
2.4. Firm Attributes That Promote Follow-Through
The prior arguments are population averages, i.e., some firms likely have no intention of following through on an environmental commitment and some firms likely follow through regardless of the obstacles. We now consider two firm attributes that may promote follow-through, even after an EA: firm environmental performance and firm size. An EA would bring unwanted media attention and public scrutiny to a firm, increasing the possibility of getting caught not following through on an environmental commitment, i.e., being perceived as a greenwasher. As mentioned, the consequences of greenwashing can be significant. However, the consequences only matter if a firm has something to lose. Compared to firms with lesser environmental performance, better environmental performers will have developed a better environmental reputation and realized reputational benefits (discussed previously). Since better performers would have more to lose should they get caught not following through on an environmental commitment and an EA increases the chance of getting caught, we conclude they will be more likely to follow through on an environmental commitment following an EA.
Hypothesis 3a (H3a).
Better environmentally performing firms are more likely to follow through on a corporate commitment to improve environmental performance following an environmental accident.
Prior research has shown that larger firms are more likely to undertake environmental initiatives [54,55], publicly disclose environmental performance [56], and have higher-quality environmental disclosures [57]. These factors should increase the likelihood of following through. In the studies, firm size is associated with visibility and access to resources. Larger firms consume more natural resources and generate more emissions, making them more visible to NGOs and regulators. Larger firms are also more visible to consumers and investors. As such, larger companies receive greater scrutiny following a negative environmental event [58,59]. Since firms facing public scrutiny are more likely to follow through on an environmental commitment [20,21], larger firms are more likely to follow through on an environmental commitment following an EA.
Larger firms also have more labor and capital resources [55]. This is an important consideration when firms wrestle with resource constraints following an EA. As mentioned, clean-up costs and fines associated with resolving an EA can be significant [16]. The resource investments required to implement EMPs can also be significant [14]. We previously argued that resource constraints hinder a firm’s ability to follow through on an environmental commitment following an EA because the resources needed to adopt EMPs may already be allocated to resolving the EA. Since larger firms have more capital and labor, they are more likely to have the resources needed to resolve resource conflicts and follow through on an environmental commitment following an EA.
Hypothesis 3b (H3b).
Larger firms are more likely to follow through on a corporate commitment to improve environmental performance following an environmental accident.
Our research model is summarized in Figure 1:
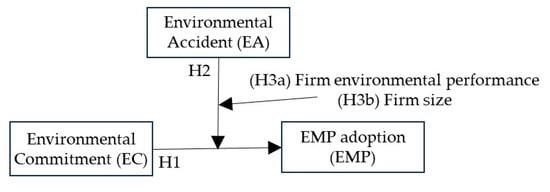
Figure 1.
Research model.
3. Data and Empirical Strategy
3.1. Data Sources
The data used in the study are gathered from several sources. Measures for environmental commitment, EMP adoption, and environmental accidents are created using ASSET4, a Thomson Reuters’s sustainability dataset that has been used in related academic research (e.g., [60,61,62,63]). ASSET4 is also used to create control variables for ISO 9000 adoption, quality management system adoption, environmental news, and environmental management system adoption. The environmental performance variable is developed using MSCI (formerly KLD), another sustainability dataset frequently used in academic research (e.g., [64,65,66]). Several control variables are created using Worldscope and Compustat, global financial and economic datasets [62,63,67]. Finally, a measure for industry environmental risk is created using First for Sustainability, an innovation of the International Finance Corporation [62]. The timeframe for the study is 2002–2013, because data on environmental commitments were unavailable prior to 2002 and the criteria Thomson Reuters used to capture an environmental commitment changed after 2013. The unit of analysis is firm-year and the panel is unbalanced since new firms enter the sample each year. The final sample includes 442 U.S. manufacturing firms. Only U.S. firms are evaluated to eliminate country-based heterogeneity in environmental rules, regulations, and cultures that may influence what firms say and do about their environmental performance. Only manufacturing industries are evaluated because they are a primary source of pollution [49] and their environmental commitments are thus of greater concern.
3.2. Variables
3.2.1. Dependent Variable
EMP Adoption (EMPs): Environment management practices (EMPs) are the operational changes firms make to reduce the negative impact of their operations and supply chain on the natural environment. Examples include changing processes, revising supplier selection criteria, adopting environmental standards, implementing revised performance measurement systems, increasing performance transparency (such as publishing an annual sustainability report), and implementing product life cycle management. Adopting EMPs is thus how a firm would follow through on an environmental commitment. Further, since the number of EMPs a firm adopts is positively associated with environmental performance (e.g., [10,11,12,13,14,68]), EMP adoption is a proxy for, and leading indicator of, environmental performance. EMP adoption is calculated as the number of environmental management practices (EMPs) that a firm reports adopting in the prior year, minus any drops, plus any new adoptions [62,63]. The final evaluation set includes the 50 EMPs relevant to every firm in the sample and evaluated in every sample year (see Appendix A for a list). To support a robustness check, EMP adoption is also calculated as the adoption percentage of EMPs “most relevant” to an industry (“most relevant” EMPs are those adopted by at least one firm in an industry).
3.2.2. Independent Variable
Environmental Commitment (EC): Firms commit to improving environmental performance by sharing the commitment on public forums frequented by stakeholders, such as sustainability reports, company websites, or 10-k filings. They can make two types of commitments: a commitment to reduce resource usage and a commitment to reduce emissions. The two commitments fully cover the ways in which a firm can mitigate the impact of their firm or supply chain on the natural environment [69]. Resource reduction refers to the reduced usage of production inputs, such as electricity, coal, natural gas, oil, nuclear energy, direct material, and water. Emission reduction refers to reductions in production outputs harmful to the natural environment, such as hazardous and non-hazardous production waste, CO2, hazardous gases (such as NOX, and SOX), volatile organic compounds, and water pollutants. To evaluate our research hypotheses, we create three binary variables, i.e., did a firm make either type of environmental commitment (EC), did a firm specifically make a resource reduction (RR) commitment, and did a firm specifically make an emission reduction (ER) commitment.
3.2.3. Moderating Variables
Environmental Accident (EA): An EA is an event published in the media linking a firm to a chemical, oil, or fuel spill, or any other incident that suggests a firm negatively impacted the natural environment. Thomson Reuters analysts create the variable by continuously scanning public and private news sources, such as newspapers, on-line news outlets, and company websites, removing duplicates, and then counting the number of unique accidents a firm has experienced in a measurement year.
Firm Environmental Performance: Using MSCI’s (formerly KLD) sustainability dataset, the variable is measured on a continuous (integer) scale as the sum of a firm’s environmental “strengths” minus the sum of its environmental “concerns” (e.g., [64,66]). MSCI evaluates eight environmental strength categories, including beneficial products and services, pollution prevention, recycling, clean energy, communications, property, plant, and equipment (PPE), management systems, and “other” strengths, and seven environmental concern categories, including hazardous waste, regulatory problems, ozone-depleting chemicals, substantial emissions, agricultural chemicals, climate change, and “other” concerns [70]. Since each category is measured on a binary scale (0,1), the resultant variable could have a maximum score of 8 and a minimum score of −7.
Firm Size: Measured as the natural log of net sales ([17,18]).
3.2.4. Control Variables
Several firm and industry variables are added to all empirical models to control for their influence on EMP adoption. We first include the firm and industry variables shown by Hardcopf et al. (2019) [62] to influence EMP adoption. Firm controls include firm size (sales), profitability (ROA), labor intensity, adopting ISO 9000, and adopting a quality management system. Industry controls include munificence, dynamism, complexity, competition, and environmental risk. See Hardcopf et al. (2019) [62] for measurement details.
- Several other firm-level control variables are also added:
- Environmental News: News outlets write news stories about a firm’s negative impact on the natural environment. For example, they may write about a firm’s impact on biodiversity, the impact of a firm’s products on the natural environment, and the impact of a firm on local communities. While unrelated to firm actions, the stories negatively reflect on a firm’s environmental performance and thus may influence the number of EMPs a firm adopts. Since there would likely be a delay between a negative news story and changes to EMP adoption, we control for the stories in empirical models by including a count of the stories in the year immediately preceding EMP adoption (period t − 1).
- Environmental Management System (EMS): An EMS is a set of processes and practices used by firms to evaluate and improve environmental performance. Implementation is often certified by a third-party organization. Examples include ISO 14000/14001 [71] and the European Union’s Eco-Management and Audit Scheme (EMAS). Since an EMS identifies gaps in environmental performance and adopting EMPs is how firms address the gaps, there may be correlation between the use of a certified EMS and the number of EMPs a firm adopts. Firms using a certified EMS are also less likely to experience an environmental accident. We thus include a control variable in all empirical models coded as “1” if a firm uses a certified EMS and “0” otherwise.
- CEO Change: Firm leaders play a key role in determining a firm’s environmental and sustainability strategy [72]. Thus, a CEO change may influence a firm’s environmental strategy and the number of EMPs they adopt. To capture whether a firm experienced a change in CEO, we use data from Compustat’s Execucomp database. It is set to 1 in the current year if a CEO change occurred in the prior year and 0 if not. A 1-year lag is implemented because it likely takes time for a new CEO to change firm environmental policies.
- Percent of Income from Foreign Sources: U.S.-based firms in our sample may generate income from foreign operations that may be subject to different institutional pressures, affecting firm choices regarding EMP adoption. For example, research shows that increased revenue from foreign sources is associated with the magnitude of a firm’s selective disclosure [20]. The variable is operationalized as the ratio of foreign-sourced revenue to total revenue.
- Year Fixed-Effects: Included to control for annual increases in EMP adoption.
- Industry Fixed-Effects: Included to control for industry-specific differences in EMP adoption.
The study variables are summarized in Table 1. Descriptive statistics and correlations are provided in Table 2. As shown, most firm and industry control variables are correlated with EMP adoption, supporting their inclusion in the study. Variance Inflation Factors (VIFs) are calculated for all models to evaluate multicollinearity. All are below 5 except for the three-way interaction used to evaluate firm size (H3b). We thus mean-center all variables involved in interactions when evaluating H2, H3a, and H3b [73]. Mean-centering reduces VIFs below 10, ameliorating multicollinearity concerns [74].

Table 1.
Study variables.
Table 2.
Descriptive statistics and correlations.
3.3. Empirical Approach
Our identification strategy assumes that an environmental commitment and EMP adoption are tightly linked temporally (cause and effect occur within close time proximity). We also assume adoption of EMPs may begin slightly before or in anticipation of a commitment. Since we do not know the commitment date, EMP adoption is evaluated in the year of a commitment and in the following year. The following equations express our identification strategy and are used to evaluate research hypotheses:
(H1) EMPit = α + βCit, t−1 + γ(Environmental Commitment)it, t−1 + εit
(H2) EMPit = α + βCit, t−1 + γ(Environmental Commitment)it + δ(Environmental Accident)it, t−1 + η(Environmental Commitmentit × Environmental Accidentit, t−1) + εit
(H3a) EMPit = α + βCit, t−1 + γ(Environmental Commitment)it + δ(Environmental Accident)it, t−1 + ϵ(Environmental Performance)it + two-way interactions + η(Environmental Commitmentit × Environmental Accidentit, t−1 × Environmental Performanceit) + εit
(H3b) EMPit = α + βCit, t−1 + γ(Environmental Commitment)it + δ(Environmental Accident)it, t−1 + ϵ(Firm Size)it + two-way interactions + η(Environmental Commitmentit × Environmental Accidentit, t−1 × Firm Sizeit) + εit
- where EMPit represents EMP adoption for firm i in year t and Cit, t−1 represents a vector of control variables, as described in Section 3.2.4. Time periods t and t − 1 represent the years concurrent with and prior to EMP adoption, respectively. Following our identification strategy, an environmental commitment is evaluated in period t because we expect a tight temporal relationship with EMP adoption and in period t − 1 to assess spillover effects.
Hypotheses are evaluated using the General Estimating Equation (GEE) model developed by Liang and Zeger (1986) [75]. Other methods that evaluate count data were considered, including ordinary least squares (OLS), Poisson, and negative binomial regression. OLS is not appropriate because using a linear model to predict non-linear count data is likely to produce nonsensical, negative predicted values. OLS also requires variance assumptions that are likely to be violated by our data [76]. Poisson regression is not appropriate because our data are highly over-dispersed (the ratio of dependent variable variance to the mean is 14.52) and Poisson regression requires the ratio to be roughly 1. While negative binomial regression can handle over-dispersion [76], it assumes independence of individual observations, a condition violated in our data through examination using a Wooldridge test [77]. In comparison to the aforementioned models, GEE (“xtgee” in Stata) addresses serial correlation, allows for robust standard errors, and averages out unobserved differences between firms, which can be a source of latent heterogeneity [78,79]. GEE models are thus useful for evaluating repeated count data [80] and are particularly useful for analyzing over-dispersed count data when autocorrelation and unobserved cross-sectional heterogeneity may be present [18,75,81,82,83,84]. The GEE model implemented assumes the dependent variable is negative binomially distributed, uses a log link function, and deploys an exchangeable correlation structure. Note that fixed effects regression and hierarchical linear modeling (HLM) are evaluated as robustness checks.
4. Results
4.1. Main Results
We first evaluate whether a commitment leads to firms adopting more EMPs (H1). The results are presented in Table 3. In the first analysis, the independent variable is an environmental commitment (EC) of either type and the dependent variable is the full set of 50 EMPs. Following our identification strategy, we evaluate both contemporaneous and lagged relationships. We find that making an environmental commitment results in a 32% increase in current-year EMP adoption (Model 2, β = 0.28 or about 6.3 EMPs) and a 17% increase in following-year EMP adoption (Model 3, β = 0.16 or about 3.4 EMPs). We next separately evaluate a resource reduction (RR) commitment and an emission reduction (ER) commitment. In the analyses, the independent variable is the specific commitment and the dependent variable includes only EMPs that could be used to implement that commitment, i.e., 22 EMPs can be used to reduce resource consumption and 23 EMPs can be used to reduce emissions. Note that five EMPs can fulfill either type of commitment (see Appendix A for details). The categorization of EMPs by purpose was completed by Thomson Reuters as part of developing the ASSET4 dataset. The results from evaluating RR (Models 4 and 5) and ER commitments (Models 6 and 7) match those from evaluating EC, i.e., larger current-year increases and smaller following-year increases. The results provide strong support for H1 and a conclusion that firms generally follow through on environmental commitments.
Table 3.
Dependent Variable: Number of EMPs. Influence of environmental commitment (H1).
We next evaluate the robustness of an environmental commitment by testing whether an environmental accident (EA) influences (moderates) the relationship between an environmental commitment and EMP adoption (H2). An EA puts pressure on firms to demonstrate their commitment to the natural environment while simultaneously creating obstacles that make it difficult for firms to follow through on a commitment. As before, we separately evaluate EC (RR or ER), RR, and ER. While we only show results in Table 4 for the contemporaneous relationship between an environmental commitment and EMP adoption (for brevity), similar results are observed when testing the lagged relationship. Moderation is signaled by a significant beta coefficient connected with the interaction between an environmental commitment and an EA (Venkatraman 1989). As shown, an EA negatively moderates the relationship between an environmental commitment and EMP adoption, whether the accident occurred in the current (Models 1, 3, and 5) or prior period (Models 2, 4, and 6). Thus, firms that make environmental commitments after experiencing an EA adopt fewer EMPs than they would have adopted had they not experienced an accident. The magnitude of the reduction increases as firms experience more EAs. Since the beta connected to the environmental commitment variable is about twice as large as that connected to the interaction term in all models, the interpretation is that a firm that makes a commitment and experiences one EA increases EMP adoption but adopts fewer EMPs than they would have adopted in the absence of an EA. A firm that experiences two EAs (~50% of firms that experience accidents) has no net gain in EMP adoption. A firm that experiences three or more EAs adopts fewer EMPs than they did in the prior year. The results are supported by interaction plots (for EC, Figure 2a,b). In the plots, an EA is coded as a binary variable, i.e., the firm experienced an EA or not. As shown, an environmental commitment in the absence of an EA (dashed line) results in significantly increased levels of EMP adoption. However, should a firm experience one or more EAs (solid line), an environmental commitment results in reduced levels of EMP adoption, regardless of the period in which the EA occurred. Thus, whether a firm follows through on an environmental commitment by adopting more EMPs depends on whether the firm recently experienced an EA. The combined results support H2.
Table 4.
Dependent Variable: Number of EMPs. Moderating effect of an environmental accident (H2).
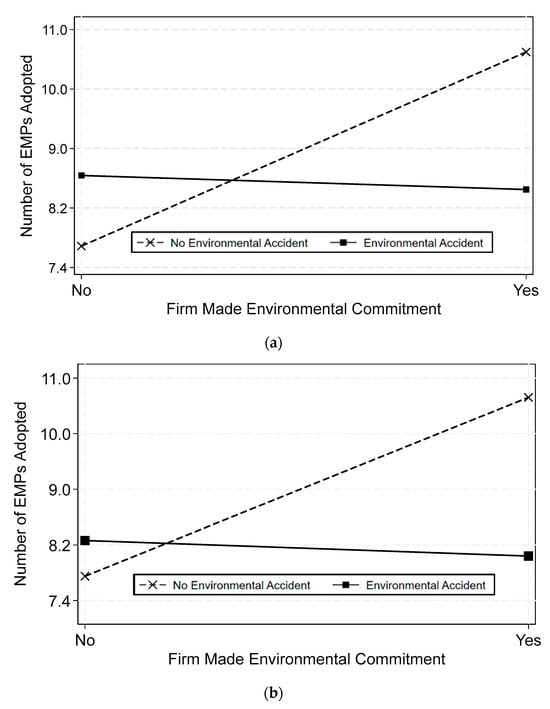
Figure 2.
(a) Interaction plot for accidents at time t. (b) Interaction plot for accidents at time t − 1.
In the final investigations, we evaluate whether a firm’s environmental performance (H3a) or size (H3b) promote follow-through, even if the firm experienced an EA. Firms with better environmental performance will have a better environmental reputation and more legitimacy with key stakeholders, thus more to lose should they not follow through on an environmental commitment. An EA increases public scrutiny of firm behavior and the chance of getting caught not following through on a commitment. Having more to lose and an increased chance of getting caught should promote follow-through. Moderation is again tested using moderated regression analysis. As with the prior analyses, we separately evaluate EC, RR, and ER. As shown in Table 5, following an EA, better environmental performers do not follow through on resource reduction (RR) commitments but do follow through on emission reduction (ER) commitments. The results provide partial support for H3a.
Table 5.
Dependent Variable: Number of EMPs. Moderating effect of firm environmental performance (H3a).
As for firm size, larger firms are more visible to stakeholders. The increased visibility and increased public scrutiny from an EA should increase pressure on a firm to follow through on a commitment. Also, larger firms have more labor and capital resources to address the resource conflicts that may arise when a firm must simultaneously resolve an EA and adopt more EMPs to follow through on an environmental commitment. As shown in Table 6, following an EA, larger firms are more likely to follow through on environmental commitments of either type. The results provide strong support for H3b.
Table 6.
Dependent Variable: Number of EMPs. Moderating effect of firm size (H3b).
4.2. Robustness Checks
To test results robustness, we evaluate potential endogeneity (selection bias, reverse causality, and omitted variable bias), alternate econometric methods, and an alternate dependent variable. Due to space considerations, only the results from investigating EC (RR or ER) are presented in the tables. However, the investigations of RR and ER provide similar conclusions.
Selection bias: Selection bias occurs when a study sample systematically differs from the population it is intended to represent. Selection bias would occur in this study if a firm were more or less likely to make an environmental commitment (the experimental “treatment”) because of unique firm attributes (ex. size) or attributes of the industry in which the firm competes. If occurring, these attributes would be over- or under-represented in the “treated” vs. “untreated” samples and the empirical results would be biased. Propensity Score Matching (PSM) is a method often used to address selection bias. In this method, each firm is given a score that captures its propensity to experience the treatment, whether it experienced the treatment or not. Matched samples are then created for firms that “did” and “did not” experience the treatment but had similar propensities to experience the treatment. Each sample is then evaluated using the econometric approaches discussed previously and the sample results are compared to assess the impact of the “treatment”. The results from PSM are presented in Table 7, Models 1–4 (H1) and Models 5–8 (H2). For ease of comparison, the original results are paired with the PSM results. The close match suggests that the conclusions about H1 and H2 are robust to selection bias.
Table 7.
Dependent Variable: Number of EMPs. Propensity Score Matching (PSM).
Reverse causality: While a causal relationship between an environmental commitment and EMP adoption (H1) cannot be proven using secondary data, support for causality can be increased by ruling out reverse causality. We perform two checks for reverse causality. In the first check, the independent and dependent variables are reversed in the original regression equation and the relationship is re-evaluated ([85,86,87]). If the dependent variable now predicts the independent variable, reverse causality is present and the relationship between the variables might be explained by an unmeasured “lurking” variable that is correlated with both variables. As with H1, contemporaneous and lagged relationships are investigated. Given that environmental commitment is a binary variable, reverse causality is tested using fixed-effects logit regression. Since EMP adoption and environmental commitments can occur at any point throughout a year and the variables are measured annually, a commitment could precede EMP adoption, but correlation would be observed in both directions. Thus, a contemporaneous investigation would be non-informative. As shown in Table 8, the results from investigating a lagged relationship match expectations and support a unidirectional relationship between an environmental commitment and EMP adoption.
Table 8.
Dependent Variable: Number of EMPs. Reverse causality.
A second approach to test reverse causality is a Granger causality test [88]. In this approach, the relationship between an environmental commitment and EMP adoption is tested in both directions, but lagged dependent variables are included with lagged independent variables in each equation. Granger causality is signaled when the lagged independent variables show statistical significance. The model includes all exogenous control variables and a two-period lag (additional lags produced similar results). The results from the test (available upon request) show that an environmental commitment influences EMP adoption (ECt−1, t−2 @ EMPt, p < 0.001) but EMP adoption does not affect an environmental commitment (EMPt−1, t−2 @ ECt, p = 0.998), ruling out the possibility of reverse causality.
Omitted variable bias: Endogeneity could also be caused by omitted variables. Omitted variable bias occurs when an omitted variable is correlated with an independent variable, which in turn is correlated with the dependent variable. In this case, the explanatory power of the omitted variable is transferred to the correlated independent variable. An approach used to address omitted variable bias is fixed effects (FE) regression. In this approach, observations for a specific firm are “demeaned” prior to use in regression analysis. Demeaning removes the effect of variables that do not vary over time, whether the variables are included in the model or not. An ancillary benefit of FE regression is that it addresses the concern that some firms adopt more EMPs than others, which may influence a firm’s propensity to adopt more EMPs. The results from fixed effects analysis are provided in Table 9 (Model 2). As shown, the conclusions are the same as those from the GEE analysis.
Table 9.
Dependent Variable: Number of EMPs. Alternate methods and alternate dependent variable.
Hierarchical linear modeling: EMP adoption occurs within firms that are nested within industries. The nested data structure means observations of EMP adoption are not independent. While GEE regression addresses the non-independence between observations, hierarchical linear modeling (HLM) addressers the non-independence of observations between levels (firm and industry) and potential correlation in a hierarchically nested data structure [89,90]. The results from HLM are provided in Table 9 (Model 3) and mirror those from using GEE.
Alternate dependent variable: While EMPs were specifically selected because they were relevant to all firms in the study, regardless of industry, some EMPs may be more relevant to certain industries. To address the possibility that the set of EMPs practically available for adoption may differ by industry, and thus influence the number of EMPs a firm adopts, we evaluate an alternate dependent variable that measures the fraction of “applicable” EMPs a firm adopts (Hardcopf et al. 2019) [62]. An EMP was deemed applicable if at least one firm in an industry (as measured by four-digit SIC code) adopted the EMP. Results are provided in Table 9 (Model 4) and again mirror those from GEE analysis.
4.3. Post Hoc Analysis
In arguing H2, we proposed that following an environmental accident, a firm will continue to make environmental commitments to attenuate the reputation and legitimacy damage created by the EA. That proposal is evaluated post hoc because a formal hypothesis would have created a null hypothesis. To evaluate the proposal, logistic regression is used because the dependent variable, environmental commitment, is a binary variable (yes/no). Probit regression was considered, but logistic regression was chosen because the beta coefficients are more interpretable in our research context. The control variables are the same as before, including year fixed-effects. Firm fixed-effects are also added to address potential omitted variable endogeneity concerns. Only a lagged relationship is evaluated because high levels of correlation exist between an environmental accident and an environmental commitment (R2 = 0.12, see Table 2) and a contemporaneous relationship could thus be spurious. As shown in Table 10, we find no relationship between a prior-year environmental accident and a current-year environmental commitment. This suggests that an EA did not influence a firm’s propensity to make an environmental commitment.
Table 10.
Dependent Variable: Environment commitment. The impact of an environmental accident on the likelihood of a firm making an environmental commitment.
5. Discussion and Conclusions
Firms face ever-increasing pressure from stakeholders to reduce the impact of their operations and supply chain on the natural environment. In response, they make public commitments to improve environmental performance. An environmental commitment signals a firm’s intention to change practices, processes, and strategies in ways that improve environmental performance. However, the commitments are a possible source of greenwashing because they are firm-generated and difficult to validate. Since environmentally conscious investors, customers, employees, suppliers, and NGOs rely on the commitments to assess a firm’s environmental performance in anticipation of investing in, buying from, working for, or supplying to a firm, it is essential to understand whether and when firms follow through on a commitment. Given that EMPs are the operational changes a firm would make to improve environmental performance, “following through” on an environmental commitment occurs when a firm adopts more EMPs.
The results from GEE econometric analysis show that environmental commitments are associated with firms adopting more EMPs in the current (~6.3 EMPs, 32%) and following year (~3.4 EMP, 17%). The results are consistent whether a firm committed to reducing resource usage, committed to reducing emissions, or made a commitment of either type. The smaller increases in the following year suggest that environmental commitments are valid for a relatively short time. We also find that commitment quality is sensitive to contextual conditions at the time of the commitment, especially for resource reduction commitments. Should a firm have recently experienced an environmental accident, it tends not to follow through on an environmental commitment. We propose that this is because an environmental accident puts reputational pressure on a firm to make a commitment but creates resource constraints and distractions that may hinder a firm’s ability to follow through. We use an environmental accident to evaluate commitment robustness because they occur frequently, stress firms, and influence environmental management decision making [63]. The aforementioned conclusions are robust to endogeneity, alternate econometric methods, and the approach for measuring EMP adoption.
We also investigate firm attributes that promote follow-through. The results show that larger firms and firms with good environmental performance are more likely to follow through on an environmental commitment, even if they have recently experienced an environmental accident. We propose that larger firms follow through because they are more visible to stakeholders and thus feel greater pressure to follow through. They also have more resources to resolve the resource conflicts that may arise when simultaneously trying to resolve an environmental accident and adopt more EMPs. Firms with better environmental performance follow through on an emission reduction commitment following an environmental accident but not on a resource reduction commitment. The differences in follow-through may occur because emission reduction commitments garner more stakeholder attention, i.e., hazardous emissions are associated with global warming and poor human health. We propose firms follow through on emission reduction commitments because they have a better environmental reputation and thus “more to lose” should they not follow through.
5.1. Practical Implications
The study provides important insights for environmentally conscious customers, investors, employees, suppliers, and NGOs who use environmental commitments to determine whether to buy from, invest in, work for, and supply to a firm. The study results show that firms generally follow through on an environmental commitment, but the commitments are sensitive to contextual conditions at the time of the commitment. Especially sensitive are commitments to reduce the usage of production resources like water, energy, and materials. In support of stakeholders, we offer several ideas to improve follow-through based on what we learned while investigating firm size (H3b). That investigation suggested that increased visibility to stakeholders and more resources promote follow-through. One way to increase firm visibility would be to make a firm’s environmental performance publicly visible. While many firms already share their environmental performance data publicly, an idea to increase disclosure is to publicly promote firms that publicly share data, whether performance is good or bad, and make visible those that do not. The data could be reported to CDP (formerly Carbon Disclosure Project), an organization to which firms already voluntarily report environmental performance data. Another idea is to have federal or state governments mandate reporting on all forms of environmental impact. Currently, U.S. firms are only required to report on the use and management of toxic chemicals [91] or GHG emissions if they are a large emitter [92]. However, efforts are underway to broaden the disclosure requirements for energy usage and carbon emissions [93]. To increase resource availability, the DOE and EPA could better publicize and promote existing programs designed to assist firms with EMP adoption. For example, state and federal government assistance programs, like the U.S. Department of Energy’s Technical Assistance program [94] and Industrial Assessment Centers [95] and the U.S. Environmental Protection Agency’s Technical Assistance Program [96], offer firms expertise and funding to implement environmentally responsible practices.
For firm leaders, we remind them of the significant benefits firms realize from following through on an environmental commitment. These include a better environmental reputation and increased legitimacy and trust with stakeholders. For those who make commitments with an intent to follow through, we caution about becoming distracted by an environmental accident or another event or situation that might constrain firm resources. For those struggling with follow-through because of resource or knowledge constraints, we refer them to the government assistance programs mentioned previously and many other government assistance programs not mentioned. For those not intending to follow through, we caution that motivated stakeholders could evaluate follow-through using the methods in this study.
5.2. Theoretical Contributions
The study also contributes to several fields of the academic literature. It contributes to a nascent and growing literature on environmental commitments by showing that firms generally follow through on environmental commitments. However, the quality of a commitment is sensitive to whether a firm is experiencing negative environmental publicity or resource constraints or is more visible to stakeholders. Firms frequently make environmental commitments, and to our knowledge, this study is the first to evaluate their reliability. It is also the first study to evaluate the reliability of commitments to reduce the use of production inputs like water, energy, and materials. Water is a scarce and non-renewable resource, energy usage contributes to carbon emissions, and materials often end up in landfills. Prior studies have focused on the targets firms set to reduce production outputs, i.e., GHG emissions [7,8].
The study contributes to the environmental management literature by identifying an “internal” driver of EMP adoption, i.e., an environmental commitment. Prior studies have primarily examined how “external” pressure from regulators, NGOs, customers, shareholders, and others affect adoption [17,18,19,97,98,99]. The study also contributes to the environmental accident literature by showing that accidents influence what firms say and do about their environmental performance [63]. Prior studies have examined the impact on communities (e.g., [100,101,102]) and firm reputation, legitimacy, and market valuation [15,50,52,103,104]. Finally, the study contributes to the greenwashing literature that evaluates the conditions under which firms selectively disclose information about their environmental performance and intentions to present a “green” image to stakeholders [20,21].
5.3. Limitations and Venues for Future Research
While the empirical results provide strong support for our conclusions, some potential limitations deserve mention. One potential limitation is that annualized data limits the ability to evaluate the “micro” actions firms take following an environmental commitment or environmental accident. A detailed investigation might provide a better understanding of whether a firm intended to follow through on an environmental commitment or why they were unable to follow through. However, a firm’s response to an environmental commitment or environmental accident may only play out over a longer time horizon. If true, examining macro-changes in firm behavior, as we do in this study, might provide a better understanding of management intent. Another potential limitation is that our sample (public U.S. manufacturers) may limit the generalizability of the results. Non-manufacturing industries also harm the natural environment. Also, European countries, in particular, have been noted to be more environmentally proactive. This may put additional pressure on European firms to make environmental commitments, whether they have the resources to follow through or not. Replicating our study in different countries might be a productive avenue for future study, since understanding when firms follow through on environmental commitments is important to environmental stakeholders around the world. A final limitation is that the severity of the environmental accidents used in this study is unknown. Severe accidents would generate more negative publicity and cause greater reputational and legitimacy damage. This might increase a firm’s desire to make an environmental commitment, even if the resources required to follow through are lacking. A productive avenue for future research might be to assess the severity of an environmental accident and evaluate how this affects follow-through on an environmental commitment. It is worth noting that severe environmental accidents occur infrequently.
Beyond the aforementioned research opportunities, several additional ideas may deserve attention. For example, future studies may wish to examine how other firm attributes (beyond environmental performance and size) affect whether firms follow through on environmental commitments. For example, senior leadership attributes, such as gender, may influence the propensity to follow through. An expansive literature has shown that women lead differently than men. These differences may extend to environmental commitments and how firms respond to environmental accidents. It might also be interesting to assess whether our results hold true for other types of negative firm events, such as product recalls. Product recalls occur frequently and draw significant negative publicity to a firm. The negative publicity might tempt a firm to bolster its reputation by making an environmental commitment without allocating the resources required to follow through on the commitment, i.e., greenwash.
Author Contributions
Conceptualization, R.H., K.L., and R.S.; methodology, R.H., K.L., and R.S.; validation, R.H.; formal analysis, R.H.; investigation, R.H., K.L., and R.S.; resources, R.H.; data curation, R.H.; writing—original draft preparation, R.H., K.L., and R.S.; writing—review and editing, R.H., K.L., and R.S.; visualization, R.H.; supervision, R.H.; project administration, R.H.; All authors have read and agreed to the published version of the manuscript.
Funding
This research received no external funding.
Data Availability Statement
Data is contained within the article.
Conflicts of Interest
The authors declare no conflict of interest and no funders had a role in the design of the study; in the collection, analyses, or interpretation of data; in the writing of the manuscript; or in the decision to publish the results.
Appendix A
Table A1.
Full list of EMPs.
Table A1.
Full list of EMPs.
| No. | Asset4 Code | Title/Description | Assessment | Focus |
|---|---|---|---|---|
| 1 | enerdp0011 | Emission Reduction Policy Elements/Emissions | Does the company have a policy to reduce emissions? | Emission Reduction |
| 2 | enerdp0012 | Emission Reduction Policy Elements/Biodiversity | Does the company have a policy to reduce its impact on biodiversity? | Emission Reduction |
| 3 | enerdp0013 | Emission Reduction Policy Elements/Environmental Management Systems | Does the company have a policy to maintain an environmental management system? | Emission Reduction |
| 4 | enerdp0051 | Emission Reduction Processes/Emissions | Does the company describe, claim to have, or mention processes in place to improve emission reduction? | Emission Reduction |
| 5 | enerdp0052 | Emission Reduction Processes/Biodiversity | Does the company describe, claim to have, or mention processes in place to reduce its impact on biodiversity? | Emission Reduction |
| 6 | enerdp0053 | Emission Reduction Processes/Environmental Management Systems | Does the company describe, claim to have, or mention processes in place to maintain an environmental management system? | Emission Reduction |
| 7 | enerdp006 | CERES Valdez Principles | Is the company endorsing the CERES principles (or Valdez principles)? | Emission Reduction |
| 8 | enerdp0101 | Emission Reduction KPI Monitoring/Emissions | Does the company claim to use key performance indicators (KPI) or the balanced scorecard to monitor emission reduction? | Emission Reduction |
| 9 | enerdp0102 | Emission Reduction KPI Monitoring/Biodiversity | Does the company claim to use key performance indicators (KPI) or the balanced scorecard to monitor its impact on biodiversity? | Emission Reduction |
| 10 | enerdp0103 | Emission Reduction KPI Monitoring/Environmental Management Systems | Does the company claim to use key performance indicators (KPI) or the balanced scorecard to monitor its use of an environmental management system? | Emission Reduction |
| 11 | enerdp020 | Biodiversity Restoration Protection | Does the company report on initiatives to restore or protect native ecosystems or the biodiversity of protected and sensitive areas? | Emission Reduction |
| 12 | enerdp028 | CO2 Equivalents Emission Reduction Production | Does the company show an initiative to reduce, reuse, recycle, substitute, phased out, or compensate CO2 equivalents in the production process? | Emission Reduction |
| 13 | enerdp029 | CO2 Equivalents Emission Reduction Transportation | Does the company show an initiative to reduce, reuse, recycle, substitute, or phase out CO2 equivalents in the product transportation process? | Emission Reduction |
| 14 | enerdp062 | Waste Reduction Total | Does the company report on initiatives to recycle, reduce, reuse, substitute, treat, or phase out total waste? | Emission Reduction |
| 15 | enerdp063 | e-Waste Reduction | Does the company report on initiatives to recycle, reduce, reuse, substitute, treat or phase out e-waste? | Emission Reduction |
| 16 | enerdp067 | Production Concentration | Does the company report on the concentration of production locations in order to limit the environmental impact during the production process? | Emission Reduction |
| 17 | enerdp068 | Emissions Trading | Does the company report on its participation in any emissions trading initiative? | Emission Reduction |
| 18 | enerdp069 | New Production Techniques | Does the company report on new production techniques to improve the global environmental impact (all emissions) during the production process? | Emission Reduction |
| 19 | enerdp070 | Environmental Partnerships | Does the company report on partnerships or initiatives with specialized NGOs, industry organizations, governmental, or supra-governmental organizations that are focused on improving environmental issues? | Emission Reduction |
| 20 | enerdp076 | Environmental Restoration Initiatives | Does the company report or provide information on company-generated initiatives to restore the environment? | Emission Reduction |
| 21 | enerdp081 | Staff Transportation Impact Reduction | Does the company report on initiatives to reduce the environmental impact of transportation used for its staff? | Emission Reduction |
| 22 | enerdp082 | Logistics and Product Transportation Impact Reduction | Does the company report on initiatives to reduce the environmental impact of the transportation of its products? | Emission Reduction |
| 23 | enerdp095 | Environmental Investments Initiatives | Does the company report on making proactive environmental investments or expenditures to reduce future risks or increase future opportunities? | Emission Reduction |
| 24 | enpidp0011 | Product Innovation Policy Elements/Life Cycle Assessments | Does the company have a product life cycle assessment policy? | Neither |
| 25 | enpidp0012 | Product Innovation Policy Elements/Eco Design | Does the company have an eco-design policy? | Neither |
| 26 | enpidp0013 | Product Innovation Policy Elements/Dematerialization | Does the company have a dematerialization policy? | Neither |
| 27 | enpidp0014 | Product Innovation Policy Elements/Product Innovation | Does the company have a general, all-purpose policy regarding environmental product innovation? | Neither |
| 28 | enpidp022 | Energy Footprint Reduction | Does the company describe initiatives in place to reduce the energy footprint of its products during their use? | Neither |
| 29 | enrrdp0011 | Resource Efficiency Policy Elements/Water Efficiency | Does the company have a policy to improve its water efficiency? | Resource Reduction |
| 30 | enrrdp0012 | Resource Efficiency Policy Elements/Energy Efficiency | Does the company have a policy to improve its energy efficiency? | Resource Reduction |
| 31 | enrrdp0013 | Resource Efficiency Policy Elements/Resource Efficiency | Does the company have a general, all-purpose policy regarding resource efficiency? | Resource Reduction |
| 32 | enrrdp0015 | Resource Efficiency Policy Elements/Environmental Supply Chain | Does the company have a policy to lessen the environmental impact of its supply chain? | Resource Reduction |
| 33 | enrrdp004 | Environment Management Team | Does the company have an environmental management team? | Resource Reduction |
| 34 | enrrdp008 | Environment Management Training | Does the company train its employees on environmental issues? | Resource Reduction |
| 35 | enrrdp011 | Environment Management Improvement Tools | Does the company have the appropriate internal communication tools (whistle blower, ombudsman, suggestion box, hotline, newsletter, intranet, etc.) to ensure better environmental management? | Resource Reduction |
| 36 | enrrdp0121 | Resource Efficiency Processes/Water Efficiency | Does the company describe, claim to have, or mention processes in place to improve its water efficiency? | Resource Reduction |
| 37 | enrrdp0122 | Resource Efficiency Processes/Energy Efficiency | Does the company describe, claim to have, or mention processes in place to improve its energy efficiency? | Resource Reduction |
| 38 | enrrdp0123 | Resource Efficiency Processes/Resource Efficiency | Does the company describe, claim to have, or mention processes in place to improve its resource efficiency in general? | Resource Reduction |
| 39 | enrrdp0125 | Environmental Supply Chain | Does the company describe, claim to have, or mention processes in place to include its supply chain in the company’s efforts to lessen its overall environmental impact? | Resource Reduction |
| 40 | enrrdp0131 | Resource Efficiency KPI Monitoring/Water Efficiency | Does the company claim to use key performance indicators (KPI) or the balanced scorecard to monitor water efficiency? | Resource Reduction |
| 41 | enrrdp0132 | Resource Efficiency KPI Monitoring/Energy Efficiency | Does the company claim to use key performance indicators (KPI) or the balanced scorecard to monitor energy efficiency? | Resource Reduction |
| 42 | enrrdp0133 | Resource Efficiency KPI Monitoring/Resource Efficiency | Does the company claim to use key performance indicators (KPI) or the balanced scorecard to monitor resource efficiency in general? | Resource Reduction |
| 43 | enrrdp0135 | Resource Efficiency KPI Monitoring/Environmental Supply Chain | Does the company claim to use key performance indicators (KPI) or balanced scorecard to monitor the environmental impact of its supply chain? | Resource Reduction |
| 44 | enrrdp029 | Materials Sourcing Environmental Criteria | Does the company claim to use environmental criteria (e.g., life cycle assessment) to source or eliminate materials? | Resource Reduction |
| 45 | enrrdp046 | Renewable Energy Use | Does the company make use of renewable energy? | Resource Reduction |
| 46 | enrrdp052 | Green Buildings | Does the company report about environmentally friendly or green sites or offices? | Resource Reduction |
| 47 | enrrdp053 | Energy Efficiency Initiatives | Does the company report on specific initiatives to improve its energy efficiency? | Resource Reduction |
| 48 | enrrdp057 | Water Efficiency Initiatives | Does the company report on initiatives to reuse or recycle water? | Resource Reduction |
| 49 | enrrdp058 | Environmental Supply Chain | Does the company use environmental criteria (ISO 14000, energy consumption, etc.) in the selection process of its suppliers or sourcing partners? | Resource Reduction |
| 50 | enrrdp059 | Environmental Supply Chain | Does the company report or show to be ready to end a partnership with a sourcing partner, if environmental criteria are not met? | Resource Reduction |
References
- Sull, D.N. Managing by commitments. Harv. Bus. Rev. 2003, 81, 82–91. [Google Scholar] [PubMed]
- Bromley, P.; Powell, W.W. From smoke and mirrors to walking the talk: Decoupling in the contemporary world. Acad. Manag. Ann. 2012, 6, 483–530. [Google Scholar] [CrossRef]
- Weirens, J.; Poole, V. Building Credible Climate Commitments: A Road Map to Earning Stakeholder Trust. Available online: https://www2.deloitte.com/us/en/insights/topics/strategy/trust-in-corporate-climate-change-commitments.html (accessed on 14 June 2021).
- McCalla-Leacy, J.; Shulman, J.; Threlfall, R. Big Shifts, Small Steps: Survey of Sustainability Reporting 2022. 2022. Available online: https://assets.kpmg.com/content/dam/kpmg/se/pdf/komm/2022/Global-Survey-of-Sustainability-Reporting-2022.pdf (accessed on 16 August 2024).
- Cervantes, L.; Letts, T.; Vita, L.; Juliani, T. Power Forward 4.0: A Progress Report of the Fortune 500’s Transition to a Net-Zero Economy. 2021. Available online: https://www.worldwildlife.org/publications/power-forward-4-0-a-progress-report-of-the-fortune-500-s-transition-to-a-net-zero-economy (accessed on 16 August 2024).
- Tollefson, J. Climate pledges from top companies crumble under scrutiny. Nature 2022. [Google Scholar] [CrossRef] [PubMed]
- Ioannou, I.; Li, S.X.; Serafeim, G. The effect of target difficulty on target completion: The case of reducing carbon emissions. Account. Rev. 2016, 91, 1467–1492. [Google Scholar] [CrossRef]
- Dahlmann, F.; Branicki, L.; Brammer, S. Managing carbon aspirations: The influence of corporate climate change targets on environmental performance. J. Bus. Ethics 2019, 158, 1–24. [Google Scholar] [CrossRef]
- UNEP. Water and Energy Efficiency. 2014. Available online: https://www.un.org/waterforlifedecade/pdf/01_2014_water_energy_efficiency.pdf (accessed on 16 August 2024).
- Anton, W.R.; Deltas, G.; Khanna, M. Incentives for environmental self-regulation and implications for environmental performance. J. Environ. Econ. Manag. 2004, 48, 632–654. [Google Scholar] [CrossRef]
- Klassen, R.D.; Whybark, D.C. The impact of environmental technologies on manufacturing performance. Acad. Manag. J. 1999, 42, 599–615. [Google Scholar] [CrossRef]
- Potoski, M.; Prakash, A. Covenants with weak swords: ISO 14001 and facilities’ environmental performance. J. Policy Anal. Manag. 2005, 24, 745–769. [Google Scholar] [CrossRef]
- Toffel, M.W. Resolving Information Asymmetries in Markets: The Role of Certified Management Programs. UC Berkeley, Center for Responsible Business, UC Berkeley 2005. Available online: https://escholarship.org/uc/item/9qh5r011 (accessed on 16 August 2024).
- King, A.A.; Lenox, M.J. Exploring the locus of profiTable pollution reduction. Manage. Sci. 2002, 48, 289–299. [Google Scholar] [CrossRef]
- Jones, K.; Rubin, P.H. Effects of harmful environmental events on reputations of firms. In Advances in Financial Economics; Emerald Group Publishing Limited, 2001; pp. 161–182. Available online: https://www.emerald.com/insight/content/doi/10.1016/S1569-3732 (accessed on 16 August 2024).
- Karpoff, J.M.; Lott, J.R., Jr.; Wehrly, E.W. The reputational penalties for environmental violations: Empirical evidence. J. Law Econ. 2005, 48, 653–675. [Google Scholar] [CrossRef]
- Delmas, M.A.; Toffel, M.W. Organizational responses to environmental demands: Opening the black box. Strateg. Manag. J. 2008, 29, 1027–1055. [Google Scholar] [CrossRef]
- Hofer, C.; Cantor, D.E.; Dai, J. The competitive determinants of a firm’s environmental management activities: Evidence from US manufacturing industries. J. Oper. Manag. 2012, 30, 69–84. [Google Scholar] [CrossRef]
- Sarkis, J.; Gonzalez-Torre, P.; Adenso-Diaz, B. Stakeholder pressure and the adoption of environmental practices: The mediating effect of training. J. Oper. Manag. 2010, 28, 163–176. [Google Scholar] [CrossRef]
- Marquis, C.; Toffel, M.; Zhou, Y. Scrutiny, norms, and selective disclosure: A global study of greenwashing. Organ. Sci. 2016, 27, 483–504. [Google Scholar] [CrossRef]
- Lyon, T.P.; Maxwell, J.W. Greenwash: Corporate environmental disclosure under threat of audit. J. Econ. Manag. Strateg. 2011, 20, 3–41. [Google Scholar] [CrossRef]
- Bolton, P.; Kacperczyk, M. Firm commitments. In National Bureau of Economic Research Working Paper Series; 2023. Working Paper #31244.
- Ramus, C.A.; Montiel, I. When are corporate environmental policies a form of greenwashing? Bus. Soc. 2005, 44, 377–414. [Google Scholar] [CrossRef]
- Bapna, S. Complementarity of signals in early-stage equity investment decisions: Evidence from a randomized field experiment. Manag. Sci. 2019, 65, 933–952. [Google Scholar] [CrossRef]
- Herbig, P.; Milewicz, J.; Golden, J. A model of reputation building and destruction. J. Bus. Res. 1994, 31, 23–31. [Google Scholar] [CrossRef]
- Caves, R.E.; Porter, M.E. From entry barriers to mobility barriers: Conjectural decisions and contrived deterrence to new competition. Q. J. Econ. 1977, 91, 241–261. [Google Scholar] [CrossRef]
- Roberts, P.W.; Dowling, G.R. Corporate reputation and sustained superior financial performance. Strateg. Manag. J. 2002, 23, 1077–1093. [Google Scholar] [CrossRef]
- Lewicki, R.J.; Wiethoff, C. Trust, trust development, and trust repair. Handb. Confl. Resolut. Theory Pract. 2006, 2, 92–119. [Google Scholar]
- Lemma, T.T.; Lulseged, A.; Tavakolifar, M. Corporate commitment to climate change action, carbon risk exposure, and a firm’s debt financing policy. Bus. Strateg. Environ. 2021, 30, 3919–3936. [Google Scholar] [CrossRef]
- Gangi, F.; Daniele, L.M.; Varrone, N. How do corporate environmental policy and corporate reputation affect risk-adjusted financial performance? Bus. Strateg. Environ. 2020, 29, 1975–1991. [Google Scholar] [CrossRef]
- Semuels, A. Why Corporations Can No Longer Avoid Politics. Time, 21 November 2019. Available online: https://time.com/5735415/woke-culture-political-companies/ (accessed on 16 August 2024).
- Winston, A. Leading a New Era of Climate Action. Harvard Business Review, 20 January 2020. Available online: https://hbr.org/2020/01/leading-a-new-era-of-climate-action (accessed on 16 August 2024).
- Jung, J.; Herbohn, K.; Clarkson, P. Carbon risk, carbon risk awareness and the cost of debt financing. J. Bus. Ethics 2018, 150, 1151–1171. [Google Scholar] [CrossRef]
- La Rosa, F.; Liberatore, G.; Mazzi, F.; Terzani, S. The impact of corporate social performance on the cost of debt and access to debt financing for listed European non-financial firms. Eur. Manag. J. 2018, 36, 519–529. [Google Scholar] [CrossRef]
- Porter, M.E.; Kramer, M.R. The link between competitive advantage and corporate social responsibility. Harv. Bus. Rev. 2006, 84, 78–92. [Google Scholar]
- Guo, R.; Tao, L.; Li, C.B.; Wang, T. A path analysis of greenwashing in a trust crisis among Chinese energy companies: The role of brand legitimacy and brand loyalty. J. Bus. Ethics 2017, 140, 523–536. [Google Scholar] [CrossRef]
- Walker, K.; Wan, F. The harm of symbolic actions and green-washing: Corporate actions and communications on environmental performance and their financial implications. J. Bus. Ethics 2012, 109, 227–242. [Google Scholar] [CrossRef]
- Ioannou, I.; Kassinis, G.; Papagiannakis, G. The impact of perceived greenwashing on customer satisfaction and the contingent role of capability reputation. J. Bus. Ethics 2023, 185, 333–347. [Google Scholar] [CrossRef]
- de Jong, M.D.T.; Huluba, G.; Beldad, A.D. Different shades of greenwashing: Consumers’ reactions to environmental lies, half-lies, and organizations taking credit for following legal obligations. J. Bus. Tech. Commun. 2020, 34, 38–76. [Google Scholar] [CrossRef]
- Mintzberg, H. The Nature of Managerial Work; Harper and Row: New York, NY, USA, 1973. [Google Scholar]
- Samson, D.; Terziovski, M. The relationship between total quality management practices and operational performance. J. Oper. Manag. 1999, 17, 393–409. [Google Scholar] [CrossRef]
- Flynn, B.B.; Schroeder, R.G.; Sakakibara, S. A framework for quality management research and an associated measurement instrument. J. Oper. Manag. 1994, 11, 339–366. [Google Scholar] [CrossRef]
- Sakakibara, S.; Flynn, B.B.; Schroeder, R.G.; Morris, W.T. The impact of just-in-time manufacturing and its infrastructure on manufacturing performance. Manage. Sci. 1997, 43, 1246–1257. [Google Scholar] [CrossRef]
- Im, J.H.; Lee, S.M. Implementation of just-in-time systems in US manufacturing firms. Int. J. Oper. Prod. Manag. 1989, 9, 5–14. [Google Scholar] [CrossRef]
- Taylor, W.A. Senior executives and ISO 9000: Attitudes, behaviours and commitment. Int. J. Qual. Reliab. Manag. 1995, 12, 40–57. [Google Scholar] [CrossRef]
- Jeyaraj, A.; Rottman, J.W.; Lacity, M.C. A review of the predictors, linkages, and biases in IT innovation adoption research. J. Inf. Technol. 2006, 21, 1–23. [Google Scholar] [CrossRef]
- Klassen, R.D. Plant-level environmental management orientation: The influence of management views and plant characteristics. Prod. Oper. Manag. 2001, 10, 257–275. [Google Scholar] [CrossRef]
- Branzei, O.; Ursacki-Bryant, T.J.; Vertinsky, I.; Zhang, W. The formation of green strategies in Chinese firms: Matching corporate environmental responses and individual principles. Strateg. Manag. J. 2004, 25, 1075–1095. [Google Scholar] [CrossRef]
- Banerjee, S.; Iyer, E.S.; Kashyap, R.K. Corporate environmentalism: Antecedents and influence of industry type. J. Mark. 2003, 67, 106–122. [Google Scholar] [CrossRef]
- Flammer, C. Corporate social responsibility and shareholder reaction: The environmental awareness of investors. Acad. Manag. J. 2013, 56, 758–781. [Google Scholar] [CrossRef]
- Bansal, P.; Clelland, I. Talking trash: Legitimacy, impression management, and unsystematic risk in the context of the natural environment. Acad. Manag. J. 2004, 47, 93–103. [Google Scholar] [CrossRef]
- Milne, M.J.; Patten, D.M. Securing organizational legitimacy: An experimental decision case examining the impact of environmental disclosures. Account. Audit. Account. J. 2002, 15, 372–405. [Google Scholar] [CrossRef]
- Ocasio, W. Towards an attention-based view of the firm. Strateg. Manag. J. 1997, 18, 187–206. [Google Scholar] [CrossRef]
- Lepoutre, J.; Heene, A. Investigating the impact of firm size on small business social responsibility: A critical review. J. Bus. Ethics 2006, 67, 257–273. [Google Scholar] [CrossRef]
- Udayasankar, K. Corporate social responsibility and firm size. J. Bus. Ethics 2008, 83, 167–175. [Google Scholar] [CrossRef]
- Schreck, P.; Raithel, S. Corporate social performance, firm size, and organizational visibility: Distinct and joint effects on voluntary sustainability reporting. Bus. Soc. 2018, 57, 742–778. [Google Scholar] [CrossRef]
- Brammer, S.; Pavelin, S. Factors influencing the quality of corporate environmental disclosure. Bus. Strateg. Environ. 2008, 17, 120–136. [Google Scholar] [CrossRef]
- Patten, D.M. Intra-industry environmental disclosures in response to the Alaskan oil spill: A note on legitimacy theory. Account. Organ. Soc. 1992, 17, 471–475. [Google Scholar] [CrossRef]
- Cowen, S.S.; Ferreri, L.B.; Parker, L.D. The impact of corporate characteristics on social responsibility disclosure: A typology and frequency-based analysis. Account. Organ. Soc. 1987, 12, 111–122. [Google Scholar] [CrossRef]
- Cheng, B.; Ioannou, I.; Serafeim, G. Corporate social responsibility and access to finance. Strateg. Manag. J. 2014, 35, 1–23. [Google Scholar] [CrossRef]
- Eccles, R.G.; Ioannou, I.; Serafeim, G. The Impact of a Corporate Culture of Sustainability on Corporate Behavior and Performance; National Bureau of Economic Research: Cambridge, MA, USA, 2012; Volume W17950. [Google Scholar]
- Hardcopf, R.; Shah, R.; Mukherjee, U. Explaining heterogeneity in environmental management practice adoption across firms. Prod. Oper. Manag. 2019, 28, 2898–2918. [Google Scholar] [CrossRef]
- Hardcopf, R.; Shah, R.; Dhanorkar, S. The impact of a spill or pollution accident on firm environmental activity: An empirical investigation. Prod. Oper. Manag. 2021, 30, 2467–2491. [Google Scholar] [CrossRef]
- Dawkins, C.; Fraas, J.W. Coming clean: The impact of environmental performance and visibility on corporate climate change disclosure. J. Bus. Ethics 2011, 100, 303–322. [Google Scholar] [CrossRef]
- Griffin, J.J.; Mahon, J.F. The corporate social performance and corporate financial performance debate: Twenty-five years of incomparable research. Bus. Soc. 1997, 36, 5–31. [Google Scholar] [CrossRef]
- Statman, M.; Glushkov, D. The wages of social responsibility. Financ. Anal. J. 2009, 65, 33–46. [Google Scholar] [CrossRef]
- Hawn, O.; Ioannou, I. Mind the gap: The interplay between external and internal actions in the case of corporate social responsibility. Strateg. Manag. J. 2016, 37, 2569–2588. [Google Scholar] [CrossRef]
- Porter, M.E.; van der Linde, C. Toward a new conception of the environment-competitiveness relationship. J. Econ. Perspect. 1995, 9, 97–118. [Google Scholar] [CrossRef]
- Klassen, R.D.; Whybark, D.C. Environmental management in operations: The selection of environmental technologies. Decis. Sci. 1999, 30, 601–631. [Google Scholar] [CrossRef]
- MSCI KLD. MSCI KLD. 2010. Available online: http://www.pornsit-jiraporn.com/Getting_Started_With_KLD_STATS.pdf (accessed on 16 August 2024).
- ISO 14000/14001. Available online: https://www.iso.org/standards/popular/iso-14000-family (accessed on 16 August 2024).
- Bansal, P.; Roth, K. Why companies go green: A model of ecological responsiveness. Acad. Manag. J. 2000, 43, 717–736. [Google Scholar] [CrossRef]
- Shieh, G. Clarifying the role of mean centring in multicollinearity of interaction effects. Br. J. Math. Stat. Psychol. 2011, 64, 462–477. [Google Scholar] [CrossRef]
- Kutner, M.H.; Nachtsheim, C.J.; Neter, J.; Li, W. Applied Linear Statistical Models; McGraw-Hill/Irwin: New York, NY, USA, 2005; Volume 103. [Google Scholar]
- Liang, K.Y.; Zeger, S.L. Longitudinal data analysis using generalized linear models. Biometrika 1986, 73, 13–22. [Google Scholar] [CrossRef]
- Gardner, W.; Mulvey, E.P.; Shaw, E.C. Regression analyses of counts and rates: Poisson, overdispersed Poisson, and negative binomial models. Psychol. Bull. 1995, 118, 392. [Google Scholar] [CrossRef]
- Wooldridge, J.M. Econometric Analysis of Cross Section and Panel Data; MIT Press: Cambridge, MA, USA, 2002; Volume 108. [Google Scholar]
- Green, T.J. TQM and organizational culture: How do they link? Total Qual. Manag. Bus. Excell. 2012, 23, 141–157. [Google Scholar] [CrossRef]
- Wowak, A.J.; Mannor, M.J.; Wowak, K.D. Throwing caution to the wind: The effect of CEO stock option pay on the incidence of product safety problems. Strateg. Manag. J. 2015, 36, 1082–1092. [Google Scholar] [CrossRef]
- Dobrev, S.D.; Kim, T.; Hannan, M.T. Dynamics of niche width and resource partitioning. Am. J. Sociol. 2001, 106, 1299–1337. [Google Scholar] [CrossRef]
- Shah, R.; Ball, G.P.; Netessine, S. Plant operations and product recalls in the automotive industry: An empirical investigation. Manag. Sci. 2016, 63, 2439–2459. [Google Scholar] [CrossRef]
- Di Gregorio, D.; Shane, S. Why do some universities generate more start-ups than others? Res. Policy 2003, 32, 209–227. [Google Scholar] [CrossRef]
- Greene, W.H. Econometric Analysis; Pearson Education India: 2012. Available online: https://books.google.com/books/about/Econometric_Analysis.html?id=-WFPYgEACAAJ (accessed on 8 February 2023).
- Sine, W.D.; Shane, S.; Di Gregorio, D. The halo effect and technology licensing: The influence of institutional prestige on the licensing of university inventions. Manag. Sci. 2003, 49, 478–496. [Google Scholar] [CrossRef]
- Wowak, K.D.; Ball, G.P.; Post, C.; Ketchen, D.J. The Influence of Female Directors on Product Recall Decisions. Manuf. Serv. Oper. Manag. 2020, 23, 895–913. [Google Scholar] [CrossRef]
- Ball, G.; Shah, R.; Donohue, K. The decision to recall: A behavioral investigation in the medical device industry. J. Oper. Manag. 2018, 62, 1–15. [Google Scholar] [CrossRef]
- Ball, G.; Siemsen, E.; Shah, R. Do plant inspections predict future quality? The role of investigator experience. Manuf. Serv. Oper. Manag. 2017, 19, 534–550. [Google Scholar] [CrossRef]
- Granger, C.W.J. Investigating Causal Relations by Econometric Models and Cross-spectral Methods. Econometrica 1969, 37, 424–438. [Google Scholar] [CrossRef]
- Bryk, A.S.; Raudenbush, S.W. Hierarchical Linear Models; Sage: Newbury Park, CA, USA, 1992. [Google Scholar]
- Misangyi, V.F.; Elms, H.; Greckhamer, T.; Lepine, J.A. A new perspective on a fundamental debate: A multilevel approach to industry, corporate, and business unit effects. Strateg. Manag. J. 2006, 27, 571–590. [Google Scholar] [CrossRef]
- EPA. Toxic Release Inventory (TRI) Program. U.S. Environmental Protection Agency. 1 August 2023. Available online: https://www.epa.gov/toxics-release-inventory-tri-program (accessed on 8 February 2023).
- EPA. Learn about the Greenhouse Gas Reporting Program (GHGRP). U.S. Environmental Protection Agency. 2023. Available online: https://www.epa.gov/ghgreporting/learn-about-greenhouse-gas-reporting-program-ghgrp (accessed on 8 April 2023).
- SEC. SEC Proposes Rules to Enhance and Standardize Climate-Related Disclosures for Investors. Security and Exchange Commission. 21 March 2022. Available online: https://www.sec.gov/news/press-release/2022-46 (accessed on 16 August 2024).
- DOE. Technical Assistance. U.S. Department of Energy. 2023. Available online: https://www.energy.gov/eere/technical-assistance (accessed on 8 February 2023).
- DOE. Industrial Assessment Centers (IACs). U.S. Department of Energy. 2023. Available online: https://www.energy.gov/mesc/industrial-assessment-centers-iacs (accessed on 8 February 2023).
- EPA. Technical Assistance. U.S. Environmental Protection Agency. 3 March 2023. Available online: https://www.epa.gov/advance/technical-assistance (accessed on 16 August 2024).
- Delmas, M. Stakeholders and competitive advantage: The case of ISO 14001. Prod. Oper. Manag. 2001, 10, 343–358. [Google Scholar] [CrossRef]
- Foster, S.T., Jr.; Sampson, S.E.; Dunn, S.C. The impact of customer contact on environmental initiatives for service firms. Int. J. Oper. Prod. Manag. 2000, 20, 187–203. [Google Scholar] [CrossRef]
- Reuter, C.; Foerstl, K.A.; Hartmann, E.V.; Blome, C. Sustainable global supplier management: The role of dynamic capabilities in achieving competitive advantage. J. Supply Chain Manag. 2010, 46, 45–63. [Google Scholar] [CrossRef]
- Hoffman, A.J.; Jennings, P.D. The BP oil spill as a cultural anomaly? Institutional context, conflict, and change. J. Manag. Inq. 2011, 20, 100–112. [Google Scholar] [CrossRef]
- Palinkas, L.A.; Downs, M.A.; Petterson, J.S.; Russell, J. Social, Cultural, and Psychological Impacts of the “Exxon Valdez” Oil Spill. Hum. Organ. 1993, 52, 1–13. [Google Scholar] [CrossRef]
- Renn, O. Public responses to the Chernobyl accident. J. Environ. Psychol. 1990, 10, 151–167. [Google Scholar] [CrossRef]
- Endrikat, J. Market reactions to corporate environmental performance related events: A meta-analytic consolidation of the empirical evidence. J. Bus. Ethics 2016, 138, 535–548. [Google Scholar] [CrossRef]
- Orlitzky, M.; Schmidt, F.L.; Rynes, S.L. Corporate social and financial performance: A meta-analysis. Organ. Stud. 2003, 24, 403–441. [Google Scholar] [CrossRef]
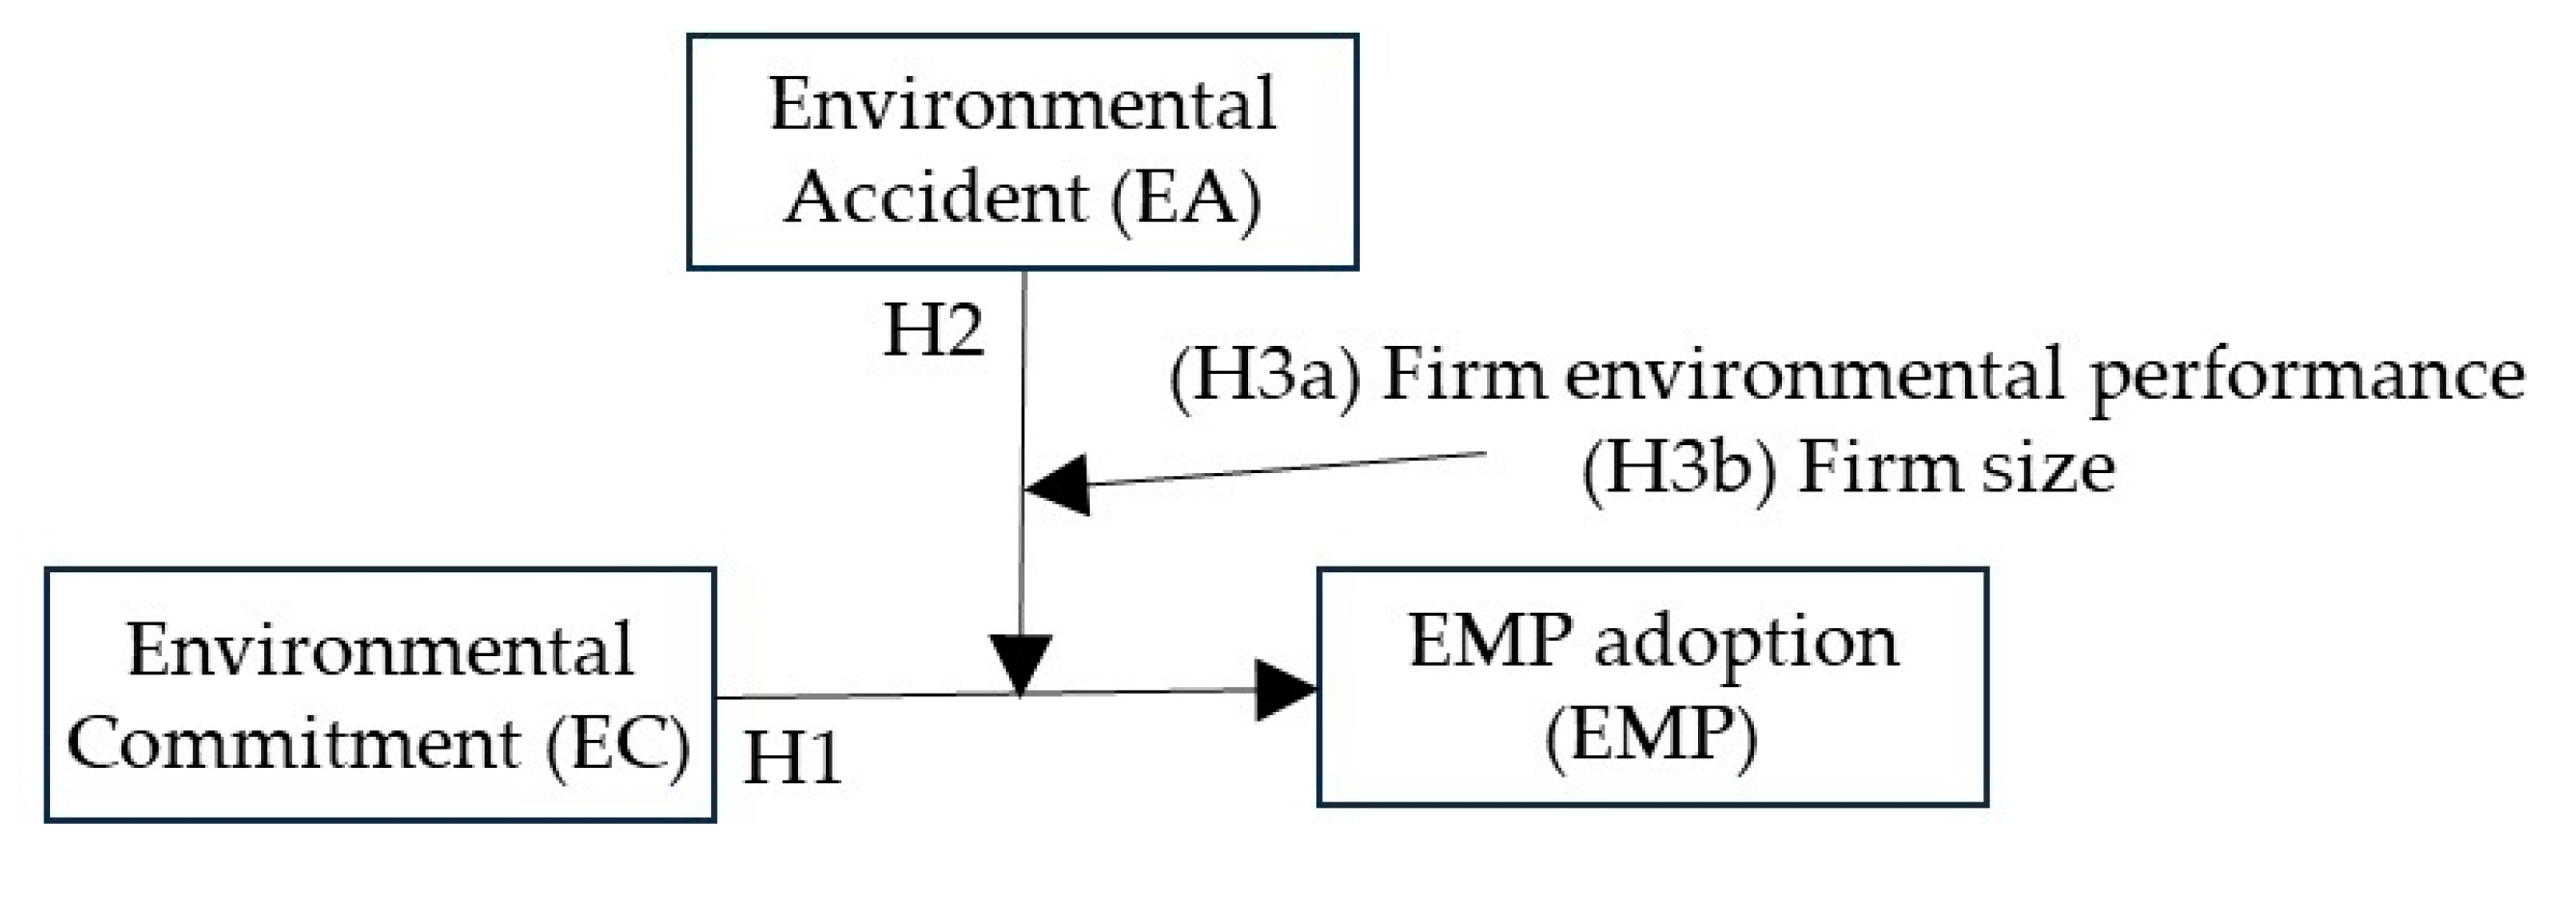
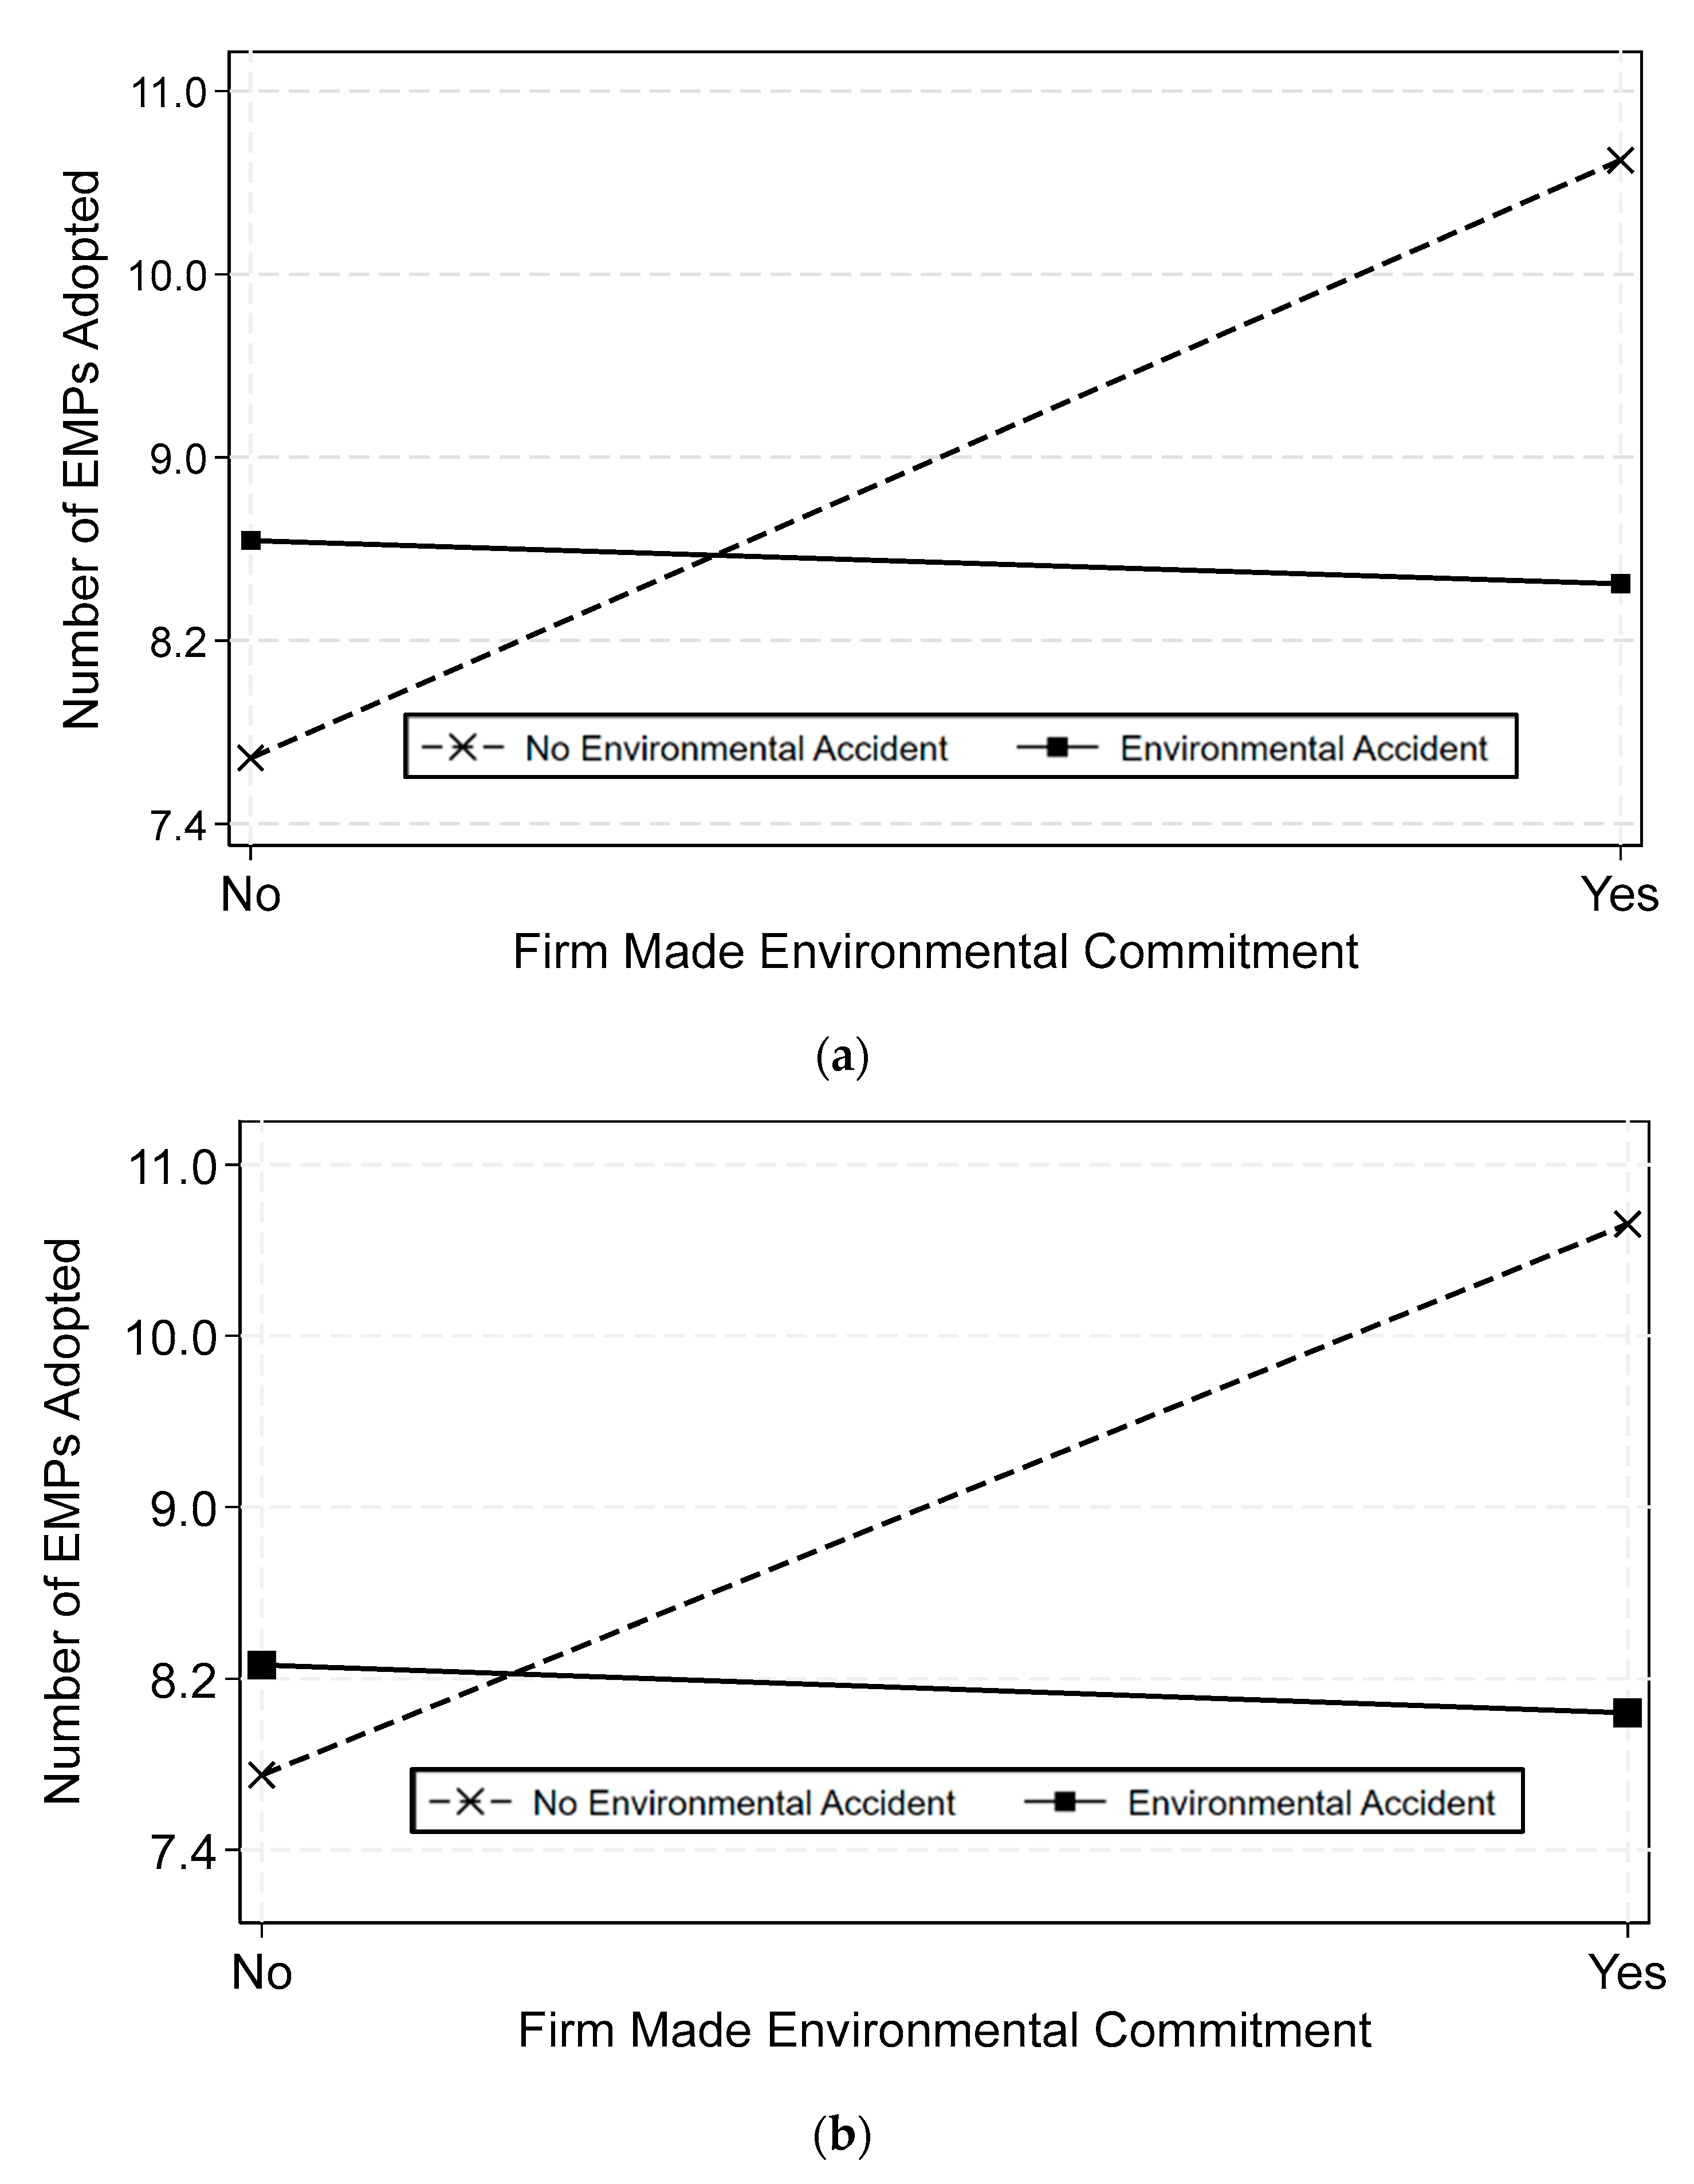
Disclaimer/Publisher’s Note: The statements, opinions and data contained in all publications are solely those of the individual author(s) and contributor(s) and not of MDPI and/or the editor(s). MDPI and/or the editor(s) disclaim responsibility for any injury to people or property resulting from any ideas, methods, instructions or products referred to in the content. |
© 2024 by the authors. Licensee MDPI, Basel, Switzerland. This article is an open access article distributed under the terms and conditions of the Creative Commons Attribution (CC BY) license (https://creativecommons.org/licenses/by/4.0/).