Article

Sustainable Engineered Geopolymer Composites Utilizing Gamma-Irradiated PET and Graphene Nanoplatelets: Optimization and Performance Enhancement

1
Department of Civil Engineering, Faculty of Engineering & Technology, Bahauddin Zakariya University, Multan 59071, Pakistan
2
Department of Civil Engineering, College of Engineering, King Saud University, Riyadh 11421, Saudi Arabia
3
Department of Civil Engineering, Universiti Teknologi PETRONAS, Seri Iskandar 32610, Malaysia
4
Department of Civil and Environmental Engineering, Florida International University, Miami, FL 33174, USA
*
Authors to whom correspondence should be addressed.
Sustainability 2024, 16(17), 7455; https://doi.org/10.3390/su16177455
Submission received: 24 July 2024 / Revised: 20 August 2024 / Accepted: 23 August 2024 / Published: 28 August 2024

Abstract

:
Effective waste management is a matter of global concern. The utilization of widely recognized waste materials, such as plastics, rubber, and glass, in the construction industry is being investigated for their cost efficiency, enhanced material properties, and reduced environmental impact, contributing to broader sustainability efforts. This study investigates the development of an engineered geopolymer composite with a focus on sustainability by utilizing industrial waste materials. Gamma-irradiated polyethylene terephthalate was employed as a partial replacement for silica sand, while graphene nanoplatelets were incorporated to enhance composite properties and reduce environmental waste. A statistical technique known as response surface methodology was used to optimize the effects of gamma-irradiated polyethylene terephthalate and graphene nanoplatelets on the properties of the engineered geopolymer composite. Key findings indicate that gamma-irradiated polyethylene terephthalate, with higher crystallinity and robust interfacial bonding with the geopolymer matrix, significantly enhances compressive strength, elastic modulus, flexural strength, and flexural toughness. However, graphene nanoplatelets, while improving mechanical properties, reduce the ductility index. Optimal composite properties were achieved with 26.4% gamma-irradiated polyethylene terephthalate and 0.12% graphene nanoplatelets. This research underscores the potential of gamma-irradiated polyethylene terephthalate in creating high-performance, sustainable construction materials and highlights the trade-offs between mechanical reinforcement and ductility. Future research should explore the chain scission effects of gamma irradiation on polyethylene terephthalate, further optimize composite properties, and investigate mechanisms to enhance ductility, advancing the utilization of polyethylene terephthalate in sustainable construction materials.

1. Introduction

The demand for constructing new civil infrastructure is appearing at an unprecedented rate due to population expansion, urban sprawl, and the continuous advancement of modern engineering practices. Global cement production was approximately 4.4 billion metric tons in 2021, with forecasts indicating an annual increase due to rising infrastructure development and urbanization [1,2]. Driven by the growing needs of developing nations like China, which alone accounted for nearly half of the world’s cement, the production above projections is staggering. However, this growth comes at a significant environmental cost because carbon dioxide emissions from traditional Ordinary Portland Cement (OPC) manufacturing is an ongoing trend of annual rise [3]. Therefore, researchers are exploring different binders for concrete to mitigate the negative carbon impact of OPC cause in the environment [4]. Geopolymers are considered eco-friendly alternatives to OPC, with low production costs and up to 80% less carbon emissions, and they require 60% less energy for their production [5,6]. Unlike OPC hydration, the geopolymerization process is a series of complex phases, including dissolution, nucleation, gelation, reorganization, polymerization, and polycondensation [7]. Geopolymers possess significant engineering properties, such as low rates of shrinkage, early strength development, and outstanding durability properties. It can, however, be argued that geopolymers are brittle, similar to their OPC counterparts [8,9]. The brittleness makes the concrete prone to high tensile stresses, which can lead to the formation of more extensive cracks. The development of extensive cracking can cause significant damage to the geopolymer and eventually reduce its service life.
Fiber reinforcement in concrete engineering is a popular technique to decrease brittleness and improve the performance of concrete structures using the fiber bridging effect [10,11]. Fiber bridging action acts as a stress distributor, which controls the crack’s opening and growth and requires more energy for crack propagation in the fiber-reinforced concrete [12]. Fiber-reinforced composites can be broadly classified into two main categories based on their post-cracking behavior: strain softening and strain hardening [13]. In strain softening, the material experiences a decrease in load-carrying capacity after initiating the first crack. On the other hand, strain-hardening composites display an increase in strength or stiffness with increasing deformation, and the composite still resists incremental loading levels. The engineered cementitious composite (ECC) is a distinctive category in high-performance fiber-reinforced composites, characterized by its strain-hardening properties [14]. The constituent materials are selected based on micromechanics to achieve multiple cracking phenomena accompanied by the formation of tight cracks. Among the various reinforcing fibers, polyvinyl alcohol (PVA) fiber emerges as a favored choice in ECC formulation for its exceptional attributes such as impressive tensile strength, favorable chemical compatibility with cement, and strong affinity with water. The ECC utilizes a maximum of 2% PVA fiber by volume to achieve a tensile strain capacity exceeding 3%, approximately 100 times greater than standard concrete [15]. The need to exclude coarse aggregates in the ECC to accomplish this unique behavior increases demand for cementitious materials [14]. This demand, in turn, necessitates significant energy consumption, making cement production high in carbon emissions. However, in comparison to the traditional ECC, the engineered geopolymer composite (EGC) dramatically reduces the environmental impact. Embodied energy and CO2 are two environmental impacts characterized by distinctive 76% and 36% decreases, respectively [15]. This shift in material choice underscores the progress in sustainable material development and the relentless pursuit of eco-friendly solutions in composite material development.
In addition to the geopolymer binder and the PVA fibers, fine aggregate is an essential ingredient in the EGC [16]. Like the ECC, the fine aggregate used for the EGC comprises silica sand with an average particle size from 100 to 236 µm and a maximum particle size of less than 1180 µm. However, concern is raised regarding the availability of resources and the environmental effect of mining the sand [17]. The efficient management of waste is a critical global challenge [18]. Polyethylene terephthalate (PET) originates mainly from plastic bottles that are the most environmentally dangerous when disposed of in landfills. Plastics represent, on average, 8% to 12% of the total municipal waste stream. Still, the share of plastic waste differs from country to country, depending on the lifestyle, standard of living, and per capita income [19]. The global consumption of PET bottles reached 159 million tons in 2023, with 43% of this amount contributing as waste material [20]. By incorporating PET waste directly into concrete, we can significantly reduce the environmental impact of plastic waste. This urgent need to address the plastic waste crisis should instill a sense of responsibility and urgency in our audience.
One potential strategy for reusing PET waste in the construction industry is to incorporate it directly into concrete through strips, fibers, and aggregates [21]. Panara et al. [22] conducted a study to investigate the influence of PET strips on concrete characteristics during low-frequency cyclic loading at varying stress levels. The results demonstrated that PET concrete had an increased loading capacity, reduced variability, and damage propagation delay but improved damage tolerance during cyclic loading. Several researchers have explored the possibility of using PET waste as a fiber in concrete mixes, typically involving a general volumetric percentage of 0.25% to 4% [21]. These studies have shown that adding PET fibers to concrete can enhance flexural strength, tensile and compressive strength, fracture toughness, and flexibility. Still, it can also significantly reduce workability and elastic modulus [23]. Previous works have also identified the optimal fiber percentages for maximum concrete properties to be approximately 1–1.5% [21].
A recent focus has been shifted to the possibility of using PET as an aggregate in concrete [24,25]. Abu-Saleem et al. [25] conducted experiments involving waste plastic in concrete, highlighting that using plastic as a replacement for coarse aggregate notably bolstered the impact resistance of the concrete specimens. Notably, specimens with an optimal plastic replacement level of 30% exhibited a remarkable 4.5 times greater impact resistance compared to control concrete. Moreover, studies indicate that concrete containing PET plastic demonstrates superior abrasion resistance [26], improved heat insulation properties [27], and greater ductility under flexural load [28], suggesting a wide range of potential benefits for utilizing PET plastic in concrete formulations. Some positive features of PET for concrete production have been mentioned; however, one significant disadvantage is reduced compressive strength. Saxena et al. [29] conducted a study in which PET bottles were shredded and ground to produce fine and coarse aggregates used in concrete. The plastic waste was shredded into two size categories as follows: fly ash (FA) replacement, from 0 to 4.75 mm, and coarse aggregate (CA) replacement, from 4.75 to 20 mm. The traditional aggregate was subsequently substituted by different amounts in one variant of 5%, 10%, 15%, and 20% by weight. Their findings proved a decrease in compressive strength in concrete containing PET aggregate. Relatively, there was a massive reduction in the compressive strength of mixes in which PET was used as a substitute for coarse aggregate. On the contrary, in mixes where PET was used as a substitute for fine aggregate, there was a minimal decline in compressive strength, especially at a 10% replacement dosage, although the compressive strength dropped significantly beyond this limit. In addition, the findings of Chong et al. [24] also confirm the above trend since the replacement of the fine aggregate with PET plastic performs much better than the latter’s replacement of the coarse aggregate in the concrete. To address this problem of reduced strength when using PET as an alternative to aggregates in the concrete, two approaches can be addressed. The first approach includes improving the bond between PET and the matrix by surface treatment methods, such as PET-gamma radiation. The second approach is based on the improvement of the PET–matrix interface. In this case, the properties of the concrete are improved with the assistance of nanoparticles. Abdulkadir et al.(2024) [30] demonstrated the successful incorporation of graphene oxide, a type of nanomaterial, to significantly enhance the mechanical properties of engineered cementitious composites (ECCs). Therefore, nanoparticles might be used to modify the concrete’s pore system, thus facilitating a more effective bond between the PET particles and the matrix. Furthermore, by examining the implications of these two mechanisms, the reduced strength of the PET–matrix composite can be potentially overcome. Consequently, the mechanical properties of concrete incorporating PET as an aggregate vary due to the different sizes, shapes, and percentage substitution compared to sand, highlighting the need for further research and experimentation. Although almost all other studies have used PET passing through a 4.75 mm sieve due to this fact of common use, indeed, there is limited research available to replace microsilica sand with PET, which is one of the most commonly used material for developing high-performance concrete composites, like engineered geopolymer composites (EGCs). The promise of nanomaterials transforming the properties of concrete is an exciting idea that will likely pique the interest of our readers and drive them towards new approaches. This gap underscores the novelty of this study.
Gamma-irradiation has been studied since the 1970s as a method of influencing the chemical composition of polymers, including plastics, and, accordingly, changing the mechanical characteristics of these materials [31]. Three major chemical processes occur during the impact of gamma-irradiation: chain scission, cross-linking, and grafting of chains [31]. Scission of the chain entails an increase in the polymer’s degree of crystallinity, which has shown several positive effects on mechanical characteristics [32,33]. Cross-linking, conversely, induces the formation of covalent bonds between the polymer chains [34], which contributes to the reinforcement of the chemical composition of the polymer. Grafting is the covalent bonding of monomers to the polymer chain [31]. All of these processes lead to the improvement of the mechanical characteristics of the polymer chain. Imran et al. (2021) [35] investigated the mechanical properties of semi-flexible pavement surfacing containing gamma-irradiated waste PET-based grouts. They found that gamma-irradiated waste PET can be incorporated into cementitious grout at a 4.75% replacement level of cement without compromising the mechanical properties of the grout. Therefore, it is established that using irradiated PET to replace microsilica sand in concrete partially would be an economically viable way of disposing of PET waste while reducing the consumption of natural resources. Many scientists believe that gamma-irradiation of PET enhances the mechanical characteristics of concrete compared with concrete with non-irradiated PET waste [32,33,34,36]. On the contrary, others concluded that using gamma-irradiated PET does not qualitatively restore the mechanical strength lost while using non-irradiated PET waste [31]. Thus, this issue remains largely unresolved and requires further study to address this conspicuous research gap.
Nanomaterials (NMs) have been increasingly used to augment the properties of geopolymer concrete [37]. The presence of NMs has been observed to enhance the geopolymerization reaction, resulting in a denser matrix [38]. Moreover, NMs strengthen the durability of geopolymer concrete by restricting micropore interconnections [39]. In recent years, studies have been carried out to include graphene nanoparticles in geopolymers due to the superior characteristics of NMs [40,41]. Research has shown that graphene nanoplatelets (GNPs) at a dosage as little as 0.1–0.4% can significantly enhance the mechanical properties of geopolymer concrete [42]. The remarkable surface area and superior mechanical properties of GNPs reduce the porosity and strengthen the mechanical performance of geopolymers [38].
Based on insights gleaned from the literature, it is evident that the combined impact of gamma-irradiated polyethylene terephthalate and graphene nanoplatelets within engineered geopolymer concrete has been sparsely scrutinized. Consequently, there exists a gap in knowledge regarding the potential enhancements these materials could offer to the mechanical properties and post-cracking behavior of EGC. Thus, the principal objective of the present study was to address this research gap by conducting a comprehensive experimental analysis aimed at elucidating the synergistic effects of IR-PET and GNPs on EGC properties. Additionally, this research employed response surface methodology (RSM) to develop quadratic models for predicting the mechanical and post-crack properties of the developed engineered geopolymer composite (EGC). Furthermore, an optimized mixture is proposed to advance sustainable mix design development.

2. Experimental Program

The experimental program was precisely planned to systematically evaluate an effective approach to utilize the waste PET for EGC. It is designed in two phases. Initially, the efficiency of infrared treatment on waste PET was evaluated and compared with normal waste PET and its potential utilization in EGC. Secondly, further enhancement of EGC properties was investigated through the synergistic effects of IR-PET and GNPs. Finally, the optimal mix design was derived using response surface methodology (RSM), and experimental validation of the obtained optimized mix design was conducted. The comprehensive details of the experimental program are illustrated in the subsequent subsections.

2.1. Materials

2.1.1. Fly Ash

This investigation utilized fly ash obtained from the Manjung power plant in Perak, Malaysia, as the primary constituent for formulating a one-part EGC. The term “one-part” is a mixing approach of geopolymers in which all components are mixed at one stage without further activation or curing phases, and this strategy can make the mixing easier and promote composite preparation simultaneously. The chemical composition and loss on ignition of the fly ash were assessed via X-ray fluorescence (XRF), with detailed results provided in Table 1. Analysis revealed that the combined oxides of silicon, aluminum, and iron constituted 70.9% of the sample, while the calcium oxide content was measured at 19%, meeting the ASTM C618-22 criteria for class C fly ash. This particular type of fly ash is recognized for its pozzolanic and cementitious properties, rendering it well suited as a base material for ambient-cured geopolymers. Notably, previous research by Bashar et al. [43] demonstrated the efficacy of this fly ash in developing ambient-cured one-part geopolymers with exceptional compressive strength. The spherical morphology of the fly ash particles was confirmed through FESEM imaging, as depicted in Figure 1.

2.1.2. Activator

To commence the process of geopolymerization, the alkaline activator plays a crucial role by interacting with the alumina–silicate base material (e.g., fly ash, metakaolin, slag, etc.) and initiating the geopolymerization chain reaction [44]. Traditionally, in two-part geopolymer systems, liquid sodium or potassium-based alkaline activators have been employed [45]. However, this study deviates from convention by utilizing anhydrous sodium metasilicate (sourced from Portray Sdn Bhd, Petaling Jaya, Malaysia) containing 50% Na2O and 46% SiO2.

2.1.3. Aggregates

Aggregates in EGC are responsible for altering the matrix-related properties, such as elastic modulus and fracture toughness. Furthermore, it is essential to limit the aggregate size to develop multiple cracking behavior in EGC [46]. Therefore, the locally supplied microsilica sand (MSS) with a maximum particle size of 710 µm was utilized. The gradation of microsilica sand is summarized in Table 2. Furthermore, the waste PET obtained from Enhance Plastic Industry Sdn Bhd, Ipoh, Malaysia, was used as the partial replacement for MSS. The particle size of the obtained raw PET ranged from 75 to 2000 µm (Figure 2). However, for the comparative justification, the gradation of the raw PET was adjusted with the MSS’s gradation, as shown in Table 2, subsequently referred to as R-PET. The FESEM image of the waste PET is given in Figure 3. which confirms the relatively smooth surface texture.

2.1.4. Gamma Irradiation of PET

The gamma radiation facility at the Malaysian Nuclear Agency (Selangor state) was utilized in this study due to its accessibility for research and development purposes. Extensive literature supports the use of a radiation dosage of 100 kGy, delivered at a rate of 58 Gy/min, as the most optimal for modifying PET for application in the construction industry [47]. Therefore, the R-PET sample was exposed to gamma radiation (later termed IR-PET) with a dosage of 100 kGy, which enabled it to develop a chain scission effect, as confirmed by the FESEM image of the IR-PET sample shown in Figure 4. It is mentioned that the gradation of IR-PET (Table 2) was shifted to the lower sieve number when compared with R-PET, and this could have occurred due to the chain scission effect of IR treatment, which enables PET molecules to break into small fragments and contributes to reduced particle size. Furthermore, X-ray diffraction analysis (XRD) of R-PET as well as IR-PET was performed, and the results are shown in Figure 5. Peak intensities were observed at 2θ of 17.7°, 22.73°, and 26°, which are considered typical peaks observed for PET [48]. Higher crystallinity was observed for irradiated samples; therefore, it is expected that this increase in crystallinity of PET is likely to contribute to improving the mechanical properties of EGC.

2.1.5. Graphene Nanoplatelets

The GNPs used in this work were acquired from XG Sciences (Brand xGnP®, Lansing, MI, USA). Graphene nanoplatelets are also known as few-layer graphene or multilayer graphene. The opted ones were graphene sheets (Figure 6), whose thickness ranged from significantly less than a micrometer to a few nanometers. These platelets may vary in lateral dimensions and typically exhibit properties that span the range between those of individual graphene sheets and bulk graphite. The properties of the GNPs are given in Table 3.

2.1.6. PVA Fibers

The geometry of the PVA fibers plays a significant role in effectively inducing the multiple cracking behavior in the EGC. Therefore, the length, diameter, aspect ratio, and surface morphology of the fibers are the key parameters that influence the interaction of the fibers with the matrix. In addition to the crack-bridging ability, these also play a role in the energy dissipation mechanisms, which are not merely linearly proportional to the absorbed strain, which is observed in the standard fibers. Accordingly, this study shows that the thinner PVA fibers are not only intrinsically more flexible due to lower shear moduli but also have inherently higher aspect ratios as compared to their thicker counterparts [44]. Therefore, this study utilized thin PVA fibers (from the Kuraray Co. Ltd., Tokyo, Japan) having a diameter of 0.04 mm, which is confirmed by the FESEM image (Figure 7), and other relevant properties are given in Table 4.

2.2. Experimental Design

The mix design for the one-part EGC mix proportions is divided into two phases. Conventional design principles were utilized in Phase 1 to focus on the influence of PET irradiation as a single variable. Subsequently, Phase 2 examined the synergistic effect of IR-PET and GNPs on EGC properties. For Phase 2, RSM was used on the experiment mix designs to comprehensively explore the merged impact of these variables. It is essential to mention that all mix designs used a total fiber volume of 2%, which is a prevalent practice in the literature [49,50].

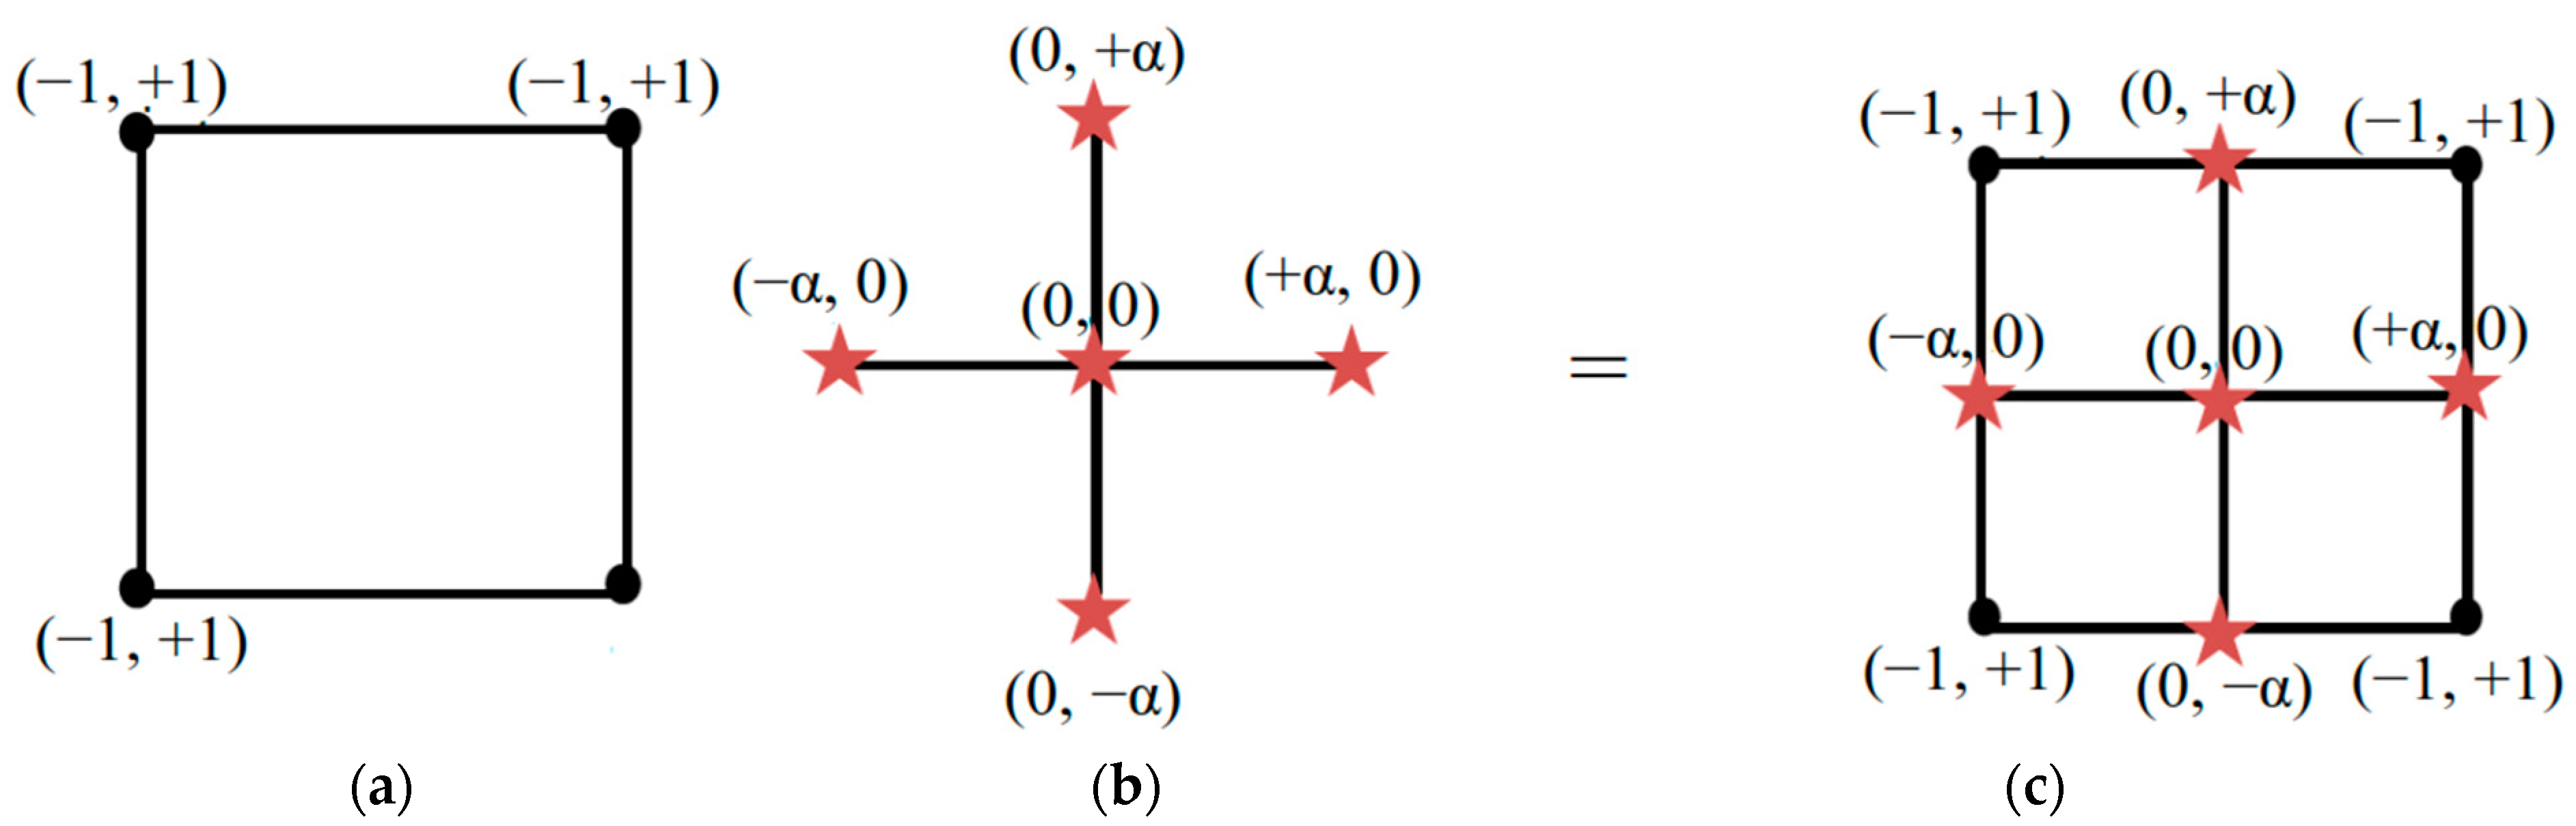
2.2.1. Design of Experiments

In assessing the impact of independent variables on responses, it is customary to alter one variable at a time, a process that can be time consuming for systems with multiple variables. Consequently, addressing multi-objective optimization challenges requires a robust approach. RSM offers such a solution, which typically involves four key steps: (i) designing experiments, (ii) collecting response data from conducted experiments, (iii) formulating a numerical model using RSM, and (iv) optimizing and validating the developed model [51]. In RSM, experiments are frequently designed using the central composite design (CCD) method, a type of two-level factorial design [52]. As illustrated in Figure 8, the selection of data points encompasses various criteria: (a) corner points of the square for all +1 and −1 design points, (b) a midpoint between all factors, and (c) points with extreme +α and −α values (for face-centered CCD; α = 1 ) [53]. Subsequently, a second-degree polynomial equation [Equation (1)] is employed to construct the RSM numerical model for responses, which include compressive strength, elastic modulus, flexural strength, flexural toughness, and ductility index [51]. Defined factors and their corresponding code, units, and levels are given in Table 5. Here, the ranges of gamma-radiated PET and graphene nanoplatelets were selected as 0 to 50% and 0 to 0.50%, respectively, while other factors were kept constant. Table 6 and Table 7 show the mix design of the one-part EGC for both phases. Phase 1 addresses the influence of gamma irradiation of PET on the properties of EGC, whereas Phase 2 was dedicated to exploring the synergic effect of gamma-irradiated PET and GnP on the properties of EGC. The primary ingredients for the one-part engineered geopolymer composite (EGC) mixture include fly ash (FA), sodium metasilicate (Na2SiO3), the water-to-geopolymer solids ratio (W/GP solids), and polyvinyl alcohol (PVA) fibers. The dosages for these components were determined based on the available literature [43,50] and are detailed in Table 6 and Table 7 of the mix design.
Y = ρ o + ρ i x i + ρ i i x i 2 + ρ i j x i x j
where
Y = predicted response, ρ o = constant coefficient, ρ i = linear coefficient, ρ i i = quadratic coefficient, ρ i j = interaction coefficient, and x i , x j = independent variables.

2.2.2. Dispersion Method of Graphene Nanoplatelets in Water

Graphene is naturally hydrophobic, giving it a low affinity for water molecules. This hydrophobic nature leads to the agglomeration of graphene sheets and promotes the resistance of its dispersion in aqueous solutions. Also, the surface area of graphene is exceptionally high, which further promotes agglomeration. The extensive surface area supplies more opportunities for inter-sheet interactions, forming agglomerates [54]. Therefore, in the homogenous mixing of geopolymers, the dispersion of GNPs in water is crucial [55]. The process starts with a 10 s manual shake of GNPs in water with a sealed lid portable water bottle. This is performed to break up the agglomerates and further disperse them. The mixture underwent sonication for 30 min. Ultrasound waves cause cavitation bubbles in the mixture that collapse and generate shear forces to aid in the exfoliation and dispersion of the GNPs. The complete process of dispersion of graphene nanoplatelets (GnPs) in water is given in Figure 9.

2.3. Mixing Procedure Casting and Curing of Geopolymers
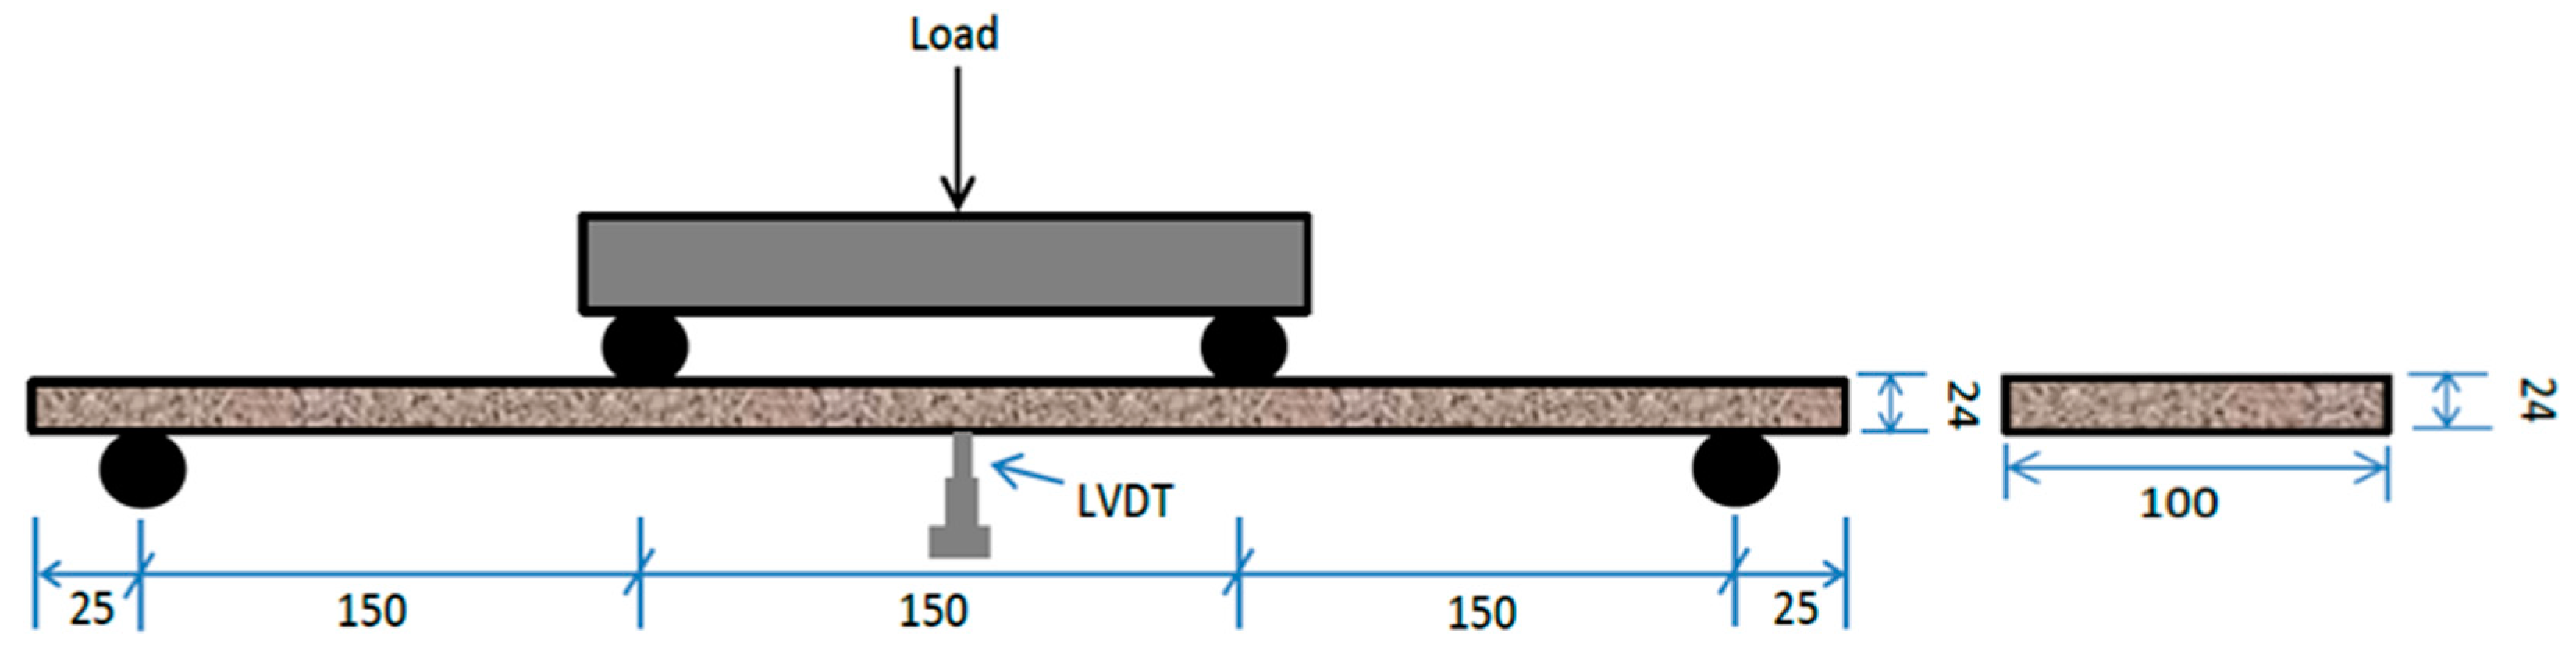
The mixing process involved a total duration of five minutes. Initially, a Hobart mixer was used for dry mixing of fly ash, sand, PET, PVA fibers, and anhydrous sodium metasilicate for 30 s at a slow speed. Subsequently, water containing dispersed graphene was poured, and the mixing was continued for a further 30 s at a slow speed and for another 240 s at a fast speed. A homogeneous mixture was then obtained, and the mixture was placed into molds for casting samples. The samples remained in the mold for 24 h. After 24 h, the samples were stripped out of the molds and left for 28 days curing at ambient temperature.

2.4. Test Methods

Following the completion of the 28-day curing period, the specimens underwent testing procedures. Compressive strength evaluation was conducted on 50 mm cubes in adherence to ASTM C109/C109M-16. To assess properties, such as flexural strength, first-crack strength, ductility index, and flexural toughness, tests were performed on prismatic-shaped samples with dimensions of 500 × 100 × 24 mm (Figure 10). The determination of flexural strength, first-crack strength, and flexural toughness followed ASTM C1609/C1609M-19a. Additionally, the ductility index ( μ ) was computed using the equation [Equation (2)] suggested by Zahid et al. [50]. Moreover, the drying shrinkage test was performed according to ASTM C157/C157M-17 using 25 × 25 × 285 mm prismatic samples. A comprehensive overview of the experiments is provided in Table 8.
μ = Δ p / Δ f
where Δ p and Δ f denote the deflection at peak load and first crack, respectively.

3. Results and Discussion
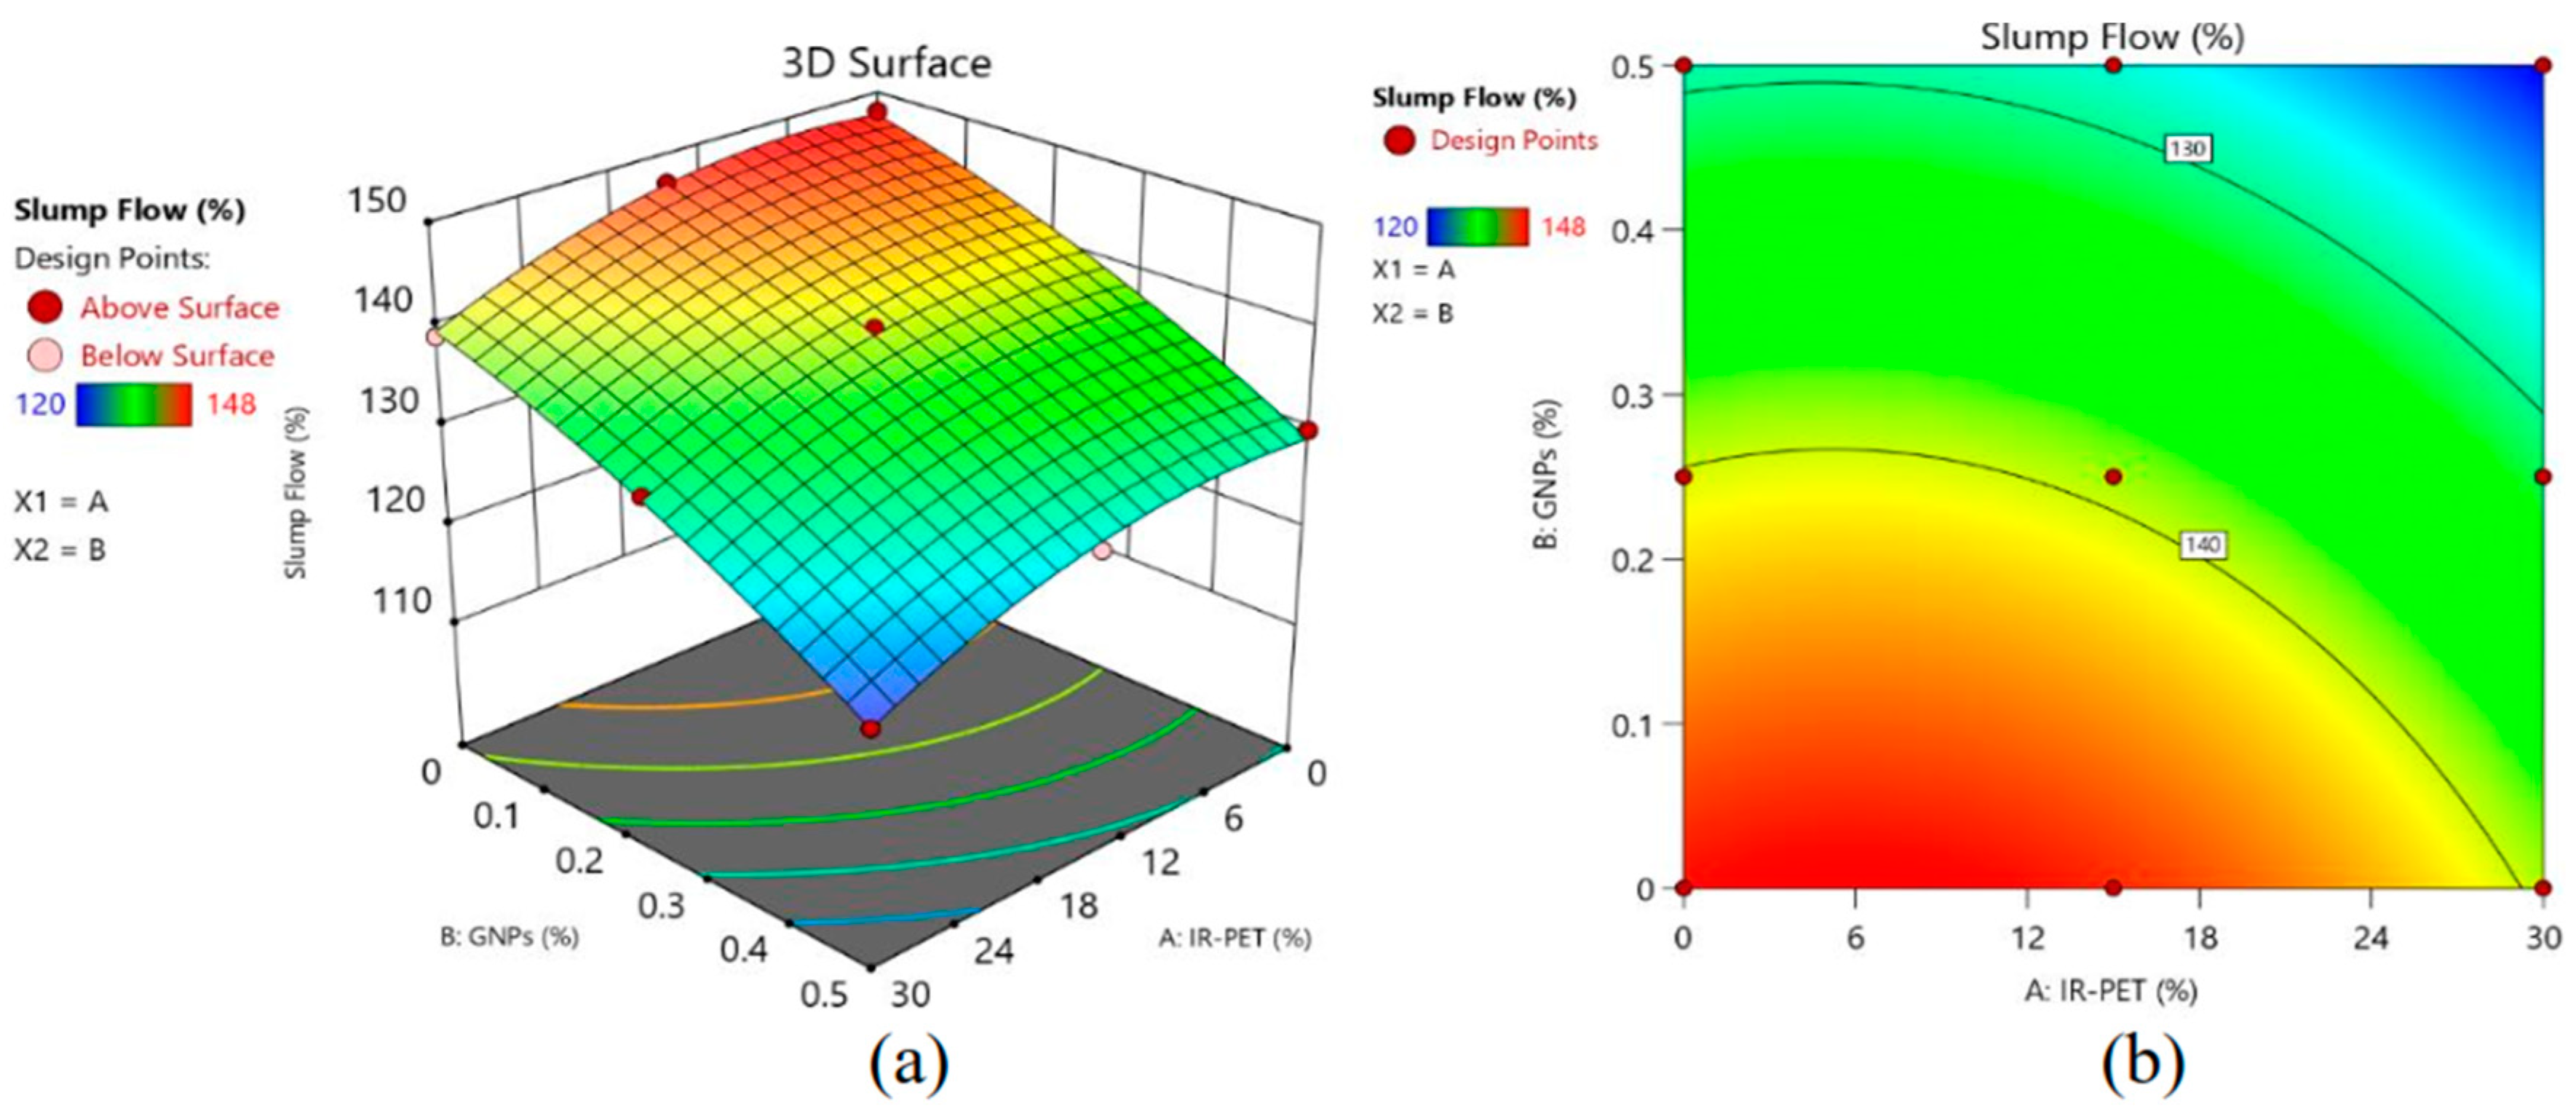
3.1. Slump Flow

The term “workability” denotes the uniformity and flow characteristics of freshly mixed materials. It directly affects mixing, placement, compaction, and finishing. Workability is quantitatively assessed through slump testing, which measures the degree of flow. In this study, the mini-slump flow test was conducted according to ASTM C1437-15, utilizing a slump cone with diameters of 70 mm (top) and 100 mm (bottom) and a fixed height of 60 mm. Initially, a fresh mix was prepared, and the slump cone was positioned at the center of a base plate. The mix was then poured into the cone until it was completely filled. Subsequently, the cone was lifted, allowing the mix to flow freely. Once the flow ceased, the spread diameter was measured, and the percentage flow ( ϕ ) was calculated using Equation (3).
ϕ = d s d b d b × 100
where d s and d b denote the spread and bottom diameters of the cone, respectively.
The influence of PET irradiation, as well as the synergic effect of GnPs and IR-PET on the slump flow, are shown in Figure 11. A slight increase in slump (4.7%) is seen when PET was added at the sand replacement level of 25%. This might have happened due to less water demand (water absorption) by the PET particles compared to the silica sand [56]. However, this 4.7% surge in slump value was neutralized when IR-PET was used at the same dosage level. The reason could be the chain scission in PET exposed to gamma irradiation, which led to increased interparticle resistance. Overall, it can be concluded that the addition of waste PET, either normal or irradiated, has no significant influence on the slump flow. In his study, Frigione [57] used a PET particle size range of 300 µm to 2.36 mm as a partial substitute for fine aggregates in concrete and observed the same findings.
Furthermore, the addition of graphene nanoplatelets (GNPs) notably abates the slump flow of EGC. The decrease in slump flow was observed as 6% at 0.25% of GNPs with no IR-PET. However, this reduction was reached at 12%, 14.2%, and 19% for 0.5% GNPs at IR-PET of 0%, 25%, and 50%, respectively. This effect of reduced slump flow by the addition of GNPs attributed to the large surface area of GNPs, which leads to more water absorption when compared with other ingredients of the mixture. The same phenomenon was observed by Iqbal et al. [42]. To further elaborate on the synergic effect of graphene nanoplatelets and irradiated waste PET on the slump flow of the one-part engineered geopolymer composite, 3D surfaces and contours are given in Figure 12.
Numerous studies have successfully devised and verified ANOVA models for forecasting the fresh properties of construction materials [50]. In line with this research trend, Equation (4) is introduced in this study to estimate the slump flow (%). The validation analysis of the regression models developed in the present study was carried out and detailed in the Appendix A of this report.
ϕ = 147.6 + 0.17 x 1 22.3 x 2 0.06   x 1 x 2 0.014 x 1 2 29.3 x 2 2
where x 1 and x 2 represents the dosages IR-PET and GNPs, respectively.

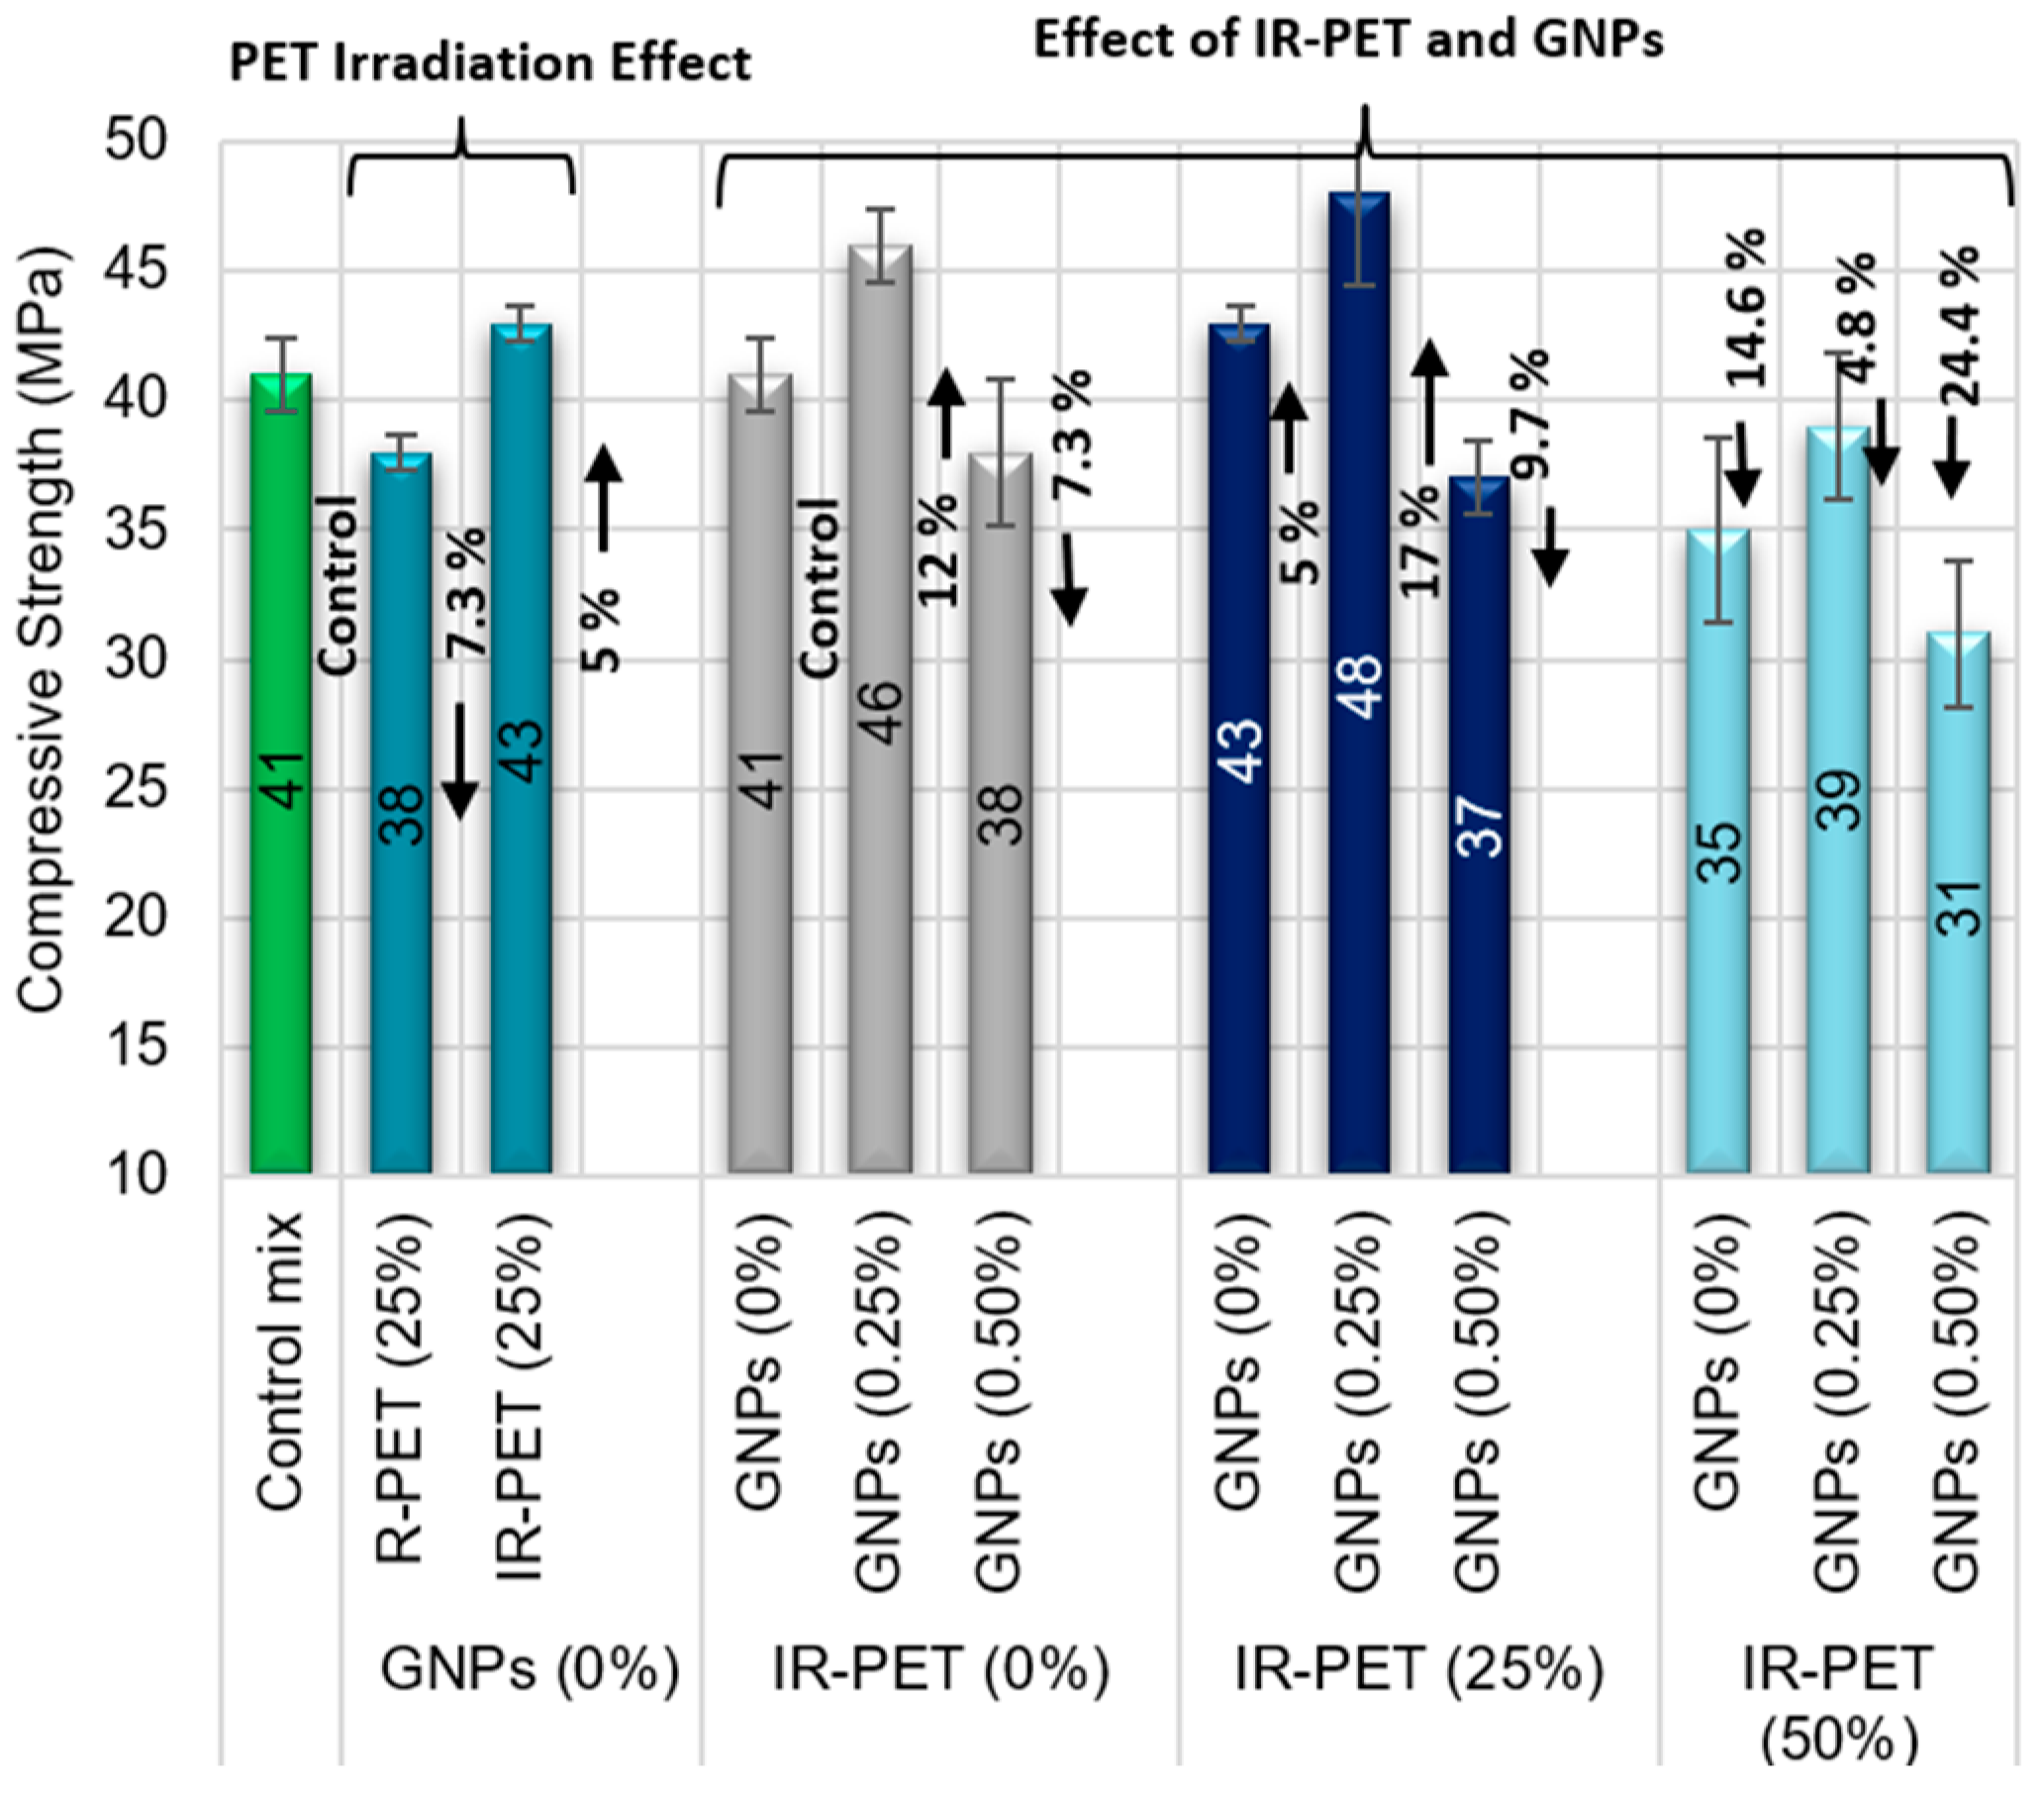
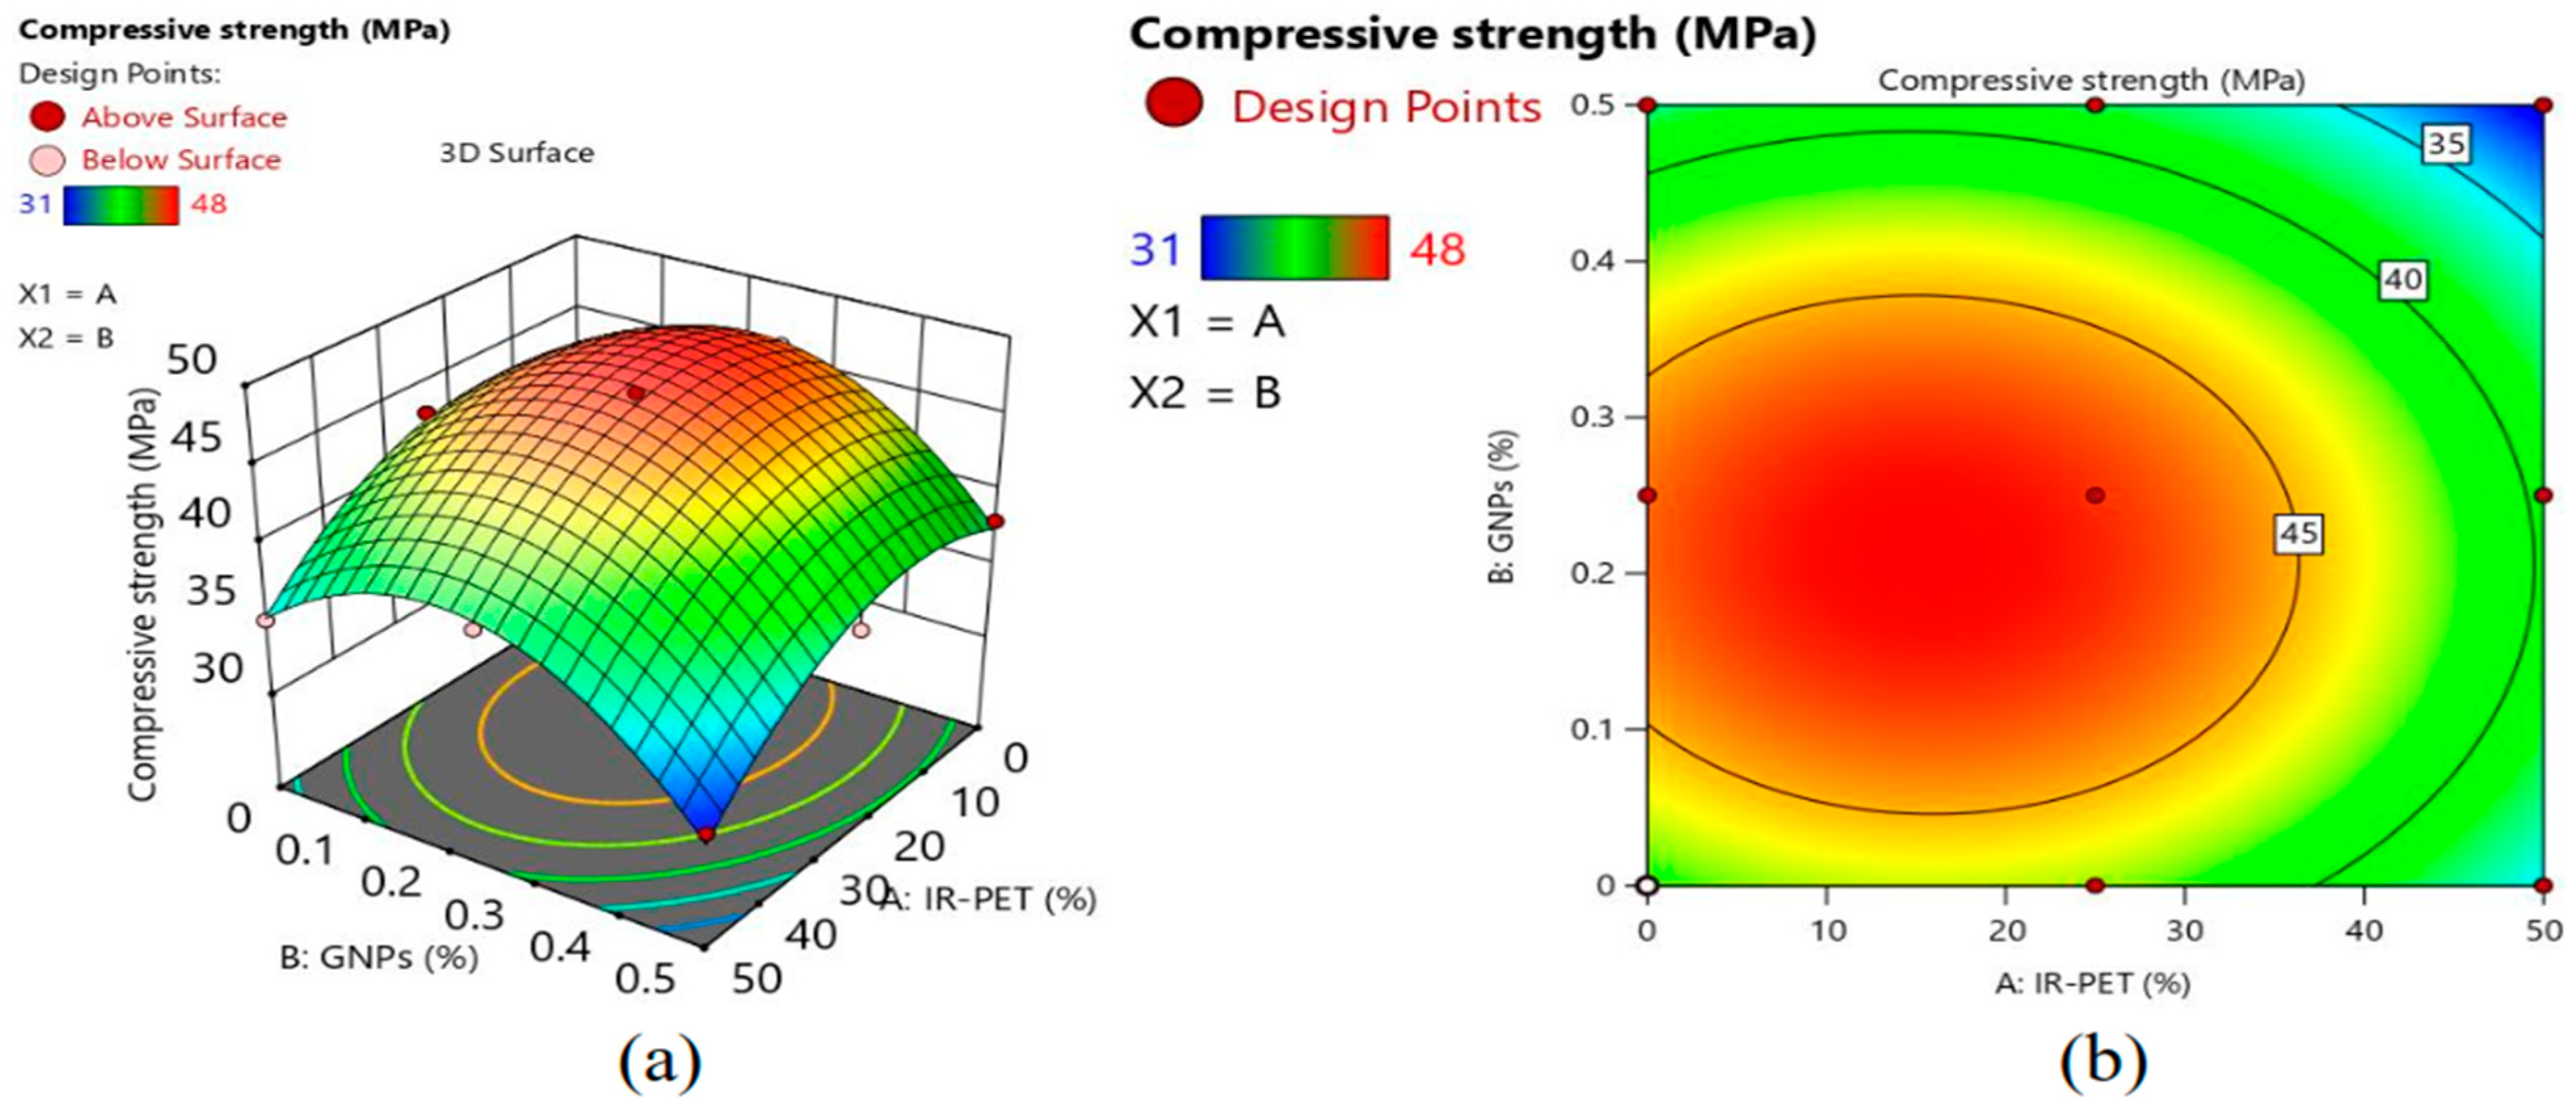
3.2. Compressive Strength

The compressive strength test was performed following ASTM C109. For each mix design, three cubes were tested using a universal testing machine at the loading rate of 3.0 kN/s [44]. The compressive strength results for the developed EGC modified with GnPs and irradiated/normal waste PET are depicted in Figure 13. A slight reduction in compressive strength was observed with the incorporation of R-PET at a dosage of 25%. This reduction in compressive strength was 7.3% when compared with the control EGC sample having 0% PET. Overall, the observed drop in compressive strength was likely due to the surface smoothness (Figure 3) of the R-PET particles, which led to a weak interfacial bonding between R-PET and the geopolymer binder. In this context, Lazorenko et. al. [58] and Ismail and AL-Hashmi [59] also observed the negatively affected compressive strength with the addition of PET in the geopolymer due to the weak PET–geopolymer matrix interface. On the other hand, the utilization of IR-PET completely recovered the compressive strength loss. The improvement in compressive strength between EGC utilizing R-PET and EGC with IR-PET was 13%. The notable enhancement observed here can be ascribed to the textured surface of the IR-PET particles (Figure 4). This surface characteristic facilitates the formation of effective interfacial transition zones between the PET and matrix (Figure 14). A similar trend of improving compressive strength by utilizing IR-PET in concrete was also observed in numerous research works [34,47].
The synergic effect of GNPs and IR-PET on the compressive strength of EGC is presented in Figure 13. Among all mixes, EGC with 0.25% GNPs and 25% IR-PET exhibited the highest compressive strength (48 MPa), which was 17% higher than the compressive strength of the control mix. The nano-size of GNPs led these particles to effectively fill micropores of EGC and contribute to the increased overall densification of EGC. Furthermore, GNPs have the potential to hinder and control micro-cracks, thereby reducing crack propagation and increasing the material’s capacity to withstand additional loads, ultimately leading to enhanced compressive strength [42]. The lowest compressive strength (31 MPa) was observed at 0.5% GNPs and 50% IR-PET. The reduced strength observed may stem from the agglomeration of GNPs (Figure 15) at this higher dosage level, where a weakened fiber–matrix interface is observed. Consistent with this notion, Li et al. [15] noted that higher GNP dosages can induce agglomeration, consequently leading to a decrease in compressive strength. To explore the synergistic interplay between GNPs and IR-PET on the compressive strength of EGC, 3D response surface plots and contours are illustrated in Figure 16. Figure 17 and Figure 18 illustrate the influence of GNPs on the reacted product, as well as the fiber–matrix interface of the composite. It is observed that the addition of graphene up to 0.25% enhances the reaction product and fills the voids around the fiber–matrix interface, leading to improved compressive strength. Additionally, this study used the RSM technique to develop an ANOVA-guided model [Equation (5)] for predicting the compressive strength (CS) of EGC, with GNPs and IR-PET as variables.
CS   = 41.3 + 0.2233 x 1 + 47 x 2 0.04 x 1 x 2 0.00693 x 1 2 109.3 x 2 2

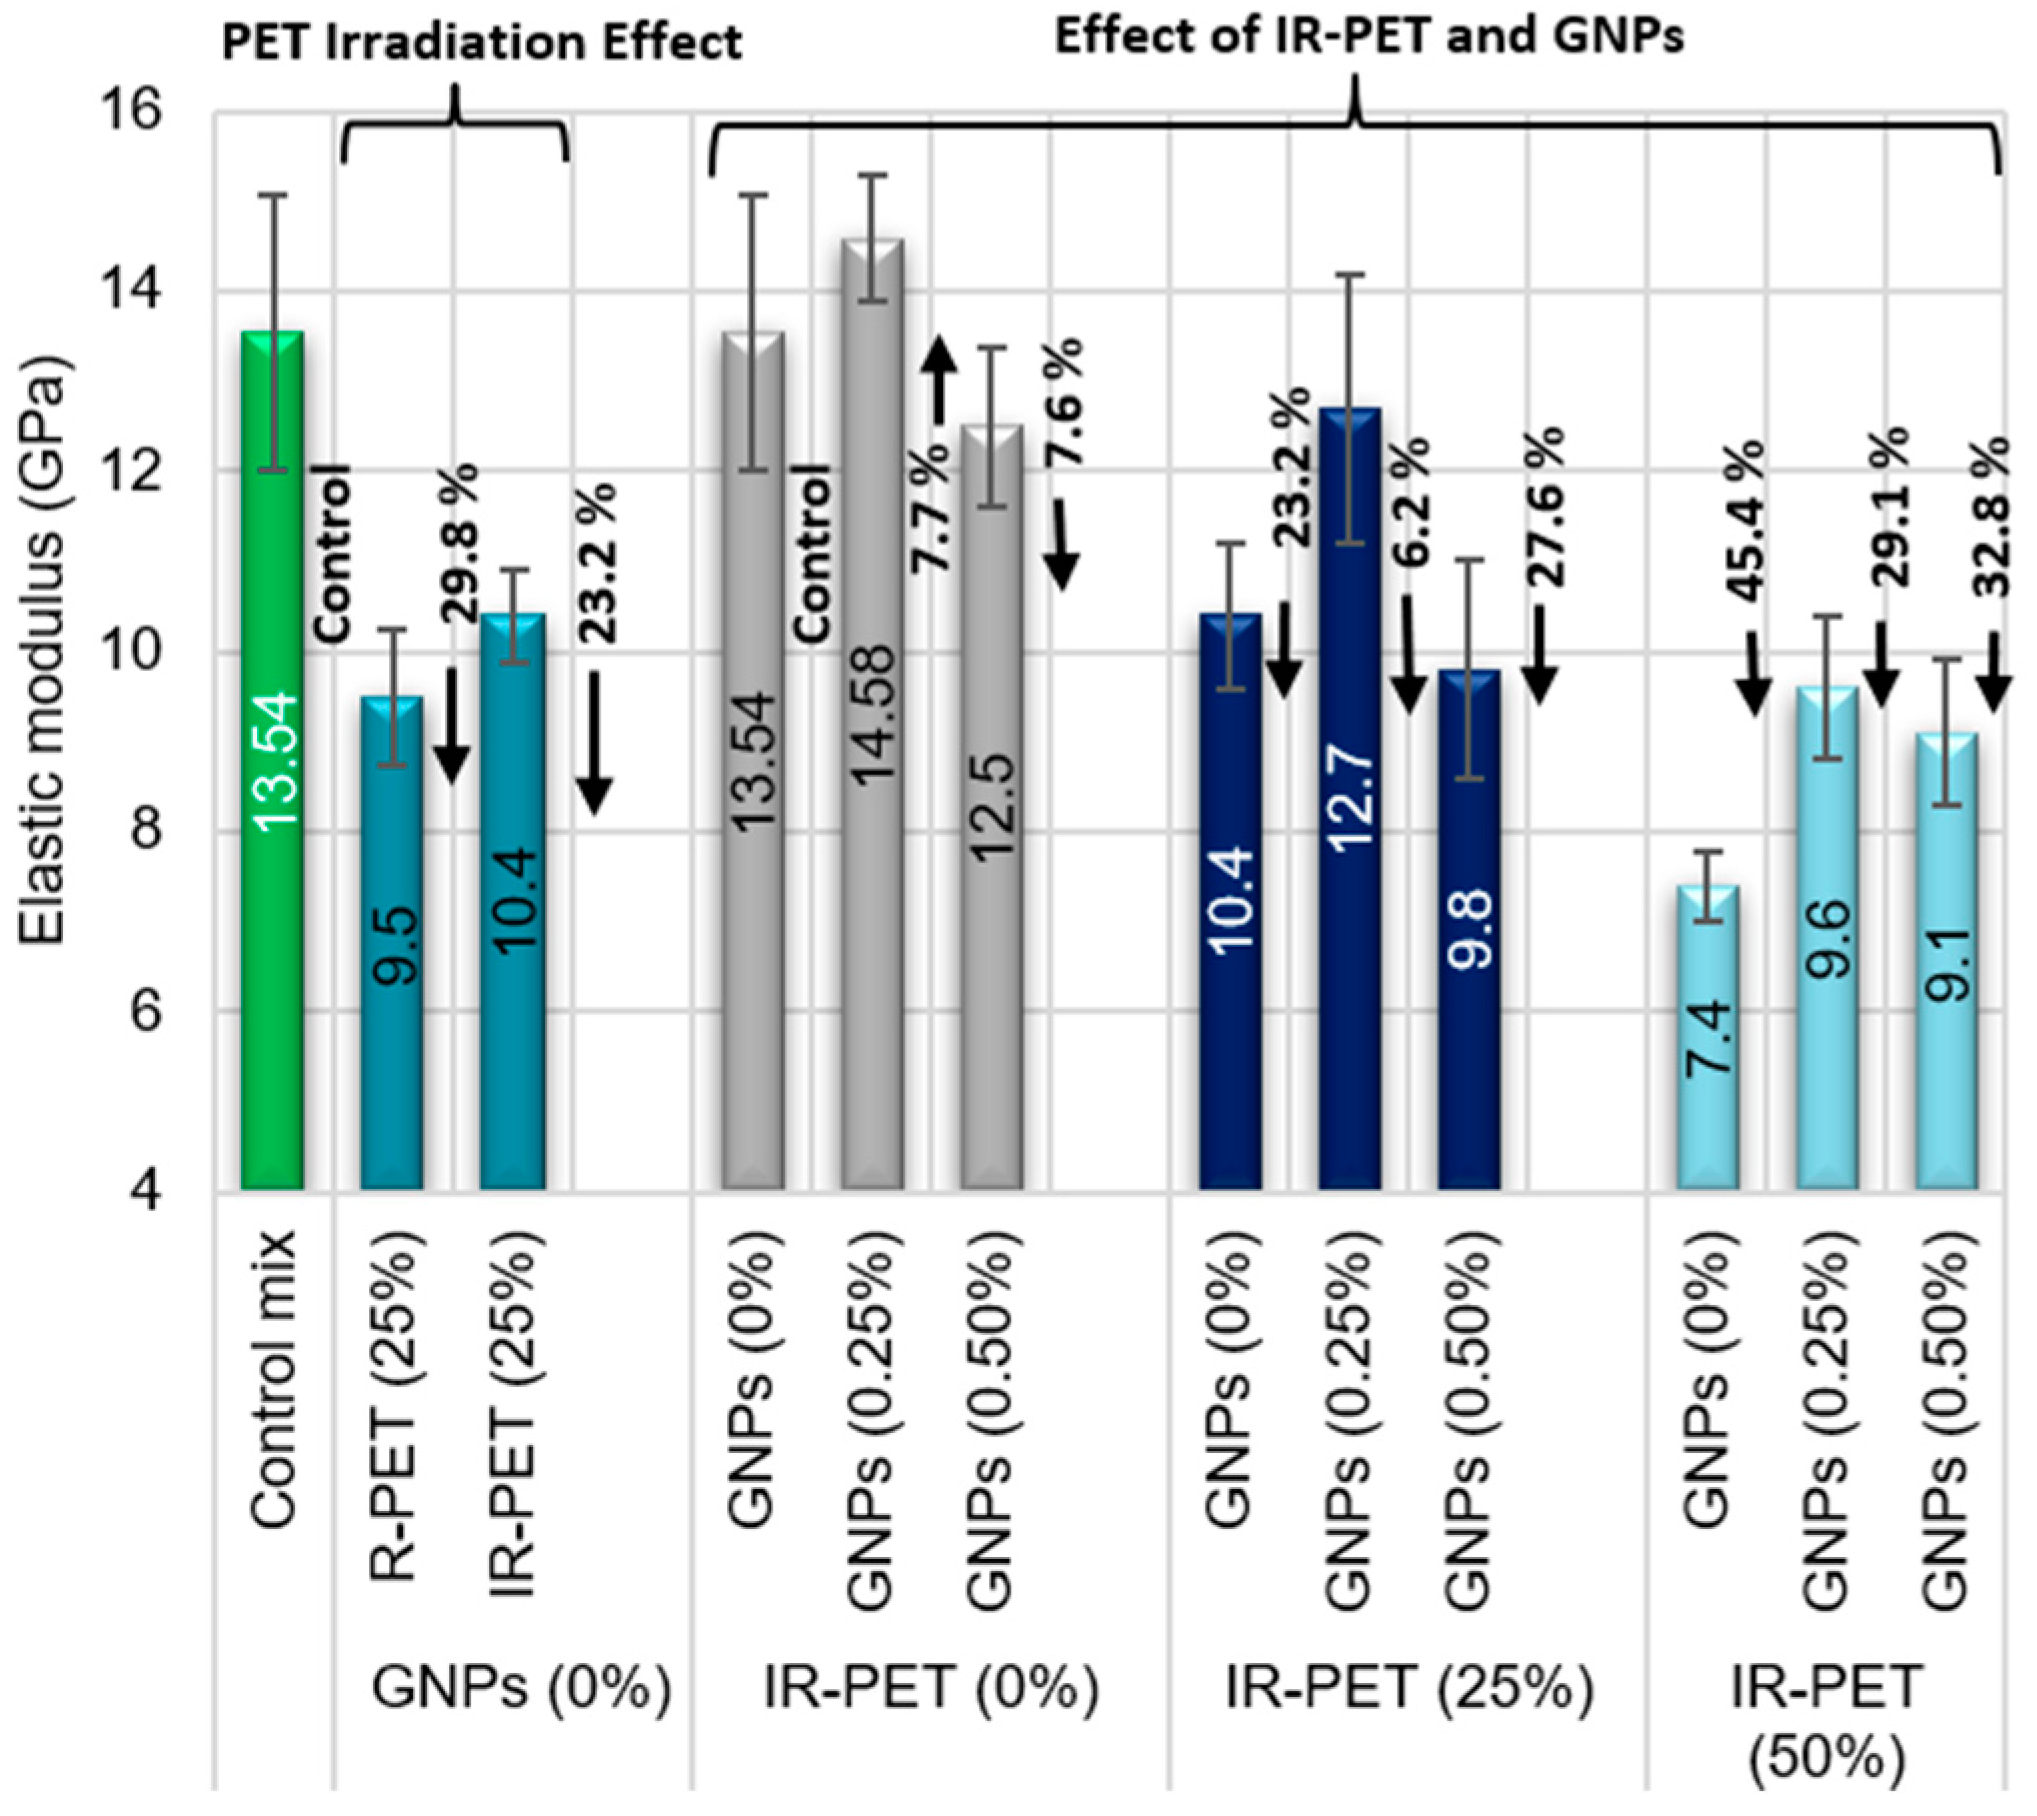
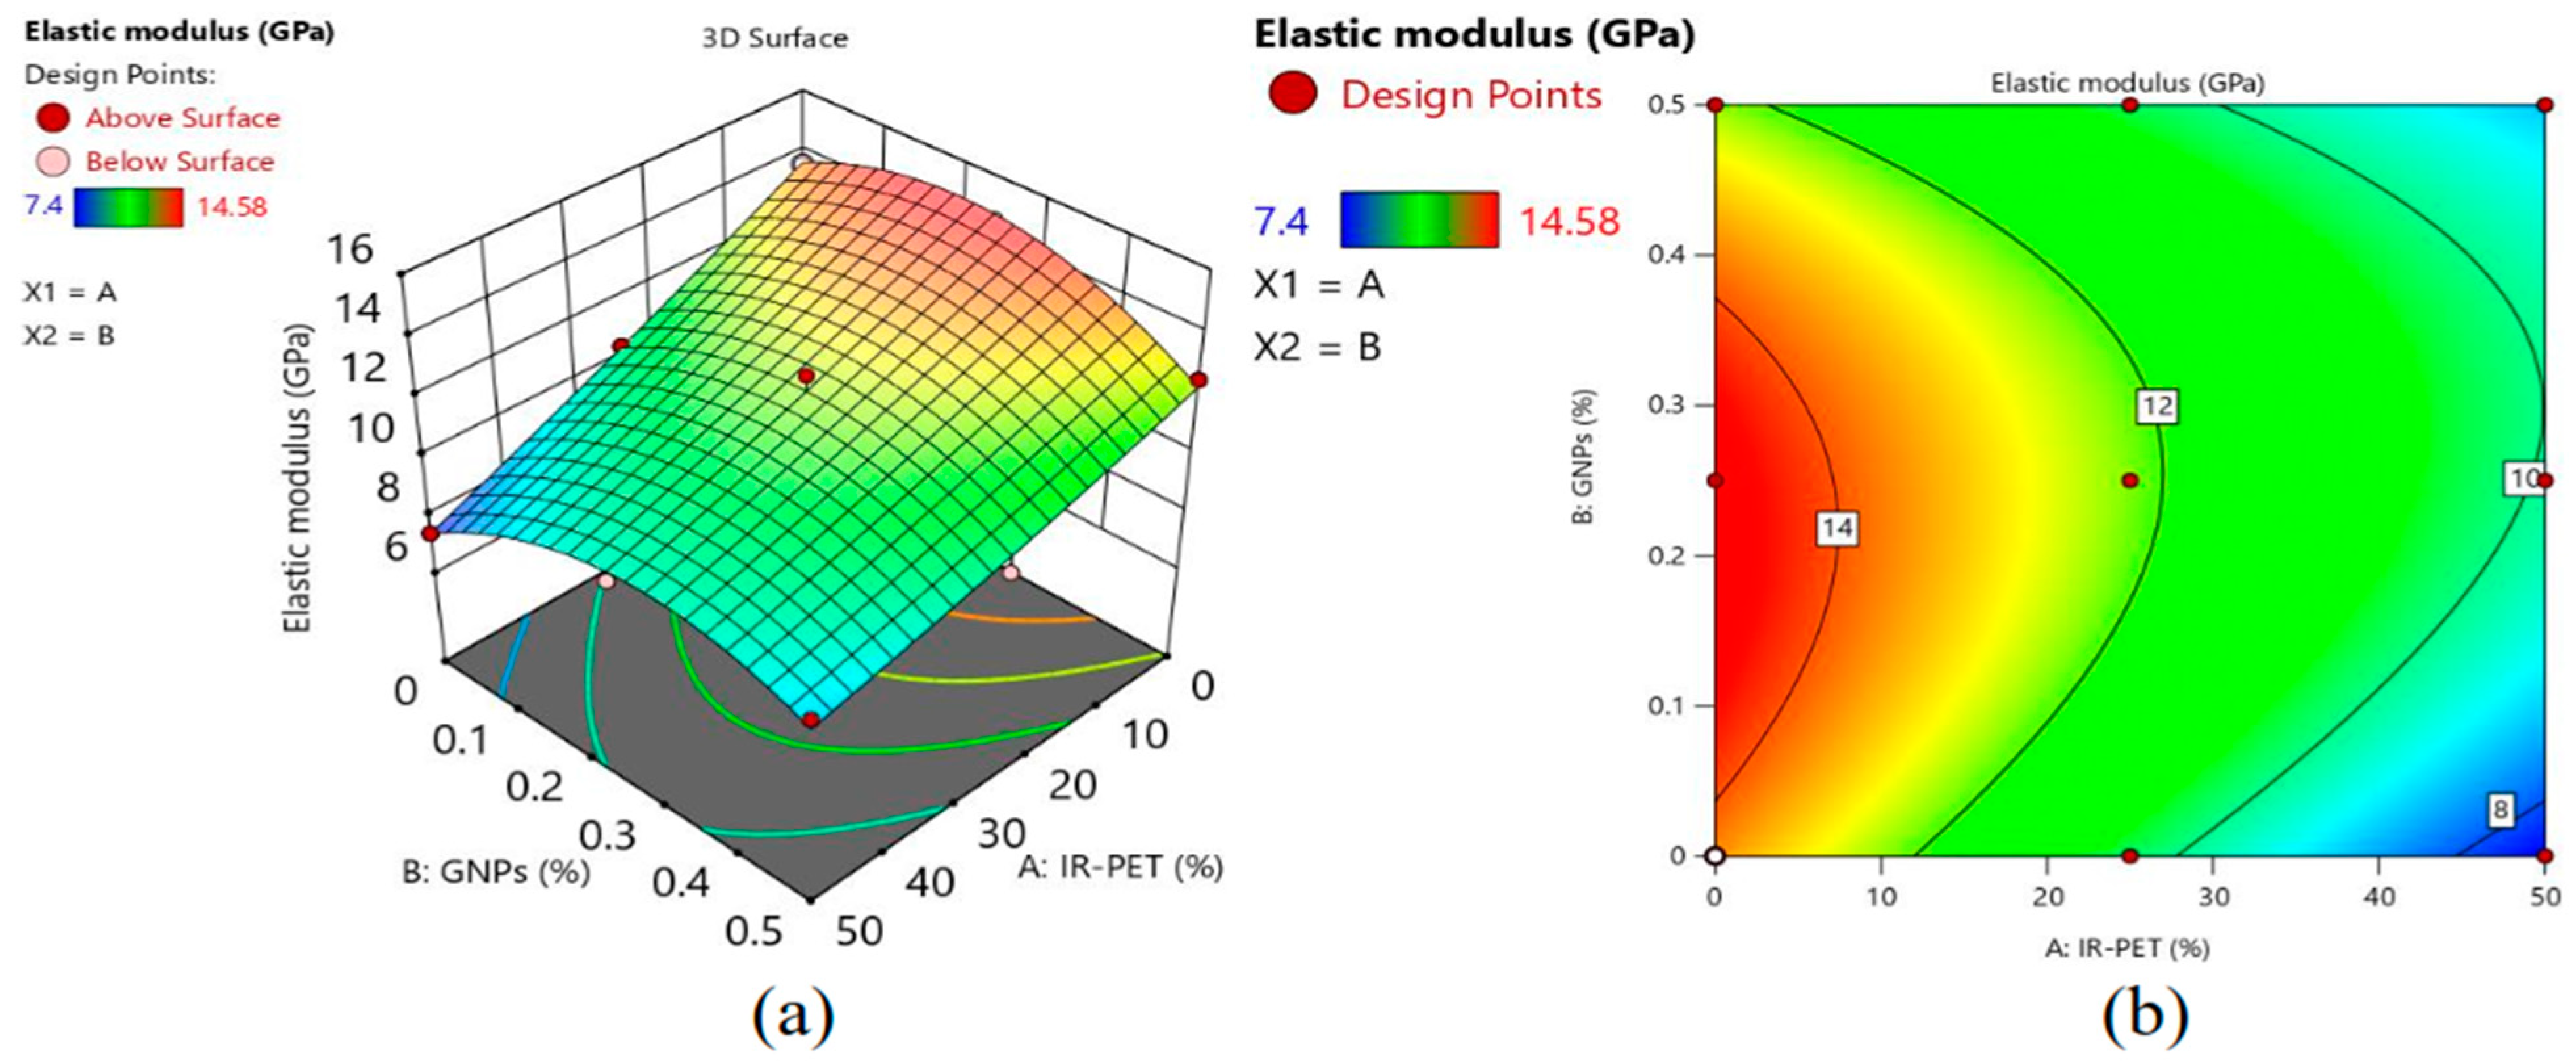
3.3. Elastic Modulus

The elastic modulus is a fundamental property that quantifies the deformation capacity and rigidity of the material [60]. The elastic modulus of EGC was investigated using 100 × 200 mm cylinders following ASTM C469. The results of the elastic modulus of EGC modified with irradiated/regular PET and graphene nanoparticles is depicted in Figure 19. The reduction in the elastic modulus was observed with the addition of PET (either regular or irradiated) in EGC. An abrupt reduction (29.8%) in the elastic modulus was observed, even with the inclusion of 25% R-PET. The reason could be the lower elastic modulus of PET, as well as the weak PET–matrix interface [61]. However, for IR-PET, this reduction in the elastic modulus was limited to 23.2% (i.e., 22% gain when compared to EGC with R-PET). This improvement in the elastic modulus could be attributed to the superior bonding of IR-PET and the EGC matrix.
Further, the GNPs tend to slightly improve the elastic modulus of EGC at a dosage of 0.25%, while a further increase in the dosage of GNPs is attributed to decreased elastic modulus. The reason could be the agglomeration of GNPs at higher dosages, which leads to weak microstructures in the geopolymer [62]. Three-dimensional response surfaces and contour diagrams for the elastic modulus response are given in Figure 20, which completely reflect the behavior of the IR-PET and GNPs in the elastic modulus development of EGC. Further, the ANOVA-based model [Equation (6)] was derived to predict the elastic modulus ( E in GPa) of the EGC with IR-PET and GNPs.
E = 13.6 0.1364 x 1 + 11.99 x 2 + 0.1096   x 1 x 2 + 0.000245 x 1 2 29.38 x 2 2

3.4. Flexural Properties:

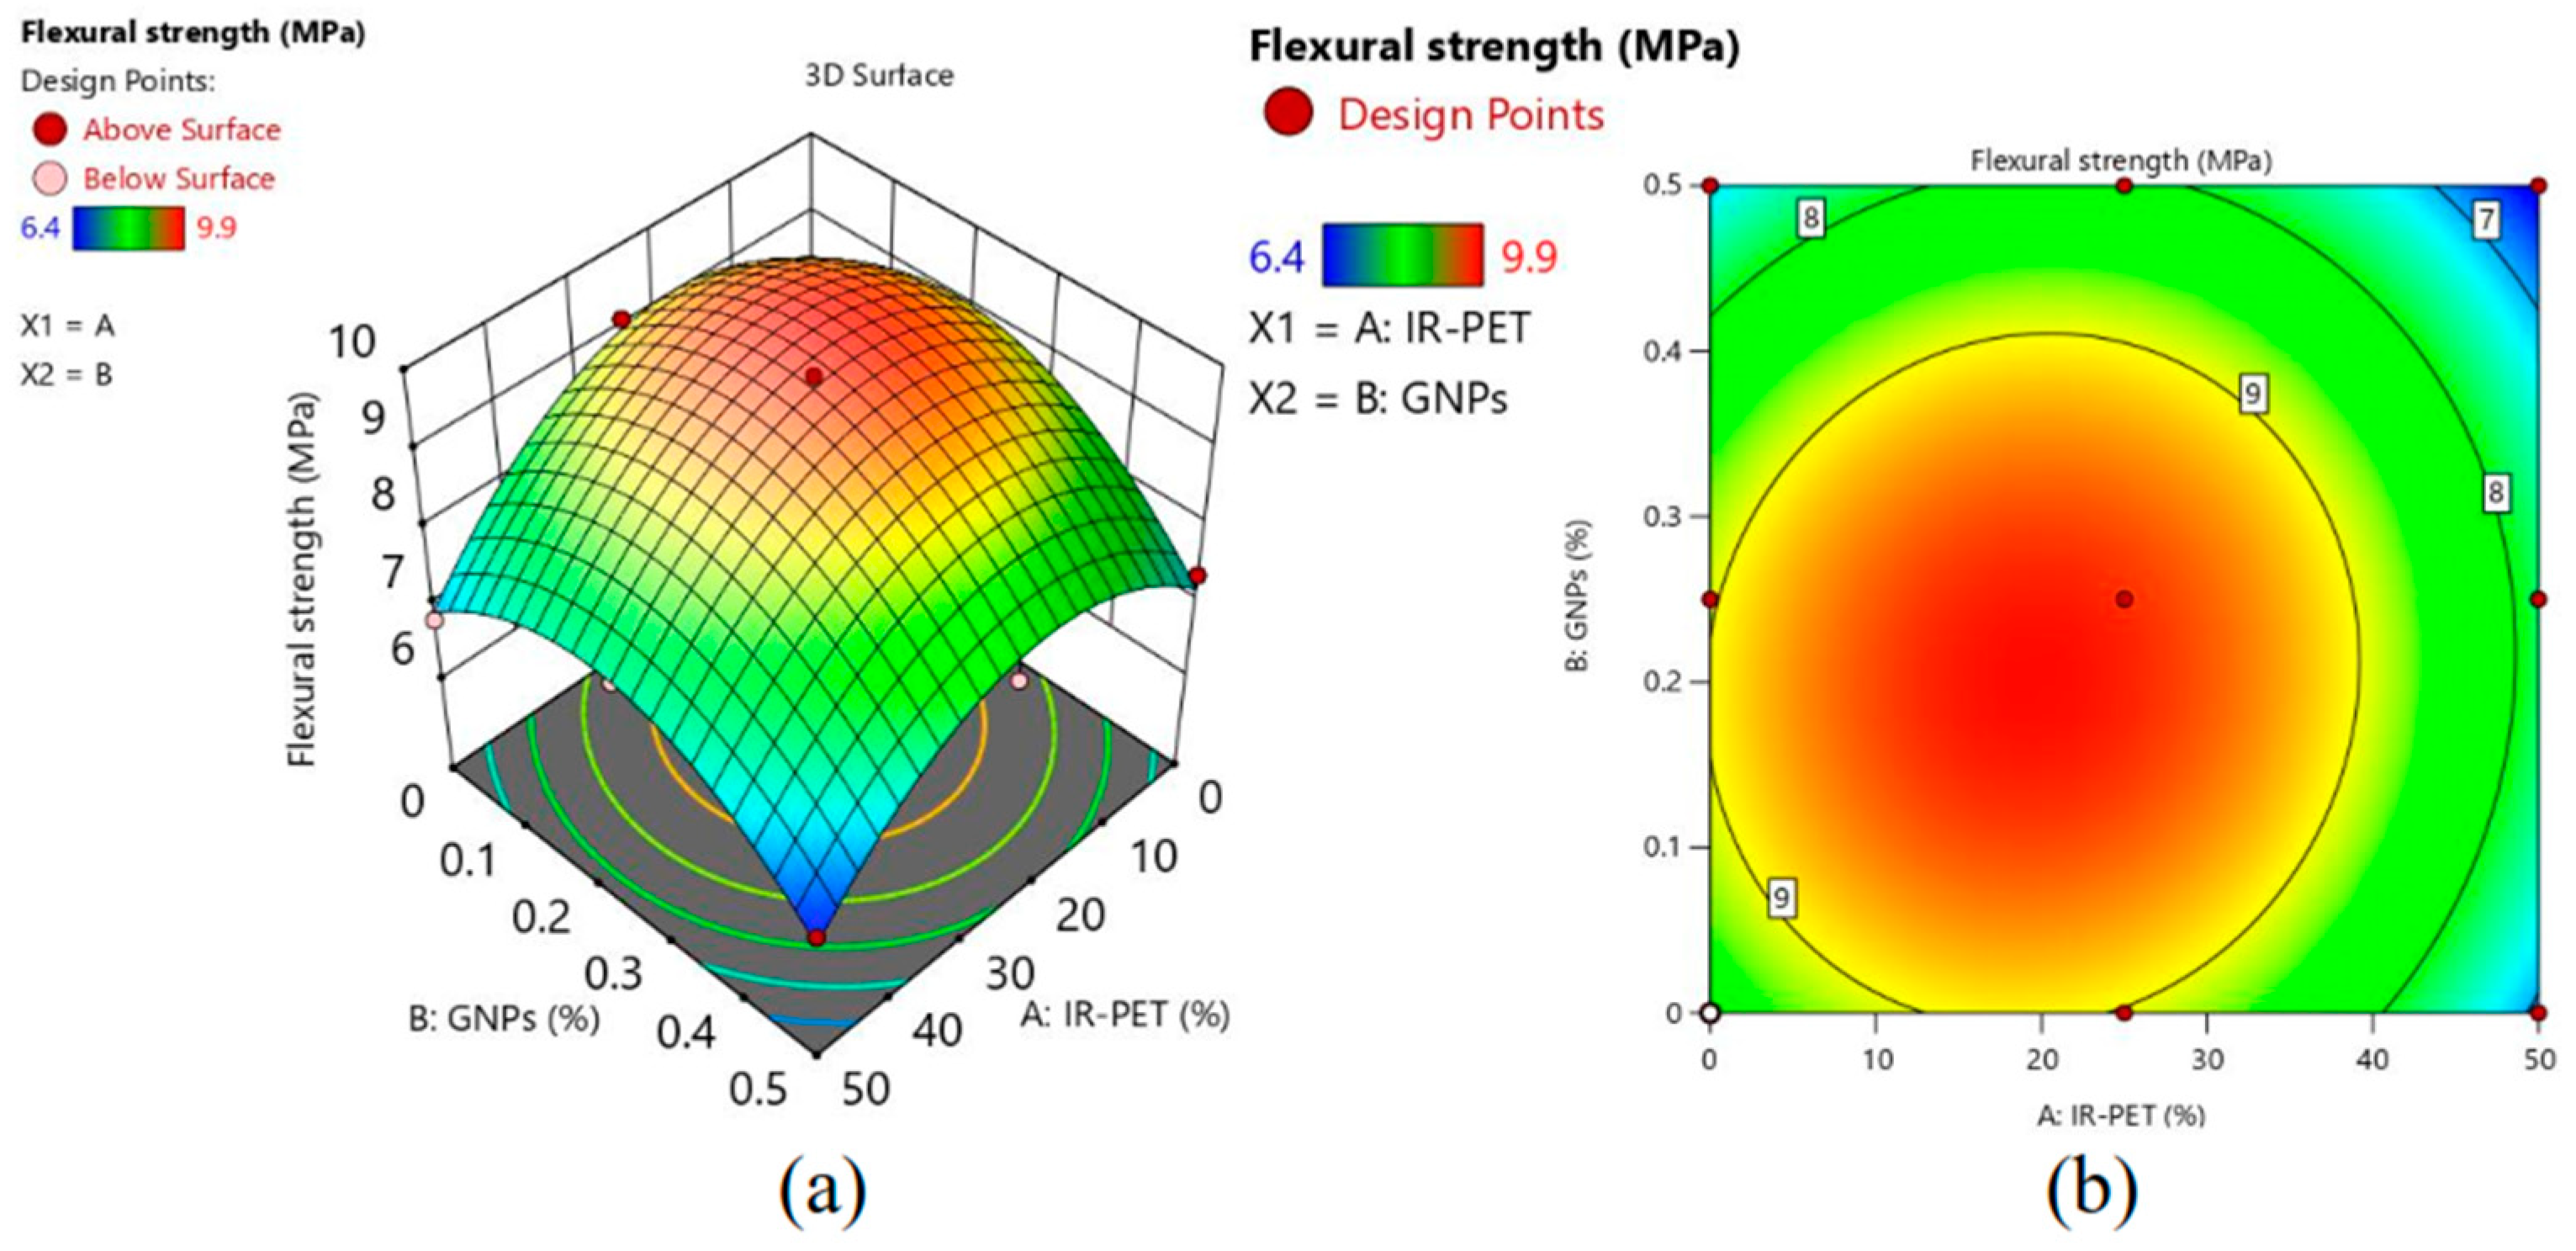
3.4.1. First-Crack Strength and Flexural Strength of EGC

In this research, the first crack (FCS) and flexural strength (FS) were determined using the load versus deflection curve, and the results are given in Figure 21, Figure 22 and Figure 23. When 25% of sand was replaced with R-PET, the first-crack strength and flexural strength were negligibly changed; however, the introduction of IR-PET positively impacted both properties. The FCS surged by 3.6%, and the FS was increased to the level of 9.63%. This behavior of improved strength was attributed to the enhanced IR-PET and EGC matrix bonding. Further, the synergic influence of IR-PET and GnP on the FRC and FS shows a variable trend. The addition of the GnP at the dosage of 0.25% tends to increase the FCS and FS; the reason could be that the GnP contributes to making extra N-A-S-H (C-S-H phase that incorporates additional elements, such as sodium and aluminum) gel, while the reaction with Al and Si are present in fly ash [42], and further additions of GnPs show a negative influence on the FCS and FS. This could have ensued due to the agglomeration of the GnP at a 0.5% dosage level (Figure 18). Significantly, Iqbal et al. [42] observed similar instances of GnP agglomeration at elevated GnP dosages in the geopolymer. Additionally, the current study modeled the FCS and FS [in MPa, Equations (7) and (8), respectively] using ANONA-driven analysis.
FCS = 7.526 + 0.02077 x 1 + 3.81 x 2 0.0108   x 1   x 2 0.000739 x 1 2 8.9866 x 2 2
FS = 8.326 + 0.08007 x 1 + 7.35 x 2 + 0.0216   x 1   x 2 0.00217 x 1 2 19.307 x 2 2

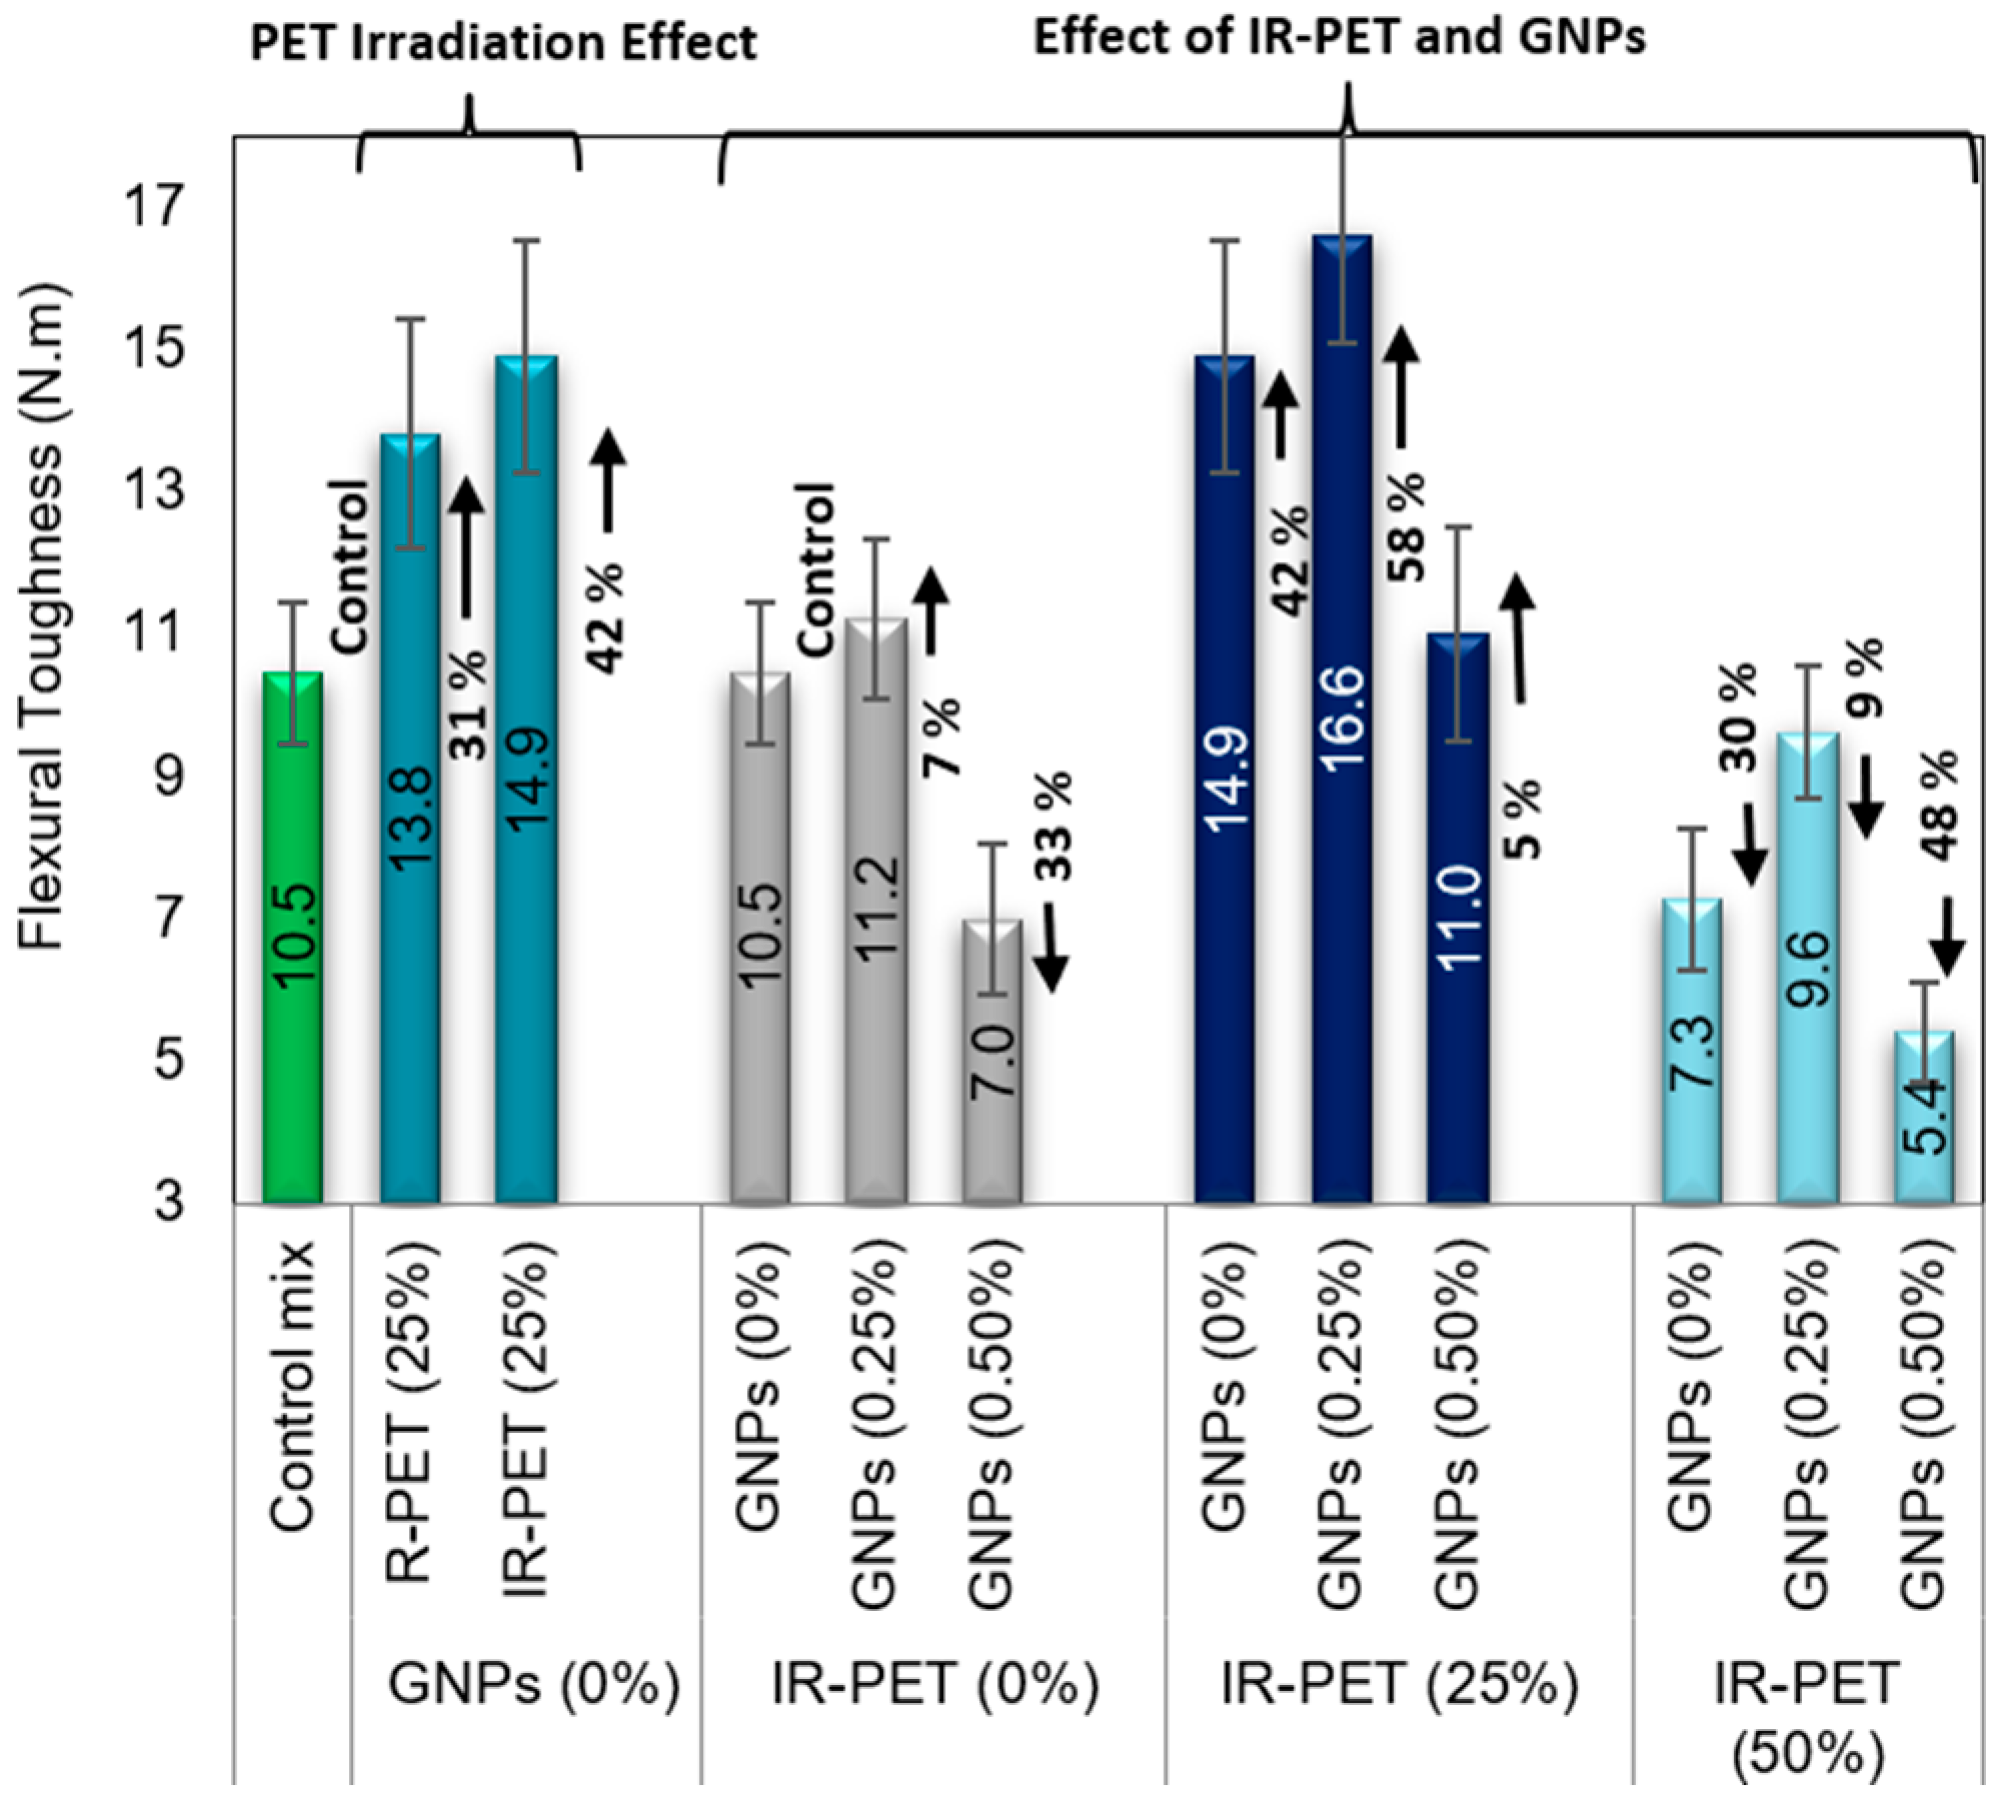
3.4.2. Flexural Toughness

The quantitative measurement of energy absorbed by the beam is denoted as flexural toughness (FT), serving as a pivotal indicator of the overall flexural performance of the material. It is calculated as the area beneath the load-deflection curve [63]. As illustrated in Figure 24, IR-PET demonstrates a propensity to enhance the FT of the EGC. Moreover, the interaction between GNPs and IR-PET in influencing the FT of the EGC represents a profoundly complicated phenomenon. To obtain a comprehensive understanding of the impact of these variables on EGC’s FT, an ANOVA formula, as depicted in Equation (9), has been formulated. Additionally, 3D response surface and contour diagrams have been constructed to elucidate the effect of GNPs and IR-PET on EGC’s flexural toughness, as presented in Figure 25.
FT = 10.439 + 0.3956 x 1 + 17.333 x 2 + 0.064   x 1   x 2 0.00908 x 1 2 50.133 x 2 2  

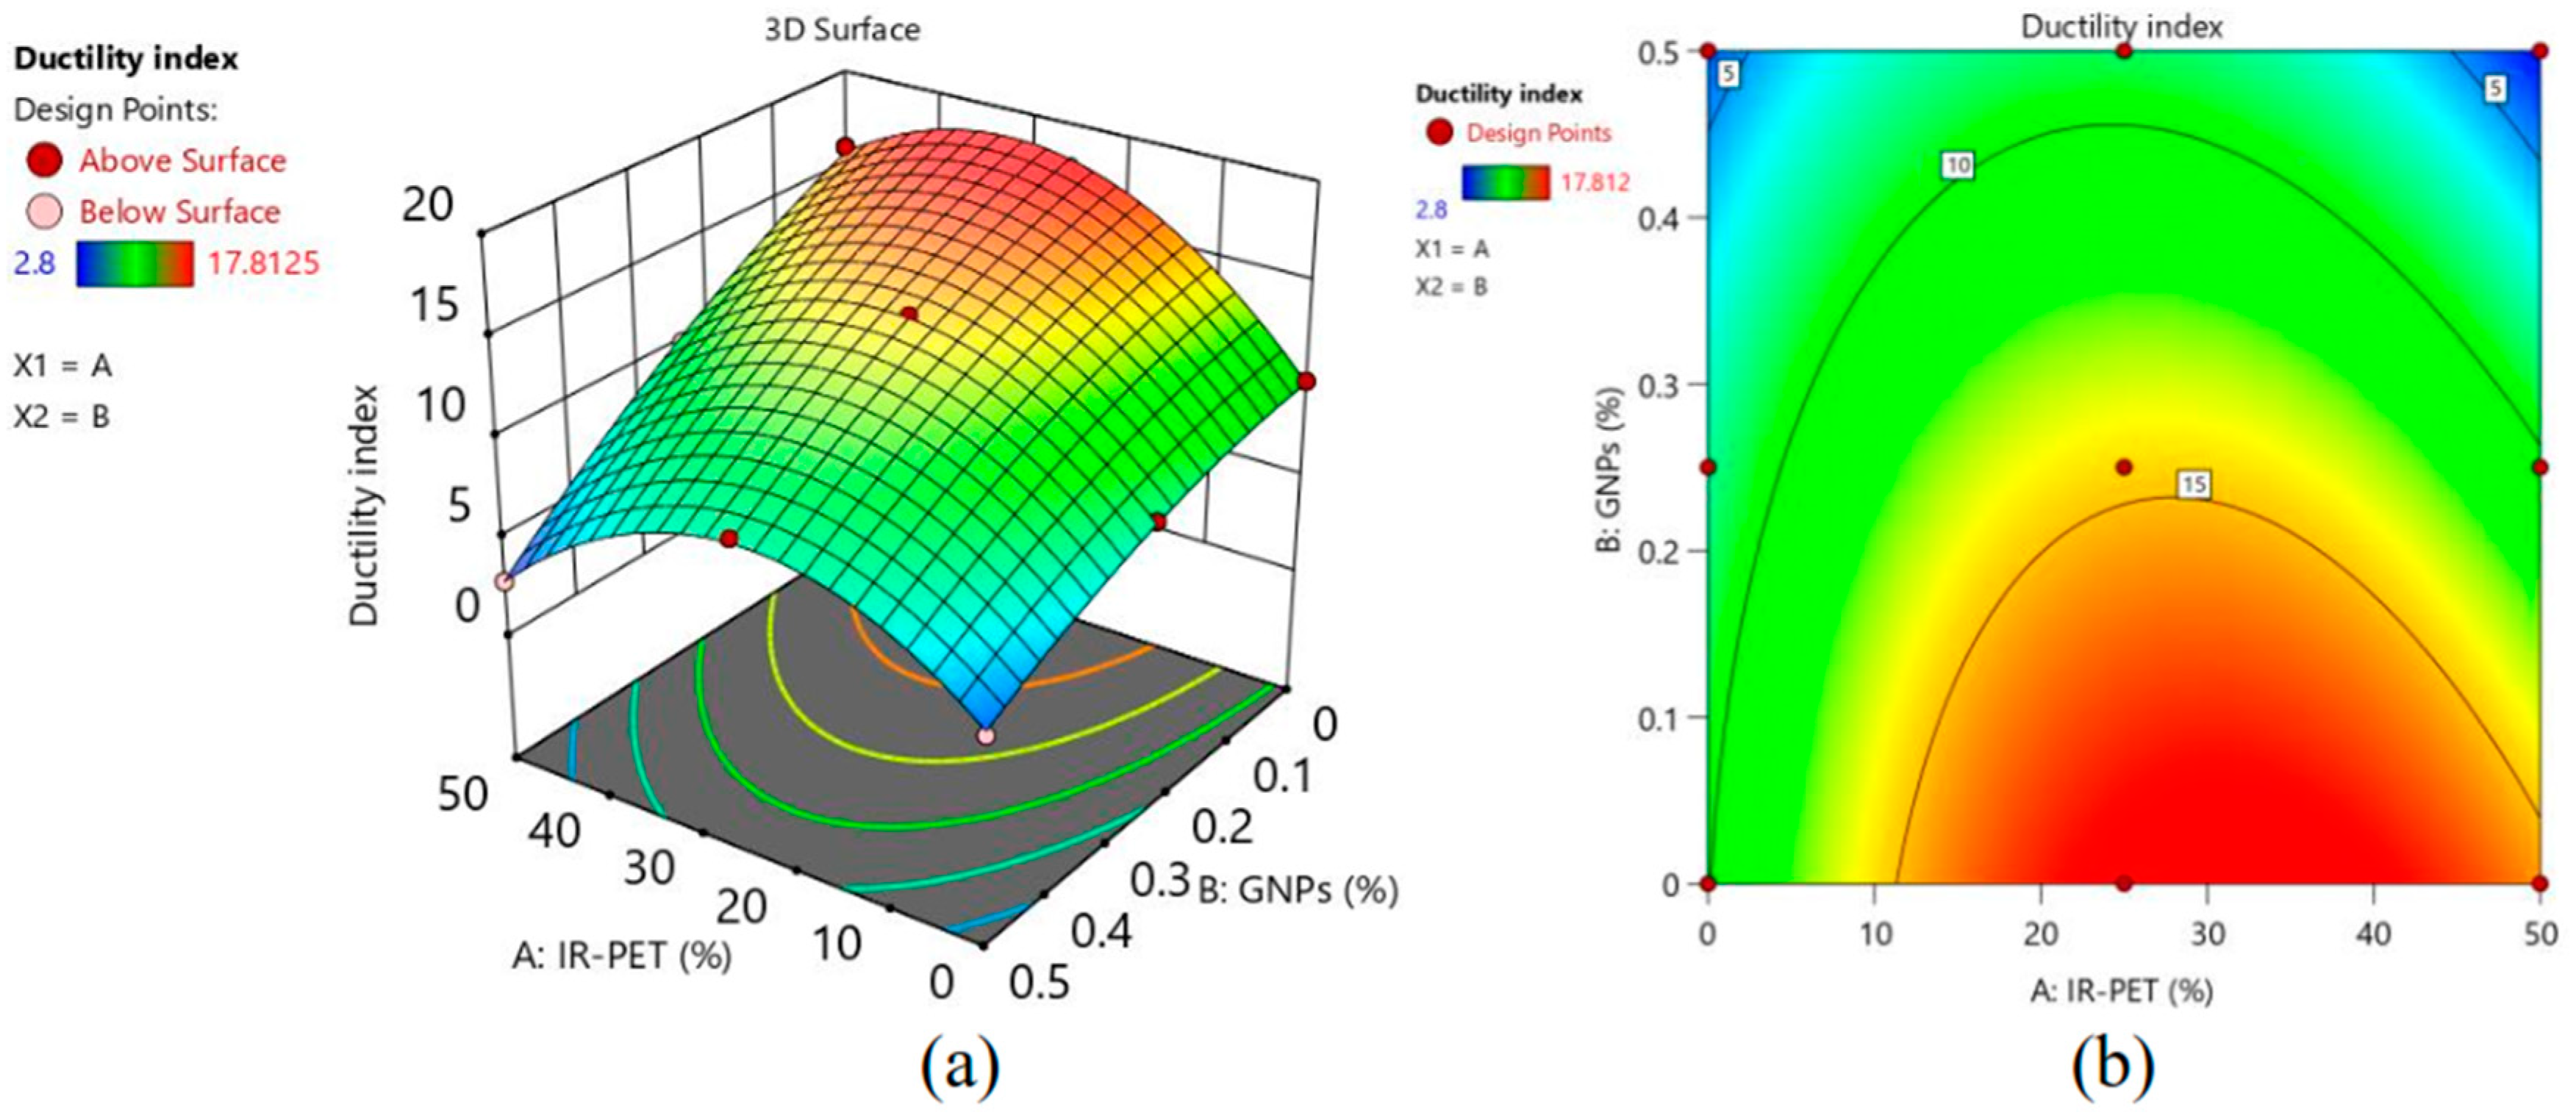
3.4.3. Ductility Index

The ductility of a material is defined as its ability to deform plastically without exhibiting brittle behavior, and hence, it provides information about the post-cracking response of the material. The method used to obtain the ductility index is as outlined by Zahid et al. [50], who proposed the ratio of deflection at peak load to first-crack deflection as the ductility index. Ductility plays a critical role in the integrity and resilience of the structural material during service load conditions. In Figure 26, the ductility index of PET-modified EGC surged by 26% and 78% for EGC having regular and gamma-irradiated waste PET at a dosage of 25%, respectively. Micro-particles of PET could reduce the chemical bonding of fiber with the matrix and give frictional debonding of the fibers leaving improved load-carrying capacity of the fiber by utilizing maximum load-carrying capacity before rupture. Therefore, this could be the reason for higher ductility by adding 25% PET to the EGC. This effect of frictional debonding was enhanced in EGC modified with gamma-irradiated PET due to its rough surface and higher crystalline structure as rationalized earlier. However, adding graphene to EGC could have a detrimental effect on the ductility index. The reason could be the increased fracture toughness of the matrix, which caused the matrix to start cracking at higher first-crack strength conditions where the load-carrying capacity by the fibers was compromised; therefore, the composite exhibits lower ductility properties by adding graphene. Furthermore, at higher dosage levels of graphene, i.e., at 0.5%, the agglomeration of graphene caused the weak fiber–matrix interface; therefore, the fiber could not utilize its maximum capacity in talking the increasing level of loading, causing a much lower ductility index. However, the proper understanding of the ductility index by varying IR-PET and GNPs can be obtained using the following ANOVA Equation (7). Zahid et al. [50] also accurately utilized the ANOVA equation to predict the ductility index of EGC. Furthermore, 3D response surface and contour diagrams are given in Figure 27 to understand the behavior of EGC to the above-mentioned variables.
The ductility of a material refers to its capacity to deform plastically without exhibiting brittle behavior, thus providing insights into the material’s post-cracking response. Ductility plays a pivotal role in ensuring the integrity and resilience of structural materials under service load conditions. In this concern, Zahid et al. [50] outlined the method for determining the ductility index, proposing the ratio of deflection at peak load to first-crack deflection as the measure. This approach was used to assess the ductility in this study. In Figure 26, it is observed that the ductility index of PET-modified EGC experiences a surge of 26% and 78% for EGC with R-PET and IR-PET at a 25% dosage, respectively. The presence of micro-particles of PET may diminish the chemical bonding between fibers and the matrix, leading to frictional debonding of the fibers and consequently enhancing the load-carrying capacity of the fibers before rupture. This likely accounts for the increased ductility when 25% PET is added to the EGC. Furthermore, in EGC modified with gamma-irradiated PET, the effect of frictional debonding is amplified due to the rough surface and higher crystalline structure of PET, as previously rationalized. However, the addition of graphene to EGC may have a detrimental effect on the ductility index. This could be attributed to the increased fracture toughness of the matrix, causing it to begin cracking under higher first-crack strength conditions, compromising the load-carrying capacity of the fibers and resulting in lower ductility properties. Additionally, at higher dosages of graphene, such as 0.5%, graphene agglomeration weakens the fiber–matrix interface, limiting the fiber’s ability to withstand increasing loads and resulting in a significantly reduced ductility index. Understanding the ductility index (DI) variations by varying IR-PET and GNPs can be facilitated by utilizing the ANOVA in Equation (10). Zahid et al. [50] effectively employed this equation to predict the ductility index of EGC. Furthermore, Figure 27 presents 3D response surface and contour diagrams to elucidate EGC behavior concerning the aforementioned variables.
D I = 9.917 + 0.54639 x 1 2.99464 x 2 0.28133   x 1 x 2 0.008614 x 1 2 17.46499 x 2 2

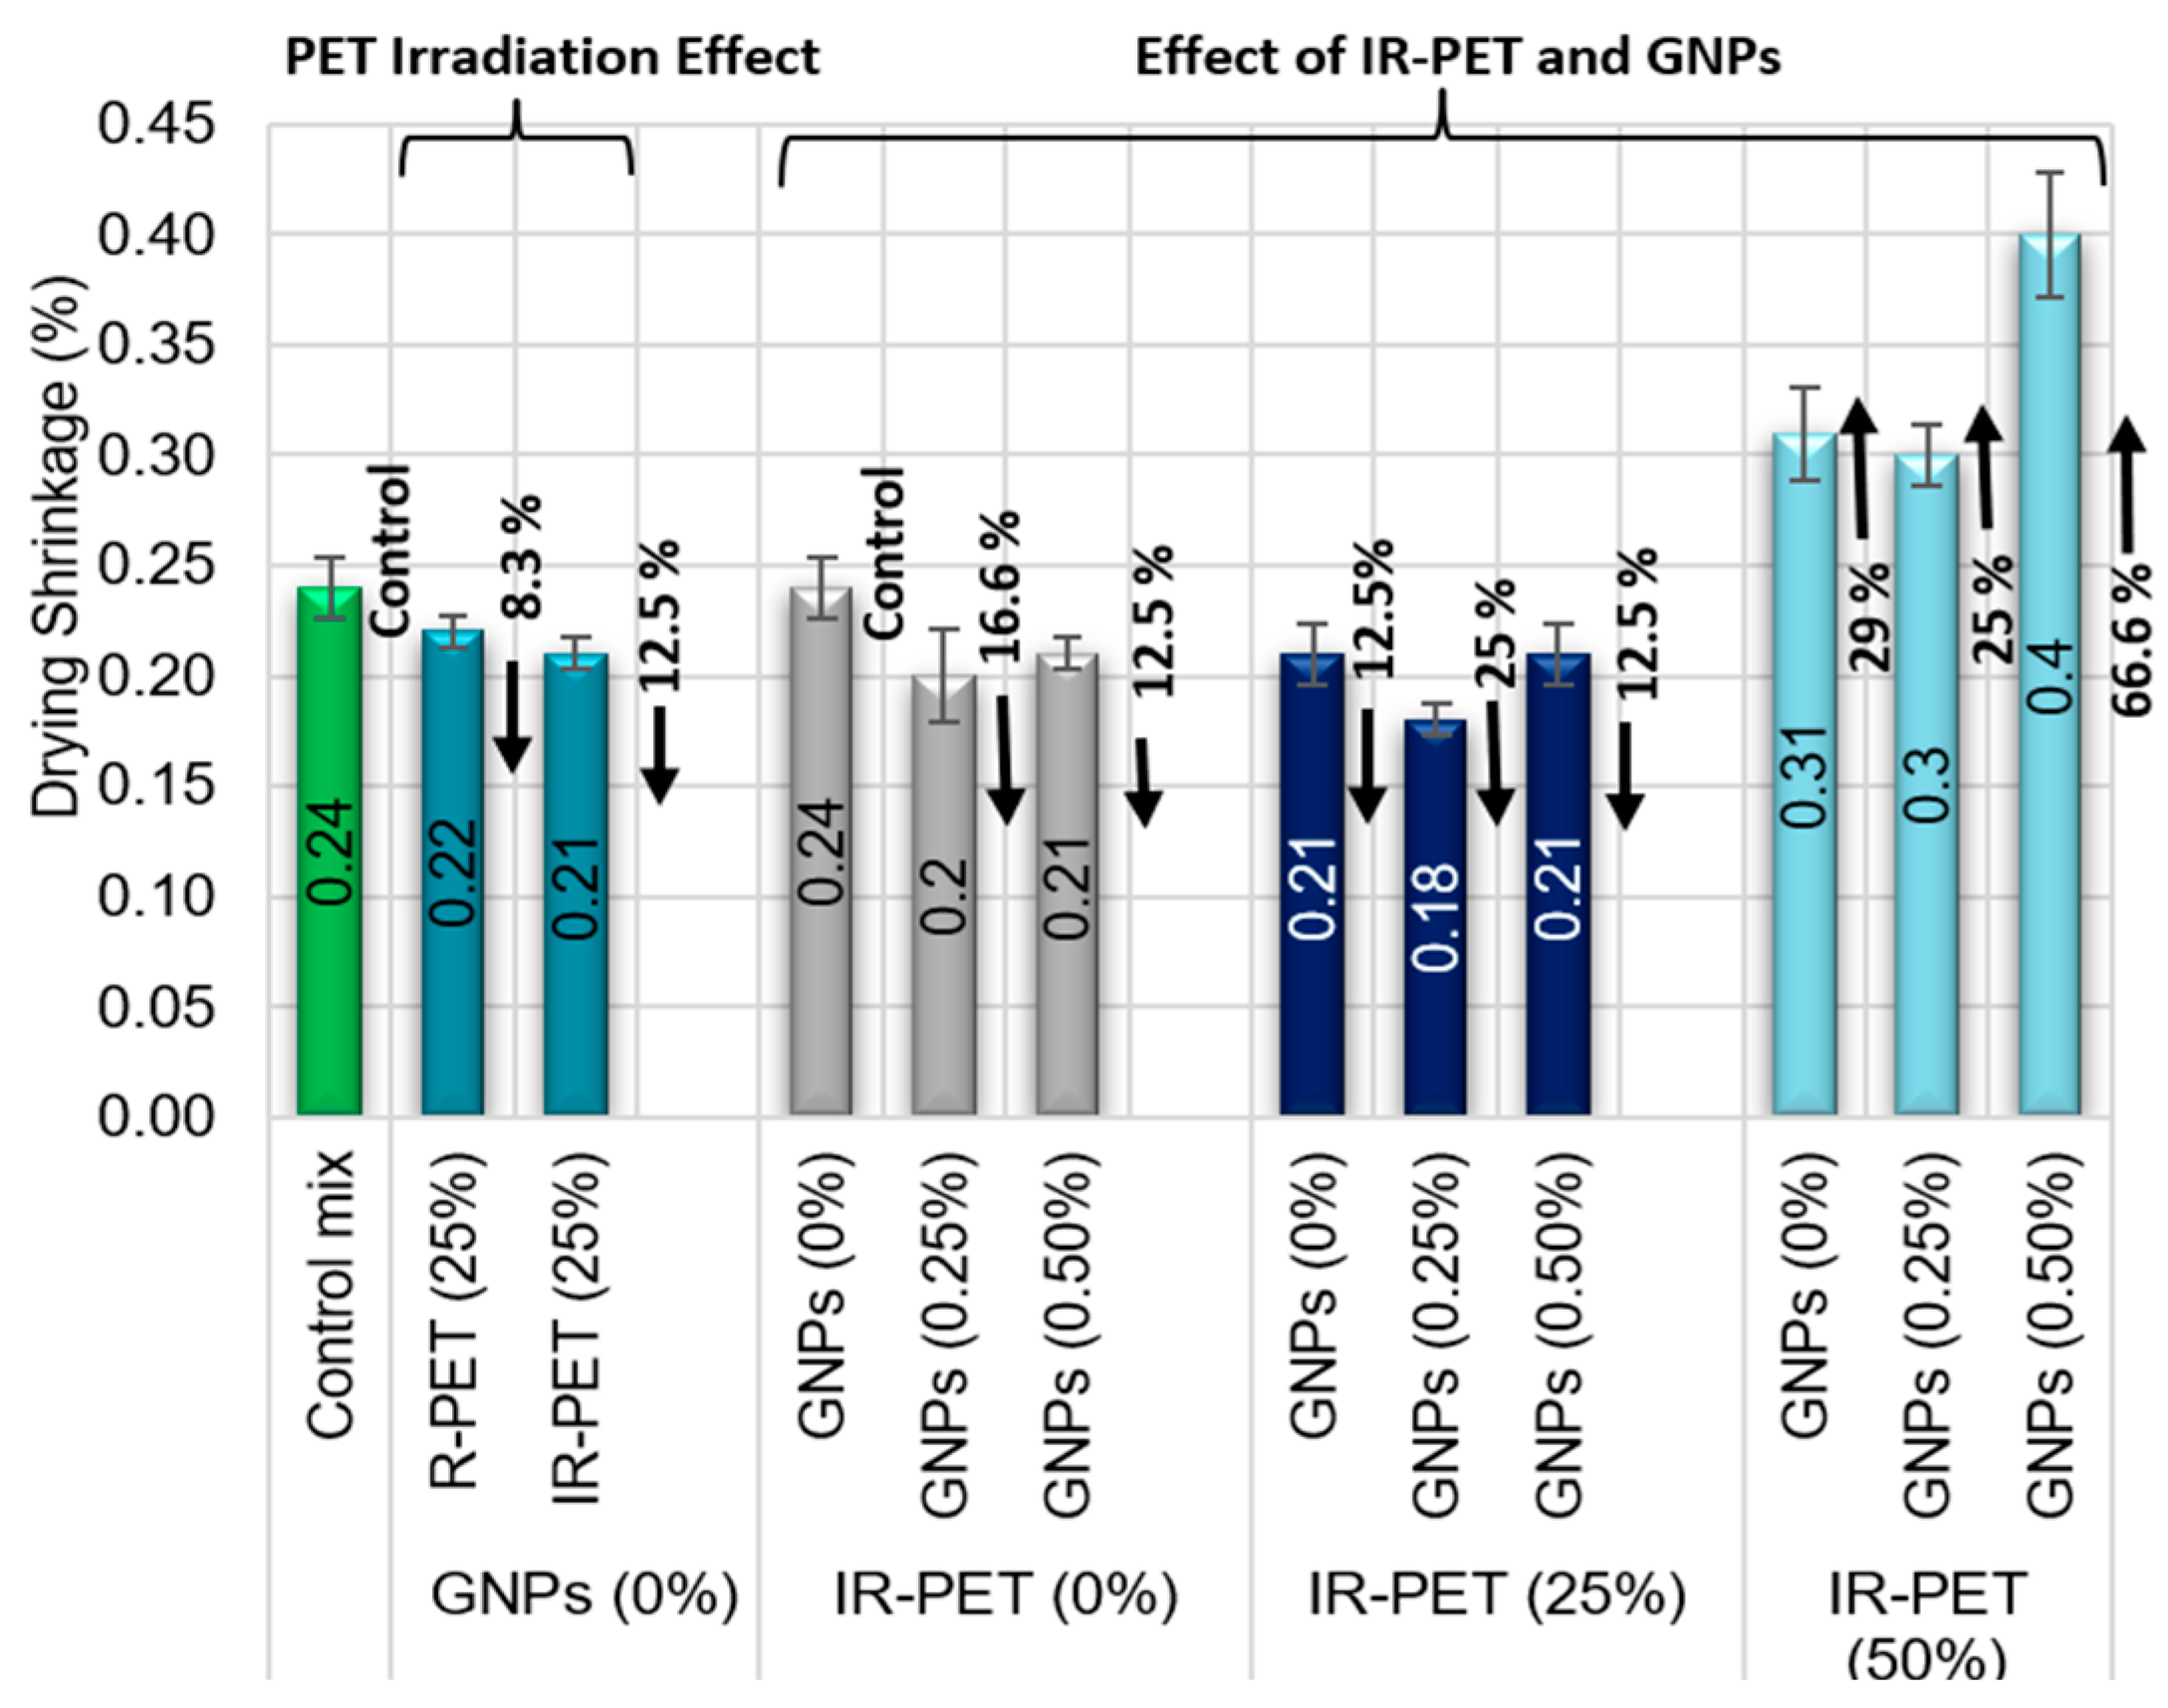
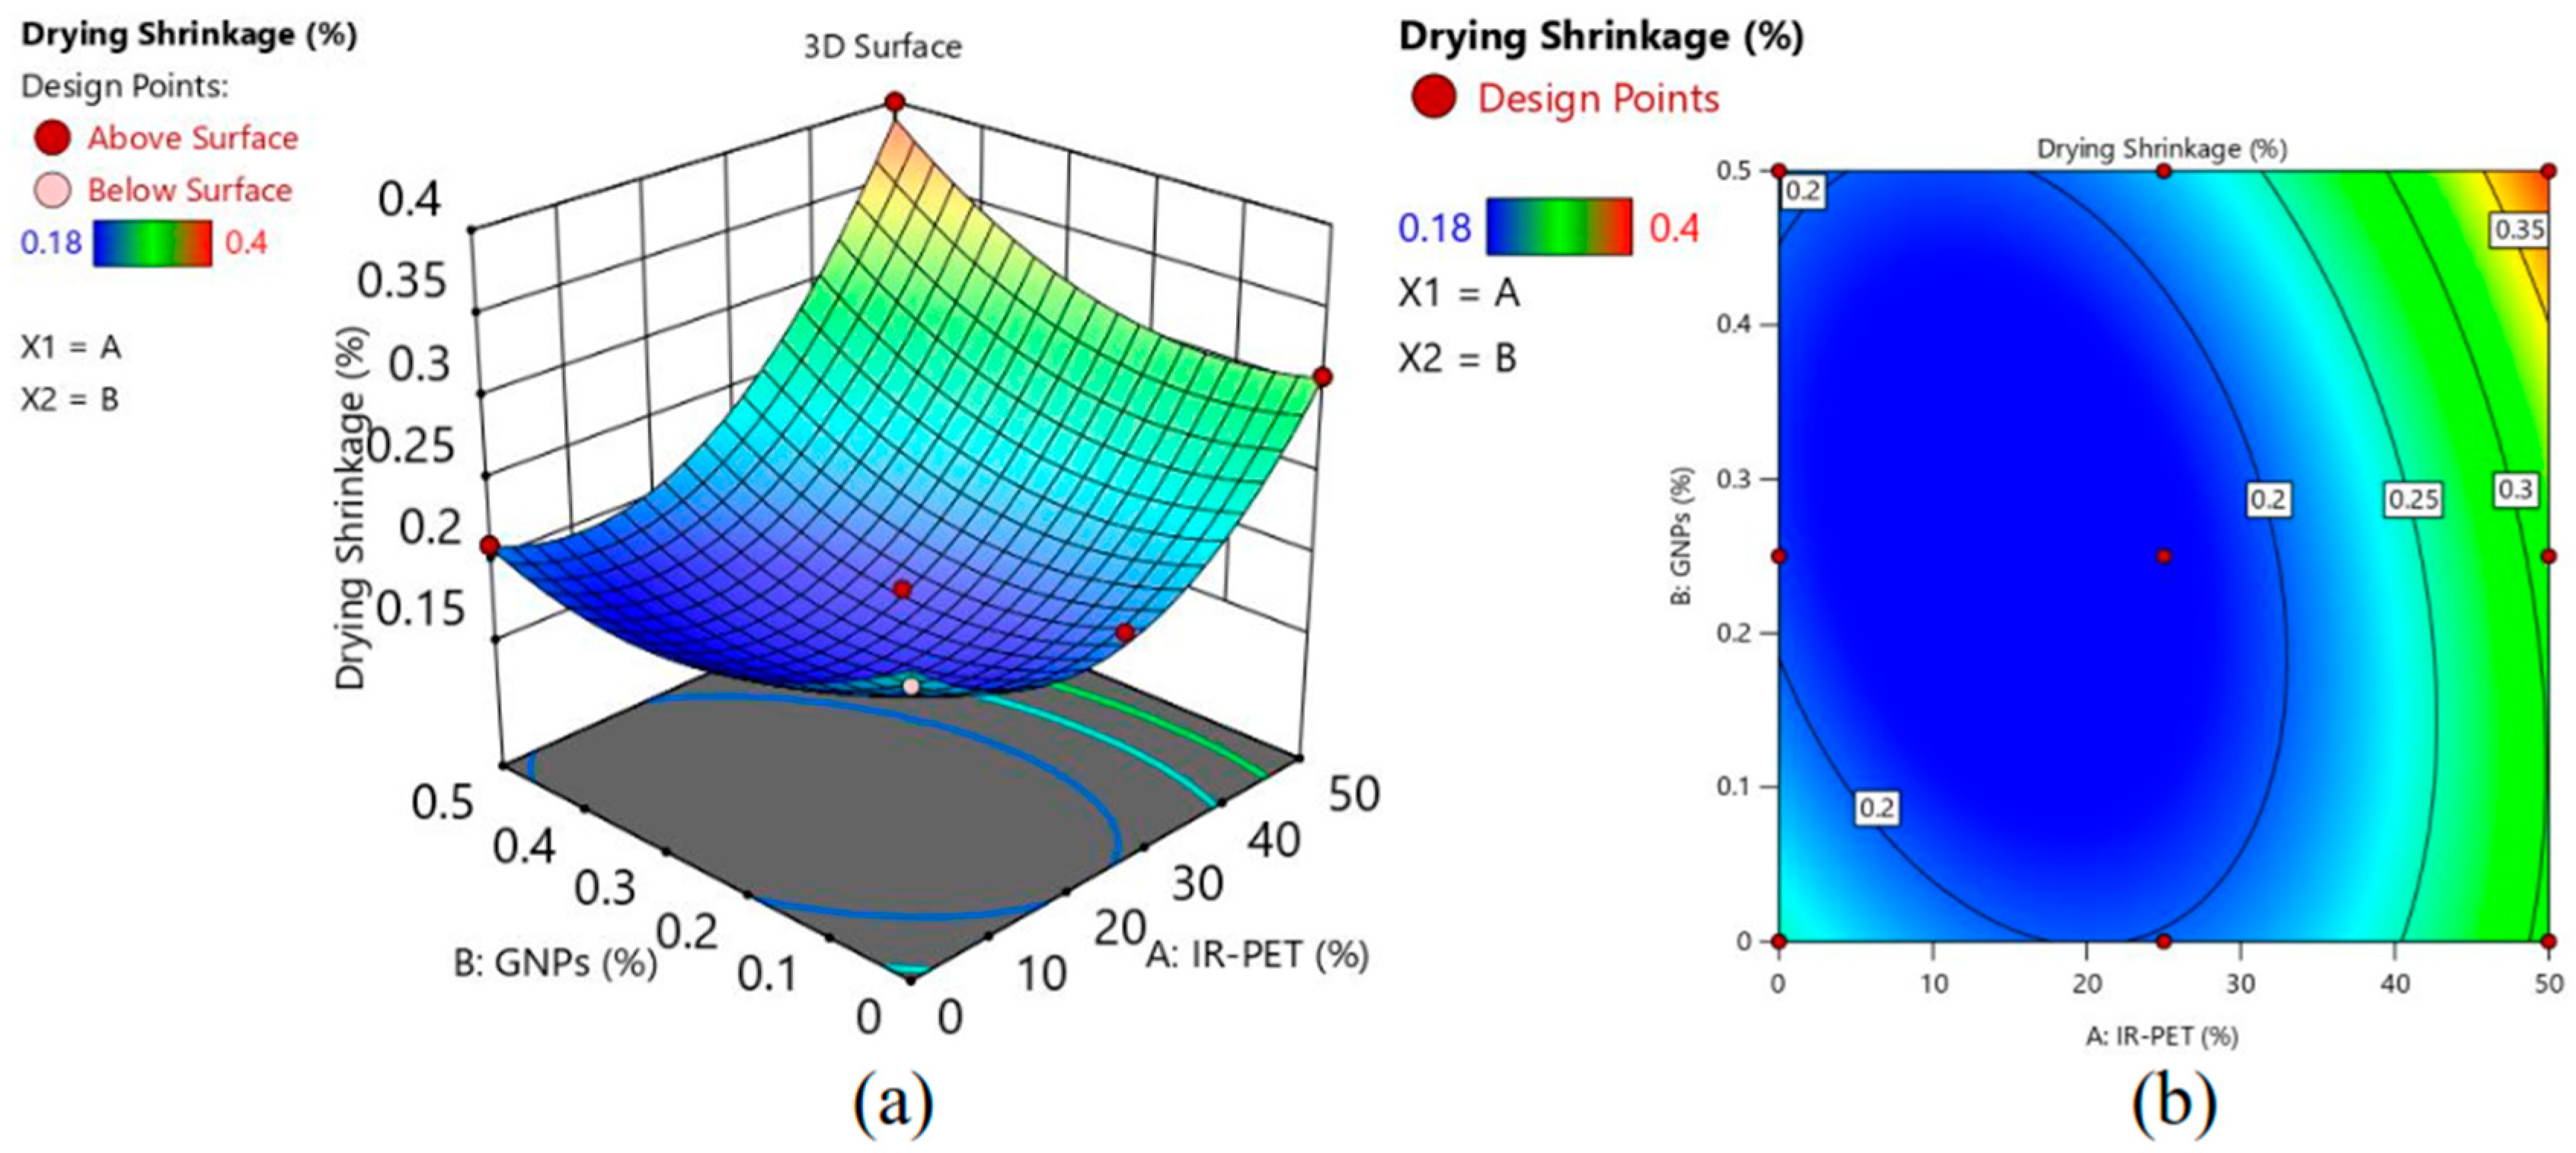
3.5. Drying Shrinkage

During the curing process of EGC, drying shrinkage occurs as water evaporates from the matrix. This phenomenon is integral to the behavior of geopolymers and can have a significant impact on the properties and usability of EGC [64,65]. As water evaporates from the material, voids and pores are left empty, leading to a reduction in the total volume of the EGC. As depicted in Figure 28, the inclusion of PET resulted in decreased drying shrinkage (8.3% for R-PET and 12.5% for IR-PET), likely due to a crack-bridging mechanism. The more pronounced reduction in drying shrinkage observed for IR-PET can be attributed to enhanced frictional bonding facilitated by its rough surface. Furthermore, the synergistic effect of IR-PET and GNPs on drying shrinkage (DS, %) in EGC is apparent in Figure 29 and can be further elucidated using Equation (11).
DS = 0.24889 0.00493 x 1 0.37333 x 2 + 0.0048   x 1 x 2 + 0.000123 x 1 2 + 0.58667 x 2 2

3.6. Multi-Objective Optimization

3.6.1. Methodology and Findings

Simultaneously optimizing multiple responses poses several challenges in attaining optimal values for each response. Therefore, the most viable approach to achieving results that align with all conditions is through multi-objective optimization. This entails identifying the best possible responses by employing multi-objective optimization techniques, followed by the development and validation of ANOVA models for all responses. The global desirability function utilized for RSM optimization is delineated in Equation (12) [66].
D = d 1 r 1 d 2 r 2 d 3 r 3 d n r n 1 r i = [ i = 1 n d i r i ] 1 r i  
where n denotes the number of dependent variables and independent variables. The research simultaneously optimizes two independent variables (GNPs and IR-PET) and seven responses (slump value, compressive strength, elastic modulus, flexural strength, flexural toughness, ductility index, and drying shrinkage). The importance of each factor lies between 1 and 5, with 1 being the least important and 5 being the most important. The variable of the desirability function takes a value from 0 to 1, and 1 indicates the desired outcome, while 0 emphasizes the non-desired outcome. The desirability value of the optimal solution is determined by the geometric mean value of all individual desirability. The research uses multi-objective optimization to obtain optimal solutions. The main aim is to minimize the use of GNPs as well as maximize the use of IR-PET.
Therefore, the goal set for GNPs was minimized, and IR-PET was set as maximized. Furthermore, some responses such as compressive strength, elastic modulus, and flexural strength were to be maximized, while other responses, like flexural toughness and the ductility index, were maximized. Table 9 defines the factors and responses with desired optimization goals. Here, the multi-objective optimization technique of RSM was applied to obtain an optimum solution that could satisfy the desired goals of all responses concurrently. After the selection of the optimal solution, a validation study was conducted. An optimal solution was obtained that satisfied the desired criteria (Table 10). Ramps of the optimized EGC mix and corresponding optimal responses are shown in Figure 29.

3.6.2. Experimental Validation

A validation experiment is used to check the accuracy of RSM models and the reliability of optimized conditions. Activities such as mixing, casting, curing, and testing of samples are related to those that are present in Section 2.3 and Section 2.4. The outcomes of the experiment were closely related to the predicted values with a difference of less than 5%. (Table 11). Figure 30 is added as evidence of the ultraductile nature of optimized EGC after failure.

4. Conclusions

This study endeavors to optimize the utilization of waste PET in EGC applications. It explores the impact of gamma-irradiation on waste PET to enhance EGC performance and employs robust RSM for thorough modeling and optimization of the combined influence of gamma-irradiated PET and GiPs on EGC properties. The experimental findings yield the following conclusions.
(1)
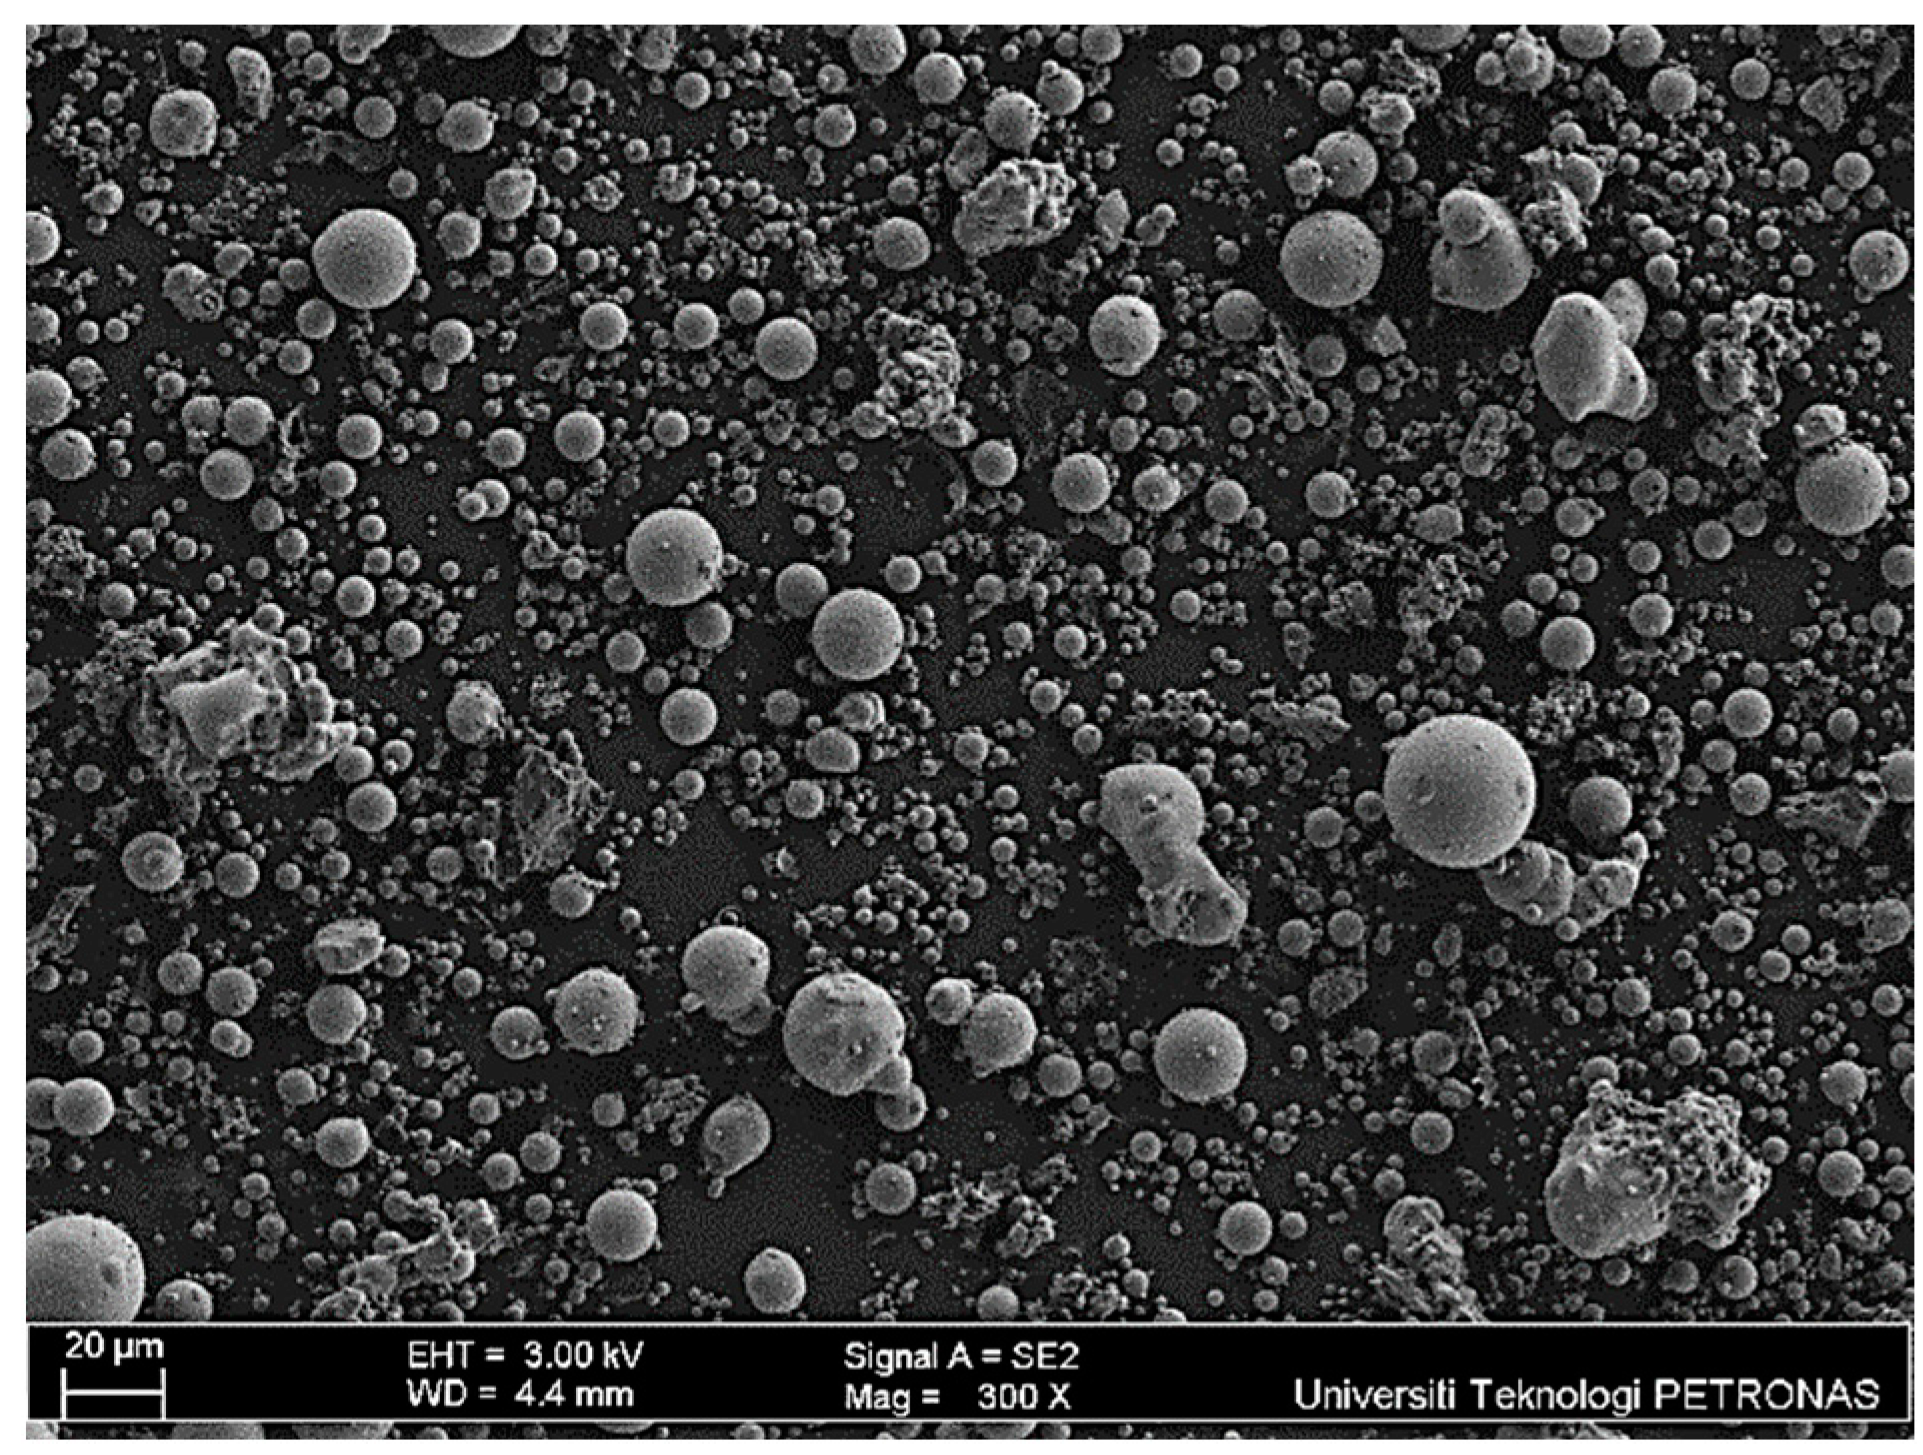
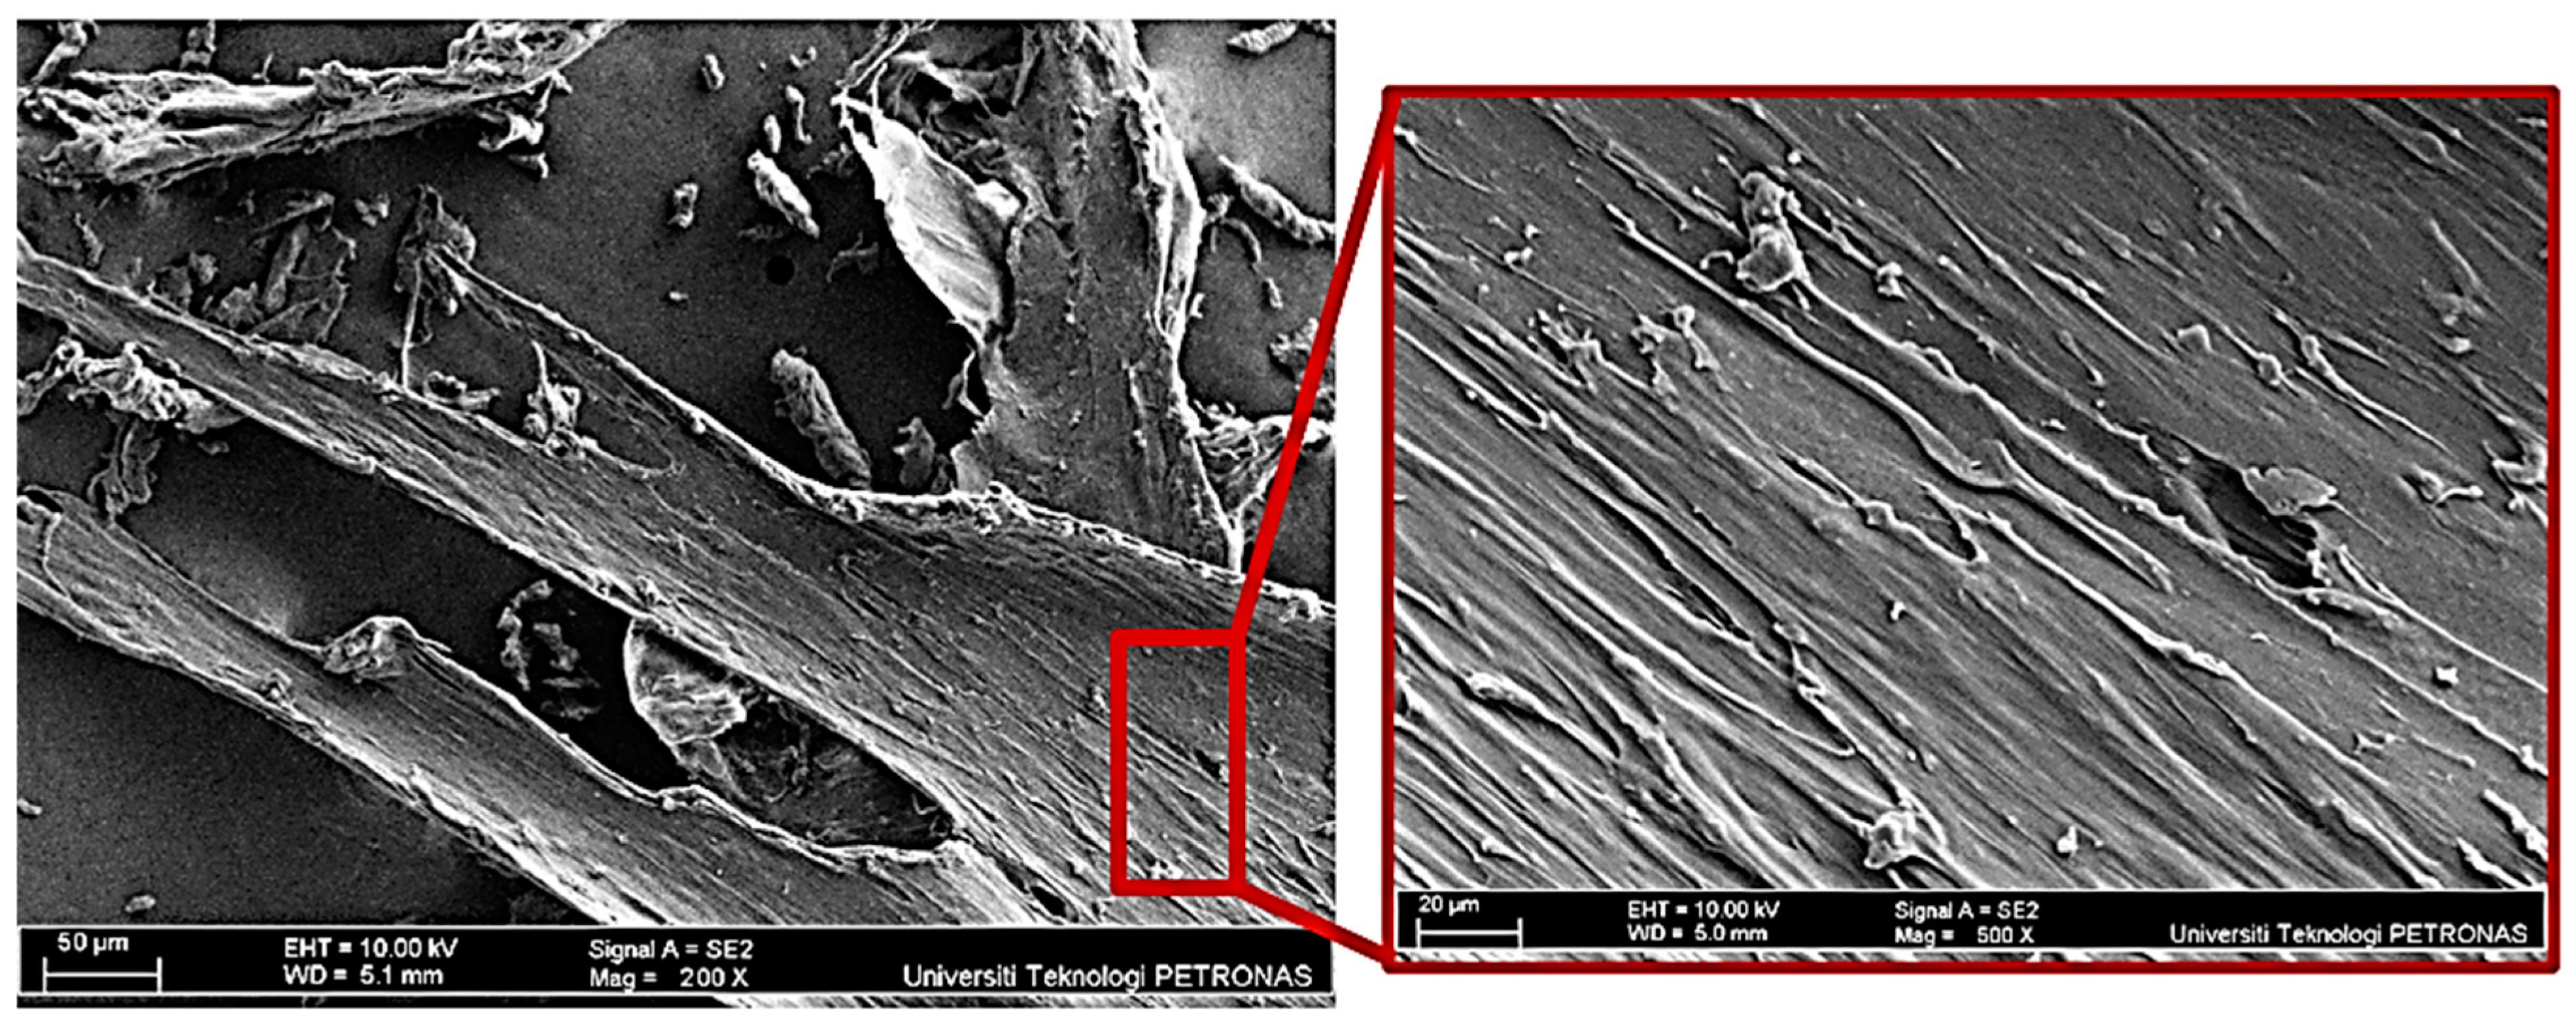
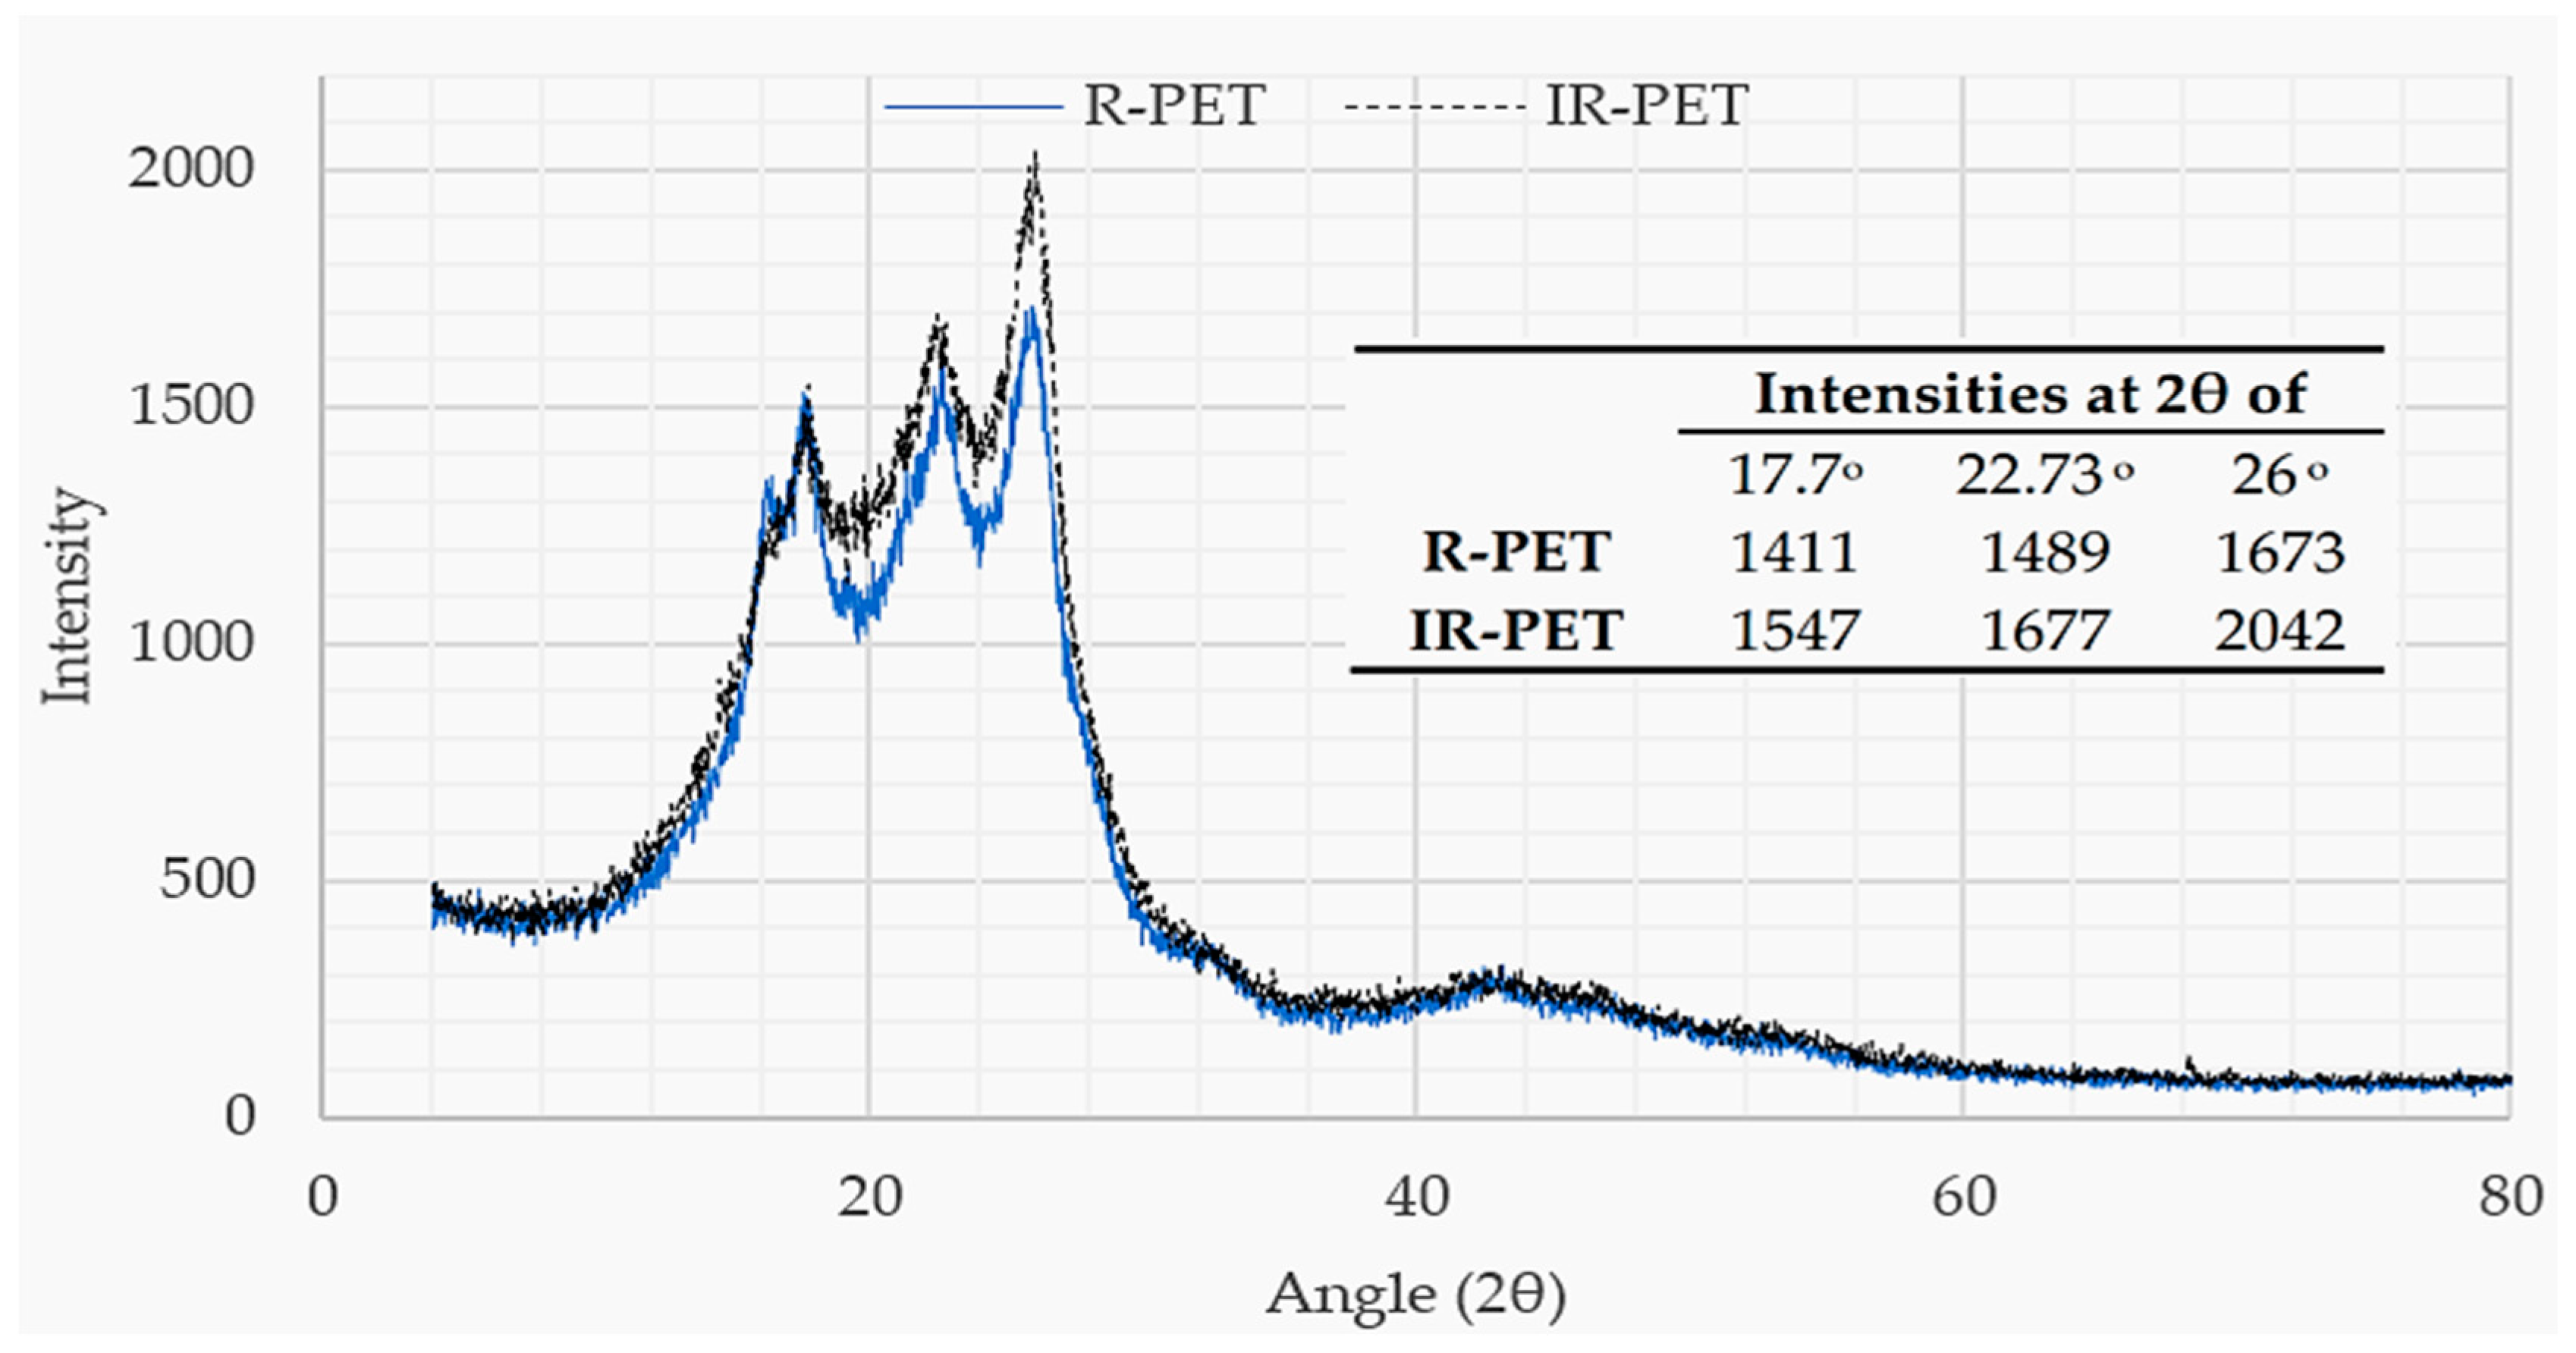
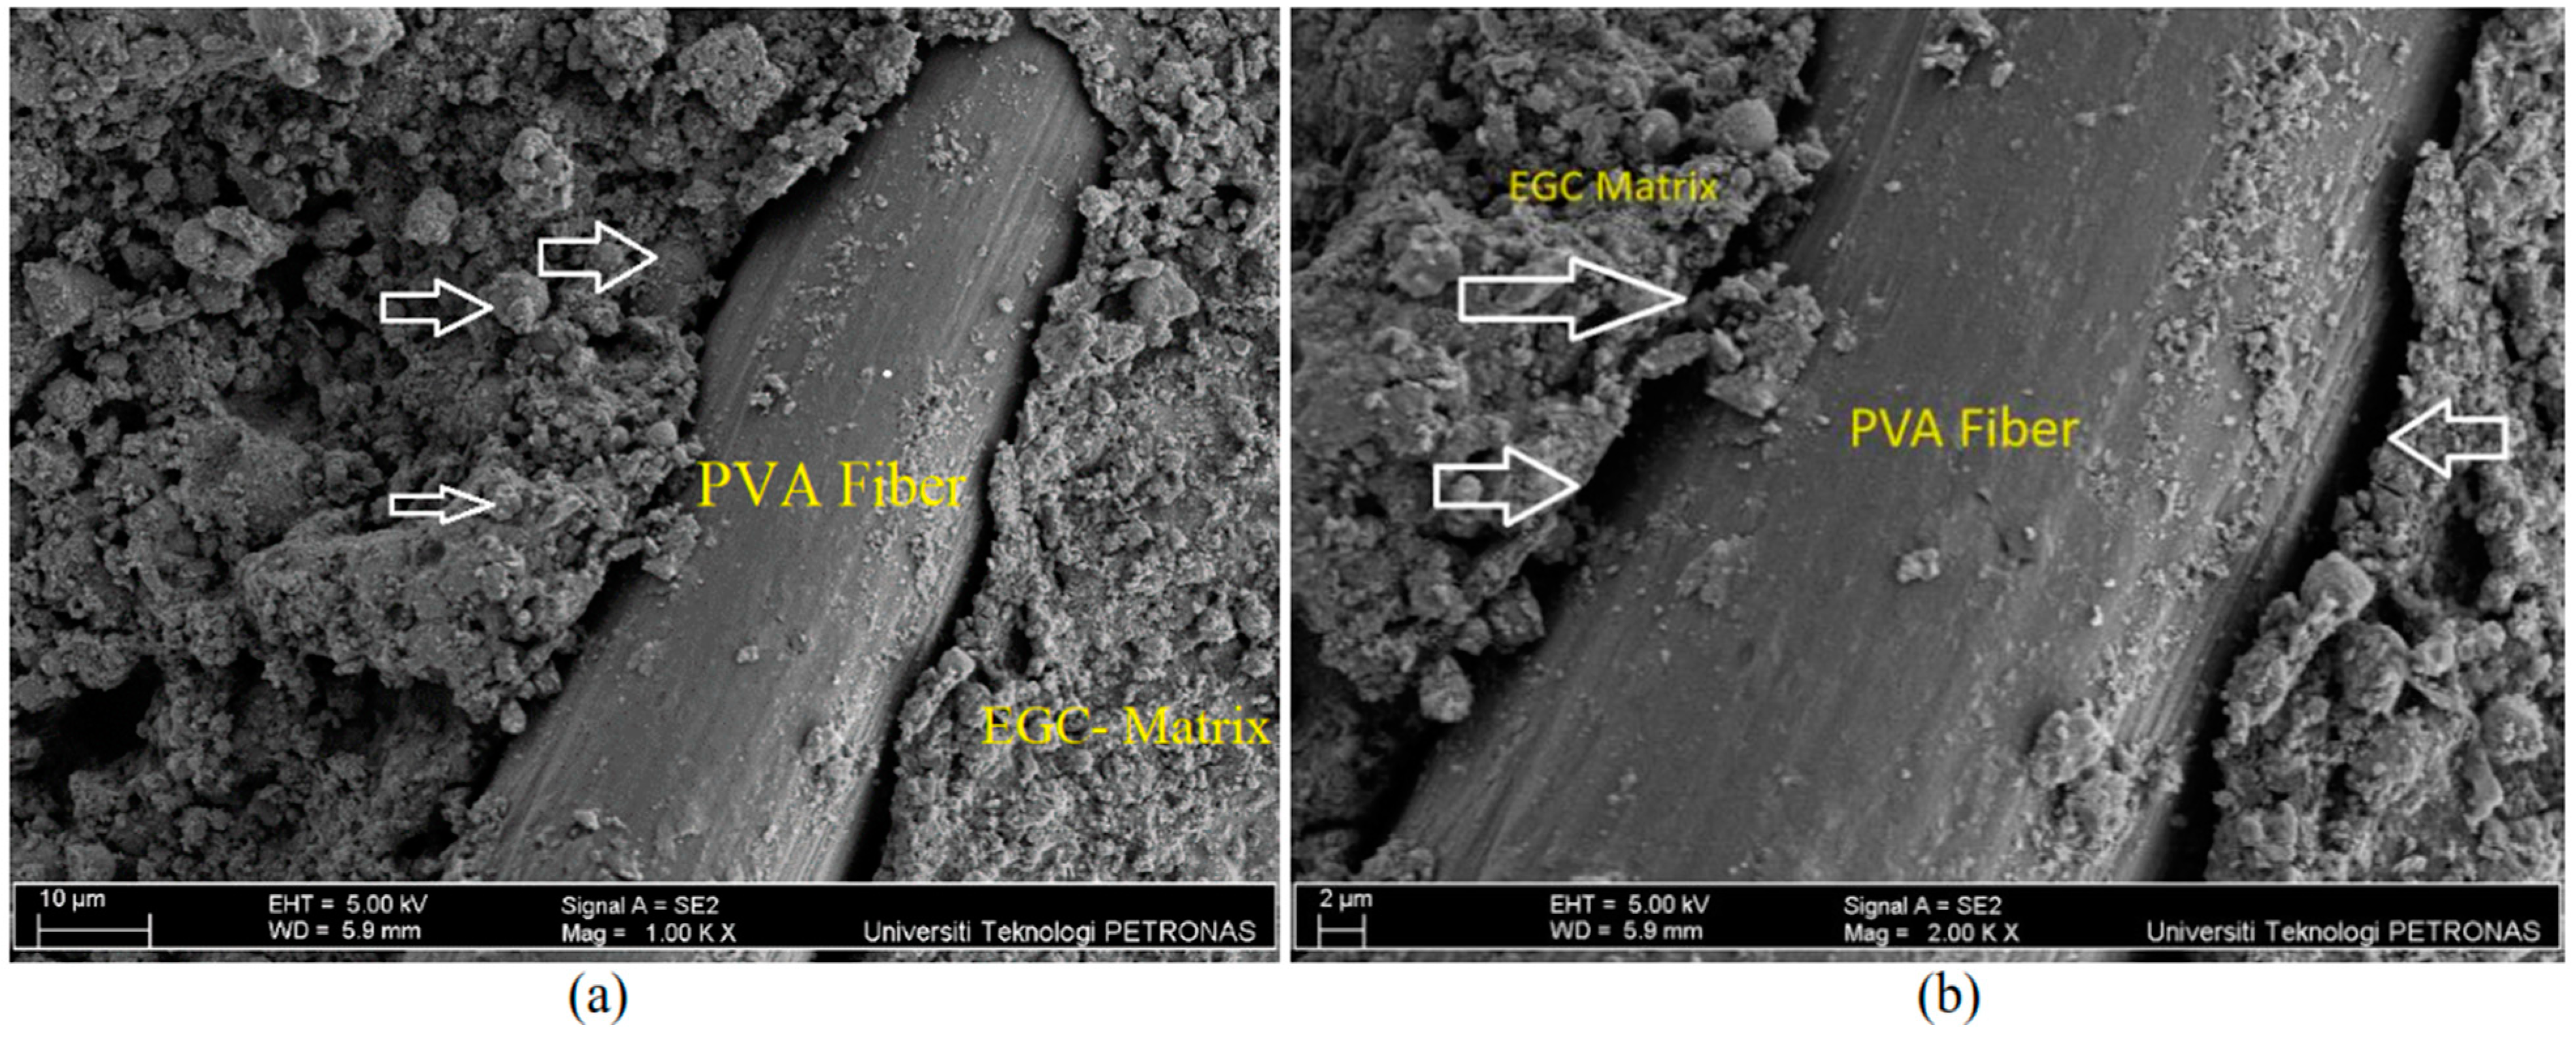
Gamma radiation at 100 kGy fragment PET particles, increasing their crystallinity and enhancing the mechanical properties of EGC. This improvement is confirmed by FESEM imaging and X-ray diffraction analysis.
(2)
Using irradiated PET (IR-PET) reduces slump flow compared to untreated PET (R-PET). IR-PET restores compressive strength lost due to the smooth surface of R-PET, owing to its rough surface that improves bonding with the geopolymer matrix.
(3)
The addition of PET increases the ductility index significantly, with irradiated PET showing even greater enhancement compared to untreated PET. GNPs, however, tend to reduce ductility.
(4)
The synergistic effects of IR-PET and GNPs on EGC properties are effectively captured by 3D response surfaces and ANOVA models, which are statistically validated and useful for predicting desired responses.
(5)
PET exhibits significant potential for effective utilization in construction materials, particularly in EGC applications, when subjected to gamma irradiation and combined with GnPs. This transformation converts waste PET into construction materials with superior properties.
(6)
The optimization outcomes derived from the RSM prioritize the minimization of GNP usage and the maximization of IR-PET utilization. Experimental validation confirms that the optimal composite, which achieves maximum mechanical and post-crack properties while minimizing drying shrinkage, is achieved at a dosage of 26.4% IR-PET and 0.12% GNPs.
The findings of this study open new avenues for the sustainable use of waste PET in construction. The improved performance of EGC with gamma-irradiated PET and GNPs suggests potential applications in various structural and non-structural elements. Future research could focus on understanding chain scission effects induced by gamma radiation on PET, enhancing characterization techniques, optimizing composite properties, and investigating ductility enhancement mechanisms. These efforts can advance waste PET utilization in EGC for sustainable construction materials.

Author Contributions

Conceptualization, M.Z. and Y.M.A.; methodology, M.I.K., M.Z. and N.S.; validation, M.I.K.; formal analysis, M.Z., F.I.I. and M.I.K.; investigation, Y.M.A. and M.Z.; resources, N.S.; data curation, F.I.I.; writing—original draft preparation, M.Z.; writing—review and editing, Y.M.A., M.I.K. and N.S.; supervision, N.S.; project administration, Y.M.A. and N.S.; funding acquisition, M.I.K. All authors have read and agreed to the published version of the manuscript.

Funding

This research was funded by Researcher Supporting Project number (RSPD2024R692), King Saud University, Riyadh, Kingdom of Saudi Arabia.

Institutional Review Board Statement

Not applicable.

Informed Consent Statement

Not applicable.

Data Availability Statement

Data are contained within the article.

Acknowledgments

The authors extend their appreciation to Researcher Supporting Project number (RSPD2024R692), King Saud University, Riyadh, Kingdom of Saudi Arabia.

Conflicts of Interest

The authors declare no conflicts of interest.

Appendix A. Validation of ANOVA Models

The ANOVA models devised in this study require statistical validation. Examination of Table A1 reveals that the discrepancy between the adjusted predicted R 2 values of the responses are less than 0.2, indicating a high level of concordance. Moreover, the precision values of the responses surpassing four affirm the reliability of the model [67]. Consequently, the established models can confidently forecast responses for user-specified values of the desired factors. Table A2 provides a comprehensive ANOVA of the full regression model encompassing all responses. The significance of the F-value, with a probability of less than 0.005, corroborates the validity of all models [68]. To avoid redundancy, the specificity of the predicted versus actual plots and the perturbation plots were selected for descriptions concerning compressive strength.
Table A1. Model validation for responses.
ResponseStandard DeviationMeanR2Predicted R2Adjusted R2Adequate Precision
Slump flow1.18135.780.99390.93500.983728.656
Compressive strength1.0839.780.98460.84080.959019.106
Elastic modulus0.543311.070.98020.82040.947216.616
First-crack strength0.13667.230.98010.75720.946816.2395
Flexural strength0.26408.030.97920.77390.944415.9798
Flexural toughness0.577710.380.99060.89730.974923.3145
Ductility index0.395210.280.99780.97440.994147.6867
Drying shrinkage0.01470.25110.98420.81300.958017.826
Table A2. ANOVA results for the full regression model of each response.
ResponseSum of SquaresMean SquareF-Valuep-ValueRemarks
Slump flow683.36136.6797.750.0016Significant
Compressive strength226.0345.2138.440.0064Significant
Elastic modulus43.818.7629.680.0093Significant
Flexural first-crack strength2.750.550229.500.0094Significant
Flexural strength9.821.9628.180.0100Significant
Flexural toughness105.4521.0963.200.0031Significant
Ductility index212.4242.48271.990.0003Significant
Drying shrinkage0.04020.00837.470.0066Significant

References

  1. Scrivener, K.L.; John, V.M.; Gartner, E.M. Eco-Efficient Cements: Potential Economically Viable Solutions for a Low-CO2 Cement-Based Materials Industry. Cem. Concr. Res. 2018, 114, 2–26. [Google Scholar] [CrossRef]
  2. Sathiparan, N.; Anburuvel, A.; Selvam, V.V. Utilization of Agro-Waste Groundnut Shell and Its Derivatives in Sustainable Construction and Building Materials—A Review. J. Build. Eng. 2023, 66, 105866. [Google Scholar] [CrossRef]
  3. Zhang, P.; Zheng, Y.; Wang, K.; Zhang, J. A Review on Properties of Fresh and Hardened Geopolymer Mortar. Compos. Part B 2018, 152, 79–95. [Google Scholar] [CrossRef]
  4. Saravanakumar, R.; Elango, K.S.; Revathi, V.; Balaji, D. Influence of Aggressive Environment in Macro and Microstructural Properties of Bottom Ash Geopolymer Concrete. Sustainability 2024, 16, 1732. [Google Scholar] [CrossRef]
  5. Elemam, W.E.; Tahwia, A.M.; Abdellatief, M.; Youssf, O.; Kandil, M.A. Durability, Microstructure, and Optimization of High-Strength Geopolymer Concrete Incorporating Construction and Demolition Waste. Sustainability 2023, 15, 15832. [Google Scholar] [CrossRef]
  6. Ferrara, P.L.; La Noce, M.; Sciuto, G. Sustainability of Green Building Materials: A Scientometric Review of Geopolymers from a Circular Economy Perspective. Sustainability 2023, 15, 16047. [Google Scholar] [CrossRef]
  7. Ünal, M.T.; Gökçe, H.S.; Ayough, P.; Alnahhal, A.M.; Şimşek, O.; Nehdi, M.L. Nanomaterial and Fiber-Reinforced Sustainable Geopolymers: A Systematic Critical Review. Constr. Build. Mater. 2023, 404, 133325. [Google Scholar] [CrossRef]
  8. Rahman, A.S.; Jackson, P.; Radford, D.W. Improved Toughness and Delamination Resistance in Continuous Fiber Reinforced Geopolymer Composites via Incorporation of Nano-Fillers. Cem. Concr. Compos. 2020, 108, 103496. [Google Scholar] [CrossRef]
  9. Thakur, G.; Singh, Y.; Singh, R.; Prakash, C.; Saxena, K.K.; Pramanik, A.; Basak, A.; Subramaniam, S.; Waqas, R.M.; Zaman, S.; et al. Influence of Bentonite and Polypropylene Fibers on Geopolymer Concrete. Sustainability 2024, 16, 789. [Google Scholar] [CrossRef]
  10. Huo, W.; Zhu, Z.; Sun, H.; Ma, B.; Yang, L.; Rahmati, M.; Toufigh, V.; Tanyildizi, H.; Abdellatief, M.; Hassan, Y.M.; et al. Machine Learning Approaches to Predict Compressive Strength of Fly Ash-Based Geopolymer Concrete: A Comprehensive Review. Constr. Build. Mater. 2024, 16, 135519. [Google Scholar] [CrossRef]
  11. Qu, Y.; Li, W.; Wang, C.; Cao, H.; Zhou, R. Study on the Reinforced Properties of Geopolymer Fibers with a Sustainable Development Role. Sustainability 2024, 16, 6255. [Google Scholar] [CrossRef]
  12. Li, L.; Yan, C.; Zhang, N.; Farooqi, M.U.; Xu, S.; Deifalla, A.F. Flexural Fracture Parameters of Polypropylene Fiber Reinforced Geopolymer. J. Mater. Res. Technol. 2023, 24, 1839–1855. [Google Scholar] [CrossRef]
  13. Fantilli, A.P.; Mihashi, H.; Vallini, P. Multiple Cracking and Strain Hardening in Fiber-Reinforced Concrete under Uniaxial Tension. Cem. Concr. Res. 2009, 39, 1217–1229. [Google Scholar] [CrossRef]
  14. Wang, Z.; Sun, P.; Hu, Y.; Han, S. Crack Morphology Tailoring and Permeability Prediction of Polyvinyl Alcohol -Steel Hybrid Fiber Engineered Cementitious Composites. J. Clean. Prod. 2023, 383, 135335. [Google Scholar] [CrossRef]
  15. Li, Z.; Sheikh, M.N.; Feng, H.; Hadi, M.N.S. Mechanical Properties of Engineered Geopolymer Composite with Graphene Nanoplatelet. Ceram. Int. 2022, 48, 34915–34930. [Google Scholar] [CrossRef]
  16. Zhong, H.; Zhang, M. Engineered Geopolymer Composites: A State-of-the-Art Review. Cem. Concr. Compos. 2023, 135, 104850. [Google Scholar] [CrossRef]
  17. Dan Gavriletea, M. Environmental Impacts of Sand Exploitation. Analysis of Sand Market. Sustainability 2017, 9, 1118. [Google Scholar] [CrossRef]
  18. Abdellatief, M.; Adel, B.; Alanazi, H.; Tawfik, T.A. Multiscale Optimization Analysis of High Strength Alkali-Activated Concrete Containing Waste Medical Glass under Exposure to Carbonation and Elevated Temperatures. Dev. Built Environ. 2024, 19, 100492. [Google Scholar] [CrossRef]
  19. Wong, S.L.; Ngadi, N.; Abdullah, T.A.T.; Inuwa, I.M. Current State and Future Prospects of Plastic Waste as Source of Fuel: A Review. Renew. Sustain. Energy Rev. 2015, 50, 1167–1180. [Google Scholar] [CrossRef]
  20. Soni, V.; Dinh, D.A.; Poonia, K.; Kumar, R.; Singh, P.; Ponnusamy, V.K.; Selvasembian, R.; Singh, A.; Chaudhary, V.; Thakur, S.; et al. Upcycling of Polyethylene Terephthalate (PET) Plastic Wastes into Carbon-Based Nanomaterials: Current Status and Future Perspectives. Eur. Polym. J. 2024, 215, 113249. [Google Scholar] [CrossRef]
  21. Suraweera, S.M.D.V.; De Silva, S. Effect of Recycled Polyethylene Terephthalate (PET) Fibres on Fresh and Hardened Properties of Concrete: A Review. Int. J. Sustain. Eng. 2023, 16, 269–284. [Google Scholar] [CrossRef]
  22. Panara, V.; Bhonde, V.; Patel, S.; Jayswal, S.; Iyer, K.K.R.; Mungule, M. Effect of Waste PET Strips as Reinforcement in Concrete under Cyclic Loading. Clean. Mater. 2022, 6, 100147. [Google Scholar] [CrossRef]
  23. Parhi, S.K.; Patro, S.K. Application of R-Curve, ANCOVA, and RSM Techniques on Fracture Toughness Enhancement in PET Fiber-Reinforced Concrete. Constr. Build. Mater. 2024, 411, 134644. [Google Scholar] [CrossRef]
  24. Chong, B.W.; Shi, X. Meta-Analysis on PET Plastic as Concrete Aggregate Using Response Surface Methodology and Regression Analysis. J. Infrastruct. Preserv. Resil. 2023, 4, 2. [Google Scholar] [CrossRef]
  25. Abu-Saleem, M.; Zhuge, Y.; Hassanli, R.; Ellis, M.; Rahman, M.M.; Levett, P. Impact Resistance and Sodium Sulphate Attack Testing of Concrete Incorporating Mixed Types of Recycled Plastic Waste. Sustainability 2021, 13, 9521. [Google Scholar] [CrossRef]
  26. Saxena, R.; Gupta, T.; Sharma, R.K.; Chaudhary, S.; Jain, A. Assessment of Mechanical and Durability Properties of Concrete Containing PET Waste. Sci. Iran. 2020, 27, 1–9. [Google Scholar] [CrossRef]
  27. Deraman, R.; Nawi, M.N.M.; Yasin, M.N.; Ismail, M.H.; Ahmed, R.S.M.O.M. Polyethylene Terephthalate Waste Utilisation for Production of Low Thermal Conductivity Cement Sand Bricks. J. Adv. Res. Fluid Mech. Therm. Sci. 2021, 88, 117–136. [Google Scholar] [CrossRef]
  28. Dawood, A.O.; AL-Khazraji, H.; Falih, R.S. Physical and Mechanical Properties of Concrete Containing PET Wastes as a Partial Replacement for Fine Aggregates. Case Stud. Constr. Mater. 2021, 14, e00482. [Google Scholar] [CrossRef]
  29. Saxena, R.; Siddique, S.; Gupta, T.; Sharma, R.K.; Chaudhary, S. Impact Resistance and Energy Absorption Capacity of Concrete Containing Plastic Waste. Constr. Build. Mater. 2018, 176, 415–421. [Google Scholar] [CrossRef]
  30. Abdulkadir, I.; Mohammed, B.S.; Al-Yacouby, A.M.; Woen, E.L.; Tafsirojjaman, T. Tailoring an Engineered Cementitious Composite with Enhanced Mechanical Performance at Ambient and Elevated Temperatures Using Graphene Oxide and Crumb Rubber. J. Mater. Res. Technol. 2024, 28, 4508–4530. [Google Scholar] [CrossRef]
  31. Grigoriadis, K.; Bañuls-Ciscar, J.; Caverzan, A.; Negro, P.; Senaldi, C.; Ceccone, G. Use of Irradiated PET Plastic Waste for Partially Replacing Cement in Concrete? Waste Manag. 2023, 170, 193–203. [Google Scholar] [CrossRef]
  32. Khan, M.I.; Sutanto, M.H.; Khahro, S.H.; Zoorob, S.E.; Nur, N.I.; Al-Sabaeei, A.M.; Javed, Y. Fatigue Prediction Model and Stiffness Modulus for Semi-Flexible Pavement Surfacing Using Irradiated Waste Polyethylene Terephthalate-Based Cement Grouts. Coatings 2023, 13, 76. [Google Scholar] [CrossRef]
  33. Siddhartha; Aarya, S.; Dev, K.; Raghuvanshi, S.K.; Krishna, J.B.M.; Wahab, M.A. Effect of Gamma Radiation on the Structural and Optical Properties of Polyethyleneterephthalate (PET) Polymer. Radiat. Phys. Chem. 2012, 81, 458–462. [Google Scholar] [CrossRef]
  34. Schaefer, C.E.; Kupwade-Patil, K.; Ortega, M.; Soriano, C.; Büyüköztürk, O.; White, A.E.; Short, M.P. Irradiated Recycled Plastic as a Concrete Additive for Improved Chemo-Mechanical Properties and Lower Carbon Footprint. Waste Manag. 2018, 71, 426–439. [Google Scholar] [CrossRef]
  35. Imran Khan, M.; Sutanto, M.H.; Bin Napiah, M.; Zoorob, S.E.; Al-Sabaeei, A.M.; Rafiq, W.; Ali, M.; Memon, A.M. Investigating the Mechanical Properties and Fuel Spillage Resistance of Semi-Flexible Pavement Surfacing Containing Irradiated Waste PET Based Grouts. Constr. Build. Mater. 2021, 304, 124641. [Google Scholar] [CrossRef]
  36. Khan, M.I.; Sutanto, M.H.; Bin Napiah, M.; Khan, K.; Rafiq, W. Design Optimization and Statistical Modeling of Cementitious Grout Containing Irradiated Plastic Waste and Silica Fume Using Response Surface Methodology. Constr. Build. Mater. 2021, 271, 121504. [Google Scholar] [CrossRef]
  37. Alaskar, A.; Mahmood, M.S.; Nassar, R.U.D.; Zaid, O.; Althoey, F.; Arbili, M.M. Systematic Review on Geopolymer Composites Modified with Nanomaterials and Thin Films: Enhancing Performance and Sustainability in Construction. Constr. Build. Mater. 2023, 409. [Google Scholar] [CrossRef]
  38. Samuvel Raj, R.; Prince Arulraj, G.; Anand, N.; Kanagaraj, B.; Lubloy, E.; Naser, M.Z. Nanomaterials in Geopolymer Composites: A Review. Dev. Built Environ. 2023, 13, 100114. [Google Scholar] [CrossRef]
  39. Shilar, F.A.; Ganachari, S.V.; Patil, V.B.; Khan, T.M.Y.; Almakayeel, N.M.; Alghamdi, S. Review on the Relationship between Nano Modifications of Geopolymer Concrete and Their Structural Characteristics. Polymers 2022, 14, 1421. [Google Scholar] [CrossRef] [PubMed]
  40. Ranjbar, N.; Mehrali, M.; Mehrali, M.; Alengaram, U.J.; Jumaat, M.Z. Graphene Nanoplatelet-Fly Ash Based Geopolymer Composites. Cem. Concr. Res. 2015, 76, 222–231. [Google Scholar] [CrossRef]
  41. Li, Z.; Fei, M.E.; Huyan, C.; Shi, X. Nano-Engineered, Fly Ash-Based Geopolymer Composites: An Overview. Resour. Conserv. Recycl. 2021, 168, 105334. [Google Scholar] [CrossRef]
  42. Iqbal, H.W.; Hamcumpai, K.; Nuaklong, P.; Jongvivatsakul, P.; Likitlersuang, S.; Chintanapakdee, C.; Wijeyewickrema, A.C. Effect of Graphene Nanoplatelets on Engineering Properties of Fly Ash-Based Geopolymer Concrete Containing Crumb Rubber and Its Optimization Using Response Surface Methodology. J. Build. Eng. 2023, 75, 107024. [Google Scholar] [CrossRef]
  43. Mohammed, B.S.; Haruna, S.; Wahab, M.M.A.; Liew, M.S.; Haruna, A. Mechanical and Microstructural Properties of High Calcium Fly Ash One-Part Geopolymer Cement Made with Granular Activator. Heliyon 2019, 5, e02255. [Google Scholar] [CrossRef]
  44. Zahid, M.; Shafiq, N.; Razak, S.N.A.; Tufail, R.F. Investigating the Effects of NaOH Molarity and the Geometry of PVA Fibers on the Post-Cracking and the Fracture Behavior of Engineered Geopolymer Composite. Constr. Build. Mater. 2020, 265, 120295. [Google Scholar] [CrossRef]
  45. Hamidi, R.M.; Man, Z.; Azizli, K.A. Concentration of NaOH and the Effect on the Properties of Fly Ash Based Geopolymer. In Proceedings of the Procedia Engineering; Elsevier B.V.: Amsterdam, The Netherlands, 2016; Volume 148, pp. 189–193. [Google Scholar]
  46. Nematollahi, B.; Sanjayan, J.; Shaikh, F.U.A. Matrix Design of Strain Hardening Fiber Reinforced Engineered Geopolymer Composite. Compos. Part B Eng. 2016, 89, 253–265. [Google Scholar] [CrossRef]
  47. Khan, M.I.; Sutanto, M.H.; Khan, K.; Iqbal, M.; Bin Napiah, M.; Zoorob, S.E.; Klemeš, J.J.; Bokhari, A.; Rafiq, W. Effective Use of Recycled Waste PET in Cementitious Grouts for Developing Sustainable Semi-Flexible Pavement Surfacing Using Artificial Neural Network (ANN). J. Clean. Prod. 2022, 340, 130840. [Google Scholar] [CrossRef]
  48. Zhang, H.; Zhu, H.; Sun, R. Fabrication of Photocatalytic TiO2 Nanoparticle Film on PET Fabric by Hydrothermal Method. Text. Res. J. 2012, 82, 747–754. [Google Scholar] [CrossRef]
  49. Nematollahi, B.; Sanjayan, J.; Shaikh, F.U.A. Comparative Deflection Hardening Behavior of Short Fiber Reinforced Geopolymer Composites. Constr. Build. Mater. 2014, 70, 54–64. [Google Scholar] [CrossRef]
  50. Zahid, M.; Shafiq, N. Effects of Sand / Fly Ash and the Water / Solid Ratio on the Mechanical Properties of Engineered Geopolymer Composite and Mix Design Optimization. Minerals 2020, 10, 333. [Google Scholar] [CrossRef]
  51. Ghafari, E.; Costa, H.; Júlio, E. RSM-Based Model to Predict the Performance of Self-Compacting UHPC Reinforced with Hybrid Steel Micro-Fiber. Constr. Build. Mater. 2014, 66, 375–383. [Google Scholar] [CrossRef]
  52. Abdellatief, M.; Elrahman, M.A.; Elgendy, G.; Bassioni, G.; Tahwia, A.M. Response Surface Methodology-Based Modelling and Optimization of Sustainable UHPC Containing Ultrafine Fly Ash and Metakaolin. Constr. Build. Mater. 2023, 388, 131696. [Google Scholar] [CrossRef]
  53. Mohajeri, S.; Aziz, H.A.; Isa, M.H.; Zahed, M.A.; Adlan, M.N. Statistical Optimization of Process Parameters for Landfill Leachate Treatment Using Electro-Fenton Technique. J. Hazard. Mater. 2010, 176, 749–758. [Google Scholar] [CrossRef] [PubMed]
  54. Krishna, R.S.; Mishra, J.; Nanda, B.; Patro, S.K.; Adetayo, A.; Qureshi, T.S. The Role of Graphene and Its Derivatives in Modifying Different Phases of Geopolymer Composites: A Review. Constr. Build. Mater. 2021, 306, 124774. [Google Scholar] [CrossRef]
  55. Li, M.; Luo, R.; Qin, L.; Liu, H.; Duan, P.; Jing, W.; Zhang, Z.; Liu, X. High Temperature Properties of Graphene Oxide Modified Metakaolin Based Geopolymer Paste. Cem. Concr. Compos. 2022, 125, 104318. [Google Scholar] [CrossRef]
  56. Kangavar, M.E.; Lokuge, W.; Manalo, A.; Karunasena, W.; Frigione, M. Investigation on the Properties of Concrete with Recycled Polyethylene Terephthalate (PET) Granules as Fine Aggregate Replacement. Case Stud. Constr. Mater. 2022, 16, e00934. [Google Scholar] [CrossRef]
  57. Frigione, M. Recycling of PET Bottles as Fine Aggregate in Concrete. Waste Manag. 2010, 30, 1101–1106. [Google Scholar] [CrossRef]
  58. Lazorenko, G.; Kasprzhitskii, A.; Fini, E.H. Sustainable Construction via Novel Geopolymer Composites Incorporating Waste Plastic of Different Sizes and Shapes. Constr. Build. Mater. 2022, 324, 126697. [Google Scholar] [CrossRef]
  59. Ismail, Z.Z.; AL-Hashmi, E.A. Use of Waste Plastic in Concrete Mixture as Aggregate Replacement. Waste Manag. 2008, 28, 2041–2047. [Google Scholar] [CrossRef] [PubMed]
  60. Silva, R.V.; De Brito, J.; Dhir, R.K. Establishing a Relationship between Modulus of Elasticity and Compressive Strength of Recycled Aggregate Concrete. J. Clean. Prod. 2016, 112, 2171–2186. [Google Scholar] [CrossRef]
  61. Rahmani, E.; Dehestani, M.; Beygi, M.H.A.; Allahyari, H.; Nikbin, I.M. On the Mechanical Properties of Concrete Containing Waste PET Particles. Constr. Build. Mater. 2013, 47, 1302–1308. [Google Scholar] [CrossRef]
  62. Tay, C.H.; Norkhairunnisa, M. Mechanical Strength of Graphene Reinforced Geopolymer Nanocomposites: A Review. Front. Mater. 2021, 8, 661013. [Google Scholar] [CrossRef]
  63. González-Aviña, J.V.; Juárez-Alvarado, C.A.; Terán-Torres, B.T.; Mendoza-Rangel, J.M.; Durán-Herrera, A.; Rodríguez-Rodríguez, J.A. Influence of Fibers Distribution on Direct Shear and Flexural Behavior of Synthetic Fiber-Reinforced Self-Compacting Concrete. Constr. Build. Mater. 2022, 330, 127255. [Google Scholar] [CrossRef]
  64. Huang, D.; Liu, Z.; Lin, C.; Lu, Y.; Li, S. Effects and Mechanisms of Component Ratio and Cross-Scale Fibers on Drying Shrinkage of Geopolymer Mortar. Constr. Build. Mater. 2024, 411, 134299. [Google Scholar] [CrossRef]
  65. Negahban, E.; Bagheri, A.; Sanjayan, J. One-Year Study of Restrained Shrinkage and Creep Behaviours of Geopolymer Concrete. Constr. Build. Mater. 2023, 376, 131057. [Google Scholar] [CrossRef]
  66. Ferdosian, I.; Camões, A. Eco-Efficient Ultra-High Performance Concrete Development by Means of Response Surface Methodology. Cem. Concr. Compos. 2017, 84, 146–156. [Google Scholar] [CrossRef]
  67. Zahid, M.; Shafiq, N.; Isa, M.H.; Gil, L. Statistical Modeling and Mix Design Optimization of Fly Ash Based Engineered Geopolymer Composite Using Response Surface Methodology. J. Clean. Prod. 2018, 194, 483–498. [Google Scholar] [CrossRef]
  68. Subasi, A.; Sahin, B.; Kaymaz, I. Multi-Objective Optimization of a Honeycomb Heat Sink Using Response Surface Method. Int. J. Heat Mass Transf. 2016, 101, 295–302. [Google Scholar] [CrossRef]
Figure 1. Micrographs of fly ash.
Sustainability 16 07455 g001
Figure 2. Image of raw PET.
Sustainability 16 07455 g002
Figure 3. Micrographs of R-PET (relatively smoother surface: no IR treatment).
Sustainability 16 07455 g003
Figure 4. Micrographs of IR-PET (relatively rough surface confirm the chain scission IR treatment).
Sustainability 16 07455 g004
Figure 5. XRD patterns of R-PET and IR-PET. (Relatively higher peak intensities of IR-PET confirm the higher crystallinity.)
Sustainability 16 07455 g005
Figure 6. FESEM image of graphene nanoplatelets (layered graphene sheets).
Sustainability 16 07455 g006
Figure 7. Micrographs of PVA fibers.
Sustainability 16 07455 g007
Figure 8. Central composite design (CCD) module (face centered). (a) Corner points. (b) Middle point and central point. (c) CCD design.
Sustainability 16 07455 g008
Figure 9. Dispersion method of graphene nanoplatelets (GnPs) in water: (a) graphene nanoparticles; (b) GnPs in water before dispersion; (c) GnPs in water manually shaken for 10 s using a portable water bottle; (d) sonication for 30 min; (e) graphene nanoplatelets (GnPs) uniformly dispersed in water.
Sustainability 16 07455 g009
Figure 10. Sample details and loading arrangement for flexural strength test. (Measurements are in “mm”).
Sustainability 16 07455 g010
Figure 11. Effect of PET irradiation and GNPs on the slump flow of EGC.
Sustainability 16 07455 g011
Figure 12. Slump flow versus GNPs and IR-PET: (a) 3D response surface, (b) contour diagram.
Sustainability 16 07455 g012
Figure 13. Effect of PET irradiation and GNPs on the compressive strength of EGC.
Sustainability 16 07455 g013
Figure 14. FESEM images of EGC: (a) R-waste PET and (b) IR-PET (mix GIR). Note: arrows point to the PET–matrix interface.
Sustainability 16 07455 g014
Figure 15. FESEM images of a mix design P0G0.5: (a) fiber–matrix interface and (b) agglomeration of graphene. (Note: arrows point to the agglomeration of graphene).
Sustainability 16 07455 g015
Figure 16. Compressive strength versus GNPs and IR-PET: (a) 3D response surface, (b) contour diagram.
Sustainability 16 07455 g016
Figure 17. FESEM images of mix P0G0 (no GNPs). (a) Arrows point to unreacted fly ash; (b) arrows point to the fiber–matrix interface.
Sustainability 16 07455 g017
Figure 18. FESEM images of mix P0G0.25 (0.25% GNPs). (a) Arrows point to unreacted fly ash; (b) arrows point to the fiber–matrix interface.
Sustainability 16 07455 g018
Figure 19. Effect of PET irradiation and GNPs on the elastic modulus of EGC.
Sustainability 16 07455 g019
Figure 20. Elastic modulus versus GNPs and IR-PET: (a) 3D response surface; (b) contour diagram.
Sustainability 16 07455 g020
Figure 21. Effect of PET irradiation and GNPs on the FS and FCS of EGC.
Sustainability 16 07455 g021
Figure 22. Flexural first-crack strength versus GNPs and IR-PET: (a) 3D response surface and (b) contour diagram.
Sustainability 16 07455 g022
Figure 23. Flexural strength versus GNPs and IR-PET: (a) 3D response surface and (b) contour diagram.
Sustainability 16 07455 g023
Figure 24. Effect of PET irradiation and GNPs on the flexural toughness of EGC.
Sustainability 16 07455 g024
Figure 25. Flexural toughness versus GNPs and IR-PET. (a) 3D response surface; (b) contour diagram.
Sustainability 16 07455 g025
Figure 26. Effect of PET irradiation and GNPs on the ductility index of EGC.
Sustainability 16 07455 g026
Figure 27. Ductility index versus GNPs and IR-PET: (a) 3D response surface and (b) contour diagram.
Sustainability 16 07455 g027
Figure 28. Effect of PET irradiation and GNPs on the drying shrinkage of EGC.
Sustainability 16 07455 g028
Figure 29. Drying shrinkage versus GNPs and IR-PET: (a) 3D response surface; (b) contour diagram.
Sustainability 16 07455 g029
Figure 30. Deflection of optimized EGC after failure.
Sustainability 16 07455 g030
Table 1. Chemical composition of fly ash (%).
SiO2Al2O3Fe2O3CaOMgOK2OSO3TiO2P2O5Na2OLOI
34.512.823.619.01.272.081.491.461.110.162.6
Note: LOI is loss on ignition and BET represents the average BET surface area.
Table 2. Gradation of aggregates (%).
Sieve Size (µm)710600300150
Silica sand99.8078.1216.141.23
R-PET95.5080.4024.102.40
IR-PET99.1085.3034.805.20
Table 3. Properties of the graphene nanoplatelets.
DesignationSurface Area (m3/g)Diameter (µm)Relative Gravity
(g/cc)
Bulk Density
(g/cm3)
Appearance
xGnP®300<22.0–2.250.2–0.4 g/ccBlack granule/powder
Table 4. Properties of PVA fibers.
Fiber TypeLength
(mm)
Diameter
(mm)
Aspect Ratio (L/D)Fiber Strength (MPa)Youngs Modulus (GPa)Density (g/cm3)
KURALON (RECS 15)80.043001600411.3
Table 5. Boundaries of factors in RSM.
FactorCodeLevels
α 0 + α
IR-PET (%)X102550
GnP (%)X200.250.50
Table 6. Mix design of one-part engineered geopolymer composites (Phase 1).
Mix IDVariables (%)Constituent Materials
R-PETaIR-PET aFly AshSand bNa2SiO3 bW/GP Solids bPVA Fiber c
Control0010.30.120.240.02
GR25010.2250.120.240.02
GIR02510.2250.120.240.02
a Quantity in the volume %age of the total volume of filler material, i.e., sand + IR-PET (or + PET); b quantity in a mass ratio of fly ash; c quantity in the volume fraction of the total volume of material.
Table 7. Mix design of one-part engineered geopolymer composites (Phase 2).
Mix IDFactorsConstituent Materials
IR-PET aGnP dFly AshSand bNa2SiO3 bW/GP Solids bPVA Fiber c
Control0010.30.120.240.02
P0G0.2500.2510.30.120.240.02
P0G0.500.5010.30.120.240.02
P25G025010.2250.120.240.02
P25G0.25250.2510.2250.120.240.02
P25G0.50250.5010.2250.120.240.02
P50G050010.150.120.240.02
P50G0.25500.2510.150.120.240.02
P50G0.50500.5010.150.120.240.02
Note: Na2SiO3 = anhydrous sodium metasilicate; PET = waste polyethylene terephthalate; GNPs = graphene nanoplatelets; W/GP solids = water/geopolymer solids where geopolymer solids include fly ash and anhydrous sodium metasilicate; a quantity in the volume % age of the total volume of filler material, i.e., sand + IR-PET; b quantity in a mass ratio of fly ash; c quantity in the volume fraction of the total volume of material; d quantity in the mass % age of the total mass of fly ash; the type and dosage of anhydrous sodium metasilicate chosen from the available literature [43].
Table 8. Details of experiments.
TestStandardSample
ShapeSize, mm
Mini-slump flowASTM C1437-15Truncated cone70 × 100 × 60
Compressive strengthASTM C109/C109M-16aCube50 × 50 × 50
Elastic modulusASTM C 469-14Cylinder100 × 150
Flexural strengthASTM 1609-12Beam24 × 100 × 50
Flexural toughnessASTM 1609-12
Ductility indexAs recommended by Nematollahi [39].
Drying shrinkageASTM C157/C157M-17Prism25 × 25 × 285
Table 9. Definitions of factors and responses in the multi-objective optimization problem.
Name of Factors and ResponseGoalLower LimitUpper Limit
IR-PETMaximize050
GNPsMinimize00.5
Slump flowIn range120148
Compressive strengthMaximize3148
Elastic modulusMaximize2.817.8
First-crack strengthIn range6.28
Flexural strengthMaximize6.49.9
Flexural toughnessMaximize7.414.6
Ductility indexMaximize2.817.8
Drying shrinkageMinimize0.180.4
Table 10. Optimized solutions with desirability.
Factors (Variables)Responses (EGC Properties)
IR-PETGNPs ϕ (%)CS
(MPa)
E
(GPa)
FT
(N.m)
DIFS
(MPa)
DS(%)Desirability
26.40.12143.446.311.516.116.89.60.180.806
Table 11. Experimental validation of the optimized mixture.
Response ϕ (%)CS
(MPa)
E
(GPa)
FT
(N.m)
DIFS
(MPa)
DS
(%)
Predicted143.446.311.516.116.89.60.18
Experimental137.244.11215.317.610.060.172
Error (%)4.324.754.344.964.764.794.44
Disclaimer/Publisher’s Note: The statements, opinions and data contained in all publications are solely those of the individual author(s) and contributor(s) and not of MDPI and/or the editor(s). MDPI and/or the editor(s) disclaim responsibility for any injury to people or property resulting from any ideas, methods, instructions or products referred to in the content.

