Article

Effects of Extreme Rainfall Change on Sediment Load in the Huangfuchuan Watershed, Loess Plateau, China

The School of Hydraulic Engineering, Nanchang Institute of Technology, Nanchang 330099, China
Sustainability 2024, 16(17), 7457; https://doi.org/10.3390/su16177457
Submission received: 19 July 2024 / Revised: 16 August 2024 / Accepted: 27 August 2024 / Published: 29 August 2024

Abstract

:
Rainfall-induced erosion is a predominant factor contributing to land degradation, with extreme rainfall events exerting a significantly greater impact than average rainfall. This study investigates the variability of extreme rainfall events and their effects on sediment yields within the Huangfuchuan watershed, located in the middle reaches of the Yellow River. Utilizing daily rainfall data from ten rainfall stations and sediment load records from Huangfu Station spanning from 1980 to 2020, the Mann–Kendall non-parametric test, Pettitt test, and double mass curve analysis were carried out to assess four critical extreme rainfall indexes: daily rainfall exceeding the 95th percentile (R95p), maximum one-day rainfall (RX1day), maximum five-day rainfall (RX5day), and simple daily intensity index (SDII) and quantitatively evaluated the contribution rate of extreme rainfall to changes in sediment load within the watershed. The results revealed that during the period of study, all four extreme rainfall indexes demonstrated non-significant declining trends, whereas sediment load exhibited a highly significant decreasing trend, with abrupt changes in 1998. Prior to these changes, significant correlations were observed between extreme rainfall indexes and sediment load. From 1999 to 2020, the contribution rates of these indexes to changes in sediment load varied between 11.3% and 27.1%, with R95p showing the greatest impact and RX5day the least. The NDVI showed a significant increase (p < 0.05) and the amount of sediment retained and dam areas of check dams increased annually. This could be the main reason for the decrease in sediment load. This study clarifies the interactions between sediment load and extreme rainfall, which can be valuable for watershed management decisions.

1. Introduction

Global climate change and human activities have intensified the global water cycle, leading to more frequent extreme rainfall events. According to available rainfall observations, the balance of precipitation distribution is affected in many areas [1]. Over the past 60 years (1951–2010), global extreme rainfall has shown a significant increasing trend, and climate projections for the rest of the 21st century show continued intensification of daily precipitation extremes [2]. In China, the study found no significant trend in the total amount of extreme rainfall but a significant increase in the frequency of such events from 1951 to 2014 [3]. There have been major negative impacts from extreme rainfall events. In 2019, extreme rainfall in the northeastern United States caused widespread flooding, resulting in the loss of lives and the stranding of thousands of cattle. The cost of the flooding is estimated to have exceeded USD 3 billion [4,5]. In July 2021, more than 180 deaths and more than 40,000 people were affected by flooding in Germany as a result of heavy rainfall [6]. In the same year, the Henan province of China also suffered unprecedented and historically extreme rainfall. The extreme flood disaster affected 14.78 million people, killed 398 people and inundated 16 million hectares of crops, causing direct economic losses of USD 20.69 billion and indirect costs many times higher [7]. Extreme rainfall events have had a significant impact on socio-economic development and the natural environment, which has attracted the attention of researchers worldwide [8,9,10,11,12].
Extreme rainfall is an important factor in causing changes in runoff and sediment load in watershed. A number of studies have demonstrated a positive correlation between the intensity and duration of extreme rainfall events and soil erosion. An increase in rainfall intensity results in a heightened rate of soil erosion and scouring, thereby increasing the transport of sediment [13,14,15,16]. Furthermore, extreme rainfall leads to an increase in surface runoff, which can accelerate the detachment of soil particles and their subsequent transport into rivers [17,18,19]. Therefore, some studies have focused on runoff and sediment load in relation to extreme rainfall [20,21,22,23]. Many studies have demonstrated that the relationship between extreme rainfall and changes in runoff and sediment load exhibits distinct variations over extended time series [24]. For example, the relationship between sediment load and climate extremes in ten major river basins in China during the period of 1956–2019 were examined, and the results demonstrated that in comparison with Period-I, the correlation between sediment load and extreme climate during Period-II became weaker in most basins, particularly in the Yellow River and Yangtze River [25]. The non-linear relationship between extreme rainfall and sediment load suggests that additional factors may be influencing sediment transport. A large number of studies have demonstrated that intensive human activities, including soil and water conservation measures and vegetation restoration projects, were the primary drivers of changes in sediment load [26]. The relationship between extreme rainfall and sediment load is further complicated by the combined effects of climate change and human activities. A quantitative understanding of the relationship between extreme rainfall and sediment load is essential for the development of effective watershed control strategies.
The Yellow River is known for its high sediment concentration. Recently, the runoff and sediment dynamics of the Yellow River have undergone significant changes, with sediment load decreasing from 1.6 billion tonnes during 1919–1959 to around 100 million tonnes since 2010, a reduction of 94% [27]. The primary reasons for this reduction are attributed to changes in rainfall patterns and human activities [28,29,30,31]. As a first-class tributary of the Yellow River, the Huangfuchuan watershed is located in the wind–sand transition zone dominated by wind–hydraulic interaction, and is the most important source area of coarse sediment of the Yellow River. The Huangfuchuan watershed has sparse vegetation, loose soil, deep and steep gullies, and highly concentrated rainfall, leading to frequent flooding and often causing severe soil erosion. The area of arsenic sandstone in the Huangfuchuan watershed accounts for more than 50% of the total watershed area and the original vegetation has been severely damaged. These characteristics are extremely rare in China and even in the world. The arsenic sandstone, sometimes called the “cancer of the Earth”, has a low degree of diagenesis, poor degree of cementation, and low structural strength. Meanwhile, arsenic sandstone is highly susceptible to disintegration when exposed to water, and it is difficult for plants to grow, making agricultural life unbearably harsh. Thus, the Huangfuchuan watershed has always been a key area for ecological protection and high-quality development of the Yellow River basin. Under the joint influence of climate change and human activities, the runoff and sediment load of the Huangfuchuan watershed has decreased significantly, and the relationship between runoff and sediment load has undergone significant changes, which has attracted extensive attention from researchers [32,33,34,35]. Most studies have focused on annual total rainfall, with limited research on sediment characteristics under extreme rainfall conditions, and the extent of extreme rainfall variability and their impact on sediment load. Therefore, the objectives of this study were to (1) examine the spatial and temporal variations in extreme rainfall in the Huangfuchuan watershed; (2) identify the changes of sediment load and its relationship with extreme rainfall; and (3) quantify the contribution of extreme rainfall to sediment load. The findings from this study will help to provide scientific support for soil erosion control and watershed management.

2. Materials and Methods
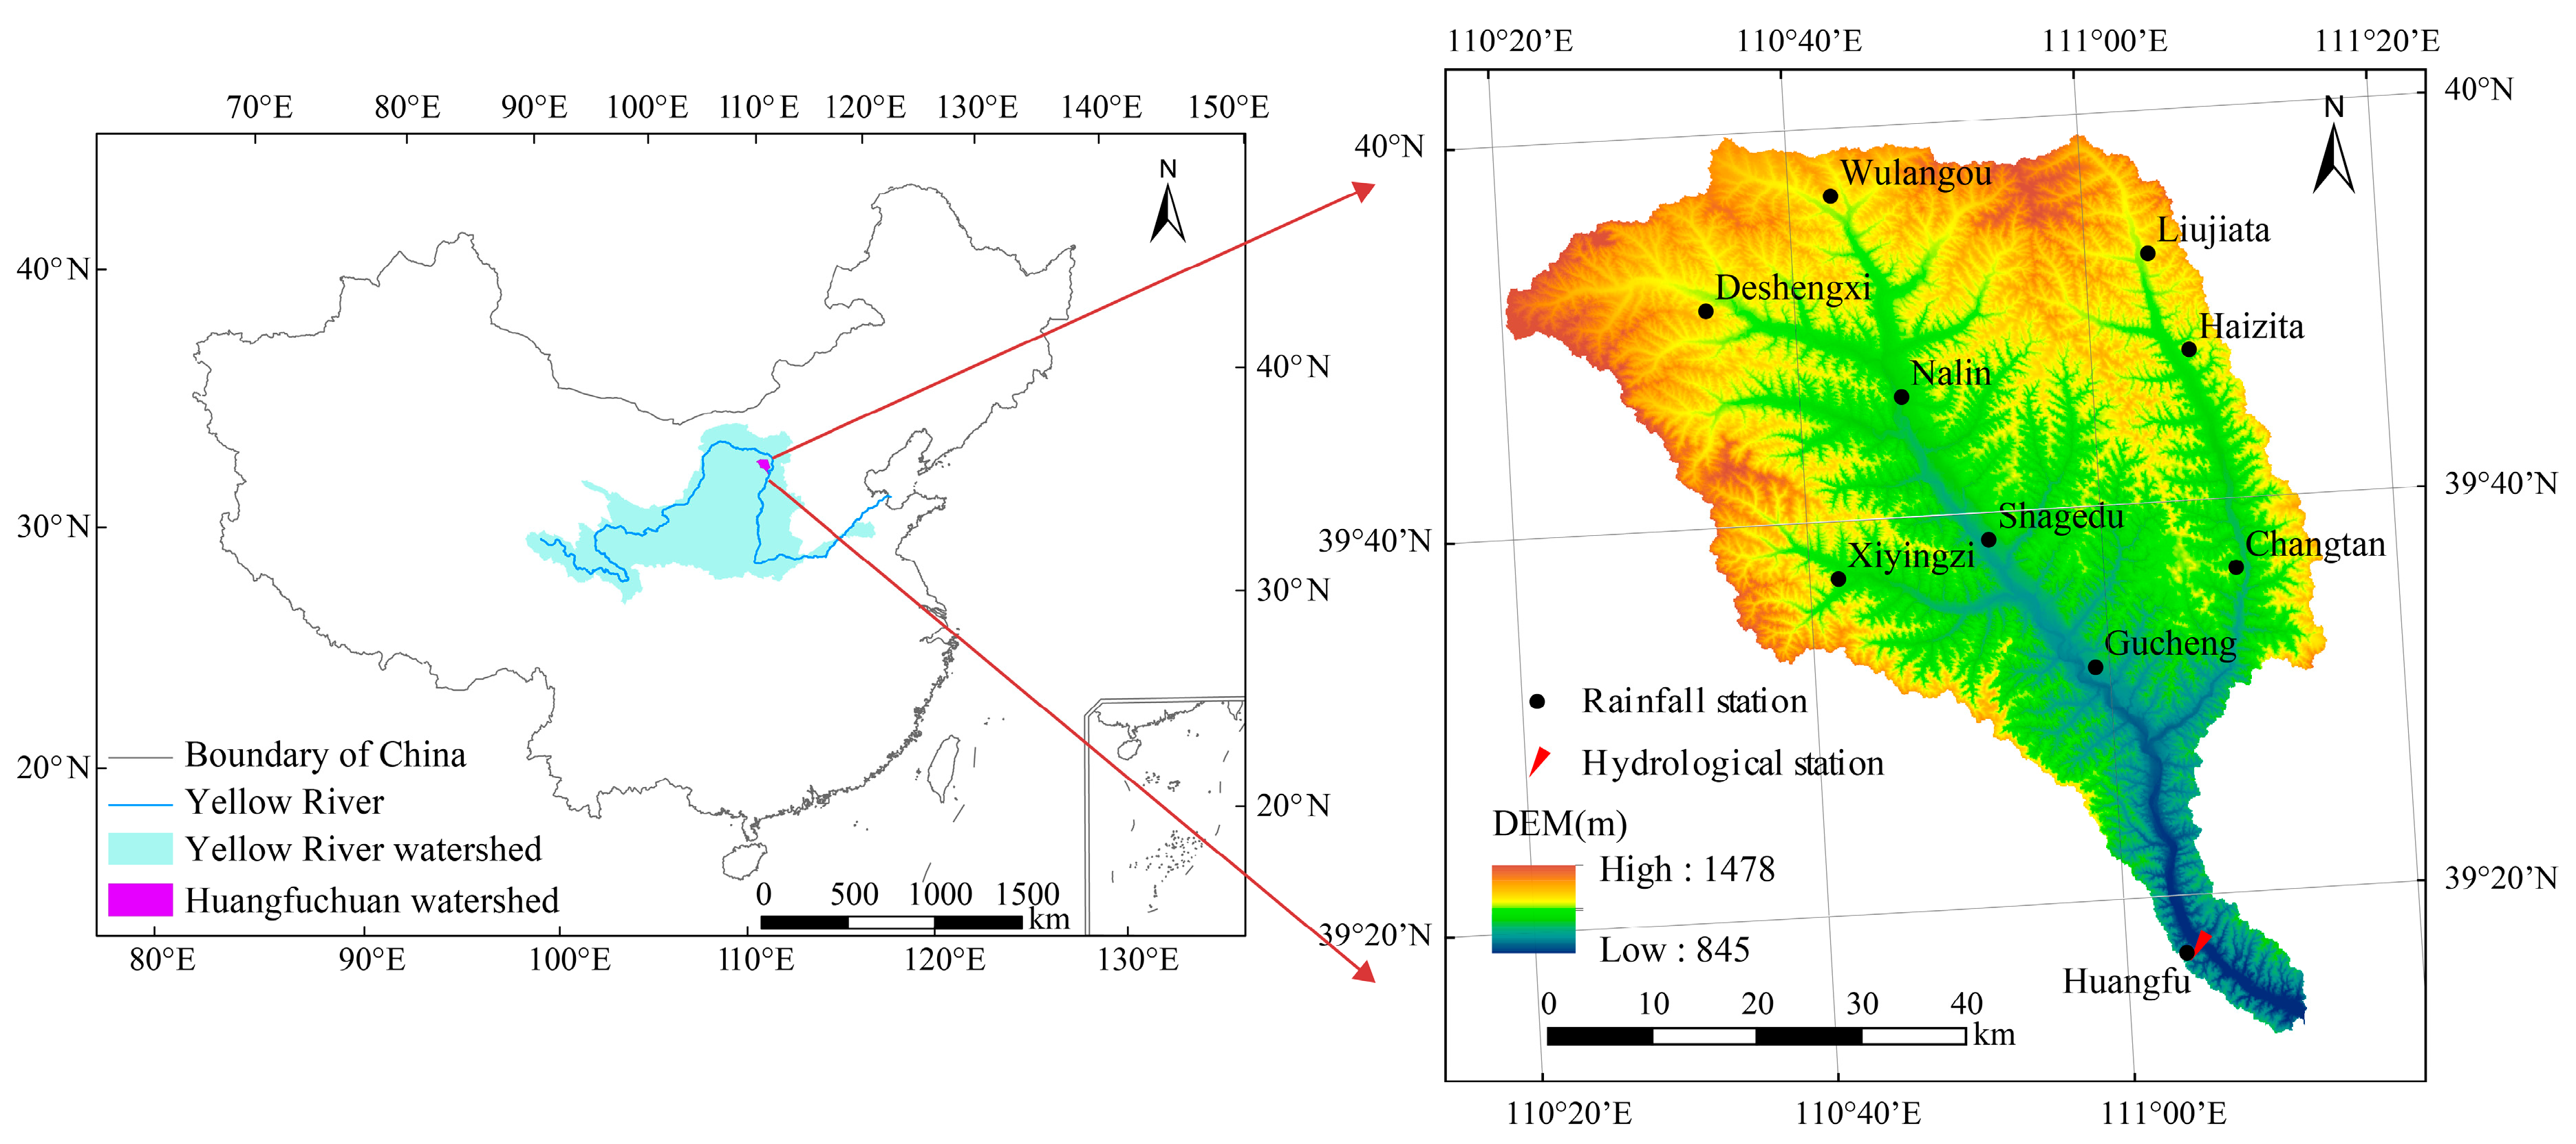
2.1. Study Area

The Huangfuchuan River, a primary tributary of the Yellow River (Figure 1), is located in the upper segment of the middle reaches of the Yellow River (39.10°–40° N, 110.20°–111.15° E). The main channel extends 137 km, encompassing a watershed area of 3246 km2. This region experiences an arid to semi-arid continental monsoon climate, with a long-term average temperature ranging from 6.2 °C to 7.2 °C and annual rainfall between 380 mm and 420 mm, 80% of which occurs from June to September. The average annual runoff is 122.9 million m3, while the average annual sediment load is 37.6 million tonnes in the Huangfuchuan watershed during 1954–2017. Notably, the runoff and sediment load from June to September account for 82.0% and 98.5% of the annual totals, respectively. The Huangfuchuan watershed is characterized by three distinct soil erosion types: the arsenic sandstone hilly and gully region, the loess hilly and gully region, and the desertified loess hilly and gully region [36]. The arsenic sandstone hilly and gully region is the most extensive, covering approximately 51.3% of the watershed area, and is a major source of coarse sediment for the Yellow River.

2.2. Data

In this study, daily rainfall data from ten rainfall stations within the Huangfuchuan watershed were collected, spanning the period from 1980 to 2020, and annual sediment load data from the watershed’s outlet control station, Huangfu station, for the same timeframe (Figure 1). These data were sourced from the Yellow River Basin Hydrological Yearbook to ensure continuity and consistency. The check dam data in the Huangfuchuan watershed were from the Yellow River Conservancy Commission.
The Normalized Difference Vegetation Index (NDVI) is an important indicator of vegetation cover, reflecting changes in vegetation growth, and is used for monitoring, classification, and phenological analysis. The NDVI datasets employed in this study are derived from the Global Monitoring and Modeling Systems (GIMMS) NDVI. The GIMMS NDVI data were obtained from the Ecological Forecasting Lab at the National Aeronautics and Space Administration Ames Research Center (https://ecocast.arc.nasa.gov (accessed on 1 March 2015)). The maximum value composite method was used to calculate NDVI data from bimonthly to annual [37].
Additionally, four extreme rainfall indexes based on the guidelines of the Expert Team on Climate Change Detection and Indices (ETCCDI) were selected. These indexes are directly related to erosion and sediment transport dynamics in the watershed (Table 1).

2.3. Methods

In order to investigate the trends and changes in extreme rainfall and their impact on sediment load, three robust analytical methods were employed [38,39]: the Mann–Kendall non-parametric test (MK test), the Pettitt test, and the double mass curve analysis. The methodology is described as follows.

2.3.1. Mann–Kendall Non-Parametric Test

The MK test is a widely used tool for detecting trends in time series data, such as rainfall, runoff, and sediment load, which evaluates the significance of trends by analyzing the rank correlation between the data points over time [40,41,42].
The MK statistic S can be calculated as:
S = i = 1 n 1 j = i + 1 n sgn ( x j x i ) j > i
where xi and xj represent data values of the hydro-climatic time series, n represents the number of data, and sgn represents the sign function. The sign function is defined as:
sgn ( x j x i ) = 1 0 1 i f   x j x i > 0 i f   x j x i = 0 i f   x j x i < 0
When n ≥ 8, the statistic S is approximately normally distributed with the mean and variance as:
E ( S ) = 0
V ( S ) = n ( n 1 ) ( 2 n + 5 ) k = 1 n t k k ( k 1 ) ( 2 k + 5 ) / 18
where tk is the number of ties of extent k. The standardized test statistic Z is calculated as:
Z = S 1 V a r ( S ) i f   S > 0 0 i f   S = 0 S + 1 V a r ( S ) i f   S < 0
The null hypothesis of no trends will be accepted when −Z1−α/2ZZ1−α/2. α represents the significance level, which can be set at 0.01, 0.05, and 0.1, and the corresponding Z values are 2.58, 1.96, and 1.65, respectively. A positive or negative of the Z value indicates an increasing or decreasing trend. A positive Z value represents an increasing trend for the hydro-climatic time series and a negative Z value represents a decreasing trend.

2.3.2. Pettitt Test

The Pettitt test is a non-parametric statistical method used to detect trend shifts in time series. It is particularly effective in identifying the point in time when a significant change in the mean of the series occurs [43,44,45].
Given a hydro-climatic time series x1, x2, …, xn, the Pettitt test allows the detection of a single shift at an unknown time t. The null hypothesis is no change in the distribution of hydro-climatic time series; the alternative hypothesis is that the distribution function F1(x) of the hydro-climatic time series from x1 to xt is different from the distribution function F2(x) of the hydro-climatic time series from xt+1 to xt [46]. The Pettitt test can be calculated as:
K T = m a x U t , T
where:
U t , T = i = 1 t j = t + 1 T sgn ( x i x j )
The test statistic Ut,T is assessed for all random variables from 1 to T; then, the most significant change point is selected where the value of |Ut,T| is the largest. sgn represents the sign function.
A change point occurs at time t when the statistic KT is significantly different from zero at a given level. The significance probability of KT is approximated for p ≤ 0.05 with:
p 2 exp 6 K T 2 T 2 + T 3

2.3.3. Double Mass Curve Analysis

The double mass curve analysis examines the relationship between two cumulative variables to identify changes in slope, which is useful for quantifying the impact of specific factors on hydrological elements [47,48,49].
Given two hydro-climatic time series x1, x2, …, xn and y1, y2, …, yn, double mass curve analysis is used to calculate the cumulative value of X and Y variables separately, and a new year-by-year cumulative sequence is obtained. The theory of double mass curves is based on the fact that a graph of the accumulation of one quantity against the accumulation of another quantity during the same period will plot as a straight line so long as the data are proportional; the slope of the line will represent the constant of proportionality between the quantities [50]. A change in the slope of the double mass curve indicates a breakpoint of the original gradient of the curve.
The impact of climate change and human activity on sediment load can be quantified as follows:
Δ I = I o a I o b
Δ I h = I o a I c a
Δ I c = Δ I Δ I h
where the ΔI is the sediment load amount effected by climate change and human activity after the abrupt change point, ΔIh is the sediment load amount effected by human activity, ΔIc is the sediment load amount effected by climate change, Ioa is observed average annual sediment load after the abrupt change point, Iob is observed average annual sediment load before the abrupt change point, Ica is the average annual sediment load after the abrupt change point calculated from the regression equation before the abrupt change point.

3. Results

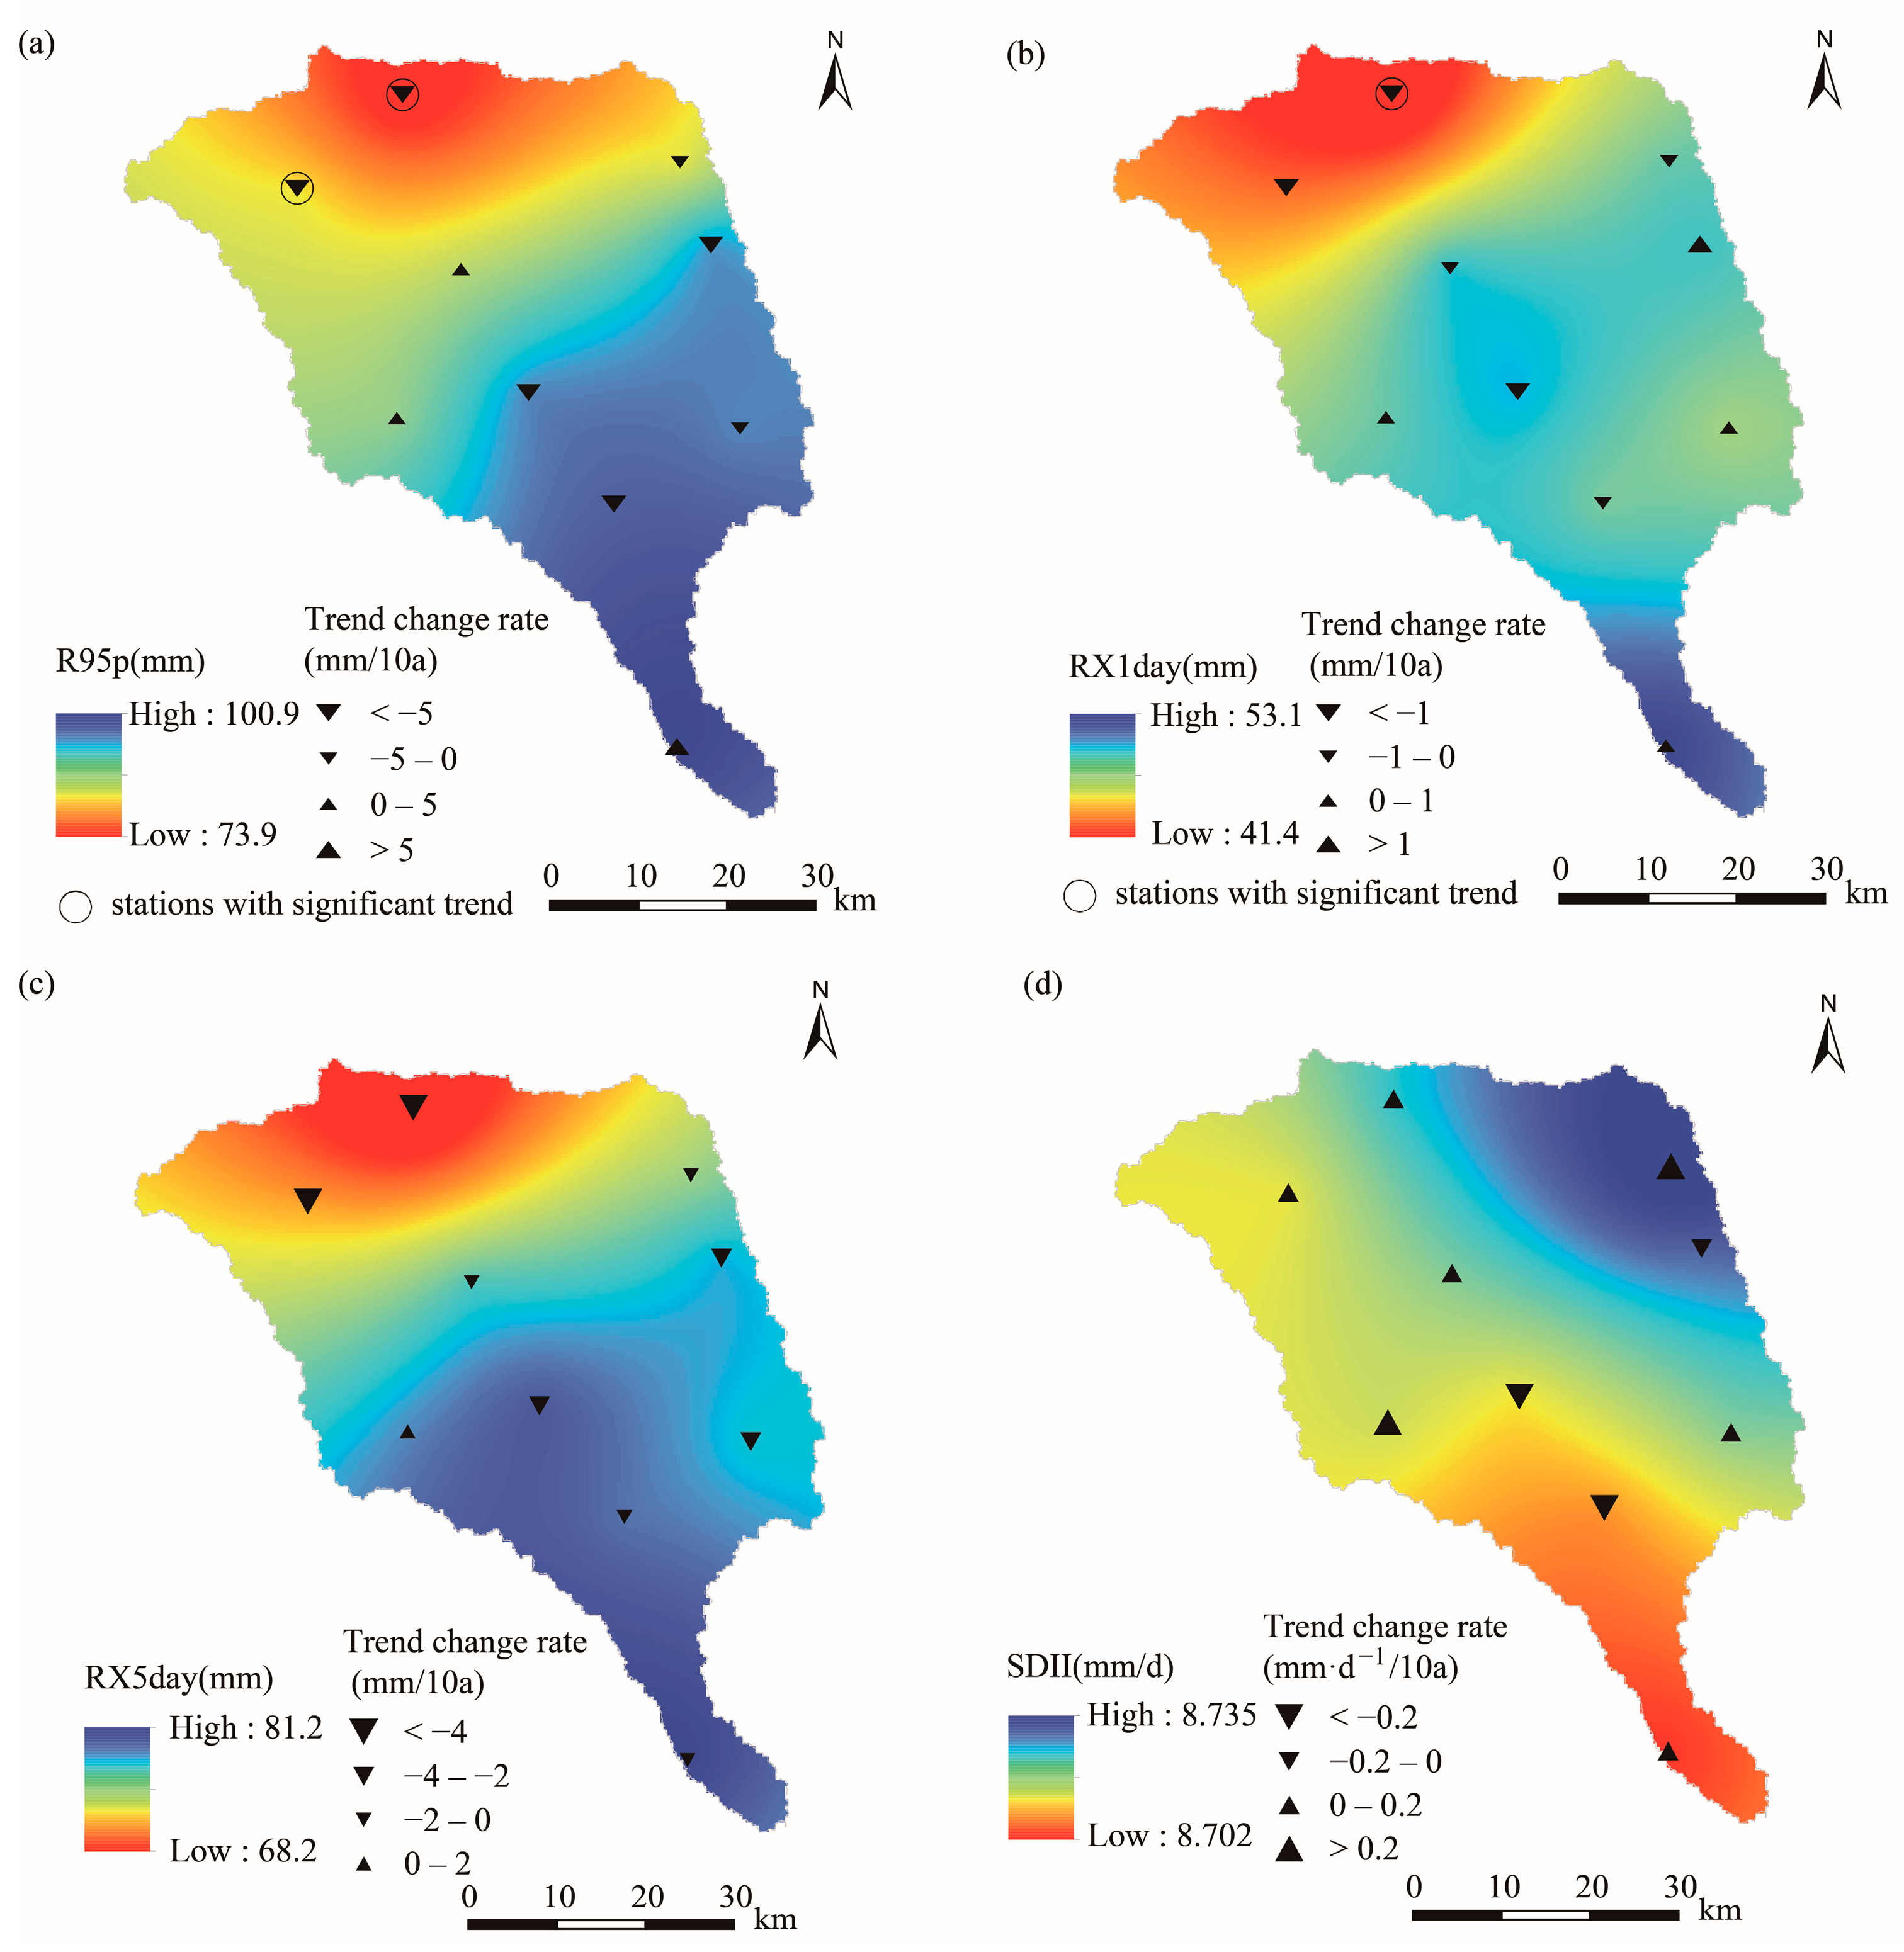
3.1. Spatiotemporal Variations of Extreme Rainfall Indexes

From 1980 to 2020, the extreme rainfall indexes in the Huangfuchuan watershed displayed varying degrees of decline (Figure 2). The decadal averages of R95p, RX1day, RX5day, and SDII decreased by 7.37 mm, 1.27 mm, 2.21 mm, and 0.12 mm/day, respectively. The MK test statistics for R95p, RX1day, RX5day, and SDII were −1.55, −1.19, −1.01, and −0.70, respectively, none of which reached the significance level (α = 0.05), indicating that the decreasing trends for all indexes were not statistically significant. Among these indexes, R95p exhibited the highest interannual variability (coefficient of variation, CV), while SDII showed the least variability.
Spatially, the multi-year average values of extreme rainfall indexes varied significantly across the Huangfuchuan watershed from 1980 to 2020 (Figure 3). Except for SDII, other extreme rainfall indexes decreased from southeast to northwest, whereas SDII decreased from northeast to southwest. The trends of extreme rainfall indexes over the 41-year period demonstrated spatial heterogeneity across the watershed. Among the ten stations analyzed for R95p, seven exhibited a decreasing trend. Notably, the Wulangou and Deshengxi stations in the northern part of the watershed showed a significant decreasing trend at α = 0.05. For RX1day, six stations demonstrated a decreasing trend, with only the Wulangou station in the north reaching the significance level (α = 0.05). In the case of RX5day, nine stations displayed a decreasing trend, with the exception of the Xiyingzi station, which showed an increasing trend at a rate of 0.46 mm/10a. However, none of the trends for RX5day were statistically significant at α = 0.05, indicating an overall insignificant trend for this index across all stations. Regarding SDII, seven stations showed a slight increasing trend, with slope changes ranging from 0.01–0.42 mm·d−1·10a−1, while the remaining three stations exhibited a slight decreasing trend. None of the trends for SDII were statistically significant at α = 0.05.

3.2. Change Points of Extreme Rainfall Indexes

The Pettitt test was employed to identify the critical years for changes in extreme rainfall indexes in the Huangfuchuan watershed from 1980 to 2020 (Figure 4). The results indicated that the Pettitt test statistics for all extreme rainfall indexes did not exceed the significance level (α = 0.05). Therefore, no significant change points were detected in the extreme rainfall indexes during the study period, suggesting that these indexes exhibited random fluctuations.

3.3. Trends and Change Points of Sediment Load

From 1980 to 2020, the annual sediment load in the Huangfuchuan watershed exhibited a significant decreasing trend, with a reduction rate of 1.2 million tonnes per year (Figure 5). The MK test yielded a statistic of −4.78, which is significant at the 99% confidence interval, indicating a highly significant decreasing trend in sediment load. The long-term average annual sediment load was 19.6 million tonnes, with the maximum value recorded in 1988 (122 million tonnes) and the minimum value in 2011 (0 million tonnes).
The Pettitt change point test for the annual sediment load series from 1980 to 2020 identified 1998 as the year with the most significant change point, with the lowest test statistic (Figure 6), reaching the significance level (α = 0.05). This finding indicated a significant change in the sediment load time series in 1998, which is close to the results of previous studies in the Huangfuchuan watershed [31]. Before the change point, the average annual sediment load was 35.8 million tonnes, which decreased to 5.6 million tonnes after the change point, reflecting an 84.3% reduction. The Huangfuchuan watershed was designated as one of the eight key national areas for soil erosion control in 1983, and large-scale ecological restoration projects were subsequently initiated [51]. The progressive implementation of these measures led to substantial sediment reduction, making 1998 a pivotal year of significant human intervention in the watershed.

3.4. Impact of Extreme Rainfall on Sediment Load

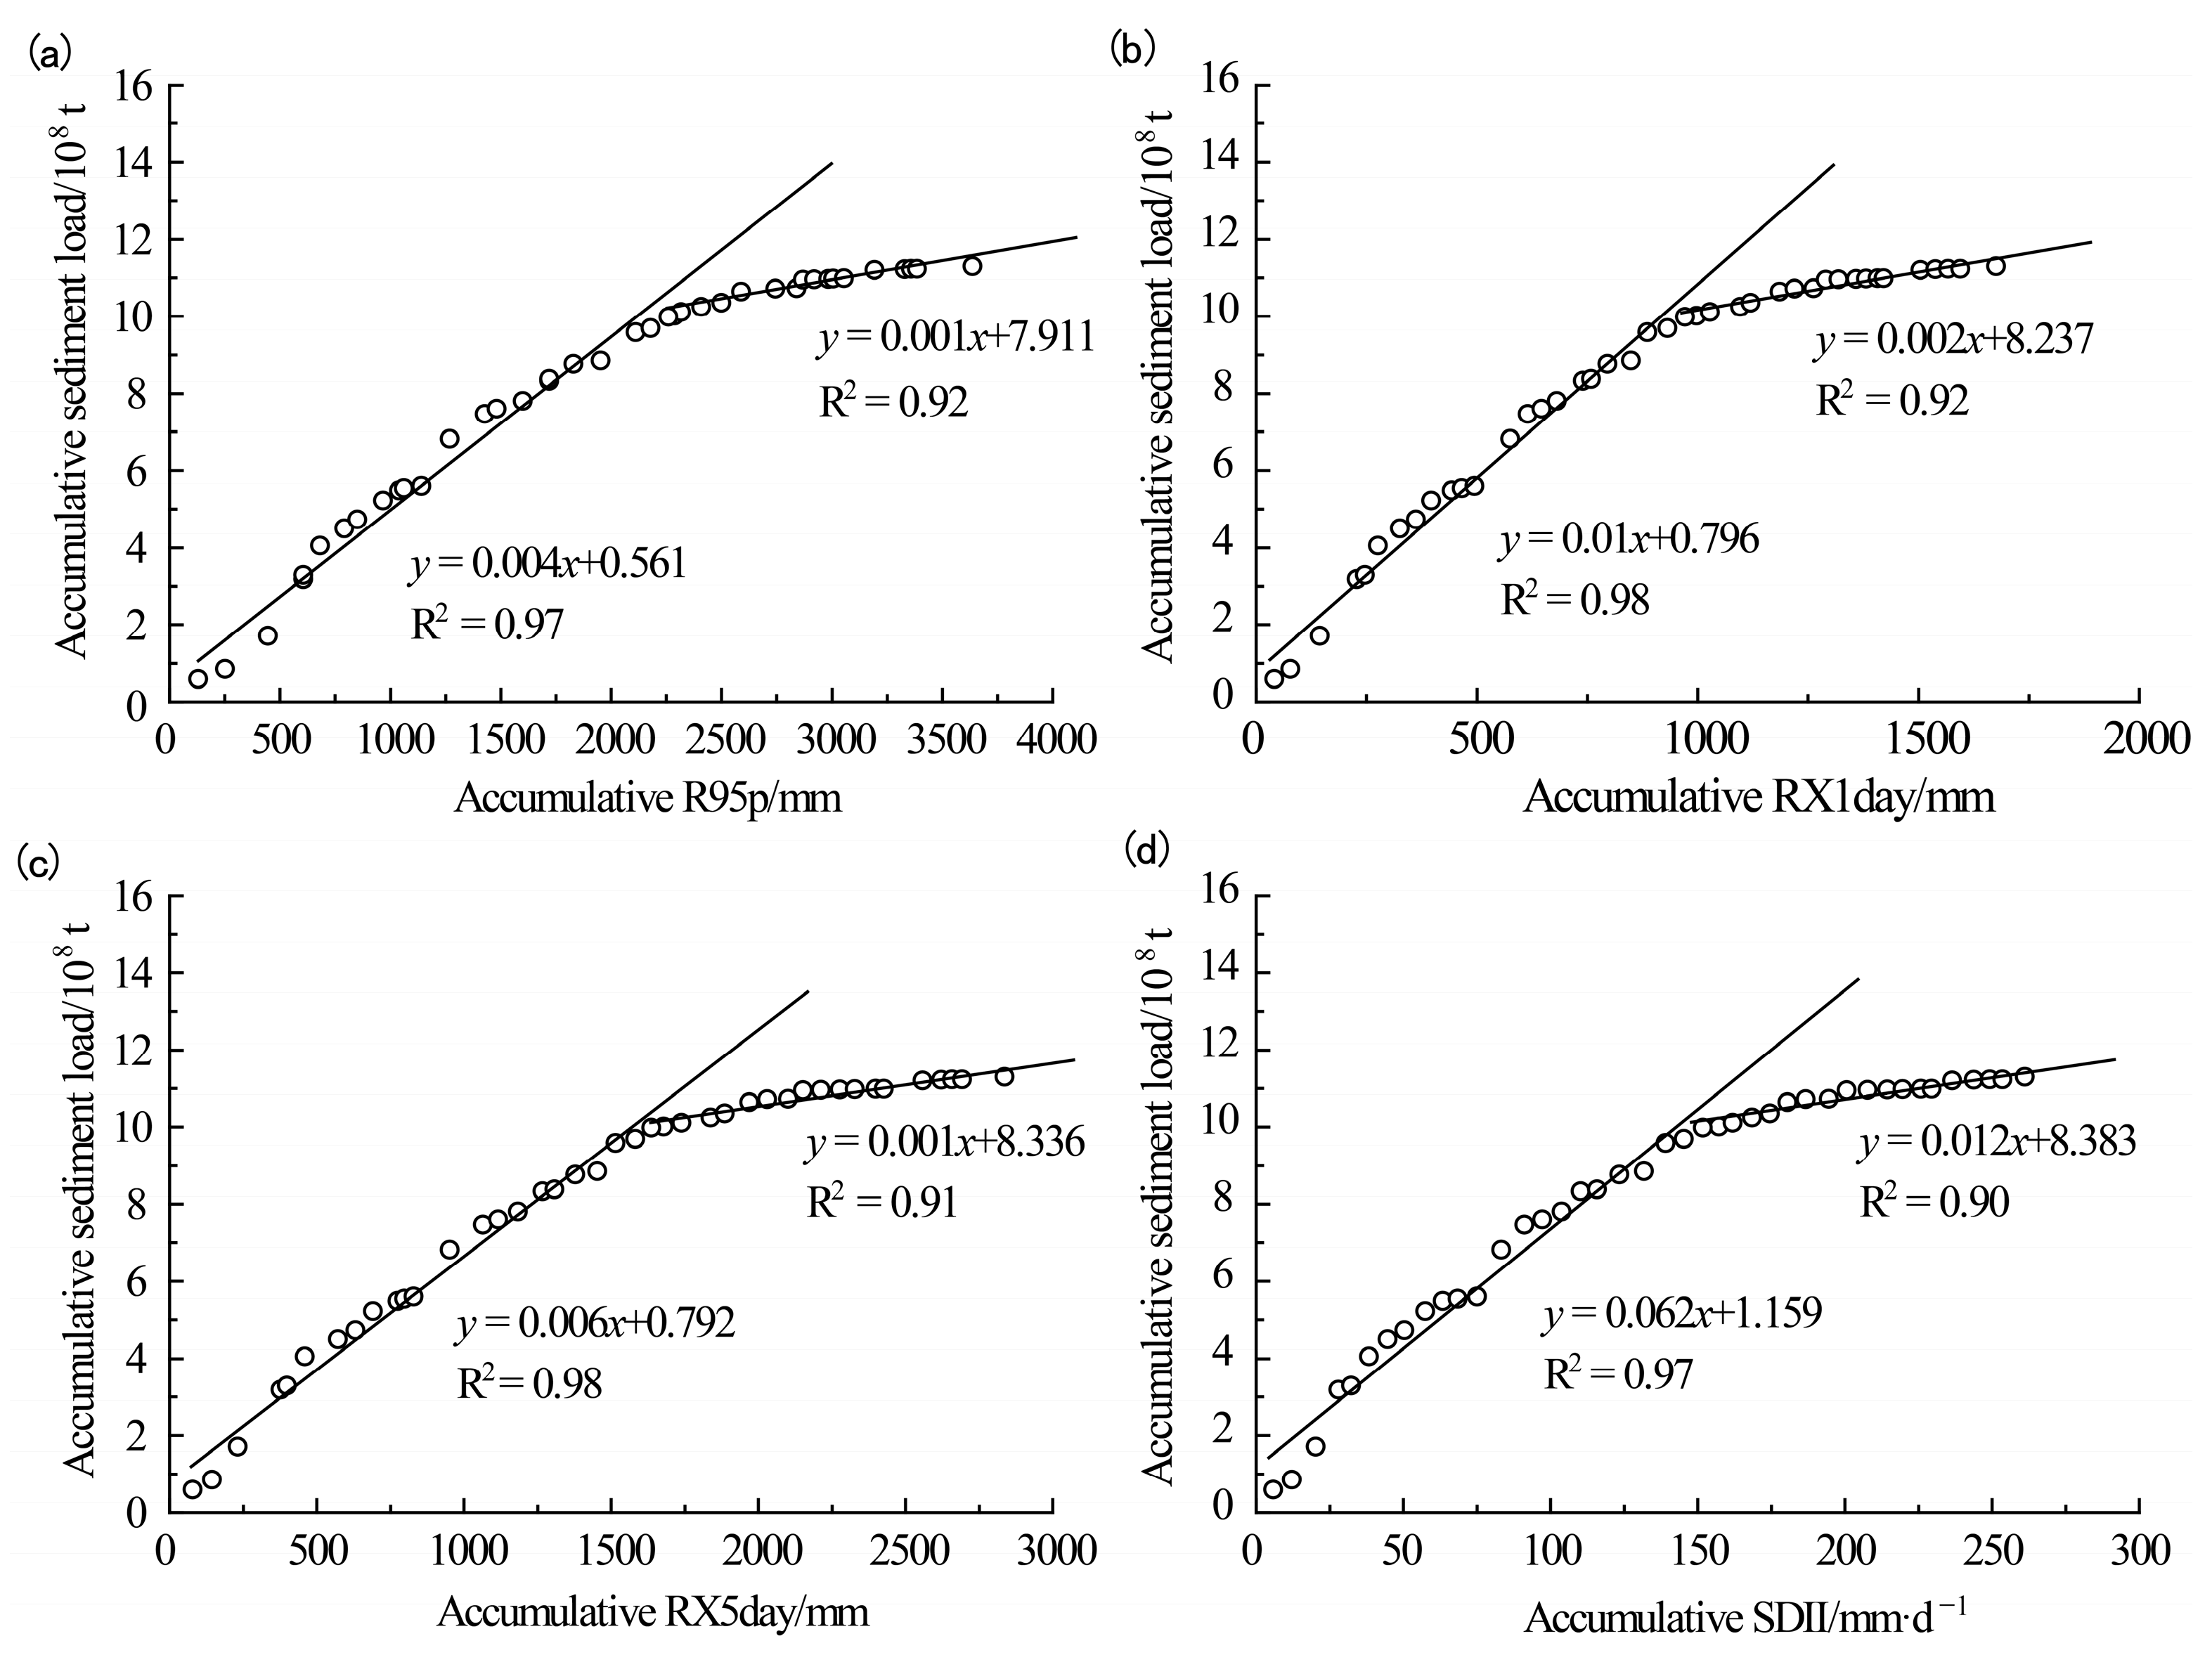
3.4.1. Correlation between Extreme Rainfall Indexes and Sediment Load

To understand the correlation between extreme rainfall indexes and sediment load, the data from different periods were subjected to analysis based on the identified change year in sediment load (Table 2). From 1980 to 2020, significant correlations (p < 0.01) were observed between all extreme rainfall indexes and sediment load in the Huangfuchuan watershed. Before the abrupt change year, the correlation coefficients between the extreme rainfall indexes and sediment load were all greater than 0.576, indicating significant correlations (p < 0.01). However, after the change year, all extreme rainfall indexes except RX1day showed no significant correlation with sediment load, suggesting that, post-1998, these indexes were no longer the primary factors influencing sediment load in the watershed.

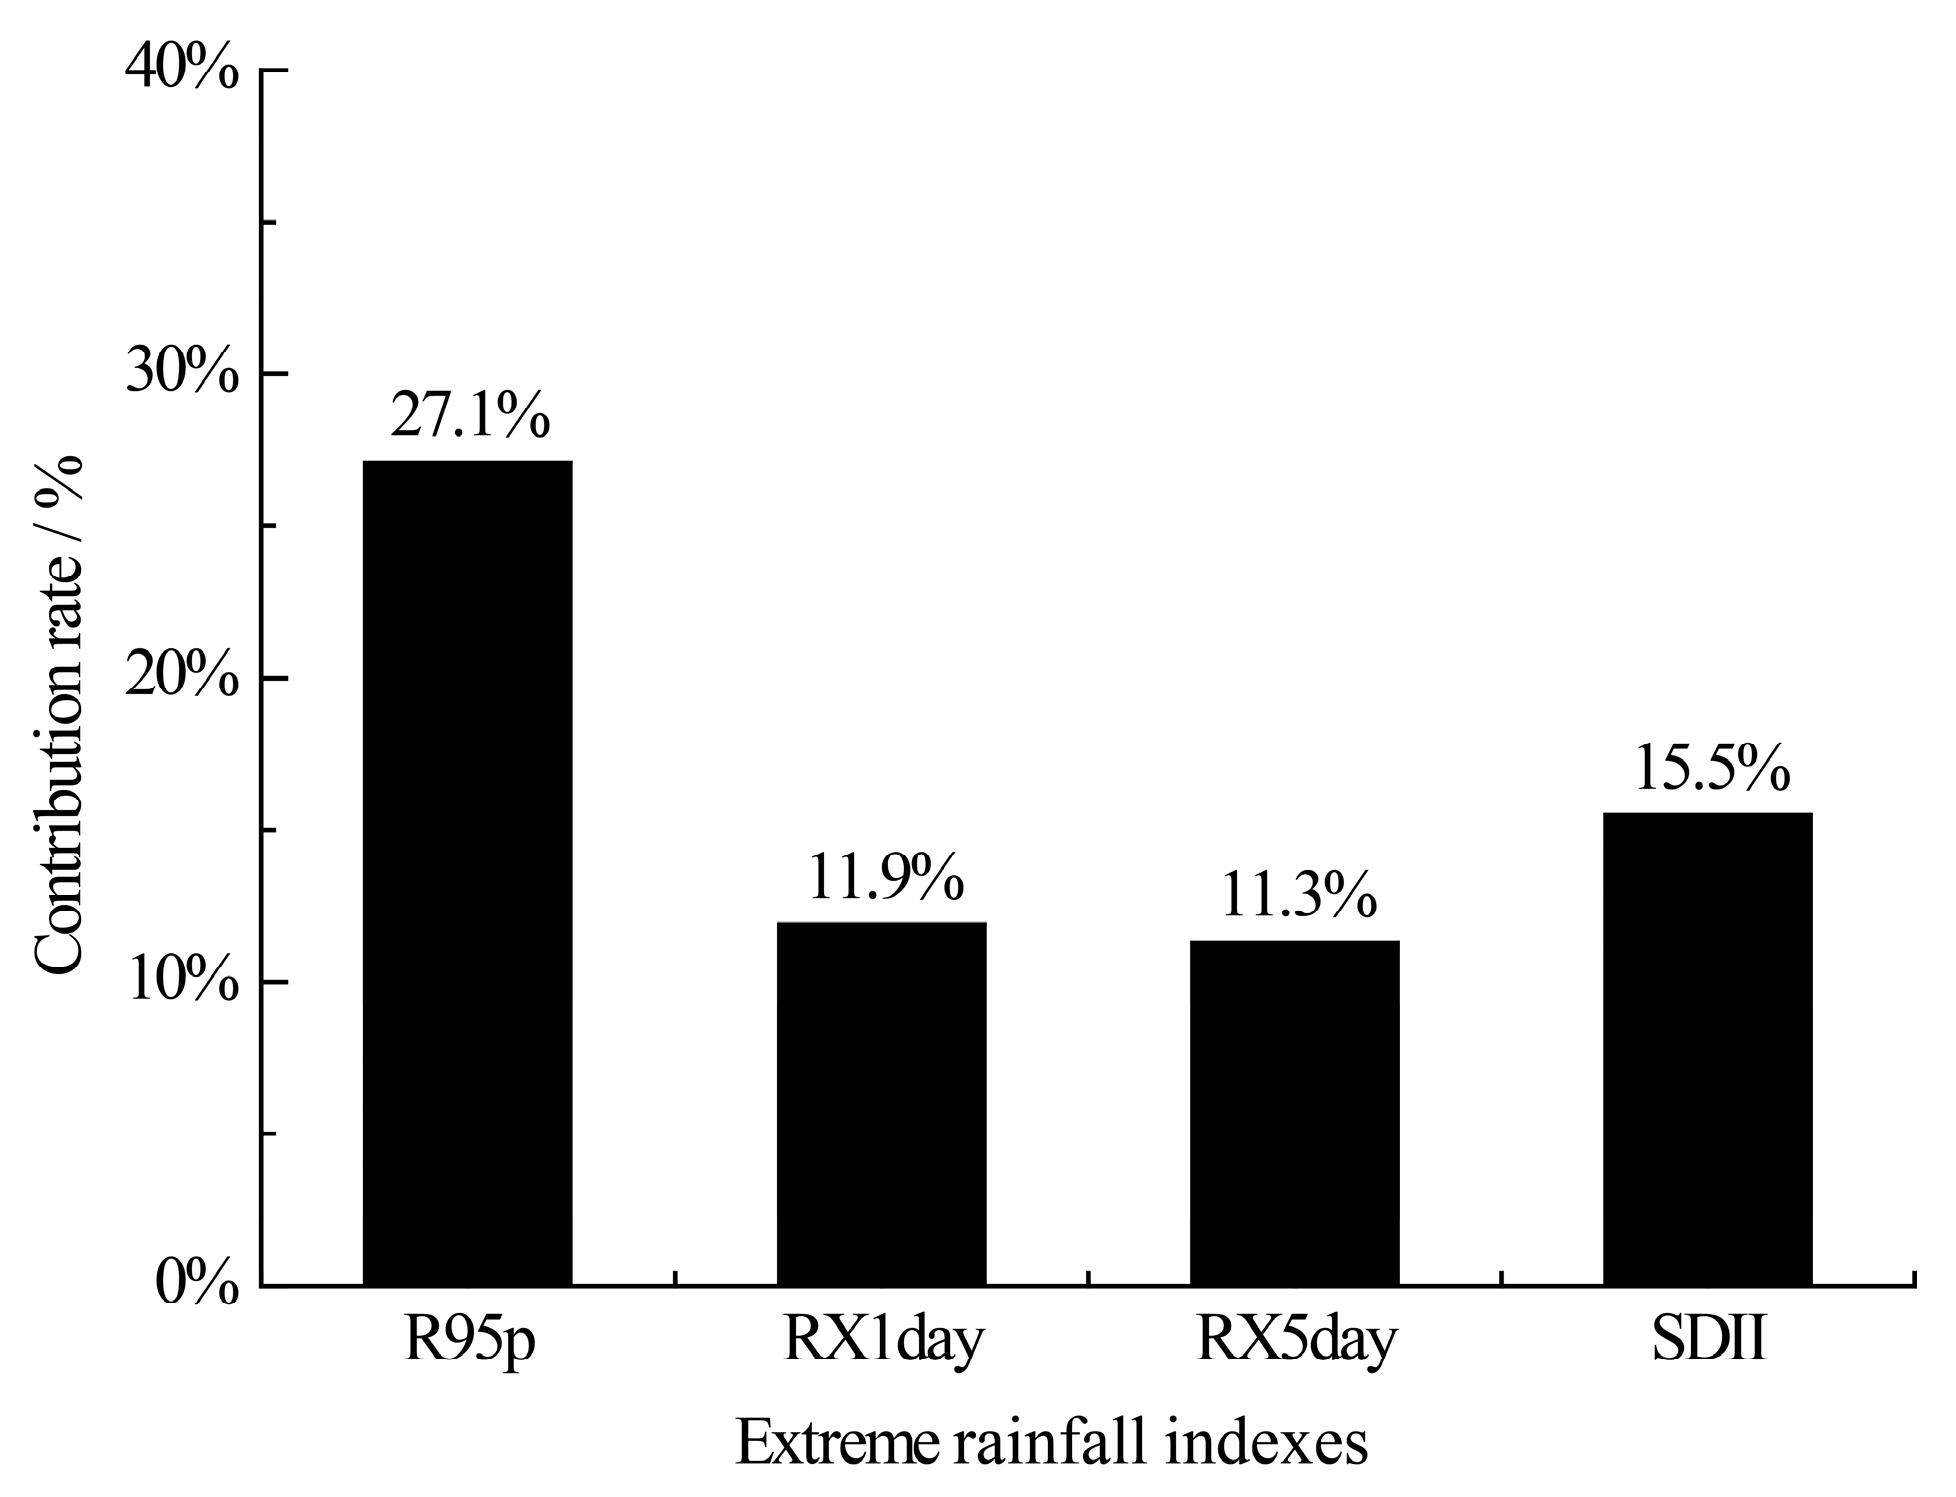
3.4.2. Contribution of Extreme Rainfall to Sediment Load

To quantify the impact of extreme rainfall on sediment load more precisely, the double mass curve analysis was conducted to estimate the influence of changes in extreme rainfall indexes on sediment load before and after the abrupt change year. The double mass curves for each extreme rainfall index and sediment load are depicted in Figure 7. The slopes of these curves showed a significant change before and after the abrupt change year. The theoretical sediment load values for R95p, RX1day, RX5day, and SDII were 33.6 million tonnes, 39.1 million tonnes, 39.3 million tonnes, and 37.8 million tonnes, respectively. The observed sediment load values before and after the abrupt change year were 43.4 million tonnes and 7.3 million tonnes, respectively. The difference in theoretical sediment load before and after the abrupt change year illustrated the impact of extreme rainfall on sediment load.
Figure 8 illustrates the contribution rates of different extreme rainfall indexes to sediment load. Between 1999 and 2020, compared with the period before the abrupt change year, the contribution rates of various extreme rainfall indexes to changes in sediment load in the Huangfuchuan watershed ranged from 11.3% to 27.1%. R95p had the highest contribution rate at 27.1%, followed by SDII at 15.5%, while RX1day and RX5day had smaller contribution rates of 11.9% and 11.3%, respectively.

4. Discussion

This study revealed that all four extreme rainfall indexes contributed less than 30% to the reduction in sediment load in the Huangfuchuan watershed during the post-abrupt change period (1999–2020), suggesting that the primary factors influencing sediment load reduction are other than extreme rainfall, with human activities playing a more significant role. This result is in accordance with the findings of previous studies, which also identified human activities as a crucial factor rather than total annual rainfall [52]. The Huangfuchuan watershed, a major source of coarse sediment for the Yellow River, is characterized by low vegetation cover, loose soil, and severe soil erosion. In 1983, it was designated as a key area for soil erosion control in China. Subsequently, various soil conservation measures, such as the “Grain-to-Green” program and constructing check dams, were implemented, significantly reducing sediment load. Figure 9 shows the annual NDVI values of the Huangfuchuan watershed from 1982 to 2013. The NDVI trend indicated an overall increase, particularly noticeable after 2007. The MK test for NDVI trend significance yielded a rank correlation coefficient of 2.11, reaching the significance level (α = 0.05), demonstrating a significant increase in NDVI. This trend suggests continuous improvement in vegetation density and growth conditions in the watershed. Increased vegetation density enhanced rainfall interception, reduced erosion force, slowed slope flow, and played a crucial role in soil and water conservation by regulating water and sediment dynamics.
Check dams are vital for soil conservation in gully channels. The Huangfuchuan watershed has seen substantial construction of these dams. Figure 10 illustrates the cumulative control area and the amount of sediment retained from 1970 to 2011. Initially, from 1970 to 1986, the cumulative control area of the check dams was 163.2 km2 and the cumulative amount of sediment retained was 13.5 million tonnes. By 1998, the number of dams increased to 149, controlling an area of 1335 km2, which was 41.1% of the total watershed area. The cumulative amount of sediment retained was 96.9 million tonnes, accounting for 14.3% of the total sediment load from 1980 to 1998. The identified change point in the sediment load time series (1998) coincides with the significant increase in dam construction, indicating a crucial factor in the observed sediment load reduction. By 2011, the number of check dams reached 368, controlling 2380.8 km2, or 73.3% of the watershed, and the cumulative amount of sediment retained was 118 million tonnes. These dams fundamentally block sediment transport pathways, raise the erosion base level, reduce gully gradients, mitigate gravitational erosion, and trap channel runoff, thereby decreasing downstream erosion and altering the watershed’s water and sediment dynamics.
Check dams have a direct intercepting effect on sediment loads, with studies suggesting that check dams are the most effective method of intercepting sediment [53,54,55,56]. The initially constructed check dams might have effectively intercepted a large amount of sediment in the short term. However, over time, due to the upper limit of storage capacity being reached, their interception effect gradually weakened. Therefore, check dams need to be combined with other soil and water conservation measures such as vegetation restoration to control soil erosion [57,58]. The Huangfuchuan watershed has undergone a notable increase in vegetation density and the construction of check dams, which may exert an impact on sediment transport. A previous study indicated that various soil and water conservation measures (e.g., afforestation, grassing, terraces, and check dams) played a critical role in runoff and sediment load changes in Huangfuchuan catchments [59]. Moreover, the contribution rates of rainfall change, vegetation restoration, and soil and water conservation measures to the reduction in sediment load were 11.5%, 69.8%, and 18.7%, respectively, during the period of 2000–2015 in the Huangfuchuan watershed [60]. The findings are similar to those of this study. In summary, both extreme rainfall events and human activities have contributed to the reduction in sediment load in the Huangfuchuan watershed, with human activities playing a dominant role.

5. Conclusions

The study applied the Mann–Kendall non-parametric test and Pettitt test to explore the trend and abrupt change characteristics of extreme rainfall and sediment load, and then quantified the contribution rate of extreme rainfall on sediment load based on the double mass curve method in the Huangfuchuan watershed from 1980 to 2020.
This study found that the four extreme rainfall indexes (R95p, RX1day, RX5day, and SDII) in the Huangfuchuan watershed had no significant decreasing trends during 1980–2020. Sediment load showed a significant decreasing trend (p < 0.05), with a notable change point occurring in 1998. Prior to this change point, there was a significant correlation (p < 0.01) between each extreme rainfall index and sediment load. The contribution rates of R95p, RX1day, RX5day, and SDII to the decrease in sediment load during the period 1999–2020 were 27.1%, 11.9%, 11.3%, and 15.5%, respectively. These findings suggest that factors other than extreme rainfall indexes, mainly human activities such as vegetation restoration and the construction of check dams, are the primary drivers of changes in sediment load in the watershed post-1998.
The results are generally consistent with those of some previous studies that have concentrated on the relationship between total rainfall and sediment load. However, our study provides precise spatial and temporal rainfall indexes, mainly extreme rainfall. It is important to acknowledge the limitations of this study. This study does not provide a quantitative differentiation between the effects of vegetation and check dams on sediment load. Instead, the effects are attributed to human activities in general. It would be beneficial for future studies to adopt a more systematic, scientific, and comprehensive theoretical approach to quantitatively analyze the factors influencing sediment load and their interrelationships. This study is helpful to understand the characteristics of environmental evolution in this region, and is important for the sustainable development and comprehensive management of the watersheds.

Funding

This research was financially supported by the Science and Technology Research Project of Jiangxi Provincial Department of Education (No. GJJ2201510).

Institutional Review Board Statement

Not applicable.

Informed Consent Statement

Not applicable.

Data Availability Statement

Restrictions apply to the availability of these data. Data were obtained from the Yellow River Conservancy Commission and are available from the authors with the permission of the Yellow River Conservancy Commission.

Acknowledgments

The author would like to thank the anonymous reviewers and editors for their valuable comments and suggestions. The author would also like to extend special thanks to the National Key Research and Development Program of China and the 2021 PhD Research Startup Foundation of the Nanchang Institute of Technology.

Conflicts of Interest

The author declares no conflicts of interest.

References

  1. O’Gorman, P.A. Precipitation Extremes Under Climate Change. Curr. Clim. Chang. Rep. 2015, 1, 49–59. [Google Scholar] [CrossRef] [PubMed]
  2. Donat, M.G.; Lowry, A.L.; Alexander, L.V.; O’Gorman, P.A.; Maher, N. More extreme precipitation in the world’s dry and wet regions. Nat. Clim. Chang. 2016, 6, 508–513. [Google Scholar] [CrossRef]
  3. Gu, X.; Zhang, Q.; Kong, D. Spatiotemporal patterns of extreme precipitation with their responses to summer temperature. Acta Geogr. Sin. 2016, 71, 718–730. (In Chinese) [Google Scholar]
  4. Flanagan, P.X.; Mahmood, R.; Umphlett, N.A.; Haacker, E.; Ray, C.; Sorensen, W.; Shulski, M.; Stiles, C.J.; Pearson, D.; Fajman, P. A Hydrometeorological Assessment of the Historic 2019 Flood of Nebraska, Iowa, and South Dakota. Bull. Am. Meteorol. Soc. 2020, 101, E817–E829. [Google Scholar] [CrossRef]
  5. Vu, T.M.; Mishra, A.K. Nonstationary frequency analysis of the recent extreme precipitation events in the United States. J. Hydrol. 2019, 575, 999–1010. [Google Scholar] [CrossRef]
  6. Fekete, A.; Sandholz, S. Here Comes the Flood, but Not Failure? Lessons to Learn after the Heavy Rain and Pluvial Floods in Germany 2021. Water 2021, 13, 3016. [Google Scholar] [CrossRef]
  7. Guo, X.; Cheng, J.; Yin, C.; Li, Q.; Chen, R.; Fang, J. The extraordinary Zhengzhou flood of 7/20, 2021: How extreme weather and human response compounding to the disaster. Cities 2023, 134, 104168. [Google Scholar] [CrossRef]
  8. Tabari, H. Climate change impact on flood and extreme precipitation increases with water availability. Sci. Rep. 2020, 10, 13768. [Google Scholar] [CrossRef]
  9. Sun, Q.H.; Zhang, X.B.; Zwiers, F.; Westra, S.; Alexander, L. A Global, Continental, and Regional Analysis of Changes in Extreme Precipitation. J. Clim. 2021, 34, 243–258. [Google Scholar] [CrossRef]
  10. Chaubey, P.K.; Mall, R.K.; Srivastava, P.K. Changes in Extremes Rainfall Events in Present and Future Climate Scenarios over the Teesta River Basin, India. Sustainability 2023, 15, 4668. [Google Scholar] [CrossRef]
  11. King, A.D.; Reid, K.J.; Saunders, K.R. Communicating the link between climate change and extreme rain events. Nat. Geosci. 2023, 16, 552–554. [Google Scholar] [CrossRef]
  12. Chen, W.; Liu, J.; Peng, W.; Zhao, Y.; Luo, S.; Wan, W.; Wu, Q.; Wang, Y.; Li, S.; Tang, X.; et al. Aging deterioration of mechanical properties on coal-rock combinations considering hydro-chemical corrosion. Energy 2023, 282, 128770. [Google Scholar] [CrossRef]
  13. Duan, J.; Liu, Y.-J.; Yang, J.; Tang, C.-J.; Shi, Z.-H. Role of groundcover management in controlling soil erosion under extreme rainfall in citrus orchards of southern China. J. Hydrol. 2019, 582, 124290. [Google Scholar] [CrossRef]
  14. Bian, Z.; Sun, G.; McNulty, S.; Pan, S.; Tian, H. Understanding the Shift of Drivers of Soil Erosion and Sedimentation Based on Regional Process-Based Modeling in the Mississippi River Basin during the Past Century. Water Resour. Res. 2023, 59, e2023WR035377. [Google Scholar] [CrossRef]
  15. Makhtoumi, Y.; Abbasi, A.; Seyedmakhtoom, B.; Ibeanusi, V.; Chen, G. Evaluating soil loss under land use management and extreme rainfall. J. Contam. Hydrol. 2023, 256, 104181. [Google Scholar] [CrossRef] [PubMed]
  16. Chen, W.; Wan, W.; Zhao, Y.; He, H.; Wu, Q.; Zhou, Y.; Xie, S. Mechanical damage evolution and mechanism of sandstone with prefabricated parallel double fissures under high-humidity condition. Bull. Eng. Geol. Environ. 2022, 81, 245. [Google Scholar] [CrossRef]
  17. Zhang, T.; Li, D.; East, A.E.; Kettner, A.J.; Best, J.; Ni, J.; Lu, X. Shifted sediment-transport regimes by climate change and amplified hydrological variability in cryosphere-fed rivers. Sci. Adv. 2023, 9, eadi5019. [Google Scholar] [CrossRef]
  18. Osterkamp, W.R.; Friedman, J.M.J.H.P. The disparity between extreme rainfall events and rare floods-with emphasis on the semi-arid American West. Hydrol. Process. 2000, 14, 2817–2829. [Google Scholar] [CrossRef]
  19. Jian, S.; Yin, C.; Wang, Y.; Yu, X.; Li, Y. The Possible Incoming Runoff under Extreme Rainfall Event in the Fenhe River Basin. Front. Environ. Sci. 2022, 10, 812351. [Google Scholar] [CrossRef]
  20. Zhong, K.; Zheng, F.; Liu, G.; Zhang, X.; Qin, C.; Xu, X. Effects of variations in precipitation extremes on sediment load in the Second Songhua River Basin, Northeast China. J. Soils Sediments 2023, 23, 1971–1984. [Google Scholar] [CrossRef]
  21. Xu, Z.; Zhang, S.; Yang, X. Water and sediment yield response to extreme rainfall events in a complex large river basin: A case study of the Yellow River Basin, China. J. Hydrol. 2021, 597, 126183. [Google Scholar] [CrossRef]
  22. Chen, W.; Liu, J.; Liu, W.; Peng, W.; Zhao, Y.; Wu, Q.; Wang, Y.; Wan, W.; Li, S.; Peng, H.; et al. Lateral deformation and acoustic emission characteristics of dam bedrock under various river flow scouring rates. J. Mater. Res. Technol. 2023, 26, 3245–3271. [Google Scholar] [CrossRef]
  23. Zhang, J.; Gao, G.; Fu, B.; Gupta, H.V. Investigation of the relationship between precipitation extremes and sediment discharge production under extensive land cover change in the Chinese Loess Plateau. Geomorphology 2020, 361, 107176. [Google Scholar] [CrossRef]
  24. Zhong, K.; Zheng, F.; Wu, H.; Qin, C. Effects of Precipitation Extremes Change on Sediment Load in Songhua River Basin. Trans. Chin. Soc. Agric. Mach. 2017, 48, 245–252. (In Chinese) [Google Scholar]
  25. Zhang, Y.; Tian, P.; Yang, L.; Zhao, G.; Mu, X.; Wang, B.; Du, P.; Gao, P.; Sun, W. Relationship between sediment load and climate extremes in the major Chinese rivers. J. Hydrol. 2023, 617, 128962. [Google Scholar] [CrossRef]
  26. Zhao, Y.; Cao, W.; Hu, C.; Wang, Y.; Wang, Z.; Zhang, X.; Zhu, B.; Cheng, C.; Yin, X.; Liu, B.; et al. Analysis of changes in characteristics of flood and sediment yield in typical basins of the Yellow River under extreme rainfall events. CATENA 2019, 177, 31–40. [Google Scholar] [CrossRef]
  27. Hu, C. The change mechanism and trend prediction of water and sediment in Yellow River Basin. Chin. J. Environ. Manag. 2018, 10, 97–98. (In Chinese) [Google Scholar]
  28. Kong, D.; Miao, C.; Gou, J.; Zhang, Q.; Su, T. Sediment reduction in the middle Yellow River basin over the past six decades: Attribution, sustainability, and implications. Sci. Total Environ. 2023, 882, 163475. [Google Scholar] [CrossRef]
  29. Ren, D.; Liu, S.; Wu, Y.; Xiao, F.; Patil, S.D.; Dallison, R.J.H.; Feng, S.; Zhao, F.; Qiu, L.; Wang, S.; et al. Quantifying natural and anthropogenic impacts on streamflow and sediment load reduction in the upper to middle Yellow River Basin. J. Hydrol. Reg. Stud. 2024, 53, 101788. [Google Scholar] [CrossRef]
  30. Li, H.; Ping, J.; Liu, C.; Zhang, M.; Liu, J. Changes in sediment load in the Lower Yellow River and its driving factors from 1919 to 2021. Sci. Total Environ. 2024, 946, 174012. [Google Scholar] [CrossRef]
  31. Yao, J.; Li, Z.; Yao, W.; Xiao, P.; Zhang, P.; Xie, M.; Wang, J.; Mei, S. The Compound Response Relationship between Hydro-Sedimentary Variations and Dominant Driving Factors: A Case Study of the Huangfuchuan basin. Sustainability 2023, 15, 13632. [Google Scholar] [CrossRef]
  32. Zhang, Y.; He, Y.; Song, J. Effects of climate change and land use on runoff in the Huangfuchuan Basin, China. J. Hydrol. 2023, 626, 130195. [Google Scholar] [CrossRef]
  33. Li, E.; Mu, X.; Zhao, G.; Gao, P.; Sun, W. Effects of check dams on runoff and sediment load in a semi-arid river basin of the Yellow River. Stochastic Environ. Res. Risk Assess. 2017, 31, 1791–1803. [Google Scholar] [CrossRef]
  34. Huang, X.; Qiu, L. Characteristic Analysis and Uncertainty Assessment of the Joint Distribution of Runoff and Sediment: A Case Study of the Huangfuchuan River Basin, China. Water 2023, 15, 2644. [Google Scholar] [CrossRef]
  35. Xie, M.Y.; Ren, Z.P.; Li, Z.B.; Li, P.; Shi, P.; Zhang, X.M. Changes in runoff and sediment load of the Huangfuchuan River following a water and soil conservation project. J. Soil Water Conserv. 2020, 75, 590–600. [Google Scholar] [CrossRef]
  36. Liu, Q.; Yu, F.; Chang, K.; Wang, R.; Jing, Y.; Mu, X. Characteristics of water and sediment variation in the Huangfuchuan basin and its influencing factors. Arid Zone Res. 2021, 38, 1506–1513. (In Chinese) [Google Scholar]
  37. Cao, Z.; Li, Y.; Liu, Y.; Chen, Y.; Wang, Y. When and where did the Loess Plateau turn “green”? Analysis of the tendency and breakpoints of the normalized difference vegetation index. Land Degrad. Dev. 2018, 29, 162–175. [Google Scholar] [CrossRef]
  38. Liu, Y.; Wang, F.; Lin, Y.; Cao, L.; Zhang, S.; Ge, W.; Han, J.; Chen, H.; Shi, S. Assessing the contributions of human activities to runoff and sediment transport change: A method for break point identification in double mass curves based on model fitting. J. Hydrol. Reg. Stud. 2023, 50, 101589. [Google Scholar] [CrossRef]
  39. Chu, H.; Wei, J.; Qiu, J.; Li, Q.; Wang, G. Identification of the impact of climate change and human activities on rainfall-runoff relationship variation in the Three-River Headwaters region. Ecol. Indic. 2019, 106, 105516. [Google Scholar] [CrossRef]
  40. Seenu, P.Z.; Jayakumar, K.V. Comparative study of innovative trend analysis technique with Mann-Kendall tests for extreme rainfall. Arabian J. Geosci. 2021, 14, 536. [Google Scholar] [CrossRef]
  41. Agbo, E.P.; Nkajoe, U.; Edet, C.O. Comparison of Mann–Kendall and Şen’s innovative trend method for climatic parameters over Nigeria’s climatic zones. Clim. Dyn. 2023, 60, 3385–3401. [Google Scholar] [CrossRef]
  42. Gumus, V.; Avsaroglu, Y.; Simsek, O. Streamflow trends in the Tigris river basin using Mann−Kendall and innovative trend analysis methods. J. Earth Syst. Sci. 2022, 131, 34. [Google Scholar] [CrossRef]
  43. Ryberg, K.R.; Hodgkins, G.A.; Dudley, R.W. Change points in annual peak streamflows: Method comparisons and historical change points in the United States. J. Hydrol. 2020, 583, 124307. [Google Scholar] [CrossRef]
  44. Yacoub, E.; Tayfur, G. Trend analysis of temperature and precipitation in Trarza region of Mauritania. J. Water Clim. Chang. 2019, 10, 484–493. [Google Scholar] [CrossRef]
  45. Pettitt, A.N. A Non-Parametric Approach to the Change-Point Problem. J. R. Stat. Soc. C 1979, 28, 126–135. [Google Scholar] [CrossRef]
  46. Mallakpour, I.; Villarini, G. A simulation study to examine the sensitivity of the Pettitt test to detect abrupt changes in mean. Hydrol. Sci. J. 2016, 61, 245–254. [Google Scholar] [CrossRef]
  47. Wu, Y.; Fang, H.; Huang, L.; Ouyang, W. Changing runoff due to temperature and precipitation variations in the dammed Jinsha River. J. Hydrol. 2020, 582, 124500. [Google Scholar] [CrossRef]
  48. Wang, X.; He, K.; Li, Y.; Wang, H. Estimation of the effects of climate change and human activities on runoff in different time scales in the Beichuan River Basin, China. Hum. Ecol. Risk Assess. Int. J. 2020, 26, 103–119. [Google Scholar] [CrossRef]
  49. Shao, Y.; Mu, X.; He, Y.; Chen, K.-m. Variations in runoff, sediment load, and their relationship for a major sediment source area of the Jialing River basin, southern China. Hydrol. Process. 2021, 35, e14297. [Google Scholar] [CrossRef]
  50. Mu, X.; Zhang, X.; Shao, H.; Gao, P.; Wang, F.; Jiao, J.; Zhu, J. Dynamic Changes of Sediment Discharge and the Influencing Factors in the Yellow River, China, for the Recent 90 Years. CLEAN Soil Air Water 2012, 40, 303–309. [Google Scholar] [CrossRef]
  51. Huang, X.; Qiu, L. Analysis of runoff variation and driving mechanism in Huangfuchuan River Basin in the middle reaches of the Yellow River, China. Appl. Water Sci. 2022, 12, 234. [Google Scholar] [CrossRef]
  52. Zhao, H.; Yang, S.; Yang, B.; Huang, Y. Quantifying anthropogenic and climatic impacts on sediment load in the sediment-rich region of the Chinese Loess Plateau by coupling a hydrological model and ANN. Stoch. Environ. Res. Risk Assess. 2017, 31, 2057–2073. [Google Scholar] [CrossRef]
  53. Boix-Fayos, C.; Barberá, G.G.; López-Bermúdez, F.; Castillo, V.M. Effects of check dams, reforestation and land-use changes on river channel morphology: Case study of the Rogativa catchment (Murcia, Spain). Geomorphology 2007, 91, 103–123. [Google Scholar] [CrossRef]
  54. Chen, W.; Wan, W.; He, H.; Liao, D.; Liu, J. Temperature Field Distribution and Numerical Simulation of Improved Freezing Scheme for Shafts in Loose and Soft Stratum. Rock Mech. Rock Eng. 2024, 57, 2695–2725. [Google Scholar] [CrossRef]
  55. Lucas-Borja, M.E.; Piton, G.; Yu, Y.; Castillo, C.; Antonio Zema, D. Check dams worldwide: Objectives, functions, effectiveness and undesired effects. CATENA 2021, 204, 105390. [Google Scholar] [CrossRef]
  56. Shi, P.; Zhang, Y.; Ren, Z.; Yu, Y.; Li, P.; Gong, J. Land-use changes and check dams reducing runoff and sediment yield on the Loess Plateau of China. Sci. Total Environ. 2019, 664, 984–994. [Google Scholar] [CrossRef]
  57. Zhao, G.; Kondolf, G.M.; Mu, X.; Han, M.; He, Z.; Rubin, Z.; Wang, F.; Gao, P.; Sun, W. Sediment yield reduction associated with land use changes and check dams in a catchment of the Loess Plateau, China. CATENA 2017, 148, 126–137. [Google Scholar] [CrossRef]
  58. Ren, Z.; Ma, X.; Wang, K.; Li, Z. Effects of Extreme Precipitation on Runoff and Sediment Yield in the Middle Reaches of the Yellow River. Atmosphere 2023, 14, 1415. [Google Scholar] [CrossRef]
  59. Zhao, G.; Yue, X.; Tian, P.; Mu, X.; Xu, W.; Wang, F.; Gao, P.; Sun, W. Comparison of the Suspended Sediment Dynamics in Two Loess Plateau Catchments, China. Land Degrad. Dev. 2017, 28, 1398–1411. [Google Scholar] [CrossRef]
  60. Shang, H.; Hu, C.; Xia, J.; Zhou, M. Contributions of Rainfall and Soil and Water Conservation to the Variation in Sediment Discharge of the Huangfuchuan River Basin. J. Soil Water Conserv. 2023, 37, 199–207. (In Chinese) [Google Scholar] [CrossRef]
Figure 1. Location of the Huangfuchuan watershed and the distribution of rainfall stations and hydrological stations.
Sustainability 16 07457 g001
Figure 2. Trends of R95p (a), RX1day (b), RX5day (c), and SDII (d) in the Huangfuchuan watershed from 1980 to 2020, respectively.
Sustainability 16 07457 g002
Figure 3. Spatial distribution characteristics of R95p (a), RX1day (b), RX5day (c), and SDII (d) in the Huangfuchuan watershed.
Sustainability 16 07457 g003
Figure 4. Pettitt change point test results for R95p (a), RX1day (b), RX5day (c), and SDII (d) in the Huangfuchuan watershed.
Sustainability 16 07457 g004
Figure 5. Changes in annual sediment load in the Huangfuchuan watershed from 1980 to 2020.
Sustainability 16 07457 g005
Figure 6. Pettitt change point test results for sediment load in the Huangfuchuan watershed from 1980 to 2020.
Sustainability 16 07457 g006
Figure 7. Double mass curves of extreme rainfall indexes and sediment load in the Huangfuchuan watershed (1980–2020): (a) R95p, (b) RX1day, (c) RX5day, (d) SDII.
Sustainability 16 07457 g007
Figure 8. Contribution rates of various extreme rainfall indexes to sediment load in the Huangfuchuan watershed.
Sustainability 16 07457 g008
Figure 9. Annual NDVI variation in the Huangfuchuan watershed (1982–2013).
Sustainability 16 07457 g009
Figure 10. Changes in the amount of sediment retained and accumulative dam areas of check dams in the Huangfuchuan watershed (1970–2011).
Sustainability 16 07457 g010
Table 1. Extreme rainfall indexes.
Extreme Rainfall IndexesUnitsDefinition
Extreme rainfall amount (R95p)mmAnnual total rainfall when daily rainfall > 95th Percentile
Max 1-day rainfall amount (RX1day)mmMonthly maximum 1-day rainfall
Max 5-day rainfall amount (RX5day)mmMonthly maximum consecutive 5-day rainfall
Simple rainfall intensity index (SDII)mm/dAnnual total rainfall divided by the number of wet days (daily rainfall ≥ 1 mm) in the year
Table 2. Correlation coefficients between extreme rainfall and sediment load.
Extreme Rainfall Indexes1980–20201980–19981999–2020
R95p0.504 **0.674 **0.247
Rx1day0.548 **0.763 **0.576 *
Rx5day0.570 **0.779 **0.462
SDII0.477 **0.576 **0.152
** Correlation is significant at the 0.01 level, and the threshold values of the significant correlation for the periods of 1980–2020, 1980–1998, and 1999–2020 were 0.398, 0.526, and 0.590, respectively. * Correlation is significant at the 0.05 level, and the threshold values of the significant correlation for the periods of 1980–2020, 1980–1998, and 1999–2020 were 0.308, 0.413, and 0.468, respectively.
Disclaimer/Publisher’s Note: The statements, opinions and data contained in all publications are solely those of the individual author(s) and contributor(s) and not of MDPI and/or the editor(s). MDPI and/or the editor(s) disclaim responsibility for any injury to people or property resulting from any ideas, methods, instructions or products referred to in the content.

