Abstract
This study tested the effectiveness of participatory methods to engage primary school communities in London with air pollution issues to help them identify, understand, and reduce their air pollution exposure. Three primary schools with high pollution levels participated in environmental educational activities, including air quality workshops and field campaigns involving different methods, time schedules, and project scopes. Participants completed surveys before and after these activities to measure their understanding, perceptions, and behavior. After the workshops, students admitted feeling more skillful in monitoring air quality and confident in incorporating this education into daily life and teaching others. They shared their results with peers, school leadership, and the community and led campaigns to help design experiments, choose measurement locations, and reduce air pollution exposure in schools. The results showed increased concern about air pollution, a better understanding of its causes and impacts, and more reported reduction behaviors. An Air Pollution Exposure Index (APEI) was combined with participatory monitoring data to raise awareness and understanding among students on typical school-day exposure. Feedback indicates that the tool was useful in defining air pollution exposure status and identifying exposure risks. Overall, this study contributes to the evidence of the feasibility and impact of student-led environmental education interventions These interventions involve collecting personalized exposure data, co-planning mitigations with school community groups, and employing methods to raise awareness of air pollution and empower pupils to identify potential solutions and change behaviors.
1. Introduction
More than 90% of children worldwide attend schools where air pollution levels exceed World Health Organization (WHO) limits [1]. This issue is especially severe in large cities like London, where >98% of primary schools are where pollution levels, particularly from traffic, are at their worst [2]. About 700,000 children attend these London schools, and the health consequences of such extensive exposure are concerning, given the absence of definitive proof regarding a safe level of exposure [1,3,4]. Air pollution can exacerbate respiratory diseases and behavioral problems, negatively impact cognitive function and academic performance in children, and even cause death [5,6,7,8]. With their high breathing rates and still-developing lungs and brains, children are exposed to far more pollution than adults at and on their way to school [9,10]. Since many children are exposed to air pollution while at school and during their commutes, strong actions to protect the most vulnerable are needed, as well as environmental education interventions aiming to promote awareness of the risk.
In response to the threat of air pollution and a lack of action by authorities, many primary schools are implementing strategies like tree planting, road closures during pick-up/drop-off times, clean-air zones, and air quality campaigns to protect children and raise awareness [11,12,13,14,15,16,17]. Despite these efforts, many schools still exceed the WHO’s safe air-pollution limit, and public awareness remains low. Children often lack the knowledge or ability to take action to protect themselves and struggle to interpret or act on air quality information [18]. So, working with school communities to empower them with engaging and effective tools to understand their exposure to air pollution can enhance their confidence, competence, control, and willingness to act [19,20]. This research tests participatory methods to engage primary school communities with the issue of air pollution to enable them to identify, understand, and reduce their exposure to the pollution in their school and surrounding urban environment.
This study brings together environmental education, natural, social, and behavioral science approaches to engage primary school communities with the issue of air pollution to enable them to identify, understand, and reduce pollution exposure in their school and surrounding urban environment. We set out to (1) co-develop educational activities that use different schedules (air quality education workshops and field campaigns) to increase understanding and empower school students to engage with air pollution and act; and (2) to evaluate how each activity influenced students’ understanding, perceptions, and behavior. The study goes on to combine a novel Air Pollution Exposure Index (APEI) framework developed by [21] with participatory air pollution data from one of the participating schools. This was performed to demonstrate the effectiveness of the tool in identifying varying exposure situations in a school setting and the potential for school communities involved in designing air pollution interventions to make changes to behavior or timing of activities (e.g., encouraging pupils not to use the games area during peak times of the day and/or changing the time of school break) using the exposure data.
2. Literature Review
2.1. Participatory Methods in Air Pollution Science
The use of participatory methods in air pollution science to engage with individuals and create social sustainability projects is not new [22,23,24,25,26,27,28,29]. Children have also been involved in some of these studies through environmental education projects, where they gain knowledge about the environment and contribute to scientific investigations [30,31,32,33,34,35,36]. Research conducted with school students suggests that young individuals who are aware of environmental issues [37,38] tend to exhibit responsible ecological behavior [39] and have the ability to influence the perceptions and actions of others [40,41,42]. Several systematic reviews conducted on environmental education programs involving young people (including those focused on air quality) have, however, indicated a lack of active participation of young people in the research process [43,44,45,46].
In most cases, teachers and other school staff led the programs (55 studies, 85%, e.g., [31,47,48,49,50,51]), some had students and teachers either travel to participate in programs led by environmental education program provider staff or vice versa (8 studies, 12%, e.g., [32,48,52,53]), others mentioned the involvement of parents and caregivers as facilitators (7 studies, 11%, such as [54,55,56,57]) or researchers (e.g., [58,59,60,61]), and/or students assisted with implementing the program (5 studies, 8%, e.g., [62,63]). From the literature, we noted that only a few traditional environmental education programs focus on air quality and employ a participatory approach to raising children’s awareness and engagement in identifying and solving air pollution problems. Some of the studies have used citizen science projects to effectively engage primary school students in monitoring air quality. They achieved this by using low-cost sensors that the students either constructed themselves or were provided with [24,25,29,48,62,64,65,66,67,68,69]. Others have used active and passive samplers to measure air quality in schools and along students’ travel routes to and from school [66,68,70]. These studies also provide toolkits and educational resources to children about the health and environmental impacts of air pollution and encourage them to help combat it. Even though previous studies have involved school children in various ways, most were led by experts, and the students played a contributory role, with varying scientific, educational, and engagement goals. They also have a relatively short sampling period of not more than one week. In summary, the lack of true empowerment among the children to assume ownership and responsibility in the creation of scientific knowledge was evident in past studies.
This informed the need to initiate a student-led scientific research initiative where researchers offered support. The students designed experiments; selected measurement locations; proposed strategies to reduce pollution exposure in their schools; and educated their peers, school leadership, and the broader community on how to protect themselves from air pollution. Evidence of this approach’s feasibility and impact on the knowledge and perceptions of others is, also, however, lacking. We partnered with Trees for Cities, a major UK Charity focused on tree planting to protect and promote quality outdoor space, to engage some of the worst polluted London schools, to introduce the pupils (aged 6–12 years) to scientific research, raise their awareness of air pollution risks, and increase their understanding of local sources of pollution and barriers to mitigation while finding alternative approaches (i.e., changes in behavior) to reduce exposure (by reducing the times children are exposed to high pollution during the day). We used a participatory research survey approach to monitoring air pollution and mitigation planning, with a relatively longer sampling period than previous studies. This helped to understand how school children are exposed to air pollution and how using a citizen science approach to collect and interpret data could raise their awareness of air pollution and empower them to identify potential solutions and share their results with others. The uniqueness of this study lies in its co-creation and co-design approaches, which are adaptable and applicable globally.
2.2. The Impact of Outdoor Air Pollution on Indoor Air Quality in Schools
The WHO describes air pollution as “the contamination of the indoor or outdoor environment by any chemical, physical, or biological agent that alters the natural characteristics of the atmosphere” [71]. Air pollutants are classified into primary and secondary pollutants. Primary pollutants, such as volatile organic compounds (VOCs), carbon monoxide (CO), nitrogen oxides (NOx), sulfur dioxide (SO2), lead, and particulate matter (PM), are emitted directly into the atmosphere by specific sources like motor vehicles, industrial facilities, and combustion devices [45,72].
In contrast, secondary pollutants form when primary pollutants react with atmospheric gases. For instance, NOx can produce nitric acid (HNO3); SO2 can produce sulfuric acid (H2SO2); and ozone (O3) is produced through chemical reactions involving nitrogen dioxide, VOCs, and sunlight [73]. Among these pollutants, nitrogen oxides (NOx and NO2) and particulate matter (PM2.5 and PM10) are particularly dangerous and significant contributors to atmospheric pollution in urban areas [74]. These pollutants represent the main indicators or tracers of traffic-related air pollution. They are associated with a wide range of negative effects, including health impacts, ecosystem degradation, and climate change. Given the diverse impacts of these pollutants, including developmental and reproductive effects, authorities are now prioritizing efforts to address air pollution in near-road locations and mitigate its impact on the vulnerable population. One location that has been the focus of recent air pollution studies is schools [15,16,17,29,47,48,75,76].
Most of these studies have linked air pollution inside and around school buildings to outdoor environmental factors such as traffic, significantly impacting the health and comfort of occupants [2,15,16,76]. The geographical location of a school plays a crucial role in determining both its indoor and outdoor air quality [76]. This is particularly concerning in the UK, where over 2000 schools are situated near roads with high levels of air pollution [2], including toxic pollutants such as PM2.5. The issue is exacerbated by the increased use of cars for school journeys. In England, for example, car use for school journeys has doubled over the past two decades, with as many as one in four cars on the road during morning peak times transporting children to school [77]. This situation unnecessarily exposes school children in school grounds and classrooms near busy roads to air pollution from engine idling (stationary vehicles with engines running) and vehicle acceleration-deceleration during drop-off and pick-up hours. Addressing air pollution exposure in schools is crucial, as elevated concentrations of air pollution can detrimentally affect children’s cognitive performance and learning processes, exacerbating respiratory illnesses, fatigue, absenteeism, and attention deficits [78,79,80,81,82,83,84]. Table 1 summarizes the health impact of poor air quality in schools from empirical evidence.

Table 1.
Studies that examined the health impact of poor air quality in schools.
From the studies listed in Table 1 above, a strong link can be inferred between pollutant concentrations and the onset of health issues such as respiratory diseases, asthma, heart disease, and cancer in school children. This connection is particularly concerning in dense urban areas like London [2], where high levels of traffic-related pollutants exacerbate indoor air quality problems. Equally concerning is the indoor air quality in schools in subarctic regions like Finland and Sweden [76,81,82,85]. Although these schools are primarily situated in smaller towns where children typically walk or bike to school—resulting in reduced exposure to traffic pollution due to lower population density—they still face significant indoor air quality challenges. This is primarily due to the colder climate, which necessitates well-fitting insulation to conserve heat and limits window openings in naturally ventilated classrooms, thereby trapping pollutants indoors. As a result, issues like mold growth and elevated CO2 levels are exacerbated, contributing to various health problems [76,81,82,85,86]. Therefore, it is crucial to understand not only how outdoor pollutants impact indoor environments but also the specific indoor air quality challenges posed by poor ventilation and climate conditions.
However, this review specifically addresses the impact of outdoor pollution on indoor air quality in urban schools, where traffic pollution significantly contributes to poor air conditions. This pollution affects indoor air quality through various air exchange processes, including infiltration, natural ventilation, and mechanical ventilation [80,87,88,89]. Infiltration occurs when outdoor air seeps into buildings through gaps, joints, and cracks in walls, floors, and ceilings and around windows and doors. Natural ventilation refers to the movement of air through open windows and doors, while mechanical ventilation uses fans and duct systems to control air exchange. The air exchange rate, which measures how quickly outdoor air replaces indoor air, is crucial for maintaining indoor air quality. When infiltration, natural ventilation, or mechanical ventilation is limited, the air exchange rate decreases, leading to higher concentrations of indoor pollutants. Therefore, effective ventilation is essential for ensuring good indoor air quality, as inadequate ventilation can result in the buildup of harmful indoor pollutants [90,91].
Schools indeed represent a critical microenvironment for air quality, and several factors contribute to this issue, such as proximity to outdoor sources (e.g., located near busy roads, industrial areas, or other sources of outdoor pollution), inadequate ventilation and lack of filtration systems [92]. This makes school environments susceptible to high levels of particulate matter (PM), nitrogen oxides (NOx), and other pollutants. Generally, all buildings close to major roads are exposed to elevated levels of traffic-related air pollution, with associated health risks. Current scientific evidence has failed to identify a “safe” or “healthy” threshold concentration of ambient air pollutants [93]. However, the health risks are approximately proportional to the long-term average concentrations (weeks or more) of traffic-related air pollutants [94]. The general aim, therefore, is to minimize exposure to these pollutants to the greatest extent practicable.
Conversely, achieving good indoor air quality in schools through effective ventilation practices not only mitigates the spread of viruses like COVID-19 and measles [95] but also enhances learning performance [90]. For example, a study in the United States found that improved indoor air quality resulted in significant improvements in math and reading test scores, increasing the probability of passing by 2% and 3%, respectively [83]. An intervention experiment conducted in Denmark in two classrooms of 10-to-12-year-old children found that increasing the outdoor air supply rate significantly improved test performance [84].
According to WHO data, approximately 99% of the global population breathes air that exceeds guideline limits for pollutants, with the highest exposures occurring in low- and middle-income countries [93]. In practice, the new WHO Guideline expresses that there is no “safe” level of particulate matter in urban air, but that reasonable efforts should be taken to minimize exposure [96]. It also indicates that while air quality might be degraded around some schools, the same is likely true for many children at their places of residence [97]. It is important to note that air quality monitoring alone cannot solely determine whether air quality at a school is acceptable or unacceptable and, therefore, whether mitigation measures are necessary.
Air quality is significantly degraded around major roads, although the impact is highly localized and diminishes rapidly within tens of meters of the road [98]. The impact might be further diminished by vegetation, noise walls, or differences in height [99]. The resulting variation means that the impact can also vary across a school environment if one side is more traffic-impacted than the other. Mitigation options are limited and of uncertain effectiveness. Vegetation screens may provide some reduction in outdoor impacts [99]. To mitigate emissions from major roads, strategies such as traffic calming, reducing car parking, and establishing no-idling zones near schools could help offset the impact [11,12,13,14,15,16,17]. Road traffic emissions are widespread, making it very difficult to reduce their infiltration into indoor spaces, even in well-sealed environments. This challenge is virtually insurmountable in naturally ventilated school buildings. Possible options for mitigating the impact of outdoor air pollution on indoor air quality include using mechanical ventilation with air intakes located far from major roads and/or employing HEPA filtration systems. However, the effectiveness of such systems can be significant only if properly installed and maintained [100].
Behavioral changes may prove more successful, such as considering where outdoor activities occur around the school and relocating, where feasible, to areas with lower pollutant concentrations—particularly away from road sources. Another option is to modify the timing of outdoor activities so that they occur outside the local morning and afternoon rush hours when traffic emissions are highest. However, avoiding air pollution hotspots and peaks may not necessarily result in no exposure, since many schools are where outdoor pollution readily infiltrates indoor areas such as classrooms, where children spend a significant part of their school day. Overall, occupants’ environmental competency and awareness of the impact of outdoor air on indoor air quality are important for understanding how to control common indoor pollutants. This understanding helps reduce the risk of indoor health problems and ensures the maintenance of clean buildings.
3. Data and Methods: Planting Healthy Air in Schools Project
3.1. Study Population
Over 300 students, including both active and non-active participants, from some of the schools experiencing the worst air pollution levels in London [3] were invited to take part in the air quality field campaign. The participating schools were part of the 2019–2023 London Trees for Cities Planting Healthy Air in School Project, which aimed to improve the quality of air in London’s most polluted schools [101]. The project recruitment and engagement process varied between schools and was managed by the gatekeepers. Initially, the schools were informed about the study and provided with necessary ethical considerations, monitoring protocols, data interpretation, confidentiality, and protection-related documentation. Based on this information, the schools were given the option to select able and willing pupils to participate in the air quality campaign.
Some chose to offer the opportunity to existing environmental groups within the school, such as the Eco Warrior’s pupil leadership team and Eco-Club, while others opened the invitation to all children and allocated places on a first-come-first-served basis through signed parent consent forms. Consequently, the number of active participants (students involved in data collection and analysis) and non-active participants (other members of the school community in children-led discussions and closing sessions) differed from school to school. For example, at Christ Church Bentinck Primary School, approximately 120 students participated, while St. Paul’s Primary School had around 100 participants, and Sunnyhill Primary School included about 80 participants. Participants generally ranked between the ages of 6 and 11 years and lived within their schools’ catchment area, in line with their school’s admission criteria. Before their participation, all parents or guardians signed a consent form approved by the Faculty of Science and Technology Research Ethics Committee (FSTREC).
3.2. Study Design
The study, conducted between November 2019 and July 2023, focused on three primary schools in London with the highest pollution levels: Christ Church Bentick School (CCB), St. Paul’s Primary School (SPP), and Sunnyhill Primary School (SPS). This period coincided with substantial changes in teaching and learning modes, school attendance rates, and sensor accessibility due to COVID-19 restrictions. Recognizing these challenges, we employed various interactive techniques throughout the study to ensure active and comprehensive participation. We began by inviting participants from each school to engage in an air pollution educational activity led by the research team to train them to train their fellow pupils, the school leadership, and the wider community. This activity included (a) a baseline assessment of pupils’ understanding of air quality through pre-session questionnaires; (b) training pupils to measure air pollution; (c) designing scientific experiments; and (d) discussions on air pollution sources, health impacts, and potential exposure within their schools. We also emphasized the importance of their role in monitoring the quality of air in and around their school on a schedule tailored to each school. The research team endeavored to explain difficult concepts according to children’s academic ability and experience, avoiding the use of jargon. These concepts included understanding the sources and health impacts of air pollution, designing scientific experiments, and using air quality measurement techniques. Practical examples were also provided to ensure that the children grasped the material without feeling overwhelmed by the complexity.
As the overall goal of the education session was to empower the children to work independently with minimal support from the researchers or gatekeeper, participants from each school were divided into groups after the training exercise. Each group was asked to design its experiment with the aim of addressing specific local air quality challenges, yet all followed a common methodology and used the same instruments, allowing us to capture a broader range of data and providing a richer context for understanding the impacts of air pollution on different school environments. They began by indicating on a printed map of their school places where they are likely to be exposed to air pollution and ways that the situation could be avoided or reduced, before conducting air pollution (PM2.5) monitoring campaigns at different schedules in their chosen locations within their school grounds. To increase student engagement, class groups were encouraged to generate research questions specific to their exposure and to decide when to carry out measurements, what is to be measured, and where it is to be measured, as well as propose ways for dissemination of the results (e.g., by disseminating the projects results themselves or by others). In most cases, participants decided to conduct fixed site monitoring of PM2.5 by placing pollution sensors at grounds near road sources, such as gate areas, woodland areas, and main playgrounds for five consecutive school days (Monday–Friday). To foster a shared sense of ownership, self-confidence, and empowerment, children were given the task of setting up and collecting air pollution sensors daily. They also worked with the gatekeeper to code and retrieve data from the monitors every week. The sensors were pre-programmed to sample each day between opening and closing hours (between 08:00 a.m. and 4:30 p.m.) simultaneously at all locations, capturing car pollution during school hours. All sensors were weather-protective to prevent them from getting damaged or disrupted if exposed to harsh weather conditions.
The data retrieved were then sorted by representatives from each class group in an Excel spreadsheet and analyzed with the researchers before being shared by representatives with their group members. The preliminary data were presented in simple graphical plots for participants to easily understand and interpret air quality data in relation to their everyday lives. After discussions with other group members, the participants shared a summary of their findings and practical suggestions for reducing pollution exposure at a closing event with the entire school community, along with the overall result of the project. During the event, class groups made presentations on themes like why air pollution is a concern, what can be done about it, and what has already been done in their school or community. This was aimed not only at raising awareness of non-participants in the air quality project but also at providing them with insight into the magnitude of air pollution around their school environment. As part of the research process, participants at the event were asked targeted questions to gauge their opinions on the presentation and findings and to evaluate any shifts in their understanding and perception of air pollution issues. Key findings and recommendations from each participating school were shared with the local council for them to take action and published in the school’s newsletter and websites.
To assess the impact the study had on their perception of air quality and practices towards exposure reduction after the air-monitoring project at the schools, participants who responded to the pre-air-monitoring questionnaires were asked to respond to a post-monitoring survey. To complement and contextualize the data gathered from the surveys, focus group engagement was held with some of the class groups and Eco-Club ambassadors involved. One of the key strengths of this study is its empowering nature, which allows school communities to lead and act based on the information gathered and confidence gained from the project.
We then finalized by integrating participatory data with the APEI framework from [21] and different statistical methods to estimate school-day exposure at CCB. We investigated space use and air quality rhythms to explain how exposure varies by time of day. Subsequently, air-monitoring data generated by the students, in addition to supplementary onsite data collected by the research team, as well as traffic and pedestrian counts, were used to describe the intersection of the various pollution and population rhythms in this urban environment. We leveraged school times and activity participation records with air concentration data (PM2.5) from measurement devices placed at different locations within the school premises to better understand when and where children are likely to be most exposed. Our goal was to show school communities how our framework can be beneficial in identifying high-exposure situations at school and the potential for schools to reduce these situations by changing activity times or behaviors.
3.3. Site Description: Site Location, Air Quality, and Vulnerability
The study sites were located across various London boroughs, including Westminster, Lambeth, and Hammersmith and Fulham, and situated near highly traffic roads that cause children to be exposed to high PM pollution levels during school hours [102]. SPP, a Church of England school with 206 students [103], is located near the heavily trafficked Hammersmith Flyover and Hammersmith Bridge Road, exposing students to significant air pollution from around 100,000 vehicles daily [103,104]. Ranked as the second most polluted school in London in 2017 [3], measures such as promoting cycling, closing the flyover to vehicles, and planting trees have been implemented to improve air quality. Despite some success, Hammersmith still faces severe air quality issues, with the eighth-highest percentage of early deaths due to air pollution in London [105]. CCB in Westminster, with 215 students [106], is bordered by Marylebone Road, which sees 90,000 vehicles daily [107] and was reported as having the most polluted postcodes in Britain in 2019. High pollution levels persist, making air pollution education critical. SPS in Streatham, Lambeth, with 518 students, faces high pollution levels, particularly during school drop-off and pick-up times. Despite a school street scheme restricting vehicle access, pollution remains above legal limits [108], affecting over 65% of Lambeth’s children [109]. The geographical characteristics of the selected sites are shown in Figure 1.

Figure 1.
Specific case study locations and their general topographic characteristics. Land use data for Greater London from Open Street Map and 3D street images from Google. Retrieved 11 August 2024 from https://www.openstreetmap.org/#map=13/51.4975/-0.1487 and https://www.google.com/maps/@51.4753206,-0.2561324,12z?entry=ttu.
3.4. Sensor Quality Assurance
Four units of AM 520 and AM 510 SidePak aerosol monitors developed by TSI Inc., USA, were used to monitor PM2.5 in all the participating schools, except for Christ Church Bentinck Primary School, where two units of gravimetric pump monitoring devices (Leland Legacy Personal Samplers) from SKC Ltd., Dorset, UK, were deployed in addition to SidePak monitors, with each sampler costing approximately GBP 2000. These data loggers are portable, user-friendly devices that can provide real-time readings of aerosol mass concentration at high flow rates (~5 to 15 L/min). They can be programmed using a PC and can run for up to 24 h, making them ideal for personal or area sampling of low-level pollutants in various study settings, including those involving children. While these devices are widely accepted in the literature, they have some shortcomings that are important to highlight, such as the provision of indirect measurements and high noise [110], all of which can be a potential source of error. For this reason, the Leland Legacy Samplers were placed in an anti-static thermoplastic case to minimize noise and vibration, while the SidePak devices were operated in areas away from classrooms to ensure noise control.
Similarly, all sensors were calibrated in the laboratory and then placed alongside reference monitors both before and after being used in the field to ensure measurement accuracy. For the SKC particulate Samplers, an SKC check-mate differential flowmeter was used to calibrate air flow samples at flow ranges between 0.50 and 5.0 L/min. The checkmate meets the accuracy requirements of MDHS 14/4, and other HSE sampling methods. For the AM510 and 520 aerosol monitors, a daily zero check was performed with a Zero Filter to ensure the instrument read zero. Following that, all the devices were placed side by side with the Lancaster Air Quality Network reference monitoring station and allowed to run continuously for 24 h to determine functionality. If all instruments are within 20% of each other, they are assumed to be functioning properly [111]. In cases where a device encounters malfunction, such as excessively high or abnormal readings or irreparable damage that cannot be remedied manually, the sampling instruments are sent back to the manufacturer for repair and calibration.
To validate this procedure, Deming regression was applied to co-location data from each PM2.5 data logger in comparison with matched reference data to produce an R2, scaling factor, and zero offsets. For the AM 510 and 520 monitors, all R2 values were >0.75, indicating very good sensor agreement with the reference monitor. The mean (standard deviation) scaling factor and offset were 1.03 (0.05) and −1.70 (0.17), respectively, demonstrating good accuracy and precision. Due to errors in handling and scaling of filter papers, the SKC Particulate Sampler calibration results showed a relatively moderate correlation (~0.59) against reference monitor results. As such, the SKC Leland Legacy Personal Sample Pump was only deployed for the Christ Church Bentinck Primary School study. Following the competitive selection and calibration processes, the sensor units were deployed to all participating schools following scheduled timeframes. These units were used to collect PM2.5 samples at fixed sites, with a focus on traffic pollution sources for approximately 8 h a day at a 5-minute logging interval. The data were automatically recorded in the logging units, subsequently encrypted, and transmitted to the Lancaster University Cloud storage device for academic purposes, where they will be held for ten years before being permanently deleted.
3.5. Assessing Children’s Understanding and the Impact of Our Approach
3.5.1. Education Materials/Training
Two educational materials (PowerPoint lecture notes and slides) were designed and delivered onsite by the researchers in a dedicated two-day environmental education workshop, which had participating students in attendance at their respective schools. The materials were designed at the level of young people aged 6–12 years and included slightly different content for each school. Material one was presented on the first day of the project to introduce the topic and contained learning activities that examine characteristics, sources, effects, and possible ways to tackle air pollution, addressing it from an environmental and societal point of view. In the second part, children were introduced to the science, which involved them learning about how scientific experiments are designed and implemented and how they can go around identifying, understanding, and reducing their exposure to air pollution issues in their schools, homes, and neighborhood spaces. A highlight of the workshop was participating children being trained on how to use a variety of samplers (e.g., SKC gravimetric pump and AM 510 and 520 personal monitoring sensor devices) to take their independent air quality measurements in places of their choice.
Material two was developed to improve the learning experience of focus groups by allowing them to reflect on and discuss the information presented in the first material, which focused on air pollution characteristics. It contains schematic sketches of urban spaces and air pollution sources and blank A4 pages to allow participants to demonstrate in drawings their knowledge of the use of urban space in relation to air pollution. The material also included sections for participants to raise concerns about air pollution in their local area. This involved making brief presentations to fellow pupils on themes like why air pollution is a concern, what can be done about it, and what has already been done in their school or community. The aim is to foster a sense of citizenship and ownership to give students an active voice and thus empower them to act. The material was designed to be suitable for students of various ages, backgrounds, and levels of knowledge.
3.5.2. Questionnaire and Survey
Two paper surveys, which also contained information sheets and consent forms for parents, were administered to children whose parents consented for them to take part in a field campaign. The decision to use paper surveys was based on several factors, including participants’ familiarity, lack of computer knowledge required, budget constraints, and the need for flexibility in data collection in areas with limited technology [112,113]. As a pre-testing procedure, the surveys were read aloud to the participating students before administering them to make sure they understood the questions and instructions. The surveys included 13 closed-answer questions (except for some requesting additional description) that were grouped into two parts. The first part, which is the pre-monitoring survey, was administered anonymously to all participating children before the air quality education workshop took place, while the second part was administered two weeks after the air monitoring. The pre- and post-surveys asked children questions about (a) air pollution near their school and about the places they like to play, (b) their travel practices to and from school, and (c) their views and perceptions towards air pollution in and around their school. The post-survey also asked questions about any changes in practices. This was to know whether their awareness of air pollution has improved due to the air-monitoring project and if their practices changed because of the project or having seen the study findings.
For our analysis, tabulation and graphical summaries of questionnaire responses were completed with Microsoft Excel 2016, while statistical analyses were carried out using the SPSS v.22 package. To assess the impact of our research development and outcomes, an ANOVA test was conducted. We calculated knowledge scores based on the responses provided by participants to the question, “What problems do you think”, using a scoring system of 1 for each response and 0 for a blank or no response. We then compared the means of these knowledge scores to the respondents’ perceptions of pollution in their schools. The results indicated a non-significant p-value of >0.05. To assess pollution avoidance/reduction actions, we used responses to questions 8 and 9, with each response scored as 1, no response as 0, and “don’t know” as 0. We also calculated action perception scores based on the responses to question 10, which were then aggregated for each respondent. Finally, we correlated action perception with pollution avoidance/reduction, using a criterion of a p-value less than 5% to determine statistical significance.
3.5.3. Focus Groups
The study used focus groups attended by approximately eight-to-twelve students from each participating school to complement the survey data collected after sharing the findings of the air pollution-monitoring data. The focus groups were designed to facilitate further discussions among all the participating children, who were invited to join different schedules and activities involving digital mapping tools. The children themselves led these activities, determining the topics of discussion, selecting warm-up exercises, and arranging the room layout. To increase engagement in group interactions and discussions, participants at each school were divided into class groups and asked to make sketches of their route to school, places they play, and neighborhoods they live as a way of reinforcing the lessons learned in air quality education sessions. The primary objective of the focus groups was to collect feedback on the intervention, address any concerns about the results, and evaluate the potential impact of participating in the intervention on the children’s views, perceptions, and behaviors towards air pollution.
To enhance understanding and support future replication of this study, we have included the actual surveys used in the research, along with the educational materials and resources, as Supplementary Material. These resources are not available on a public-facing website and may provide valuable insights for readers.
3.6. Exposure Data Assessment
3.6.1. Air Quality Monitoring
In this part of the study, participatory air-monitoring and population-flow data collected at Christ Church Bendick School during the 2019/2020 Planting Healthy Air in School Campaign were used. Air monitoring was carried out at targeted exposure hotspots (e.g., main entry/exit gate where parents drop off and pick up, and the multi-use games area (MUGA)) during school hours (08:00 a.m.–04:00 p.m.) for two full terms, particularly from the autumn (16 October–28 November) to spring term (15 January–11 March) of 2019 and 2020, respectively. To understand the spatiotemporal air pollution pattern within the study area, average hourly PM2.5 concentrations were calculated and compared for the different monitoring points for each day of the school week and term.
3.6.2. Population Flow
We used qualitative and public space study tools, including mapping, counting, field notes, freehand sketches, and existing datasets such as school activity attendance records [114,115,116,117,118], to capture the daily flow of pedestrians and traffic at the school and nearby roads. Daily rhythm of traffic and pedestrian flow were recorded on Marylebone Road for 5 min each hour, from 8:00 a.m. to 5:00 p.m., using a manual counter, field notes, and sketches over eight days within four weeks. Traffic recordings at different locations were conducted simultaneously with air quality monitoring during the study period. We aimed to link school exposure to road traffic and activity timings (e.g., pick-up/drop-off, breaks, and after-school clubs). Flows of people to/from the school and along sidewalks, as well as vehicles on Cosway Road, were recorded and compared to other urban flow rhythms. In addition to field data, hourly traffic data were collected from Transport for London (TfL), and children’s attendance records for each daily outdoor activity were also obtained from the school for the 2019/2020 and 2021/2022 academic years. Activity data provided information on the number of people involved, the nature of the activity, and where and when the activity took place (as in time of the day). This information was used to create diurnal plots to better analyze and understand the hourly pattern of outdoor space usage.
3.6.3. Air Quality Exposure Analysis
The study utilized the Air Pollution Exposure Index metric developed by [21] to define typical school-day exposure at CCB. Initially, we sorted hourly PM2.5 values (AP) at each monitoring location using the SPSS Pivot Table to indicate pollution levels, alongside data on children’s activity patterns extracted from school attendance records and traffic and pedestrian counts as population indicators (P). After sorting, weighted air pollution exposure (WAPE) was calculated as shown in Equation (1) to help provide insight into the likely pollution levels (µg/m3) experienced during the day.
where , is the average hourly pedestrian, and is the hourly mean pollution concentration.
Following that, the hourly weighted air pollution exposure and population values (as in pedestrian flows) were assigned index numbers 1–5 following AQI thresholds, similar to those established in [119] for PM10 and population index benchmarks presented in Table 2. In particular, the AQI and threshold values set by DEFRA for PM2.5 were adopted (Table 3) and regrouped in Table 4 to suit the 1–5 scale defined in [21]. These were used to categorize PM2.5 pollution and population into higher and lower concentrations, with a very high index value (5) meaning a very high population or pollution level and (1) a low population or pollution level (Table 2 and Table 4).
Table 2.
Population index (traffic and pedestrian) and threshold values adopted from [21].
Table 3.
Daily air quality index and pollutants threshold values set by DEFRA for PM2.5 [119].
Table 4.
Air quality index and threshold values for PM2.5 were adopted from [21].
Subsequently, air pollution exposure was calculated by combining weighted air pollution concentration with the average population (as in pedestrians) per hour. The Air Pollution Exposure Index measures were determined by multiplying the weighted air pollution index referencing DEFRA’s AQI system for PM2.5 (Table 3) and the population index (Table 2). Each hour was assigned an Air Pollution Exposure Index value from 1 to 25, with values from 1 to 5 classified as very low-risk exposure and values from 21 to 25 classified as very high-risk exposure (Table 5). The results were combined and displayed on a diurnal plot to better understand changes in exposure patterns across various monitoring locations. More information on the stages and parameters of the APEI metrics can be found in Section 2.3 of the study [21].
Table 5.
Interpretation of the Air Pollution Exposure Index from [21].
4. Results
4.1. Participatory Air-Monitoring Project
4.1.1. St. Paul’s Primary School (SPP)
At SPP, participants measured air quality at perceived exposure hotspots for three weeks to assess PM2.5 pollution levels and evaluate the impact trees and green vegetation introduced in the school by Trees for Cities on pollution-exposure reduction during outdoor activities. They found the highest PM pollution at the back shed and the lowest at the Multi-Use Games Area (MUGA) (Figure 2a,b). The back gate area, where green vegetation was introduced, showed an average PM2.5 level of 21.42 μg/m3, down from 42.25 μg/m3 in 2017, indicating a reduction in pollution due to the vegetation. However, these levels were highest between 11:40 a.m. and 12:10 p.m., coinciding with when parents typically pick up their children from the nursery class. The back shed still had high levels, averaging 42.83 μg/m3, with peaks in the afternoon. Near the kitchen area, PM2.5 averaged 21.28 μg/m3, with high levels during lunch break due to emissions from the kitchen chimney. When asked about their reaction to these findings, many participants expressed surprise and concern regarding the extent of pollution from the kitchen. They attributed it to the kitchen chimney and the lower levels at the MUGA and back gate to green vegetation and the closure of Hammersmith Bridge to vehicles. Based on emerging results, participants recommended that the school leadership consider planting trees and hedges near the car park or relocating outdoor furniture from school grounds close to the kitchen and back shed to limit air pollution exposure.
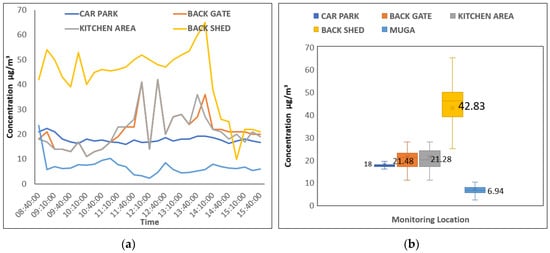
Figure 2.
(a,b) Results of air pollution monitoring carried out by children at different locations within St. Paul’s Primary School.
4.1.2. Sunny Hill Primary School (SPS)
Participants at SPS designed two-stage experiments that lasted approximately one month. The first was to conduct a two-week participatory air-monitoring campaign using low-cost sensors to understand daily changes in levels of air pollution in locations where they selected and were likely to be exposed at school. They measured PM pollution at the Corner of Valley Road and Sunnyhill Road, Sunnyhill Gate by Bus, the Main Gate, and the School Field (Figure 3a,b). PM pollution levels were found to be highest at the corner of Valley and Suny Hill Road and lowest in the School Field. Pollution was worst between 12:15 and 1:30 p.m., at which time the roads were busy due to the office launch break. The main school gate and the ground area away from Sunny Hill by Bus were found to be very high on Typical Days. These measurement data strongly suggest that action should be taken to mitigate the exposure of students to PM2.5 pollution. The lowest measurements in the school field indicate the school’s charity partner, Trees for Cities, succeeded in mitigating some exposure by planting trees. Based on these data, the children were asked about what else they wanted to know or do. Generally, the participating children suggested that they wanted to design interventions to mitigate pollution exposure, particularly focusing on areas where the risk was very high.
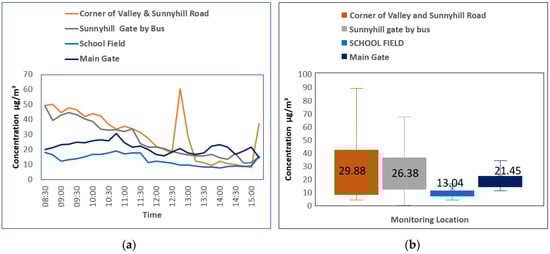
Figure 3.
(a,b) Air pollution-monitoring results presented during group engagement to give an indication of the different levels over space and time.
In the second experiment, participants explored digital mapping tools and focus-group discussions to engage with and develop interventions. The children began by identifying and sketching their favorite play areas at school and then comparing these locations with air quality data to assess potential exposure to air pollution. Most children preferred to play in the playground near Valley Road, while fewer chose the playground near Sunnyhill Road, and very few played in the field area. This indicated that children using ground areas at playgrounds adjacent to Valley Road and Sunnyhill Road were likely exposed to higher levels of air pollution. Consequently, the children proposed and tested strategies to reduce their exposure to air pollution at school. Some suggested playing in areas farther from Valley Road and Sunnyhill Road, while others recommended using the school field, where air pollution levels were comparatively lower. To test their suggestions, the children carried out readings in playgrounds and field areas away from the roads (Figure 4a,b).

Figure 4.
(a,b) Air pollution concentration for different exposure locations at Sunny Hill Primary School, including ground areas away from roads.
Surprisingly, the playgrounds had higher levels of PM2.5 in ground areas away from Valley Road and Sunny Hill Road, while field areas away from Harborough Road were the lowest. In terms of temporal changes, air pollution was lower most of the day except in the afternoons when higher levels were seen at the playgrounds. This meant that pollution exposure levels were likely to be higher during the afternoons throughout the playgrounds and possibly influenced by similar pollution sources (probably car traffic). Participants shared and discussed their results with the wider school community, alongside practical recommendations, to simulate behavior change and showcase the potential impacts of implementing such changes. Recommendations included walking, riding a scooter or bike to school to avoid pollution, planting more trees, and playing near green/less polluted areas, as well as changing the time of break, as it coincided times with the worst pollution (12:15 and 1:30 p.m.) at the corner of the valley and sunny hill road. A summary of some of their recommendations is presented in Figure 5.
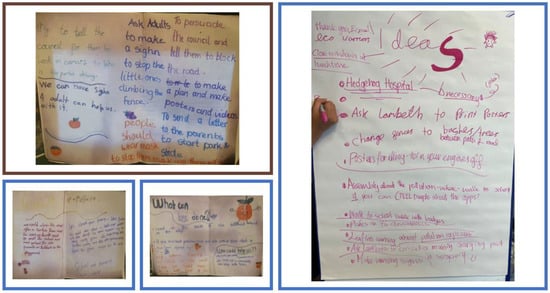
Figure 5.
Suggestions by participants during group engagements on ways air pollution exposure can be avoided.
4.2. Impacts of Participation in Air-Monitoring Project at School
4.2.1. Children’s Perception of Local Air Quality, Sources, and Impacts
Pre-Survey Results
The pre-survey had a response rate of about 58%, with 58 out of 100 distributed surveys completed across SPP and SP. Among these, 8 respondents were identified as members of their school environmental group, while the remaining 50 were non-members. Overall, 98% of the 58 respondents perceived their school’s air quality as either slightly or highly polluted (Figure 6, Figure 7 and Figure 8).
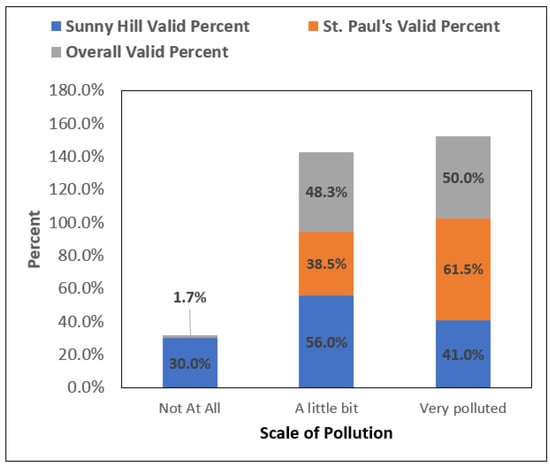
Figure 6.
Perception of local air quality.
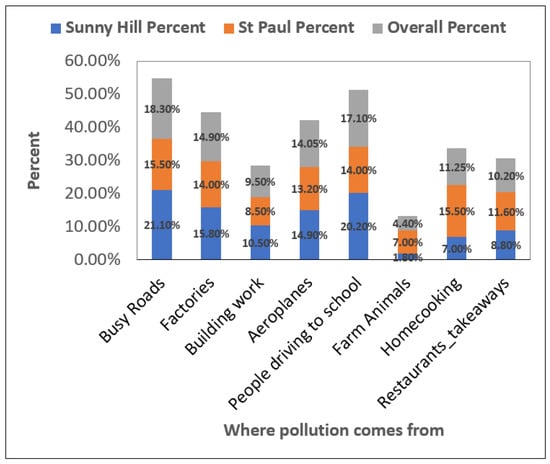
Figure 7.
Perception of the primary source of air pollution.

Figure 8.
Perception of air pollution’s impact on health and the environment.
At St. Paul’s, 61.5% considered the air to be very polluted, while 38.5% thought it was slightly polluted. Similarly, at Sunny Hill Primary School, 56% viewed the air as very polluted, and 41% saw it as slightly polluted. When asked about where they think the polluted air comes from, 18.3% mentioned busy roads as the primary pollution source, and 11.25% mentioned home cooking. Factories and airplanes were also noted by 14.9% and 14%, respectively, with farm animals being the least mentioned, at 4.4%. At Sunny Hill, 21% cited busy roads, and 20% named people driving to school as pollution sources. At St. Paul’s, 15% pointed to busy roads and home cooking, while people driving to school and factories were each mentioned by 14%. Overall, 35% considered local factors to air pollution at their schools, suggesting that one-third of the respondents were inclined to link air pollution to high traffic volumes. This means that many participants, with only 2% holding a different view, initially perceived their school’s air quality as being polluted by road traffic, even before seeing measurement results from their respective schools.
Figure 9, Figure 10 and Figure 11 illustrate the participants’ perspectives on various factors that contribute to their understanding of the local air pollution issue. These factors encompass health implications and potential measures to alleviate the problem. When asked about the problems air pollution causes, 70% identified it as directly affecting human health, whereas 30% acknowledged its impact on the environment (Figure 9). Of those who mentioned the health-related impact, about 80% specifically noted respiratory diseases (asthma, lung diseases, bronchitis, etc.), and the remaining percentage falls among environmental effects resulting in the death of plants and animals. In terms of school distribution (Figure 10), 97% of St. Paul’s pupils acknowledged the health consequences of air pollution, while the remaining 3% thought otherwise. However, in Sunnyhill, 43% mentioned health-related problems, while the majority (57%) cited environment-related problems. This means that children in St. Paul’s possessed a higher level of knowledge regarding the health problems caused by air pollution compared to those at Sunny Hill.
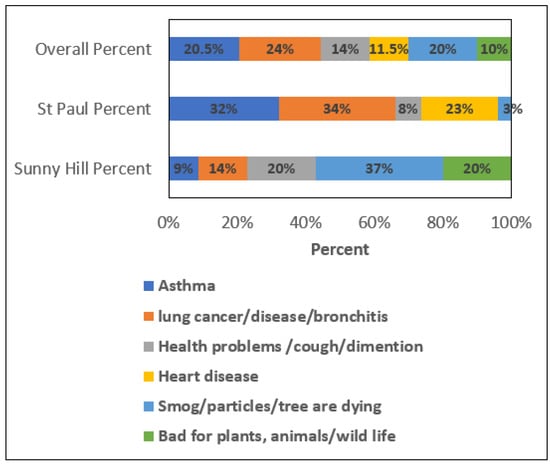
Figure 9.
Perception of the primary air pollution impact on people’s health.
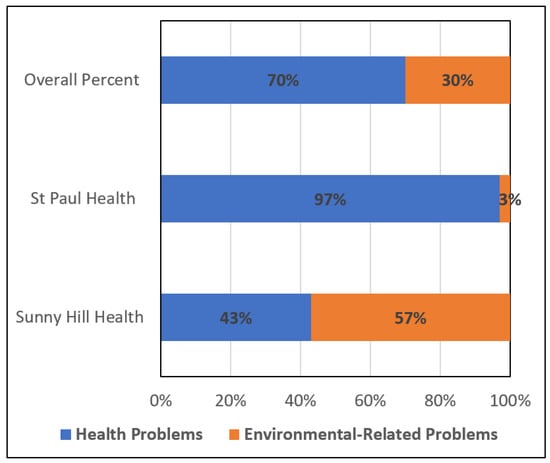
Figure 10.
Perception of the air pollution impact grouped by schools.

Figure 11.
Perception of the potential strategies for avoiding air pollution exposure.
More than 75% of the responders perceive alternative transport as a possible option to avoid polluted air around and on their way to school (Figure 11). Approximately 38.9% suggested walking or using alternative transport. Another 18% recommended avoiding polluted areas or taking alternate routes, while 16.7% proposed planting more trees and walking in green spaces. In terms of school classification, 44.1% at Sunny Hill mentioned alternative transportation, while 23.5% suggested walking in green areas. At St. Paul’s, 44.2% mentioned alternative transportation, 23.7% mentioned avoiding polluted areas, and 18.4% mentioned wearing masks. When asked if they would change their practices to reduce exposure at school, 25.9% of those who acknowledged the connection between air quality and health issues responded in the affirmative, 15.5% said no, 50% said they do not know, and 8.6% did not respond (Figure 12). The high level of uncertainty among the respondents further demonstrates a lack of knowledge or ability to protect themselves and the need for them to be empowered to reduce their exposure.
Figure 12.
Perception of their willingness to change behavior to reduce exposure to pollution.
Overall, findings from the pre-study survey suggest that most children, particularly those involved in school environmental groups, were knowledgeable about local air quality issues before they participated in the study. The ANOVA test result in Table 6 shows that members of eco groups had a higher knowledge score (6.13) than non-members of the group (n = 5.74). Similarly, they had slightly higher pollution avoidance/reduction scores (2.38) than those who were not in the group (2.12), with an overall score of 2.16. It was a similar trend for the Action perception score. In terms of school characterization (Table 7), the ANOVA test revealed a significant difference between the mean knowledge scores of respondents from the two schools (F (1, 56) = 14.73, p < 0.05). Respondents from St. Paul’s had a higher average knowledge score (n = 26, M = 7.19) compared to those from Sunny Hill (n = 32, M = 4.66). Respondents in St. Paul’s and eco groups were more knowledgeable and more likely to adopt exposure avoidance behaviors compared to those in Sunny Hill and non-members of environmental groups. This suggests that knowledge about air pollution may increase the chances of children acting to lower their exposure to it, thus highlighting the importance of environmental education programs in schools.
Table 6.
Report on knowledge of pollution problems.
Table 7.
Knowledge scores grouped by school.
4.2.2. Changes to Knowledge and Practices
Post Survey and Discussions
Although pre-study surveys and discussions indicated that participants and fellow students were somewhat familiar with air pollution, they lacked knowledge about their level of exposure and confidence in reducing it. As one child stated, “I wanted to do this project to see how much dirty air we breathe from polluting cars on the road and what we can do differently”. When asked if their expectations were met and their awareness changed (Figure 13 and Table 8), 55.2% of participants affirmed that the study enhanced their understanding and awareness of air pollution. They also had the chance to assess their circumstances (such as specific locations and periods wherein they were at a higher risk of exposure) and thus decide to change practices. When children were asked what they now do differently after the project (Figure 14 and Figure 15), 44.8% said that they walk and cycle instead of using a car, 24.1% chose low-pollution routes to school, 20.7% chose to play away from pollution, and 6% close windows at home and classroom close to busy roads. According to their responses, 92% of the children surveyed (after the project) changed their actions, compared to 25.9% who proposed to change during the pre-survey. This indicates a significant rise in confidence across all groups in making daily changes to reduce air pollution exposure after the projects.
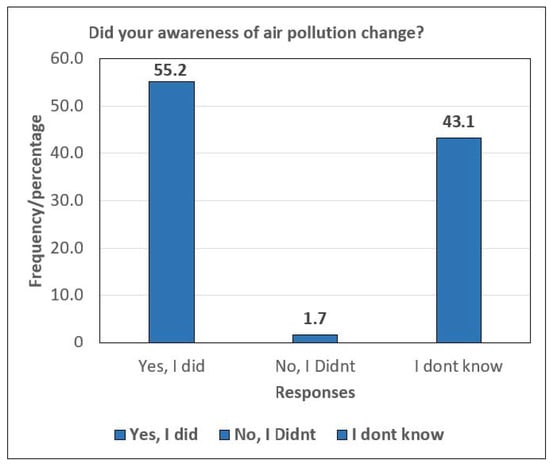
Figure 13.
Changes in awareness following the air-monitoring project at schools.
Table 8.
Changes in awareness grouped by schools.

Figure 14.
Changes in action grouped by schools.
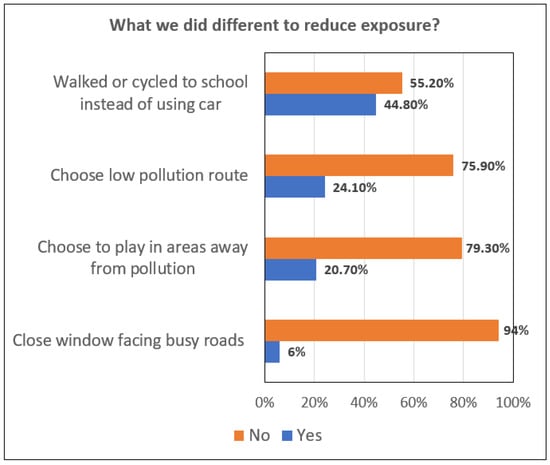
Figure 15.
Some of the actions taken by participants to reduce exposure to air pollution.
Post-monitoring discussions revealed that children who were previously unaware of air pollution could now discuss its health effects, identify polluted areas, and suggest mitigation actions. This result indicates that involving children directly in research projects through participatory approaches is a valuable strategy for increasing awareness of air pollution and reduction actions. However, some challenges were noted, as few participants struggled to relate the collected air quality data to their daily pollution exposure at school. Leaders in one of the schools noted difficulties in interpreting measurement data and applying them to meaningful actions or policies.
To address the issues raised and improve their understanding of pollution exposure, we analyzed air pollution exposure during a typical school day at Christ Church Bentinck School as a case scenario (Figure 16), using a novel APEI metric defined by [21]. The public use of Marylebone Road and Cosway Road, as well as the use of the MUGA/playground by school children (Figure 17), were also examined to understand how everyday activity on these roads affects air quality (Figure 18) and the weighted exposure of children during a typical school day at CCB (Figure 19). The data show that PM2.5 exposure at CCB was very low most of the day in all locations, except for Marylebone Road, peaking between 2:30 p.m. and 4:30 p.m. due to traffic and population activity. At the MUGA/playground, PM2.5 exposure was relatively lower than at Marylebone Road, with peaks during high-activity periods such as breaks and afterschool activities (at 10:30 a.m., 12:30 p.m., 2:30 p.m., and 3:30 p.m.). Cosway Road had the lowest PM2.5 exposure overall, with minimal peaks during drop-off (8:00–9:00 a.m.) and pick-up times (2:30–3:30 p.m.), due to its quieter nature during school hours. When shared with the school community, they noted that the tool was simpler to understand than single air quality measurements, thus demonstrating its effectiveness for teaching and learning environmental education. They also suggested it helped them identify instances of heightened pollution exposure for children, leading to considerations for behavioral changes, such as avoiding certain areas or adjusting activity times to reduce exposure. The integration of the APEI with participatory research has broader implications for policy and education. The refined exposure assessments can provide local administrators and policymakers with an accurate understanding of the factors contributing to children’s exposure and aid in developing effective strategies to protect them from vulnerable locations like school playgrounds, gate entrances, and classrooms.
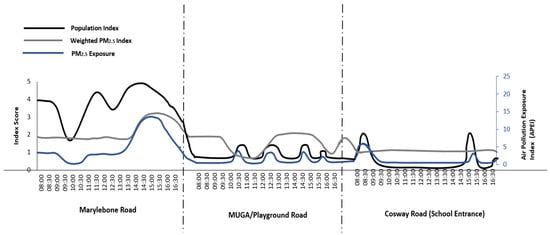
Figure 16.
Exposure to air pollution in Christ Church Bentinck Primary School, which is achieved through a combination of population, pollution concentration and exposure indexes for Marylebone Road, Cosway Road, and MUGA/playground.
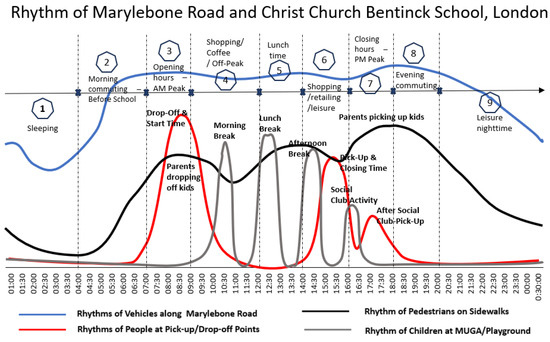
Figure 17.
Comparison of different rhythms in Marylebone Road and CCB Primary School, achieved through bringing together the rhythms of vehicles along Marylebone Road, rhythms of pedestrians on sidewalks, rhythms of children at MUGA/Playground, and rhythms of people at pick-up/drop-off points.
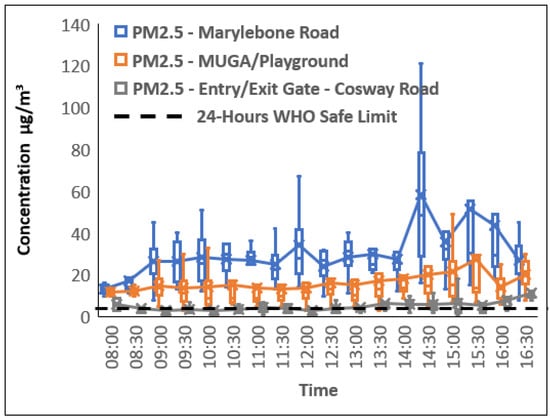
Figure 18.
Pollution concentration and distribution at different monitoring locations in CCB School. The data are based on the average concentration of PM2.5 particles over 30 min on a regular school day.
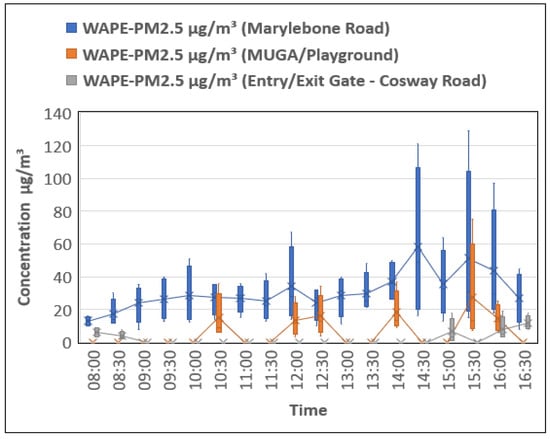
Figure 19.
Weighted air pollution exposure (WAPE) to PM2.5 at different monitoring locations in Christ Church Bentinck School During a Typical School Day.
5. Discussion and Conclusions
This study evaluated the effectiveness of participatory methods in engaging primary-school communities with air pollution issues, enabling them to identify, understand, and reduce their exposure. Participatory methods, including interactive workshops, citizen science projects, and collaborative data collection, have been previously used in environmental education to involve children in air-monitoring campaigns with low-cost sensors, raising awareness and promoting pollution reduction behaviors. However, these initiatives were typically expert-led, with students playing a contributory role rather than taking ownership of the scientific knowledge. Here, we adopted a student-led approach with researchers providing support. At the same time, students designed experiments, chose measurement locations, and suggested ways to mitigate air pollution exposure at their schools and train others. Allowing students to lead different projects across multiple schools provided an opportunity for a comparative assessment of their scientific knowledge and an understanding of the unique air quality challenges that exist across diverse urban environments, along with potential solutions.
The findings indicated that this approach significantly enhanced children’s understanding and knowledge of air quality, as well as their confidence, competence, and skills in air quality education. They successfully influenced their peers, school leadership, and the wider community to take action to reduce air pollution, which is in line with studies showing that children shape the perceptions and behaviors of others [40,41], indicating the potential for a wider social multiplication effect.
The research also demonstrated the potential of an Air Pollution Exposure Index from another study [21] to understand how students are exposed to air pollution at school and when the risks are greatest. This tool was validated by sharing exposure plots with one of the schools to gather their understanding of the data and their opinion on the usefulness of the tool for taking action to reduce exposure. School leaders and children found the tool effective in identifying high pollution-exposure situations, where children were exposed to high levels of pollution at school. They were able to consider making changes to behavior, such as avoiding certain areas or adjusting the timing of activities, to reduce the children’s exposure to outdoor pollution. For example, children suggested avoiding the games area during times when pollution levels are high or altering school break times to minimize exposure to pollution. These findings are novel for the context of air pollution-exposure assessment in schools but consistent with previous research that has found positive effects of environmental education activities on participants [45,72,120]. The integrated index metric serves as a bridge between scientific air quality (AQ) measurements (which do not necessarily tell anything about exposure in population-based studies) and the daily experiences of school children, offering a more accurate interpretation of their exposure to air pollution. It also provides insights into potential exposure hotspots and contributes to a more accurate evaluation of the factors influencing air pollution exposure in this specific context.
Despite the study’s focus on identifying outdoor air pollution hotspots and their contribution to children’s overall exposure at school, it also acknowledges the effects outdoor air pollution has on indoor air quality in schools and the distinct air quality-related challenges that different regions face. It recognizes the potential of using the integrated APEI metrics to identify, understand, and mitigate children’s exposure in indoor school environments. By understanding children’s spatiotemporal use of indoor spaces and the changes in indoor and outdoor air quality, these two factors can be integrated to define air pollution exposure and identify peaks and critical indoor locations. This information could help school children, school leadership, and local communities make informed, targeted interventions, such as modifying outdoor environmental factors like traffic patterns through road closures and creating school streets, adjusting ventilation schedules, changing activity timings, and improving indoor air quality measures, all aimed at reducing exposure and enhancing the quality of indoor spaces. Identifying the unique circumstances of various environments enables the development of effective context-specific strategies to protect children’s health and enhance their learning environments.
In summary, this study represents the first evaluation of a children-led environmental education project related to air pollution. It highlights the importance of active child engagement in research and empowers them to advocate for healthier and more sustainable school environments. It also demonstrates not just the feasibility of participatory methods of engagement but also the effectiveness of a student-led approach to environmental education. Both school leaders and students showed improved understanding and willingness to tackle air pollution after participating in the educational activities. The research highlights how complex environmental issues can be made more accessible to school students through innovative methods and contributes to emerging evidence that trained children can act to protect themselves from air pollution and may benefit from greater confidence and skills to do so. The combination of participatory approaches with exposure indexing metric contributes to knowledge on the topic of children’s exposure to air pollution by increasing risk perception and encouraging positive behavioral changes in schools. The exposure data helped schools to better understand places and times when their risk of exposure was high and to focus resources in these areas to prevent children from being exposed. Future research should evaluate the extent to which this tool reduced children’s exposure at school, as well as the children’s behaviors associated with higher exposure episodes.
The literature suggests previous school-based participatory air quality projects had a short sampling period of no longer than one week. This study involved a longer sampling period, thus making it a relatively more comprehensive and suitable reference for future studies. The active engagement of children in the research process contributes to building a foundation for environmental literacy, empowering them to advocate for healthier and more sustainable school environments. While the approaches in this study proved valuable, we acknowledge challenges such as age-appropriate communication of scientific concepts, resource constraints, varying levels of engagement among children, and low survey responses. Addressing these challenges will require ongoing collaboration with educators, effective communication strategies, and continuous community involvement to sustain interest and commitment.
Additionally, the study period coincided with the COVID-19 pandemic, when many schools experienced shifts to remote learning, reduced in-person attendance, and changes in daily school routines, which could have led to lower traffic volumes and altered exposure conditions. Furthermore, COVID-19 restrictions might have affected the accessibility and deployment of sensors, potentially impacting the data collected. We recognize that these factors could have influenced the measurements and data quality and the general applicability of our findings. Despite these limitations, our analysis aimed to provide a representative snapshot of the air quality and exposure conditions during this period. Future studies should consider these pandemic-related changes to better understand their long-term impacts on air quality and public health.
Supplementary Materials
The following supporting information can be downloaded at https://www.mdpi.com/article/10.3390/su16177491/s1. (1) samples of the surveys used in the study, (2) educational materials, and (3) resources related to the research.
Author Contributions
All authors gave final approval of the final version and are accountable for this work. Conceptualization, K.A. and E.O.; methodology, E.O.; formal analysis and visualization, E.O.; writing—original draft, E.O. and A.A.; writing—review and editing, E.O. and A.A.; supervision, K.A. and E.T. All authors have read and agreed to the published version of the manuscript.
Funding
Funding for this research is provided by UK Research and Innovation (UKRI) through Lancaster University under the Open Access agreement.
Institutional Review Board Statement
The research did not require any approval.
Informed Consent Statement
Informed consent was obtained from all participants involved in the study. As they were under the age of 18, consent was obtained from their parents or legal guardians.
Data Availability Statement
Research data are not shared.
Acknowledgments
We want to extend our gratitude to all participating students and schools, as well as our partners, for their involvement in this project. No scientific or pedagogic insights, scientific conclusions, or recommendations in this manuscript or the initial draft were drawn using AI-related technologies.
Conflicts of Interest
The authors declare no conflict of interest.
Correction Statement
This article has been republished with a minor correction to the Funding statement. This change does not affect the scientific content of the article.
References
- World Health Organization. Global Air Quality Guidelines. Particulate Matter (PM2.5 and PM10), Ozone, Nitrogen Dioxide, Sulfur Dioxide and Carbon Monoxide; World Health Organization: Geneva, Switzerland, 2021. [Google Scholar]
- Mumovic, D.; Chatzidiakou, L.; Williams, J.; Burman, E. Indoor Air Quality in London Schools; Greater London Authority: London, UK, 2016; Available online: https://tinyurl.com/IAQLNDschools (accessed on 12 July 2022).
- Greater London Authority. The Mayor’s School Air Quality Audit Programme Report; Greater London Authority: London, UK, 2018.
- Public Health England. Health Matters: Air Pollution. Health England. 2018. Available online: https://www.gov.uk/government/publications/health-matters-air-pollution/health-matters-air-pollution (accessed on 5 January 2023).
- Chiu, A.; Falk, A.; Walkup, J.T. Anxiety disorders among children and adolescents. Focus 2016, 14, 26–33. [Google Scholar] [CrossRef] [PubMed]
- Khreis, H.; May, A.D.; Nieuwenhuijsen, M.J. Health impacts of urban transport policy measures: A guidance note for practice. J. Transp. Health 2017, 6, 209–227. [Google Scholar] [CrossRef]
- Mohamed, S.; Rodrigues, L.; Omer, S.; Calautit, J. Overheating and indoor air quality in primary schools in the UK. Energy Build. 2021, 250, 111291. [Google Scholar] [CrossRef]
- U.S. EPA (United States Environmental Protection Agency). Integrated Science Assessment (ISA) for Particulate Matter (Final Report, 2019); EPA/600/R-20/012, 2020; U.S. Environmental Protection Agency: Washington, DC, USA, 2019. Available online: https://www.epa.gov/isa/integrated-science-assessment-isa-particulate-matter (accessed on 10 July 2020).
- Sharma, A.; Kumar, P. Quantification of air pollution exposure to in-pram babies and mitigation strategies. Environ. Int. 2020, 139, 105671. [Google Scholar] [CrossRef]
- Vardoulakis, S.; Kettle, R.; Cosford, P.; Lincoln, P.; Holgate, S.; Grigg, J.; Kelly, F.; Pencheon, D. Local action on outdoor air pollution to improve public health. Int. J. Public Health 2018, 63, 557–565. [Google Scholar] [CrossRef] [PubMed]
- Ryan, P.; Reponen, T.; Simmons, M.; Yermakov, M.; Sharkey, K.; Garland-Porter, D.; Eghbalnia, C.; Grinshpun, S.A. The impact of an anti-idling campaign on outdoor air quality at four urban schools. Environ. Sci. Process. Impacts 2013, 15, 2030. [Google Scholar] [CrossRef]
- Rumchev, K.; Lee, A.; Maycock, B.; Jancey, J. Reducing car idling at primary schools: An intervention study of parent behaviour changes in Perth, Western Australia. Health Promot. J. Aust. 2020, 32, 383–390. [Google Scholar] [CrossRef] [PubMed]
- Mendoza, D.; Benney, T.M.; Bares, R.; Fasoli, B.; Anderson, C.; Gonzales, S.A.; Crosman, E.T.; Bayles, M.; Forrest, R.T.; Contreras, J.R.; et al. Air quality and behavioral impacts of Anti-Idling campaigns in school Drop-Off zones. Atmosphere 2022, 13, 706. [Google Scholar] [CrossRef]
- Cheek, E.; Guercio, V.; Shrubsole, C.; Dimitroulopoulou, C. Portable air purification: Review of impacts on indoor air quality and health. Sci. Total Environ. 2021, 766, 142585. [Google Scholar] [CrossRef]
- Kumar, P.; Omidvarborna, H.; Barwise, Y.; Tiwari, A. Mitigating Exposure to Traffic Pollution in and around Schools: Guidance for Children, Schools and Local Communities; University of Surrey: Guildford, UK, 2020; p. 24. [Google Scholar] [CrossRef]
- Osborne, S.; Uche, O.; Mitsakou, C.; Exley, K.; Dimitroulopoulou, S. Air quality around schools: Part II—Mapping PM2.5 concentrations and inequality analysis. Environ. Res. 2021, 197, 111038. [Google Scholar] [CrossRef]
- Rivas, I.; Querol, X.; Wright, J.; Sunyer, J. How to protect school children from the neurodevelopmental harms of air pollution by interventions in the school environment in the urban context. Environ. Int. 2018, 121, 199–206. [Google Scholar] [CrossRef] [PubMed]
- EEA. Air Pollution and Children’s Health. European Climate and Health Observatory, European Environment Agency. 2023. Available online: https://www.eea.europa.eu/publications/air-pollution-and-childrens-health (accessed on 5 December 2023).
- Sumpter, L.; Hedefalk, M. Studying Preschool Children’s Reasoning through Epistemological Move Analysis. In Proceedings of the 41st Conference of the International Group for the Psychology of Mathematics Education, Singapore, 17–22 July 2017; pp. 1–8. Available online: https://www.diva-portal.org/smash/get/diva2:1118928/FULLTEXT01.pdf (accessed on 20 August 2023).
- Wals, A. Shaping the Education of Tomorrow: 2012 Full-length Report on the UN Decade of Education for Sustainable Development; UNESCO: Paris, France, 2012; Available online: http://edepot.wur.nl/246667 (accessed on 13 May 2021).
- Otu, E.; Ashworth, K.; Tsekleves, E. Rhythm of Exposure in Town Centres: A Case Study of Lancaster City Centre. Environments 2024, 11, 132. [Google Scholar] [CrossRef]
- Commodore, A.; Wilson, S.; Muhammad, O.; Svendsen, E.; Pearce, J.L. Community-based participatory research for the study of air pollution: A review of motivations, approaches, and outcomes. Environ. Monit. Assess. 2017, 189, 378. [Google Scholar] [CrossRef]
- Corburn, J. Street Science: Community Knowledge and Environmental Health Justice. 2005. Available online: https://escholarship.org/uc/item/20k0s0xn.pdf (accessed on 17 November 2023).
- Gabrys, J.P.H.; Benjamin, B. Just good enough data: Figuring data citizenships through air pollution sensing and data stories. Big Data Soc. 2016, 3, 2053951716679677. [Google Scholar] [CrossRef]
- Kondo, M.C.; Mizes, C.; Lee, J.; McGady-Saier, J.; O’Malley, L.; Diliberto, A.; Burstyn, I. Toward participatory air pollution exposure assessment in a Goods Movement community. Prog. Community Health Partnersh. 2014, 8, 263–264. [Google Scholar] [CrossRef]
- Minkler, M.; Garcia, A.P.; Williams, J.; LoPresti, T.; Lilly, J. Sí se puede: Using participatory research to promote environmental justice in a Latino community in San Diego, California. J. Urban Health 2010, 87, 796–812. [Google Scholar] [CrossRef] [PubMed]
- Minkler, M. Linking Science and Policy Through Community-Based Participatory Research to Study and Address Health Disparities. Am. J. Public Health 2010, 100, S81–S87. [Google Scholar] [CrossRef]
- Snik, F.; Rietjens, J.; Apituley, A.; Volten, H.; Mijling, B.; Di Noia, A.; Heikamp, S.; Heinsbroek, R.C.; Hasekamp, O.; Smit, J.M.; et al. Mapping atmospheric aerosols with a citizen science network of smartphone spectropolarimeters. Geophys. Res. Lett. 2014, 41, 7351–7358. [Google Scholar] [CrossRef]
- Varaden, D.; McKevitt, C.; Barratt, B. Making the invisible visible: Engaging school children in monitoring air pollution in London. Res. All 2018, 2, 267–288. [Google Scholar] [CrossRef]
- Elliot, E.; Eycke, K.T.; Chan, S.; Müller, U. Taking kindergartners outdoors: Documenting their explorations and assessing the impact on their ecological awareness. Child. Youth Environ. 2014, 24, 102–122. [Google Scholar] [CrossRef]
- Fisher-Maltese, C.; Zimmerman, T.D. A garden-based approach to teaching life science produces shifts in students’ attitudes toward the environment. Int. J. Environ. Sci. Educ. 2015, 10, 51–66. [Google Scholar]
- Hansel, T.; Phimmavong, S.; Phengsopha, K.; Phompila, C.; Homduangpachan, K. Developing and implementing a mobile conservation education unit for rural primary school children in Lao PDR. Appl. Environ. Educ. Commun. 2010, 9, 96–103. [Google Scholar] [CrossRef]
- Jenkins, L. Using citizen science beyond teaching science content: A strategy for making science relevant to students’ lives. Cult. Stud. Sci. Educ. 2011, 6, 501–508. [Google Scholar] [CrossRef]
- Madden, L.; Liang, J. Young children’s ideas about environment: Perspectives from three early childhood educational settings. Environ. Educ. Res. 2017, 23, 1055–1071. [Google Scholar] [CrossRef]
- Makuch, K.E.; Aczel, M. Children and Citizen Science, Citizen Science—Innovation in Open Science, Society and Policy; Hecker, S., Haklay, M., Bowser, A., Makuch, Z., Vogel, J., Bonn, A., Eds.; UCL Press: London, UK, 2018; pp. 391–409. ISBN 9781787352339. [Google Scholar]
- Zamani, Z. ‘The woods is a more free space for children to be creative; their imagination kind of sparks out there’: Exploring young children’s cognitive play opportunities in natural, manufactured and mixed outdoor preschool zones. J. Adventure Educ. Outdoor Learn. 2016, 16, 172–189. [Google Scholar] [CrossRef]
- Cohen, S.; Horm-Wingerd, D.M. Children and the environment. Environ. Behav. 1993, 25, 103–120. [Google Scholar] [CrossRef]
- Kahn, P.H.; Lourenço, O. Water, air, fire, and earth. Environ. Behav. 2002, 34, 405–430. [Google Scholar] [CrossRef]
- Evans, G.W.; Brauchle, G.; Haq, A.M.; Stecker, R.; Wong, K.; Shapiro, E. Young children’s environmental attitudes and behaviours. Environ. Behav. 2007, 39, 635–658. [Google Scholar] [CrossRef]
- Damerell, P.; Howe, C.; Milner-Gulland, E.J. Child Orientated Environmental Education Influences Adult Knowledge and Household Behavior. Environ. Res. Lett. 2013, 8, 15016–15022. [Google Scholar] [CrossRef]
- Duvall, J.; Zint, M. A Review of Research on the Effectiveness of Environmental Education in Promoting Intergenerational Learning. J. Environ. Educ. 2007, 38, 14–24. [Google Scholar] [CrossRef]
- Hartley, B.L.; Thompson, R.C.; Pahl, S. Marine litter education boosts children’s understanding and self-reported actions. Mar. Pollut. Bull. 2015, 90, 209–217. [Google Scholar] [CrossRef] [PubMed]
- Ardoin, N.M.; Bowers, A.W. Early Childhood Environmental Education: A systematic review of the research literature. Educ. Res. Rev. 2020, 31, 100353. [Google Scholar] [CrossRef] [PubMed]
- Masalimova, A.R.; Erdyneeva, K.G.; Kryukova, N.I.; Khlusyanov, O.V.; Chudnovskiy, A.D.; Dobrokhotov, D.A. Bibliometric analysis of augmented reality in education and social science. Online J. Commun. Media Technol. 2023, 13, e202316. [Google Scholar] [CrossRef]
- Stern, M.J.; Powell, R.B.; Hill, D. Environmental education program evaluation in the new millennium: What do we measure and what have we learned? Environ. Educ. Res. 2013, 20, 581–611. [Google Scholar] [CrossRef]
- Ulfah, M.; Suyanto, S.; Aminatun, T. The completeness of environmental literacy aspects studied in the articles published in several countries. J. Pendidik. Biol. Indones. (J. Indones. Biol. Educ.) 2020, 6, 75–82. [Google Scholar] [CrossRef]
- Cincera, J.; Kroufek, R.; Simonova, P.; Broukalova, L.; Broukal, V.; Skalík, J. Eco-School in kindergartens: The effects, interpretation, and implementation of a pilot program. Environ. Educ. Res. 2017, 23, 919–936. [Google Scholar] [CrossRef]
- European Environmental Agency (EEA). New Initiative to Measure Outdoor Air Quality at Schools across Europe. 2019. Available online: https://www.eea.europa.eu/highlights/new-initiative-to-measure-outdoor (accessed on 12 June 2023).
- Coe, H.A. Embracing risk in the Canadian woodlands: Four children’s risky play and risk-taking experiences in a Canadian Forest Kindergarten. J. Early Child. Res. 2017, 15, 374–388. [Google Scholar] [CrossRef]
- Largo-Wight, E.; Guardino, C.; Wludyka, P.S.; Hall, K.W.; Wight, J.T.; Merten, J.W. Nature contact at school: The impact of an outdoor classroom on children’s well-being. Int. J. Environ. Health Res. 2018, 28, 653–666. [Google Scholar] [CrossRef]
- Wojciehowski, M.; Ernst, J. Creative by nature: Investigating the impact of nature preschools on young children’s creative thinking. Int. J. Early Child. Environ. Educ. 2018, 6, 3–20. [Google Scholar]
- Miller, M.G.; Davis, J.M.; Boyd, W.; Danby, S. Learning about and taking action for the environment: Child and teacher experiences in a preschool water education program. Child. Youth Environ. 2014, 24, 43–57. [Google Scholar] [CrossRef]
- Álvaro-Francisco, M.; Hernández, M. What Do School Children Know about Climate Change? A Social Sciences Approach. Soc. Sci. 2022, 11, 179. [Google Scholar] [CrossRef]
- Cameron-Faulkner, T.; Macdonald, R.; Serratrice, L.; Melville, J.; Gattis, M. Plant yourself where language blooms: Direct experience of nature changes how parents and children talk about nature. Child. Youth Environ. 2017, 27, 110–124. [Google Scholar] [CrossRef]
- Gambino, A.; Davis, J.; Rowntree, N. Young children learning for the environment: Researching a forest adventure. Aust. J. Environ. Educ. 2009, 25, 83–94. [Google Scholar] [CrossRef]
- Green, C. Children environmental identity development in an Alaska native rural context. Int. J. Early Child. 2017, 49, 303–319. [Google Scholar] [CrossRef]
- Miller, D.L. The seeds of learning: Young children develop important skills through their gardening activities at a midwestern early education program. Appl. Environ. Educ. Commun. 2007, 6, 49–66. [Google Scholar] [CrossRef]
- Hadzigeorgiou, Y.; Prevezanou, B.; Kabouropoulou, M.; Konsolas, M. Teaching about the importance of trees: A study with young children. Environ. Educ. Res. 2011, 17, 519–536. [Google Scholar] [CrossRef]
- Hsiao, C.-Y.; Shih, P.Y. Exploring the effectiveness of picture books for teaching young children the concepts of environmental protection. Int. Res. Geogr. Environ. Educ. 2016, 25, 36–49. [Google Scholar] [CrossRef]
- Lithoxoidou, L.S.; Georgopoulos, A.D.; Dimitriou, A.T.; Xenitidou, S.C. Trees have a soul too!” Developing empathy and environmental values in early childhood. Int. J. Early Child. Environ. Educ. 2017, 5, 68–88. [Google Scholar]
- Murakami, C.D.; Su-Russell, C.; Manfra, L. Analyzing teacher narratives in early childhood garden-based education. J. Environ. Educ. 2018, 49, 18–29. [Google Scholar] [CrossRef]
- Castell, N.; Grossberndt, S.; Gray, L.; Fredriksen, M.; Skaar, J.S.; Høiskar, B.a.K. Implementing citizen science in primary schools: Engaging young children in monitoring air pollution. Front. Clim. 2021, 3, 639128. [Google Scholar] [CrossRef]
- Lorenzini, G.; Nali, C. Bio-monitoring of ozone by young students. J. Biol. Educ. 2004, 38, 158–162. [Google Scholar] [CrossRef]
- Boniardi, G.; Turolla, A.; Fiameni, L.; Gelmi, E.; Malpei, F.; Bontempi, E.; Canziani, R. Assessment of a simple and replicable procedure for selective phosphorus recovery from sewage sludge ashes by wet chemical extraction and precipitation. Chemosphere 2021, 285, 131476. [Google Scholar] [CrossRef]
- Grossberndt, S.; Schneider, P.; Liu, H.Y.; Fredriksen, M.F.; Castell, N.; Syropoulou, P.; Bartoňová, A. Public perception of urban air quality using volunteered geographic information services. Urban Plan. 2020, 5, 45–58. [Google Scholar] [CrossRef]
- European Environmental Agency (EEA). Assessing Air Quality through Citizen Science [Online]. EEA, Copenhagen. 2019. Available online: https://www.eea.europa.eu/publications/assessing-air-quality-through-citizen-science (accessed on 15 September 2023).
- Fjukstad, B.; Angelvik, N.; Hauglann, M.W.; Knutsen, J.S.; Grønnesby, M.; Gunhildrud, H.; Bongo, L.A. Low-Cost Programmable Air Quality Sensor Kits in Science Education. In Proceedings of the 49th ACM Technical Symposium on Computer Science Education, Baltimore, MD, USA, 21–24 February 2018. [Google Scholar] [CrossRef]
- Health and Environment Alliance. Healthier Air, Healthier Children. 50 Schools across the EU Monitor Air Quality; HEAL Report; Health and Environment Alliance: Brussels, Belgium, 2019; Available online: https://www.env-health.org/wp-content/uploads/2019/10/HEAL-Healthy-air-children-web.pdf (accessed on 23 August 2022).
- Rushton, E.; Varaden, D.; King, H.; Barratt, B. Engaging primary students with the issue of air pollution through citizen science: Lessons to be learnt. J. Emergent Sci. 2021, 21, 30–36. [Google Scholar]
- Varaden, D.; Leidland, E.; Lim, S.; Barratt, B. “I am an air quality scientist”—Using citizen science to characterise school children’s exposure to air pollution. Environ. Res. 2021, 201, 111536. [Google Scholar] [CrossRef] [PubMed]
- WHO. Air Pollution Overview. World Health Organization. 2024. Available online: https://www.who.int/health-topics/air-pollution#tab=tab_1 (accessed on 12 July 2024).
- Rickinson, M. Learners and Learning in Environmental Education: A Critical Review of the Evidence. Environ. Educ. Res. 2001, 7, 207–320. [Google Scholar] [CrossRef]
- Gurjar, B.R.; Molina, L.T.; Ojha, C.P. Air Pollution: Health and Environmental Impacts; Taylor & Francis Group: Abingdon, UK, 2010. [Google Scholar]
- Hoek, G.; Krishnan, R.; Beelen, R.; Peters, A.; Ostro, B.; Brunekreef, B.; Kaufman, J.D. Long-term air pollution exposure and cardio-respiratory mortality: A review. Environ. Health 2013, 12, 43. [Google Scholar] [CrossRef] [PubMed]
- Varaden, D.; Leidland, E.; Barratt, B. The Breathe London Wearables Study: Engaging Primary School Children to Monitor Air Pollution in London; King’s College London Environmental Research Group: London, UK, 2019. [Google Scholar]
- Sadrizadeh, S.; Yao, R.; Yuan, F.; Awbi, H.; Bahnfleth, W.; Bi, Y.; Cao, G.; Croitoru, C.; de Dear, R.; Haghighat, F.; et al. Indoor air quality and health in schools: A critical review for developing the roadmap for the future school environment. J. Build. Eng. 2022, 57, 104908. [Google Scholar] [CrossRef]
- Perscom. National Travel Survey. 2018. Available online: https://tinyurl.com/NTSPerscom18 (accessed on 24 December 2021).
- Ferreira, A.M.d.C.; Cardoso, M. Indoor air quality and health in schools. J. Bras. De Pneumol. Publicaçao Off. Soc. Bras. Pneumol. Tisilogia 2014, 40, 259–268. [Google Scholar] [CrossRef]
- Dorizas, P.V.; Assimakopoulos, M.-N.; Santamouris, M. A holistic approach for the assessment of the indoor environmental quality, student productivity, and energy consumption in primary schools. Environ. Monit. Assess. 2015, 187, 4503. [Google Scholar] [CrossRef]
- Pacitto, A.; Stabile, L.; Viana, M.; Scungio, M.; Reche, C.; Querol, X.; Alastuey, A.; Rivas, I.; Álvarez-Pedrerol, M.; Sunyer, J.; et al. Particle-related exposure, dose and lung cancer risk of primary school children in two European countries. Sci. Total Environ. 2018, 616–617, 720–729. [Google Scholar] [CrossRef]
- Smedje, G.; Norbäck, D. New Ventilation Systems at Select Schools in Sweden—Effects on Asthma and Exposure. Arch. Environ. Health 2000, 55, 18–25. [Google Scholar] [CrossRef] [PubMed]
- Toyinbo, O.; Matilainen, M.; Turunen, M.; Putus, T.; Shaughnessy, R.; Haverinen-Shaughnessy, U. Modeling associations between principals’ reported indoor environmental quality and students’ self-reported respiratory health outcomes using GLMM and ZIP models. Int. J. Environ. Res. Public Health 2016, 13, 385. [Google Scholar] [CrossRef] [PubMed]
- Stafford, T.M. Indoor air quality and academic performance. J. Environ. Econ. Manag. 2015, 70, 34–50. [Google Scholar] [CrossRef]
- Wargocki, P.; Wyon, D. The Effects of Moderately Raised Classroom Temperatures and Classroom Ventilation Rate on the Performance of Schoolwork by Children. HVAC&R Res. 2007, 13, 193–220. [Google Scholar] [CrossRef]
- Vornanen-Winqvist, C.; Järvi, K.; Andersson, M.A.; Duchaine, C.; Létourneau, V.; Kedves, O.; Kredics, L.; Mikkola, R.; Kurnitski, J.; Salonen, H. Exposure to indoor air contaminants in school buildings with and without reported indoor air quality problems. Environ. Int. 2020, 141, 105781. [Google Scholar] [CrossRef]
- Hyvonen, S.M.; Lohi, J.J.; Rasanen, L.A.; Heinonen, T.; Mannerstrom, M.; Vaali, K.; Tuuminen, T. Association of toxic indoor air with multi-organ symptoms in pupils attending a moisture-damaged school in Finland. Am. J. Clin. Exp. Immunol. 2020, 9, 101–113. [Google Scholar]
- Salthammer, T.; Uhde, E.; Schripp, T.; Schieweck, A.; Morawska, L.; Mazaheri, M.; Clifford, S.; He, C.; Buonanno, G.; Querol, X.; et al. Children’s well-being at schools: Impact of climatic conditions and air pollution. Environ. Int. 2016, 94, 196–210. [Google Scholar] [CrossRef]
- Chen, C.; Zhao, B. Review of relationship between indoor and outdoor particles: I/O ratio, infiltration factor and penetration factor. Atmos. Environ. 2011, 45, 275–288. [Google Scholar] [CrossRef]
- Breen, M.S.; Schultz, B.D.; Sohn, M.D.; Long, T.; Langstaff, J.; Williams, R.; Isaacs, K.; Meng, Q.Y.; Stallings, C.; Smith, L. A review of air exchange rate models for air pollution exposure assessments. J. Expo. Sci. Environ. Epidemiol. 2014, 24, 555–563. [Google Scholar] [CrossRef]
- Ackley, A. Measuring Indoor Environmental Quality (IEQ) in a National School Property Portfolio. Ph.D. Thesis, Victoria University of Wellington, Wellington, New Zealand, 2021. Available online: https://openaccess.wgtn.ac.nz/articles/thesis/Measuring_Indoor_Environmental_Quality_IEQ_in_a_National_School_Property_Portfolio/14050715/1 (accessed on 23 January 2023).
- Ackley, A.; Donn, M.; Thomas, G.; Enegbuma, W.; Chowdhury, S. Use of Carbon Dioxide (CO2) Monitors to Assess Ventilation Effectiveness in Schools. J. Sustain. Archit. Civ. Eng. 2023, 32, 130–144. [Google Scholar] [CrossRef]
- Majd, E.; McCormack, M.; Davis, M.; Curriero, F.; Berman, J.; Connolly, F.; Leaf, P.; Rule, A.; Green, T.; Clemons-Erby, D.; et al. Indoor air quality in inner-city schools and its associations with building characteristics and environmental factors. Environ. Res. 2019, 170, 83–91. [Google Scholar] [CrossRef] [PubMed]
- WHO. Ambient (Outdoor) Air Pollution. World Health Organization. 2024. Available online: https://www.who.int/news-room/fact-sheets/detail/ambient-(outdoor)-air-quality-and-health (accessed on 12 July 2024).
- Schraufnagel, D.E.; Balmes, J.R.; Cowl, C.T.; De Matteis, S.; Jung, S.H.; Mortimer, K.; Perez-Padilla, R.; Rice, M.B.; Riojas-Rodriguez, H.; Sood, A.; et al. Air Pollution and Noncommunicable Diseases: A Review by the Forum of International Respiratory Societies’ Environmental Committee, Part 1: The Damaging Effects of Air Pollution. Chest 2019, 155, 409–416. [Google Scholar] [CrossRef]
- Jendrossek, S.N.; Jurk, L.A.; Remmers, K.; Cetin, Y.E.; Sunder, W.; Kriegel, M.; Gastmeier, P. The Influence of Ventilation Measures on the Airborne Risk of Infection in Schools: A Scoping Review. Int. J. Environ. Res. Public Health 2023, 20, 3746. [Google Scholar] [CrossRef] [PubMed]
- WHO. WHO Guidelines for Indoor Air Quality: Selected Pollutants. 2010. Available online: www.euro.who.int (accessed on 7 May 2021).
- WHO. More Than 90% of the World’s Children Breathe Toxic Air Every Day. World Health Organization. 2018. Available online: https://www.who.int/news/item/29-10-2018-more-than-90-of-the-worlds-children-breathe-toxic-air-every-day (accessed on 12 July 2024).
- Longley, I.; Kingham, S.; Dirks, K.; Somervell, E.; Pattinson, W.; Elangasingh, A. Detailed Observations and Validated Modelling of the Impact of Traffic on the Air Quality of Roadside Communities; NZ Transport Agency: Auckland, New Zealand, 2013. [Google Scholar]
- Viippola, V.; Whitlow, T.H.; Zhao, W.; Yli-Pelkonen, V.; Mikola, J.; Pouyat, R.; Setälä, H. The effects of trees on air pollutant levels in peri-urban near-road environments. Urban For. Urban Green. 2018, 30, 62–71. [Google Scholar] [CrossRef]
- Rawat, N.; Kumar, P. Interventions for improving indoor and outdoor air quality in and around schools. Sci. Total Environ. 2023, 858, 159813. [Google Scholar] [CrossRef] [PubMed]
- Trees for Cities. 2021. Available online: https://www.treesforcities.org/our-work/schools-programme/planting-healthy-air-in-schools-1 (accessed on 21 August 2022).
- Greater London Authority. Top 20 Schools Suffering Highest Pollution Levels in London. London Assembly. 2022. Available online: https://www.london.gov.uk/who-we-are/what-london-assembly-does/questions-mayor/find-an-answer/top-20-schools-suffering-highest-pollution-levels-london (accessed on 9 April 2023).
- St. Pauls Primary School Website. Home | St Paul’s CE Primary School: 2023. Available online: https://www.stpaulsprimary.org/ (accessed on 2 February 2024).
- Hammersmith & Fulham Council. Air Quality Annual Status Report for 2019. 2019. Available online: https://www.lbhf.gov.uk/sites/default/files/section_attachments/2019_lbhf_air_quality_annual_status_report_final.pdf (accessed on 9 June 2023).
- Walton, H.; Dajnak, D.; Beevers, S.; Williams, M.; Watkiss, P.; Hunt, A. Understanding the Health Impacts of Air Pollution in London. In Transport for London and The Greater London Authority; Kings College London: London, UK, 2015; Available online: https://urbanaccessregulations.eu/images/stories/pdf_files/London%20air%20pollution%20deaths%20KingsReport%2014072015.pdf (accessed on 25 June 2021).
- Christ Church Bentick CE Primary School. Home About Our School Admissions. 2023. Available online: https://www.ccbprimary.co.uk/admissions/ (accessed on 5 January 2024).
- DEFRA. Marylebone Road, London—Non-Automatic Data; DEFRA: Defra, UK, 2023.
- Lambeth London Borough Council. Air Quality Annual Status Report 2020. 2021. Available online: https://www.lambeth.gov.uk/sites/default/files/2021-08/London%20Borough%20of%20Lambeth%20-%20Air%20Quality%20Annual%20Status%20Report%202020.pdf (accessed on 21 June 2022).
- Impact on Urban Health. Air Pollution and Children. 2023. Available online: https://urbanhealth.org.uk/insights/reports/air-pollution-and-children (accessed on 2 April 2024).
- Sloan, C.D.; Philipp, T.J.; Bradshaw, R.K.; Chronister, S.; Barber, W.B.; Johnston, J.D. Applications of GPS-tracked personal and fixed-location PM2.5 continuous exposure monitoring. J. Air Waste Manag. Assoc. 2016, 66, 53–65. [Google Scholar]
- TSI. SIDEPAK™ AM520 Personal Aerosol Monitor Frequently Asked Questions (A4-EMEA). 2016. Available online: https://tsi.com/getmedia/0ed2e678-9b7f-4e75-8415-ba80a47aa0c1/SidePak_AM520_FAQs_5001736_A4_EMEA-web?ext=.pdf (accessed on 21 May 2022).
- Dommeyer, C.J.; Baum, P.; Hanna, R.W. College Students’ Attitudes toward Methods of Collecting Teaching Evaluations: In-Class versus On-Line. J. Educ. Bus. 2002, 78, 11–15. Available online: https://www.tandfonline.com/doi/abs/10.1080/08832320209599691 (accessed on 15 June 2023). [CrossRef]
- Nulty, D.D. The adequacy of response rates to online and paper surveys: What can be done? Assess. Eval. High. Educ. 2008, 33, 301–314. [Google Scholar] [CrossRef]
- DeWalt, K.M.; DeWalt, B.R. Participant observation. In Handbook of Methods in Cultural Anthropology; Bernard, H.R., Ed.; AltaMira Press: Walnut Creek, CA, USA, 1998; pp. 259–300. [Google Scholar]
- Gehl, J.; Svarre, B. How to Study Public Life? Island Press: Washington, DC, USA, 2013. [Google Scholar]
- Whyte, W. City: Rediscovering the Centre; Doubleday: New York, NY, USA, 1988. [Google Scholar]
- Gehl, J. City to Waterfront: Public Spaces and Public Life Study; Wellington City Council: Wellington, New Zealand, 2004. [Google Scholar]
- Gehl, J. Towards a Fine City for People: Public Spaces and Public Life Study; Gehl Architects: London, UK, 2004. [Google Scholar]
- Daily Air Quality Index by Defra. Available online: https://uk-air.defra.gov.uk/air-pollution/daqi?view=more-info&pollutant=no2#pollutant (accessed on 6 April 2024).
- Leeming, F.C.; Dwyer, W.O.; Porter, B.E.; Cobern, M.K. Outcome Research in Environmental Education: A Critical Review. J. Environ. Educ. 1993, 24, 8–21. [Google Scholar] [CrossRef]
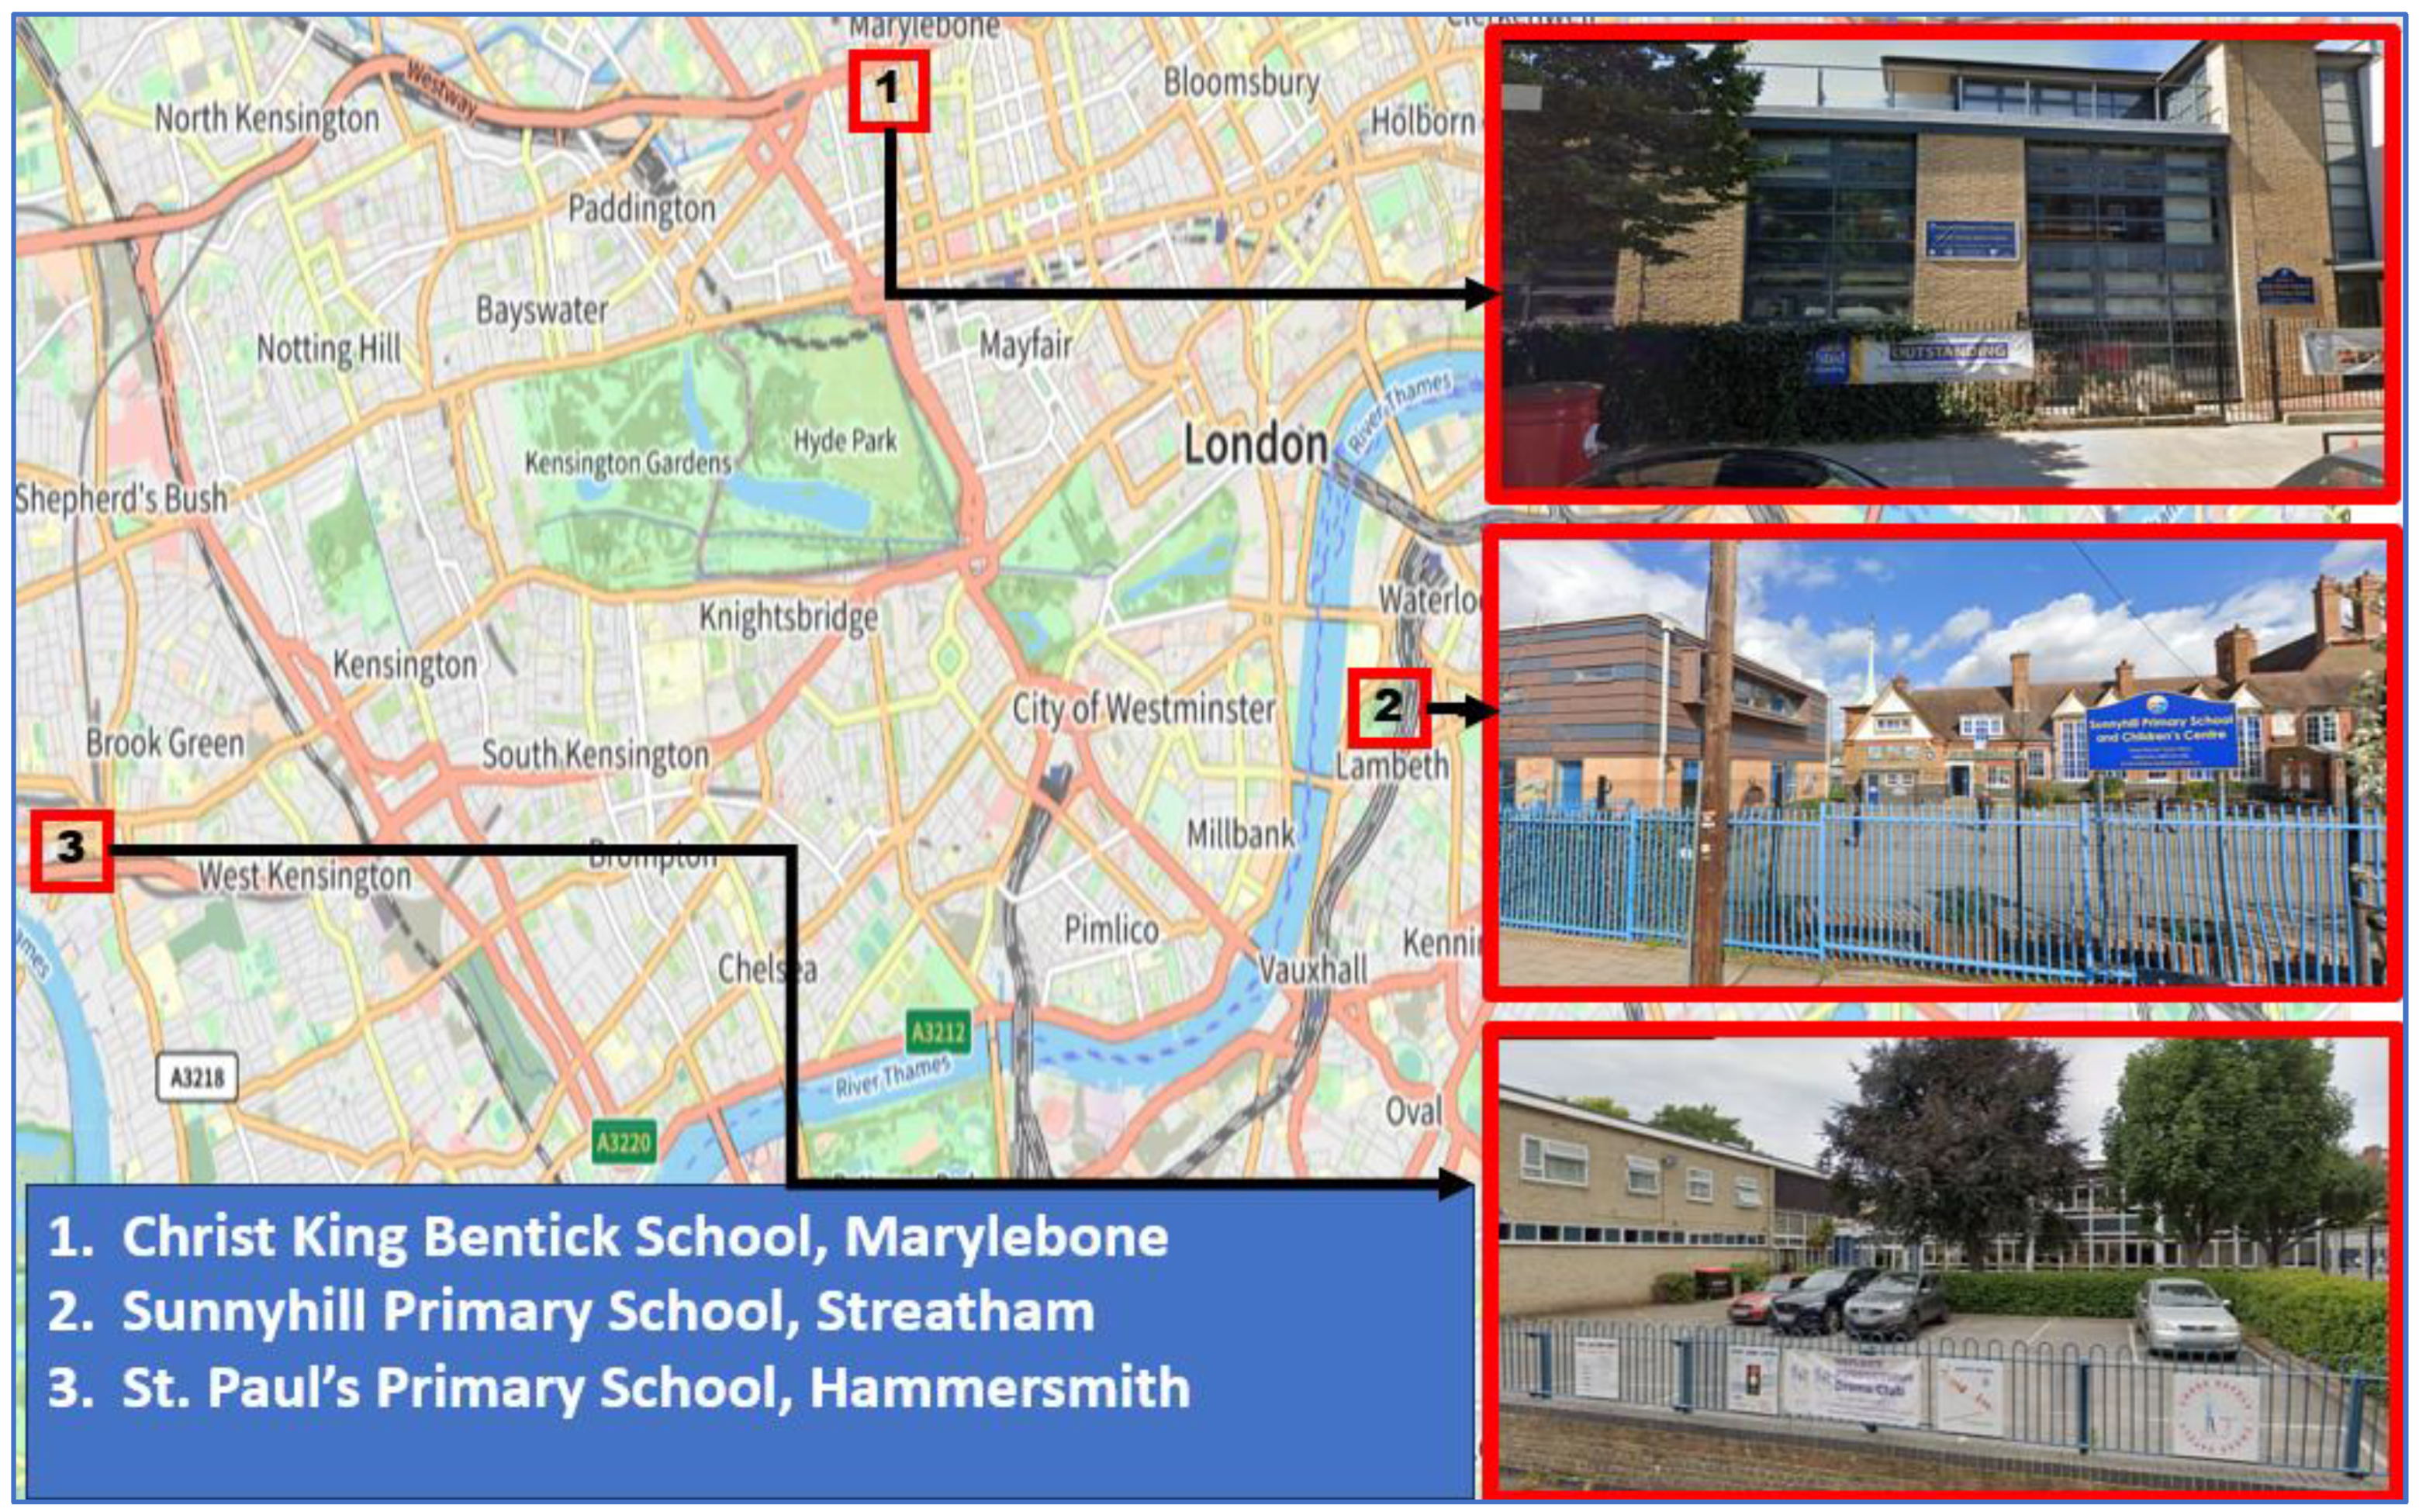
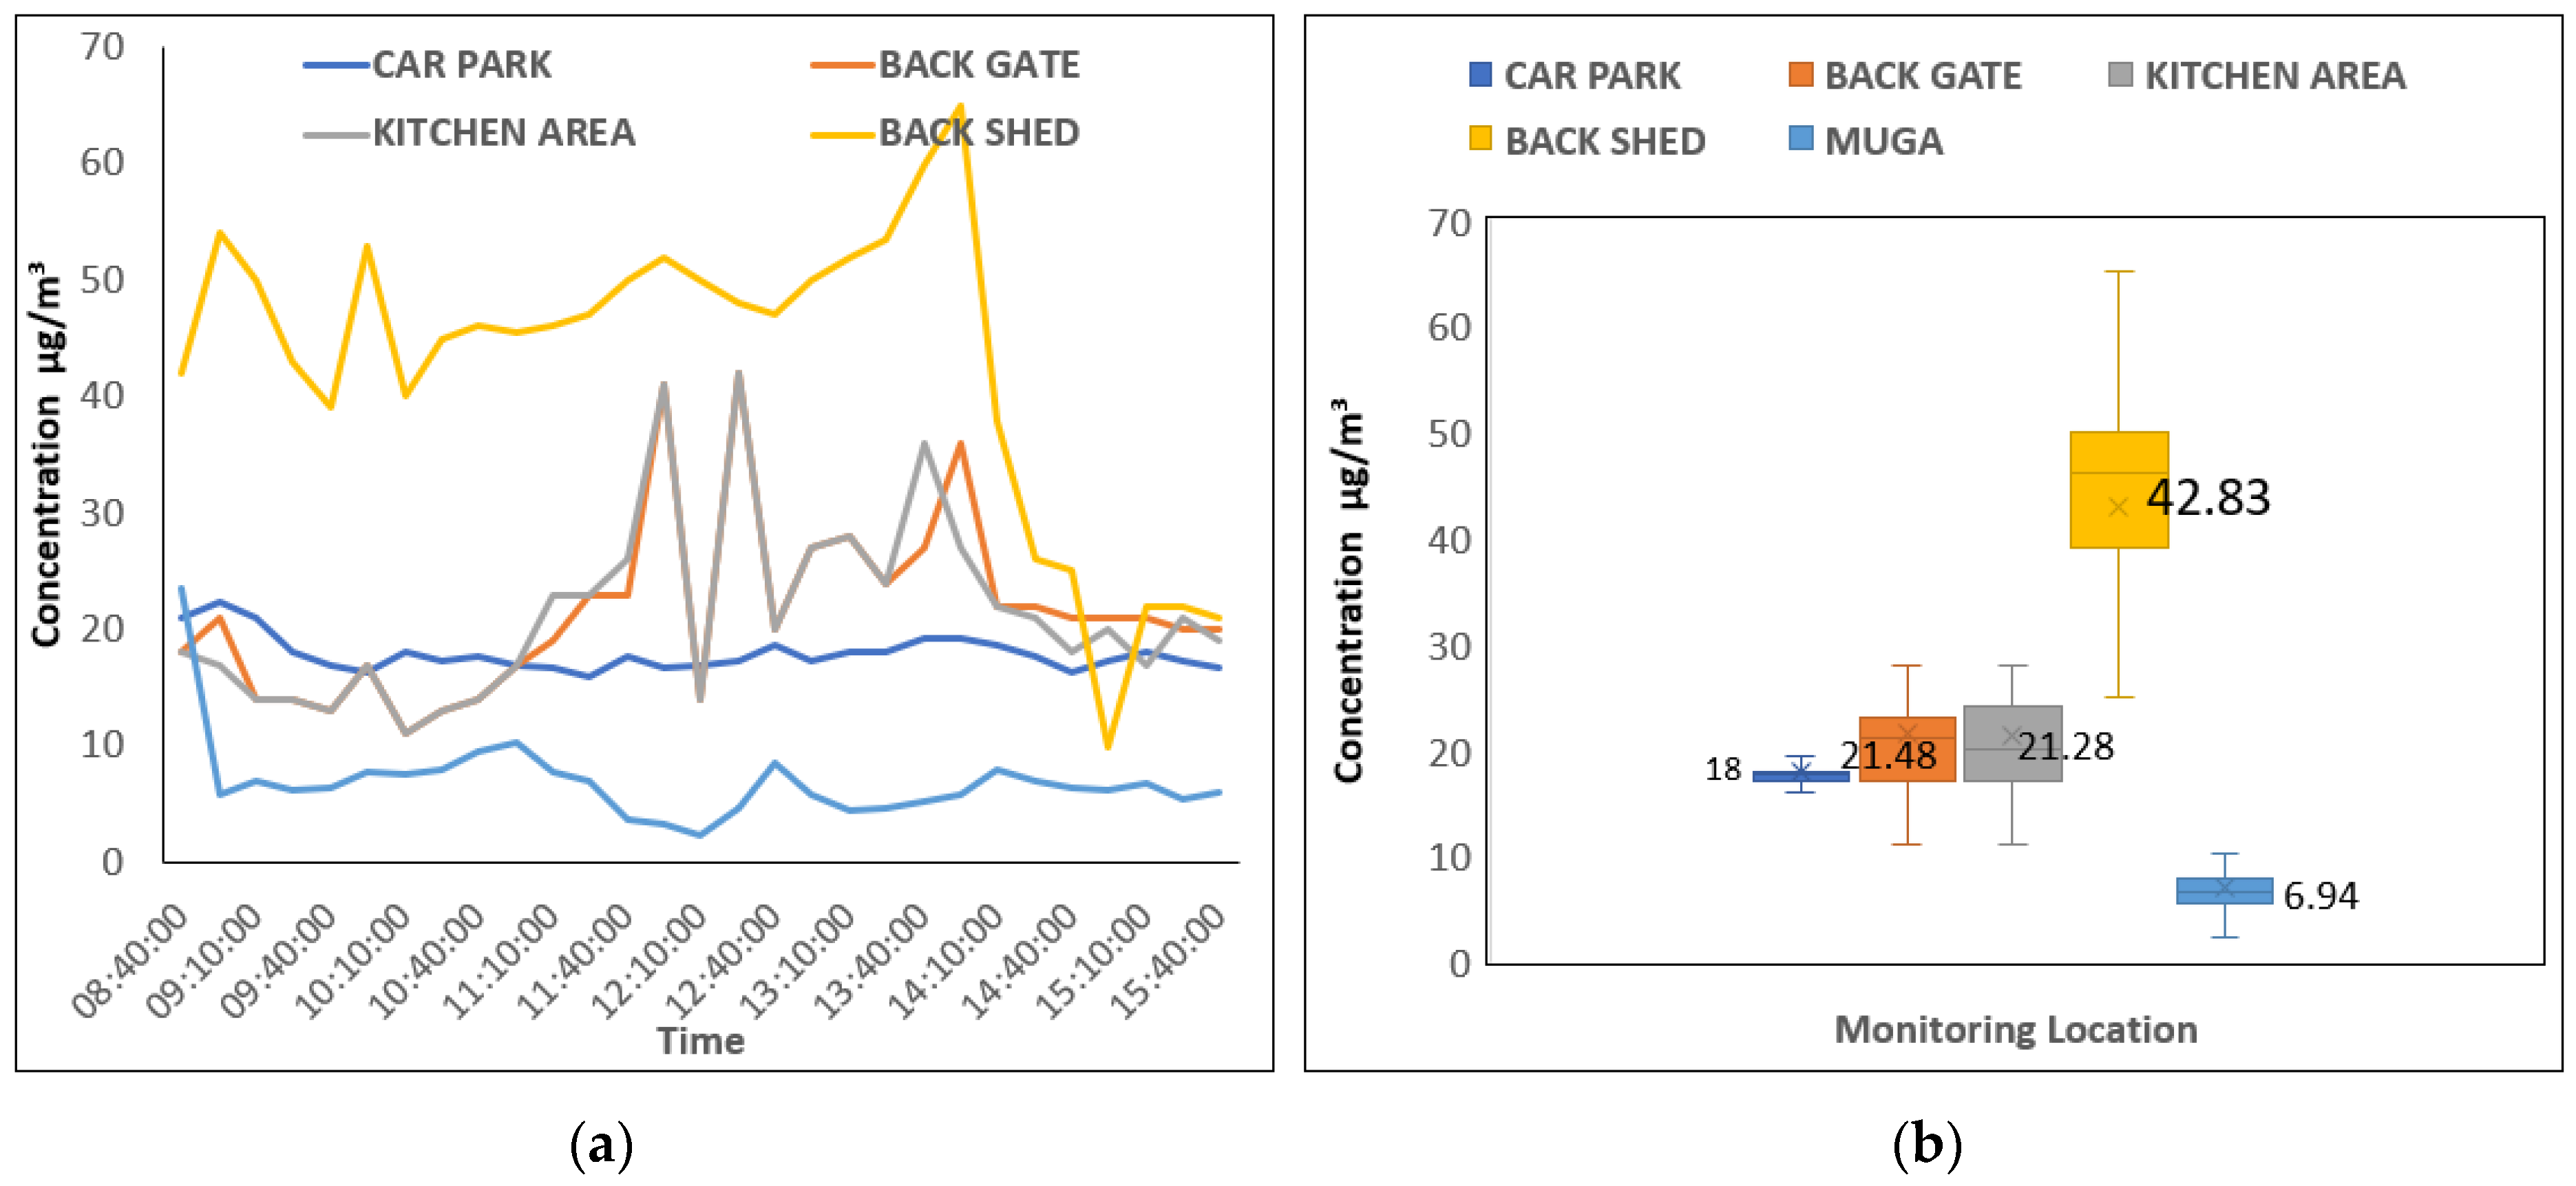
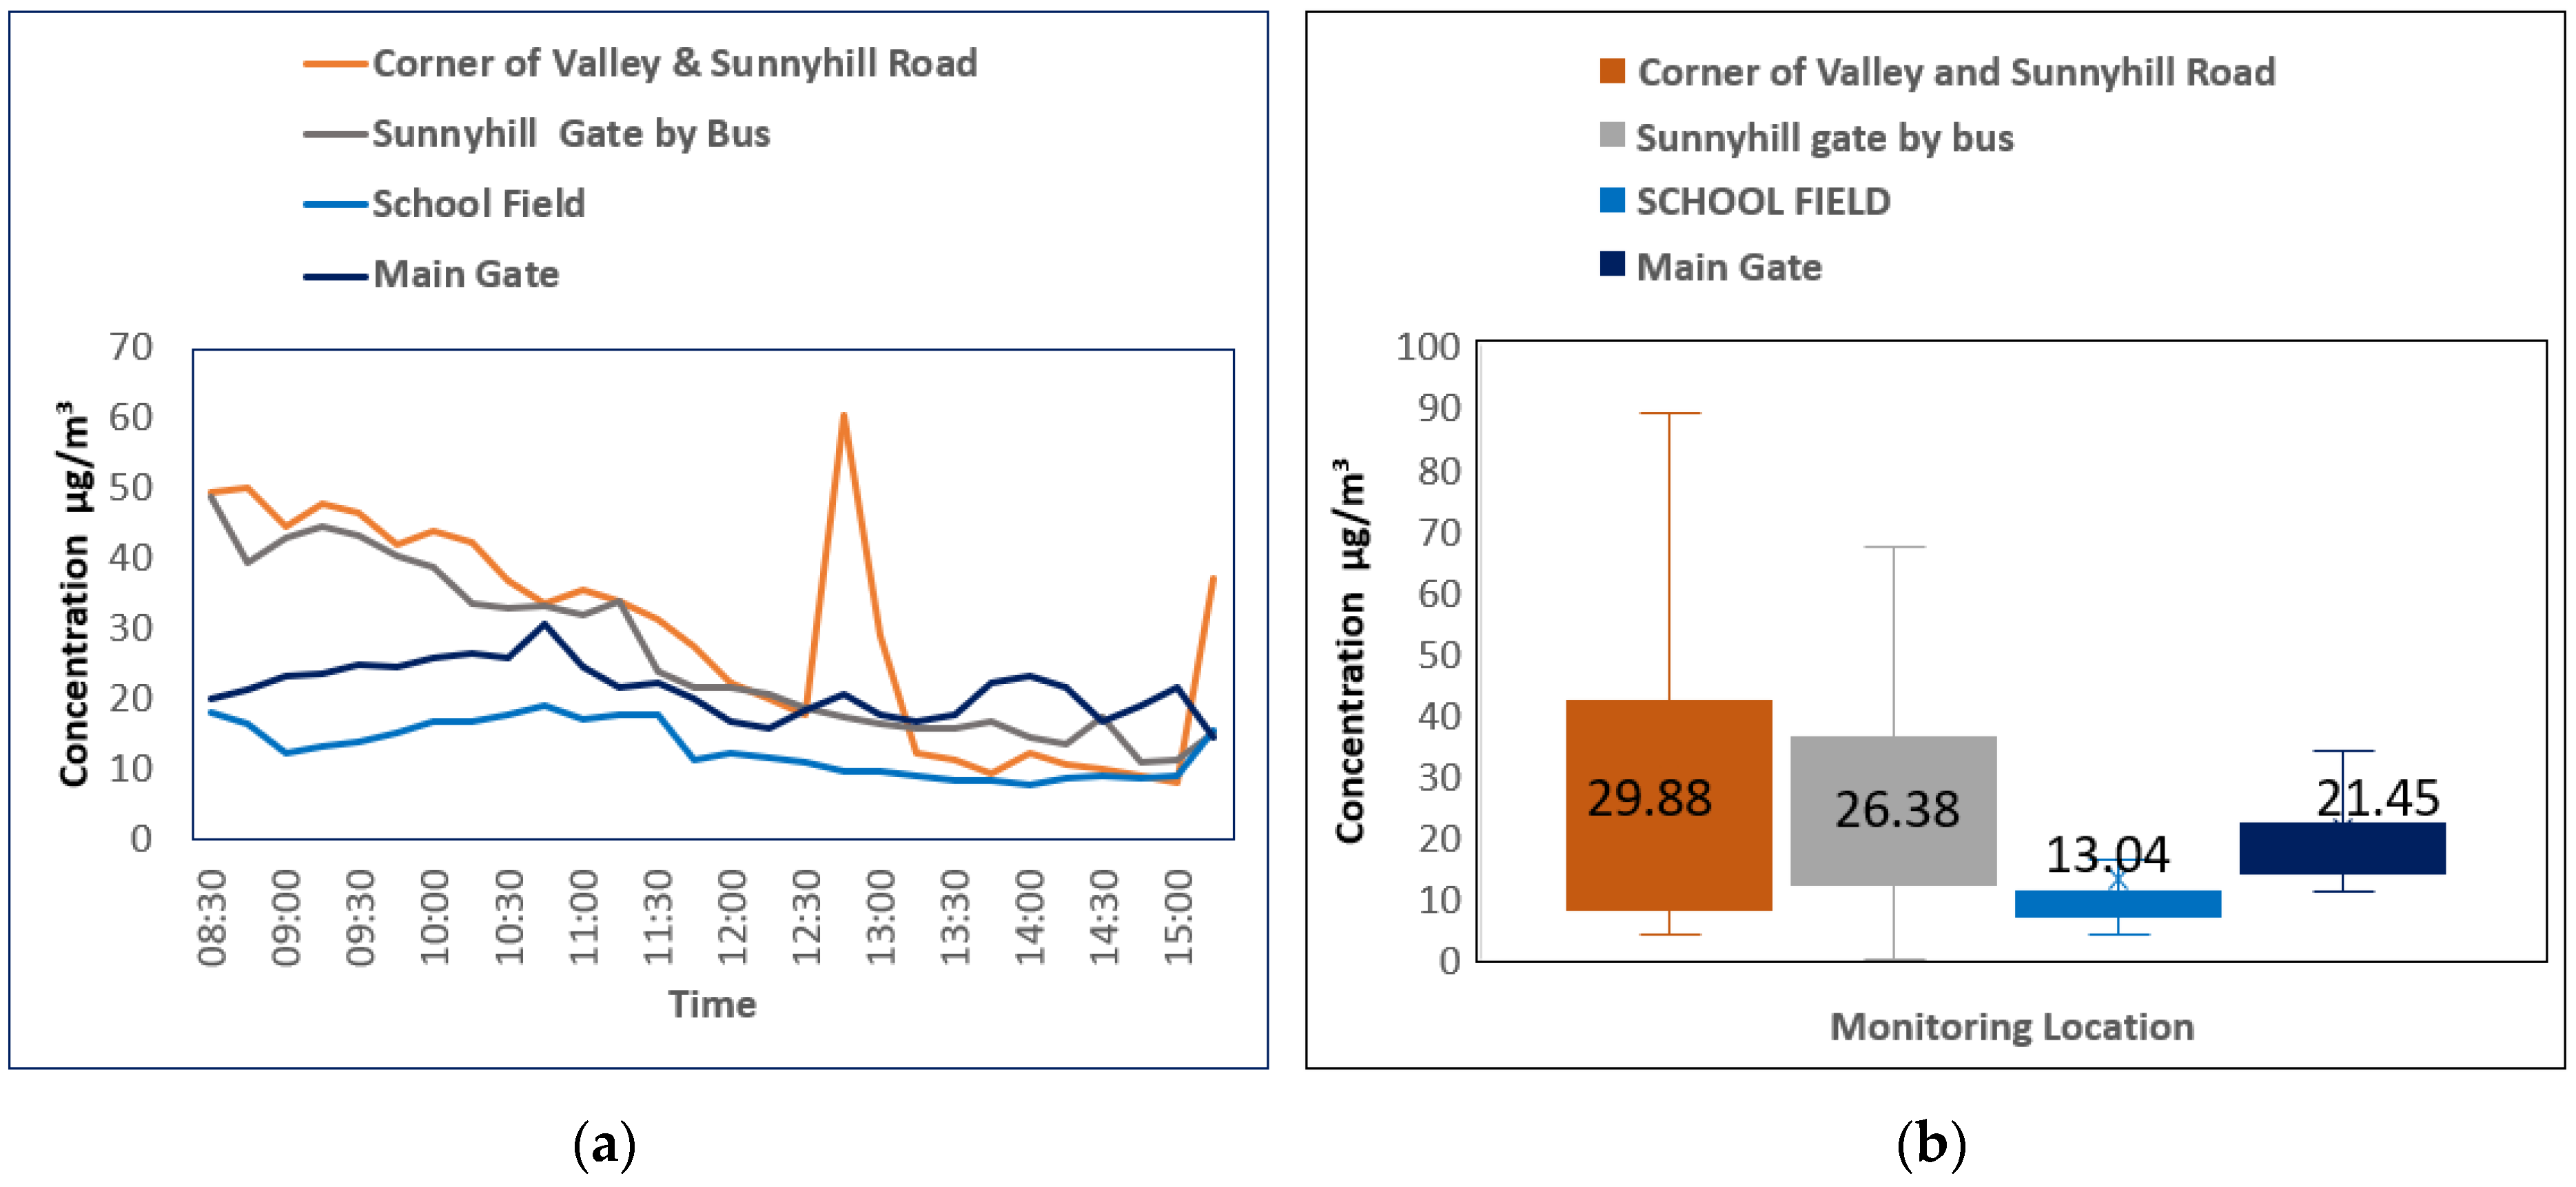
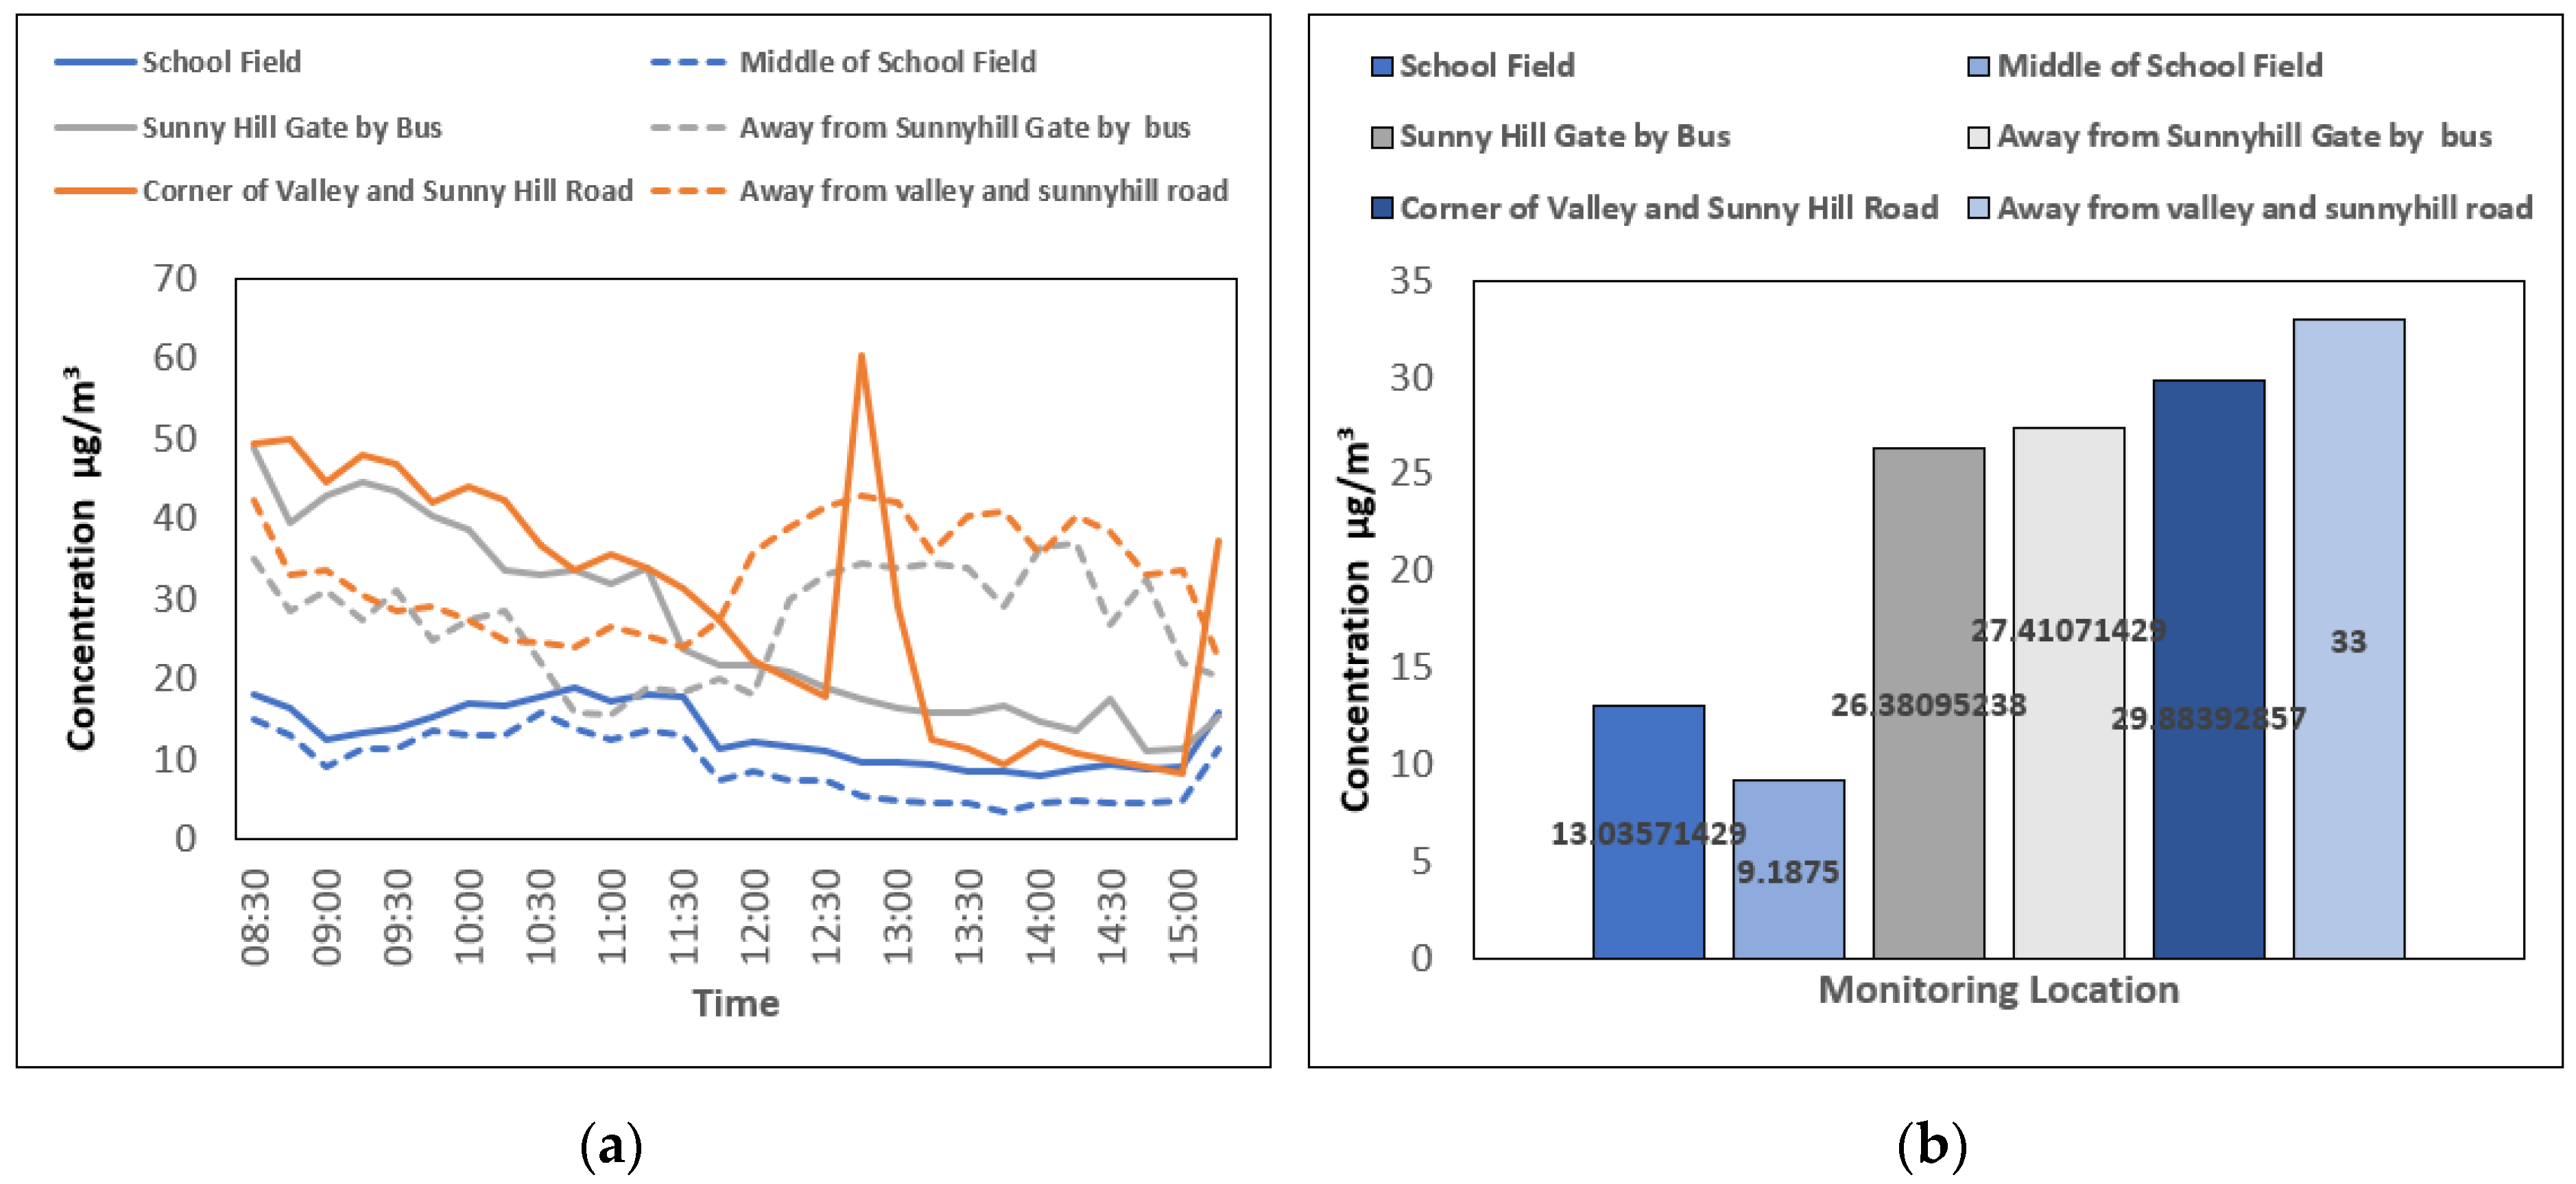
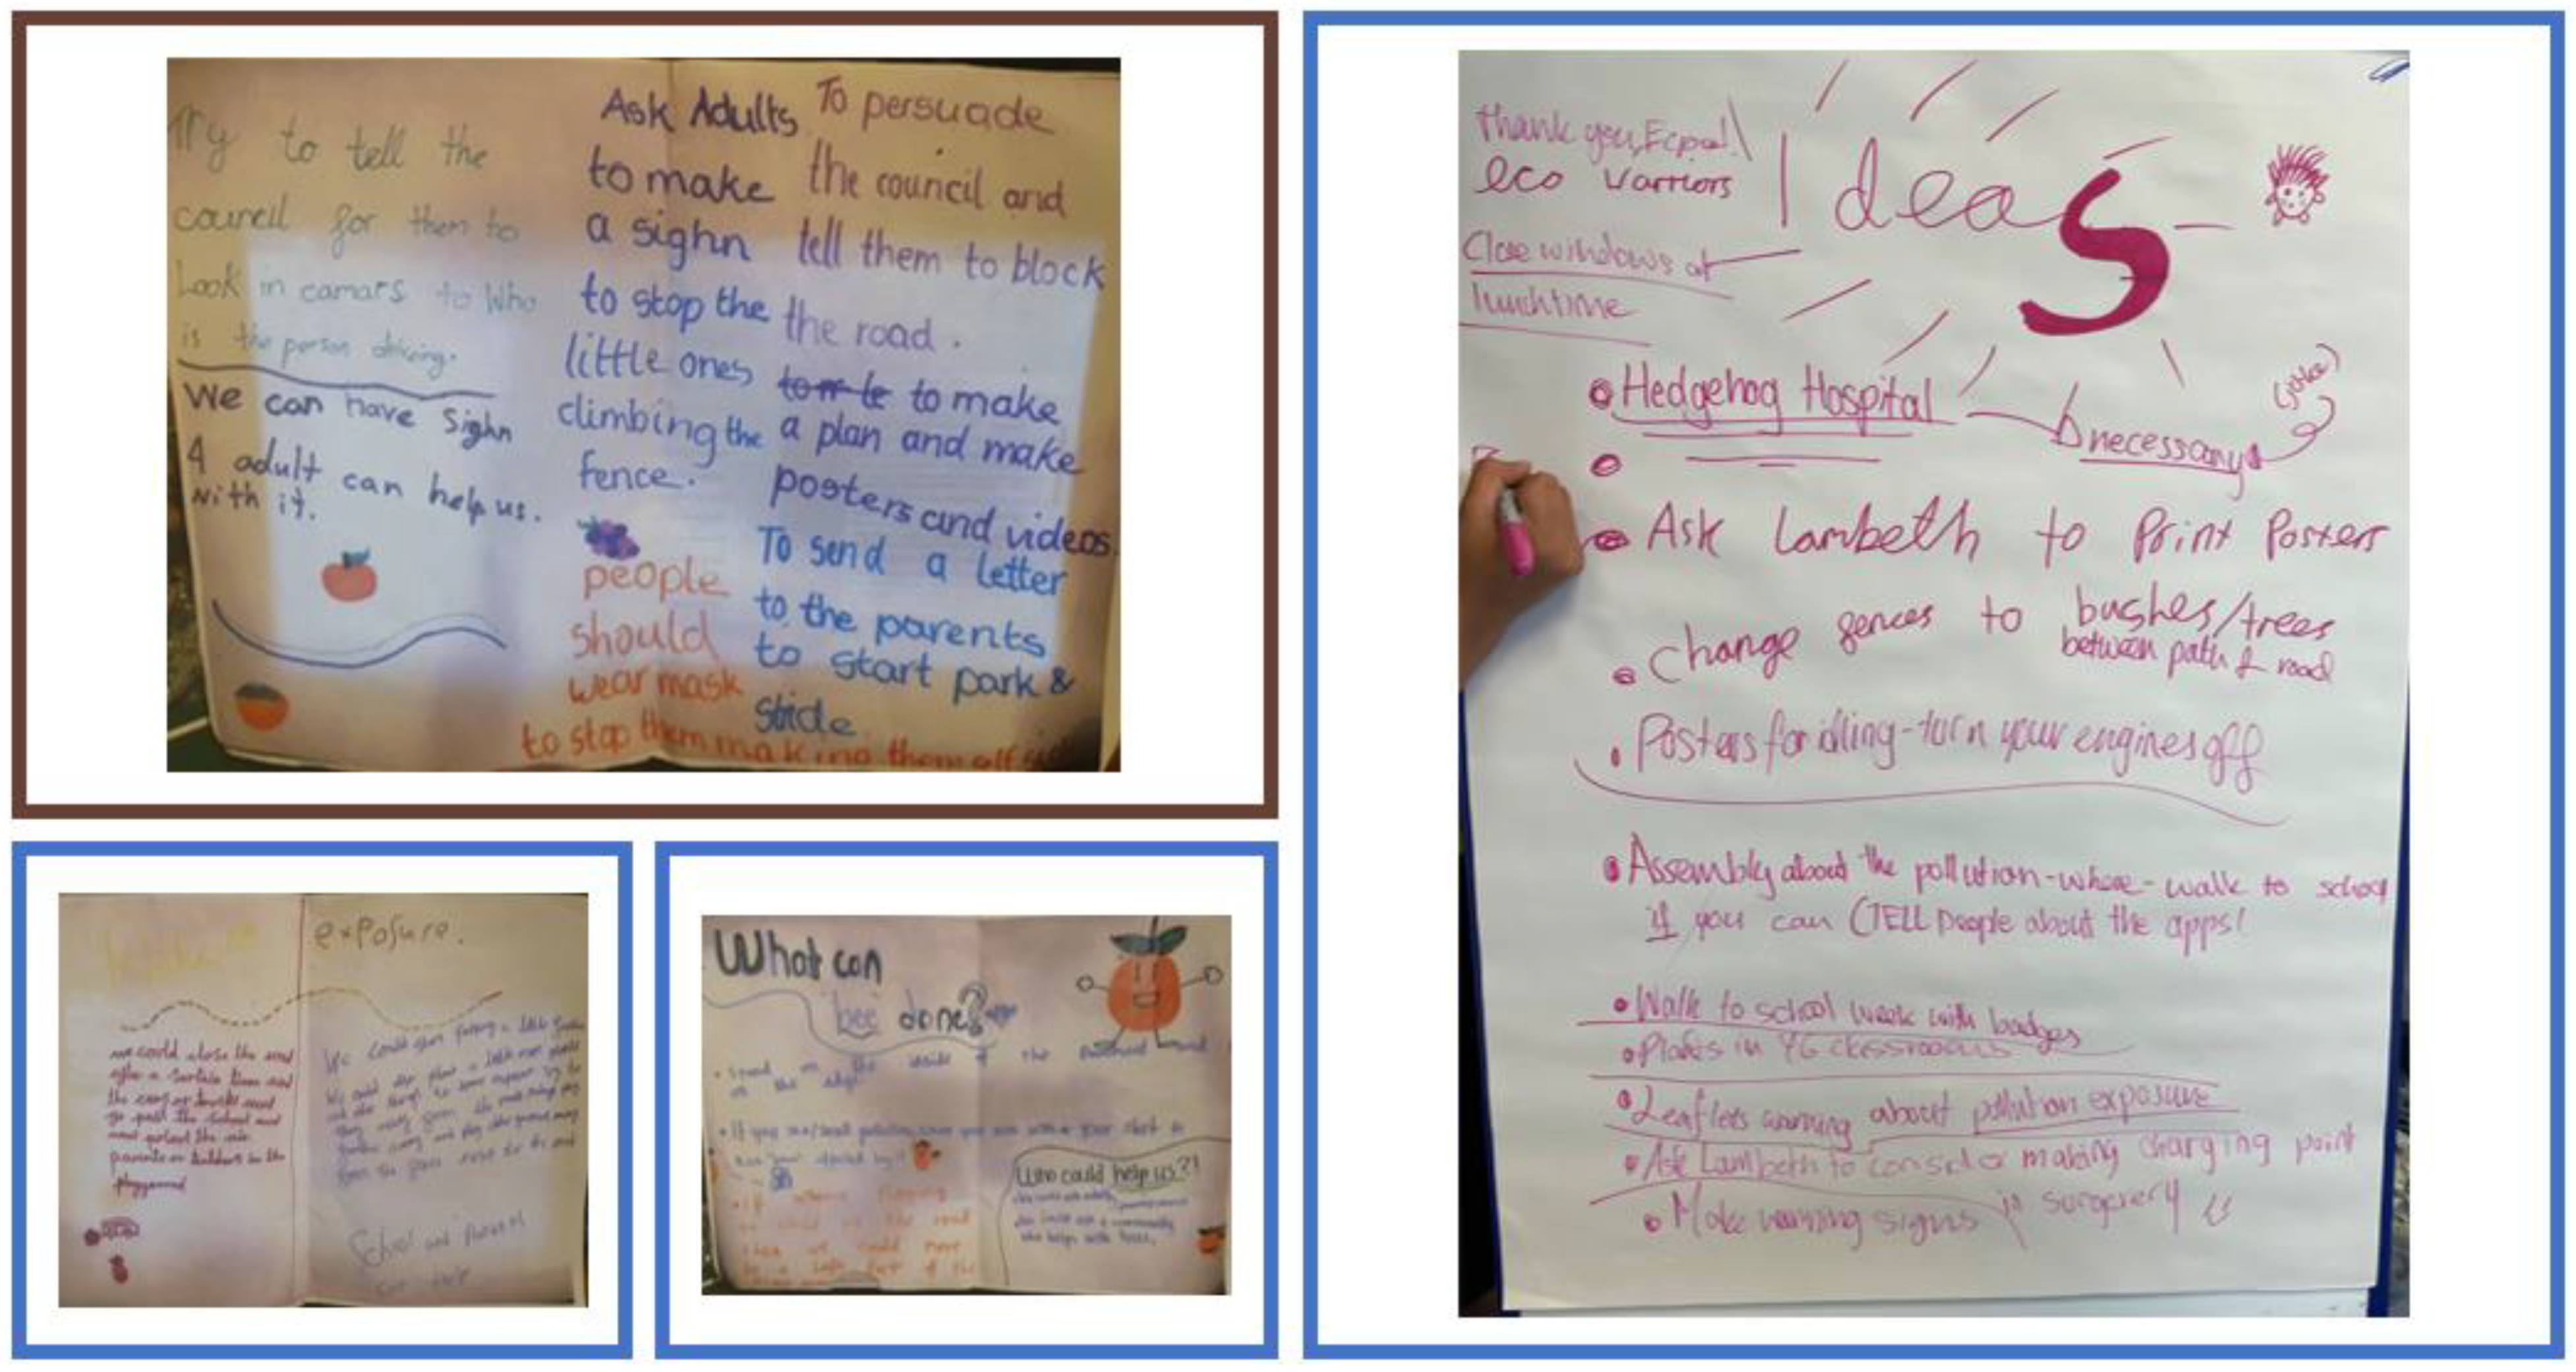


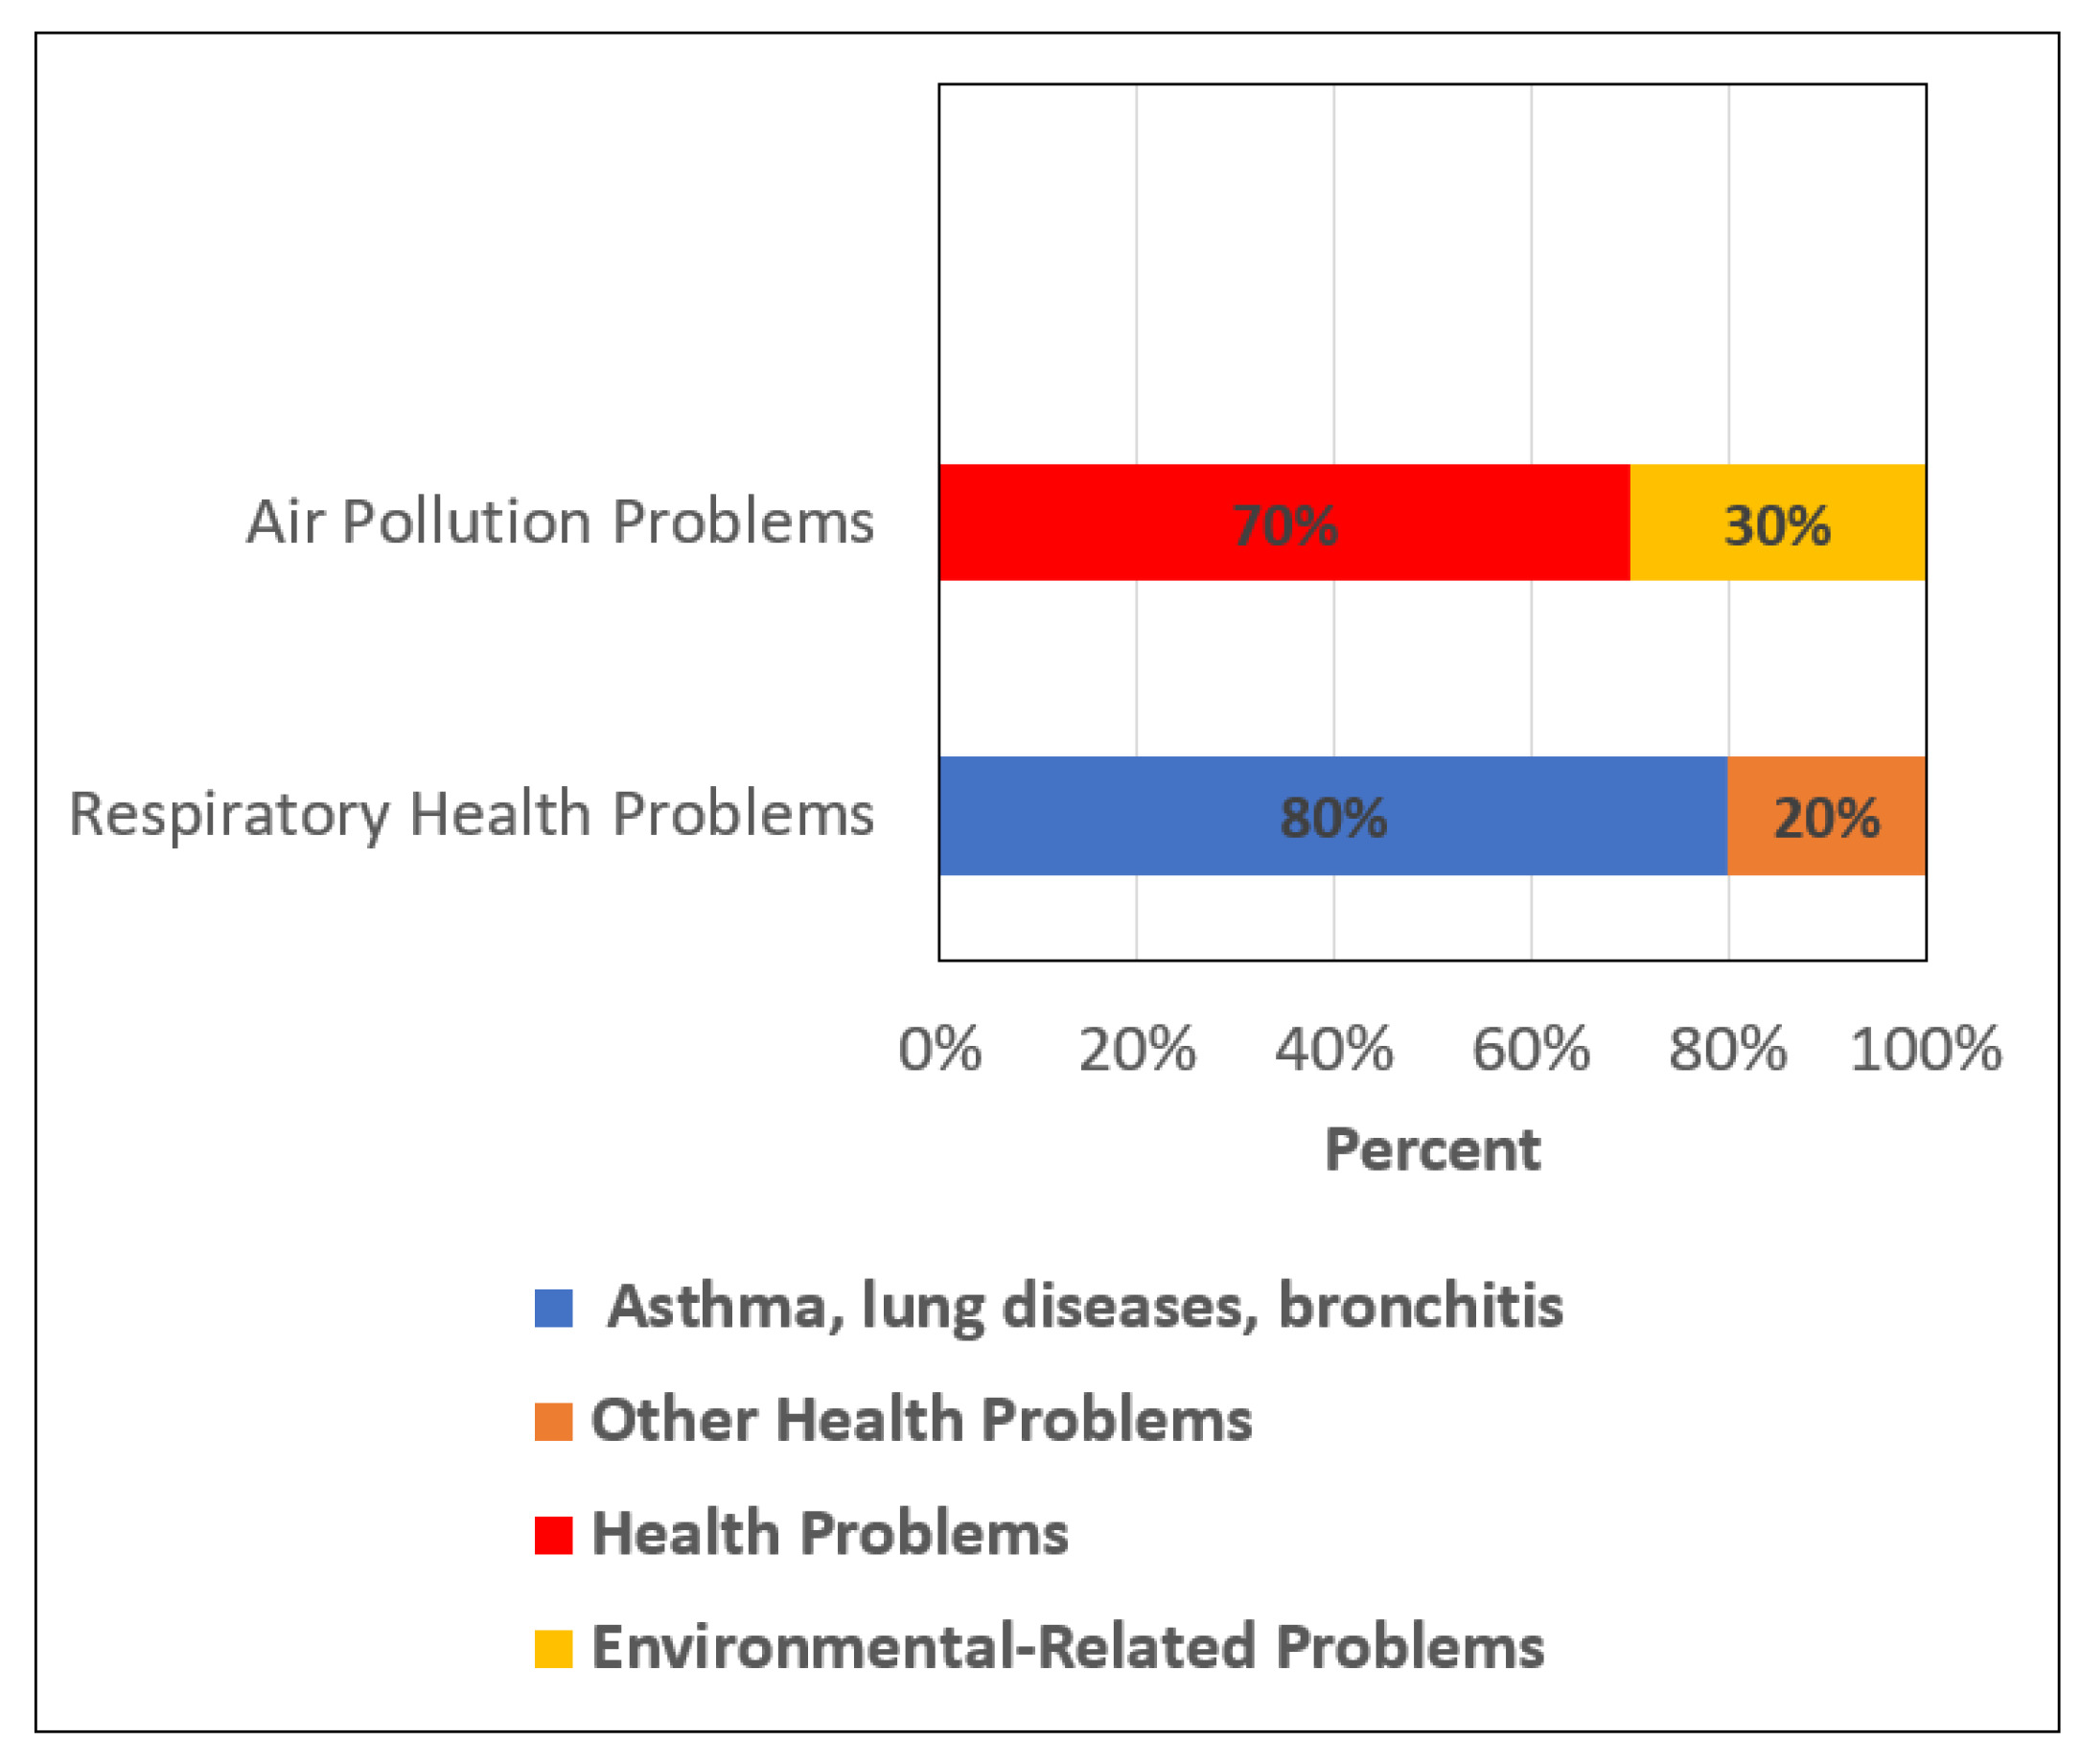
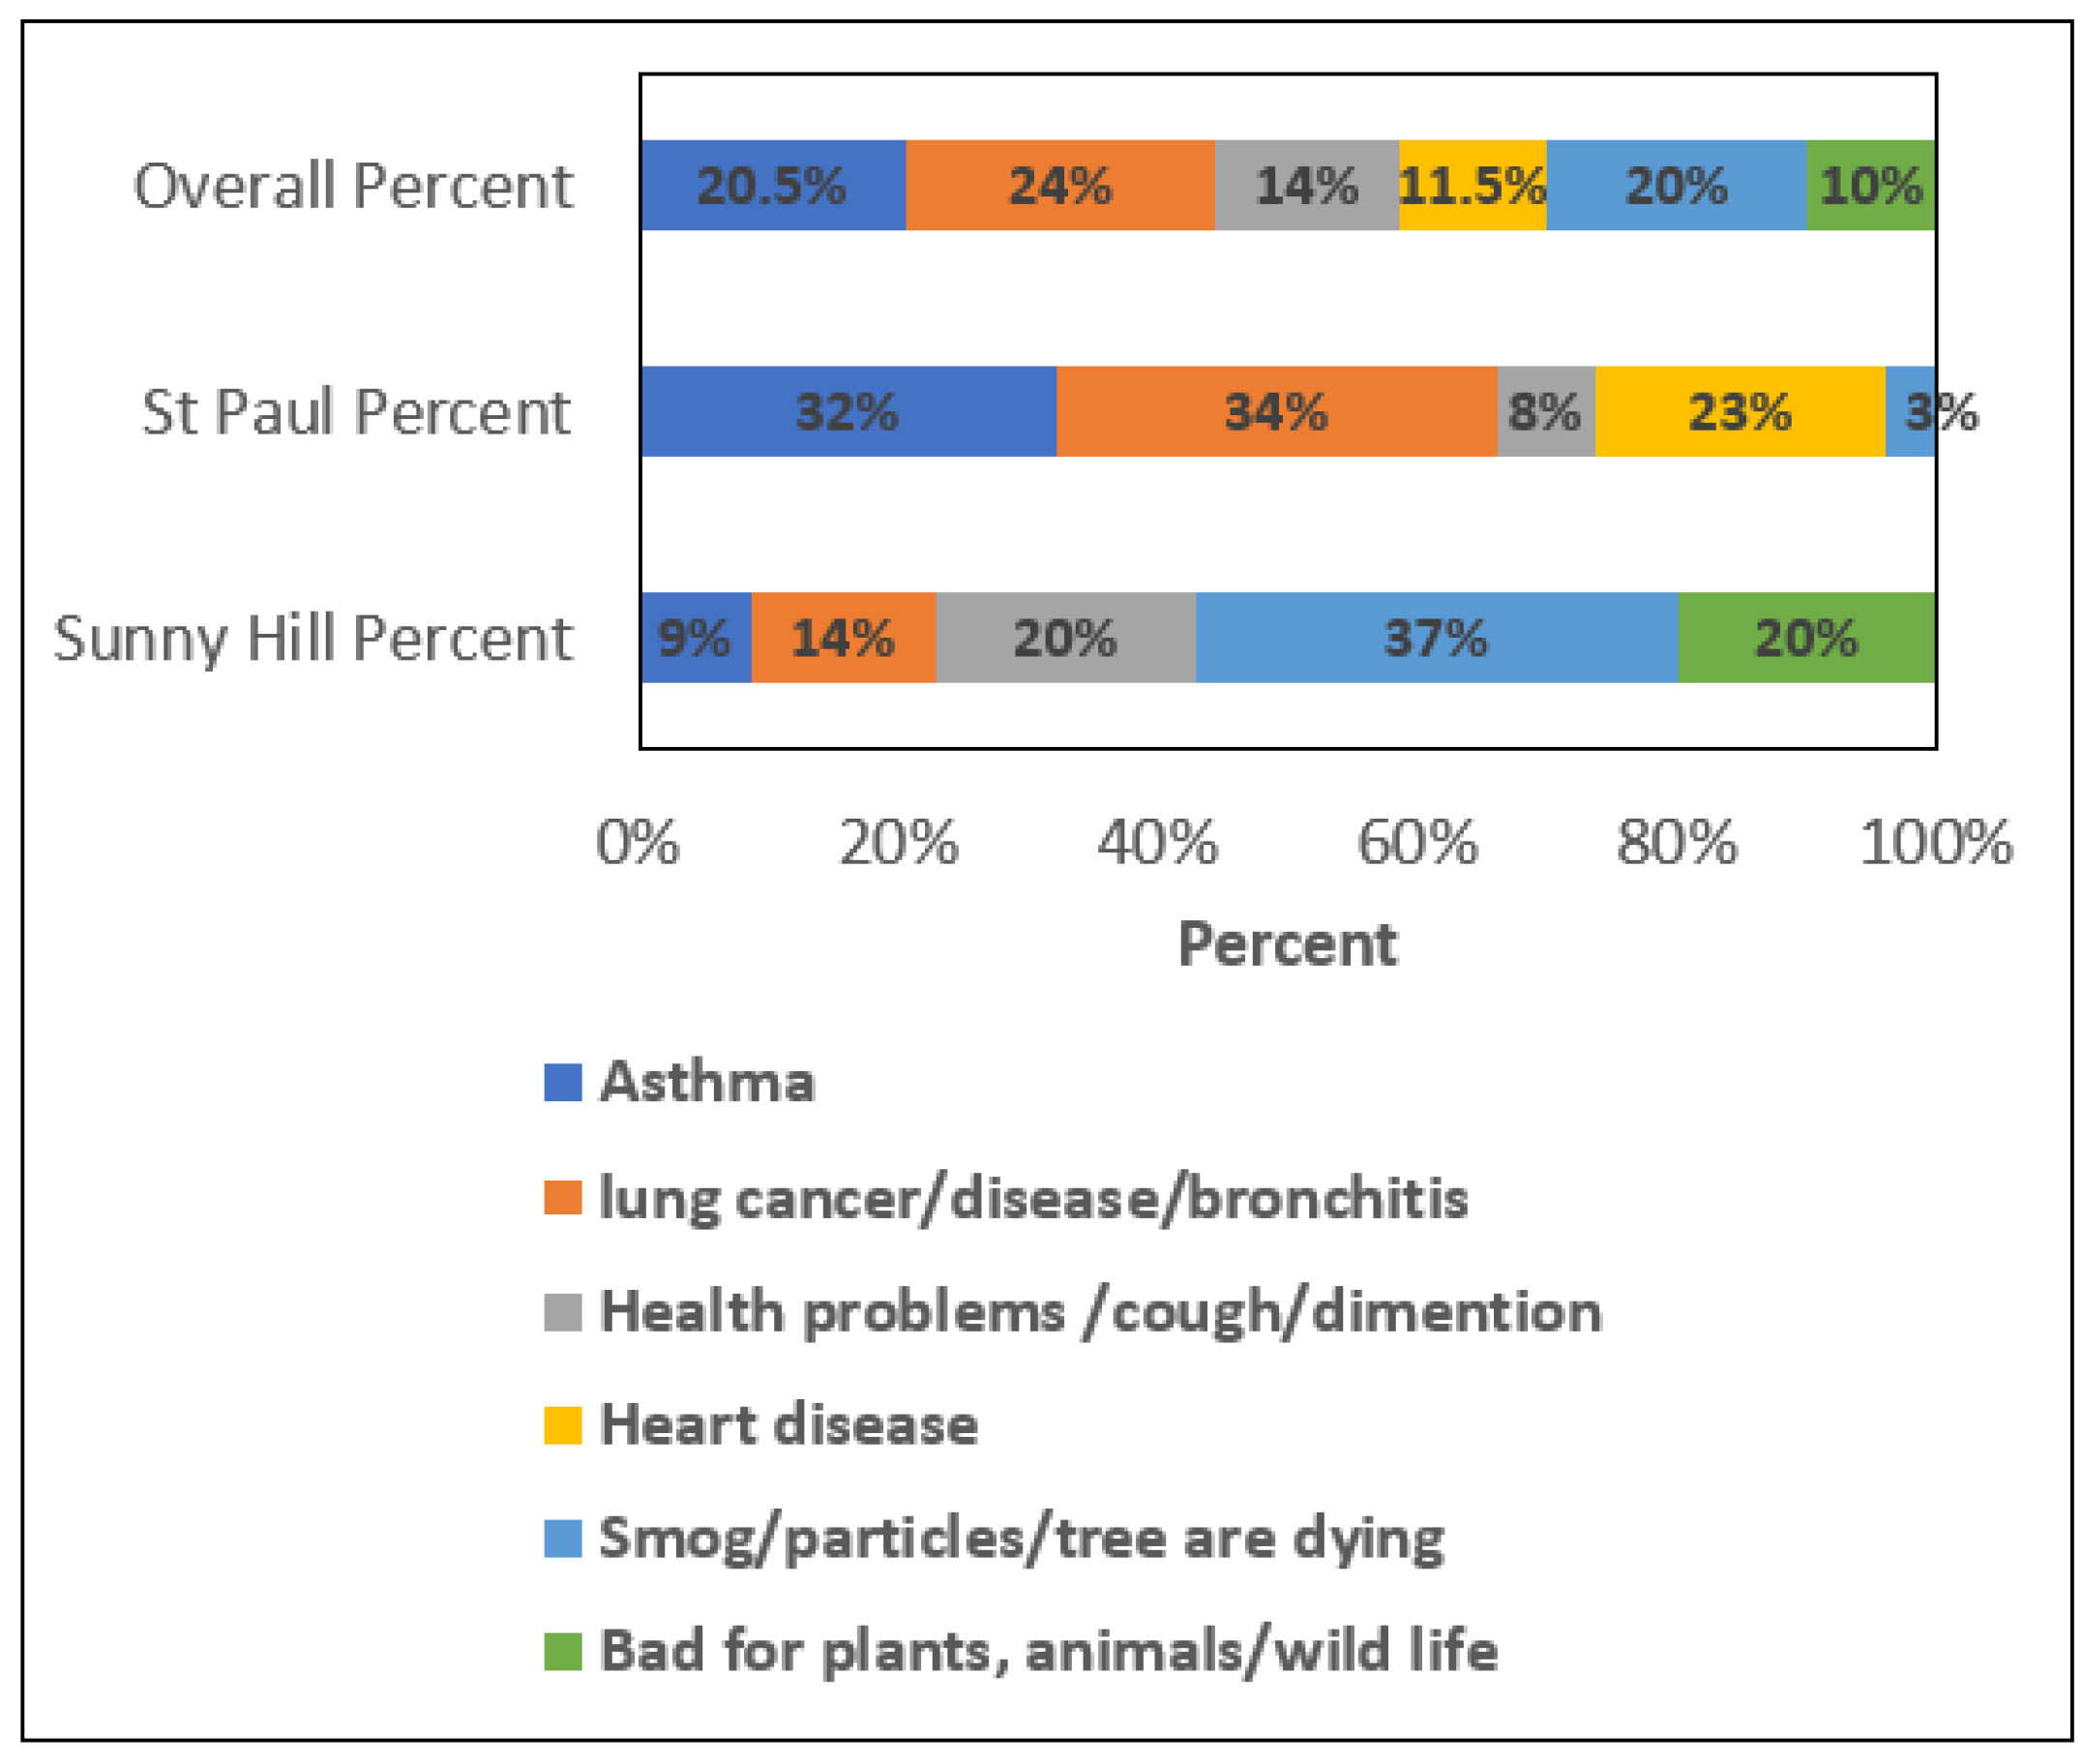

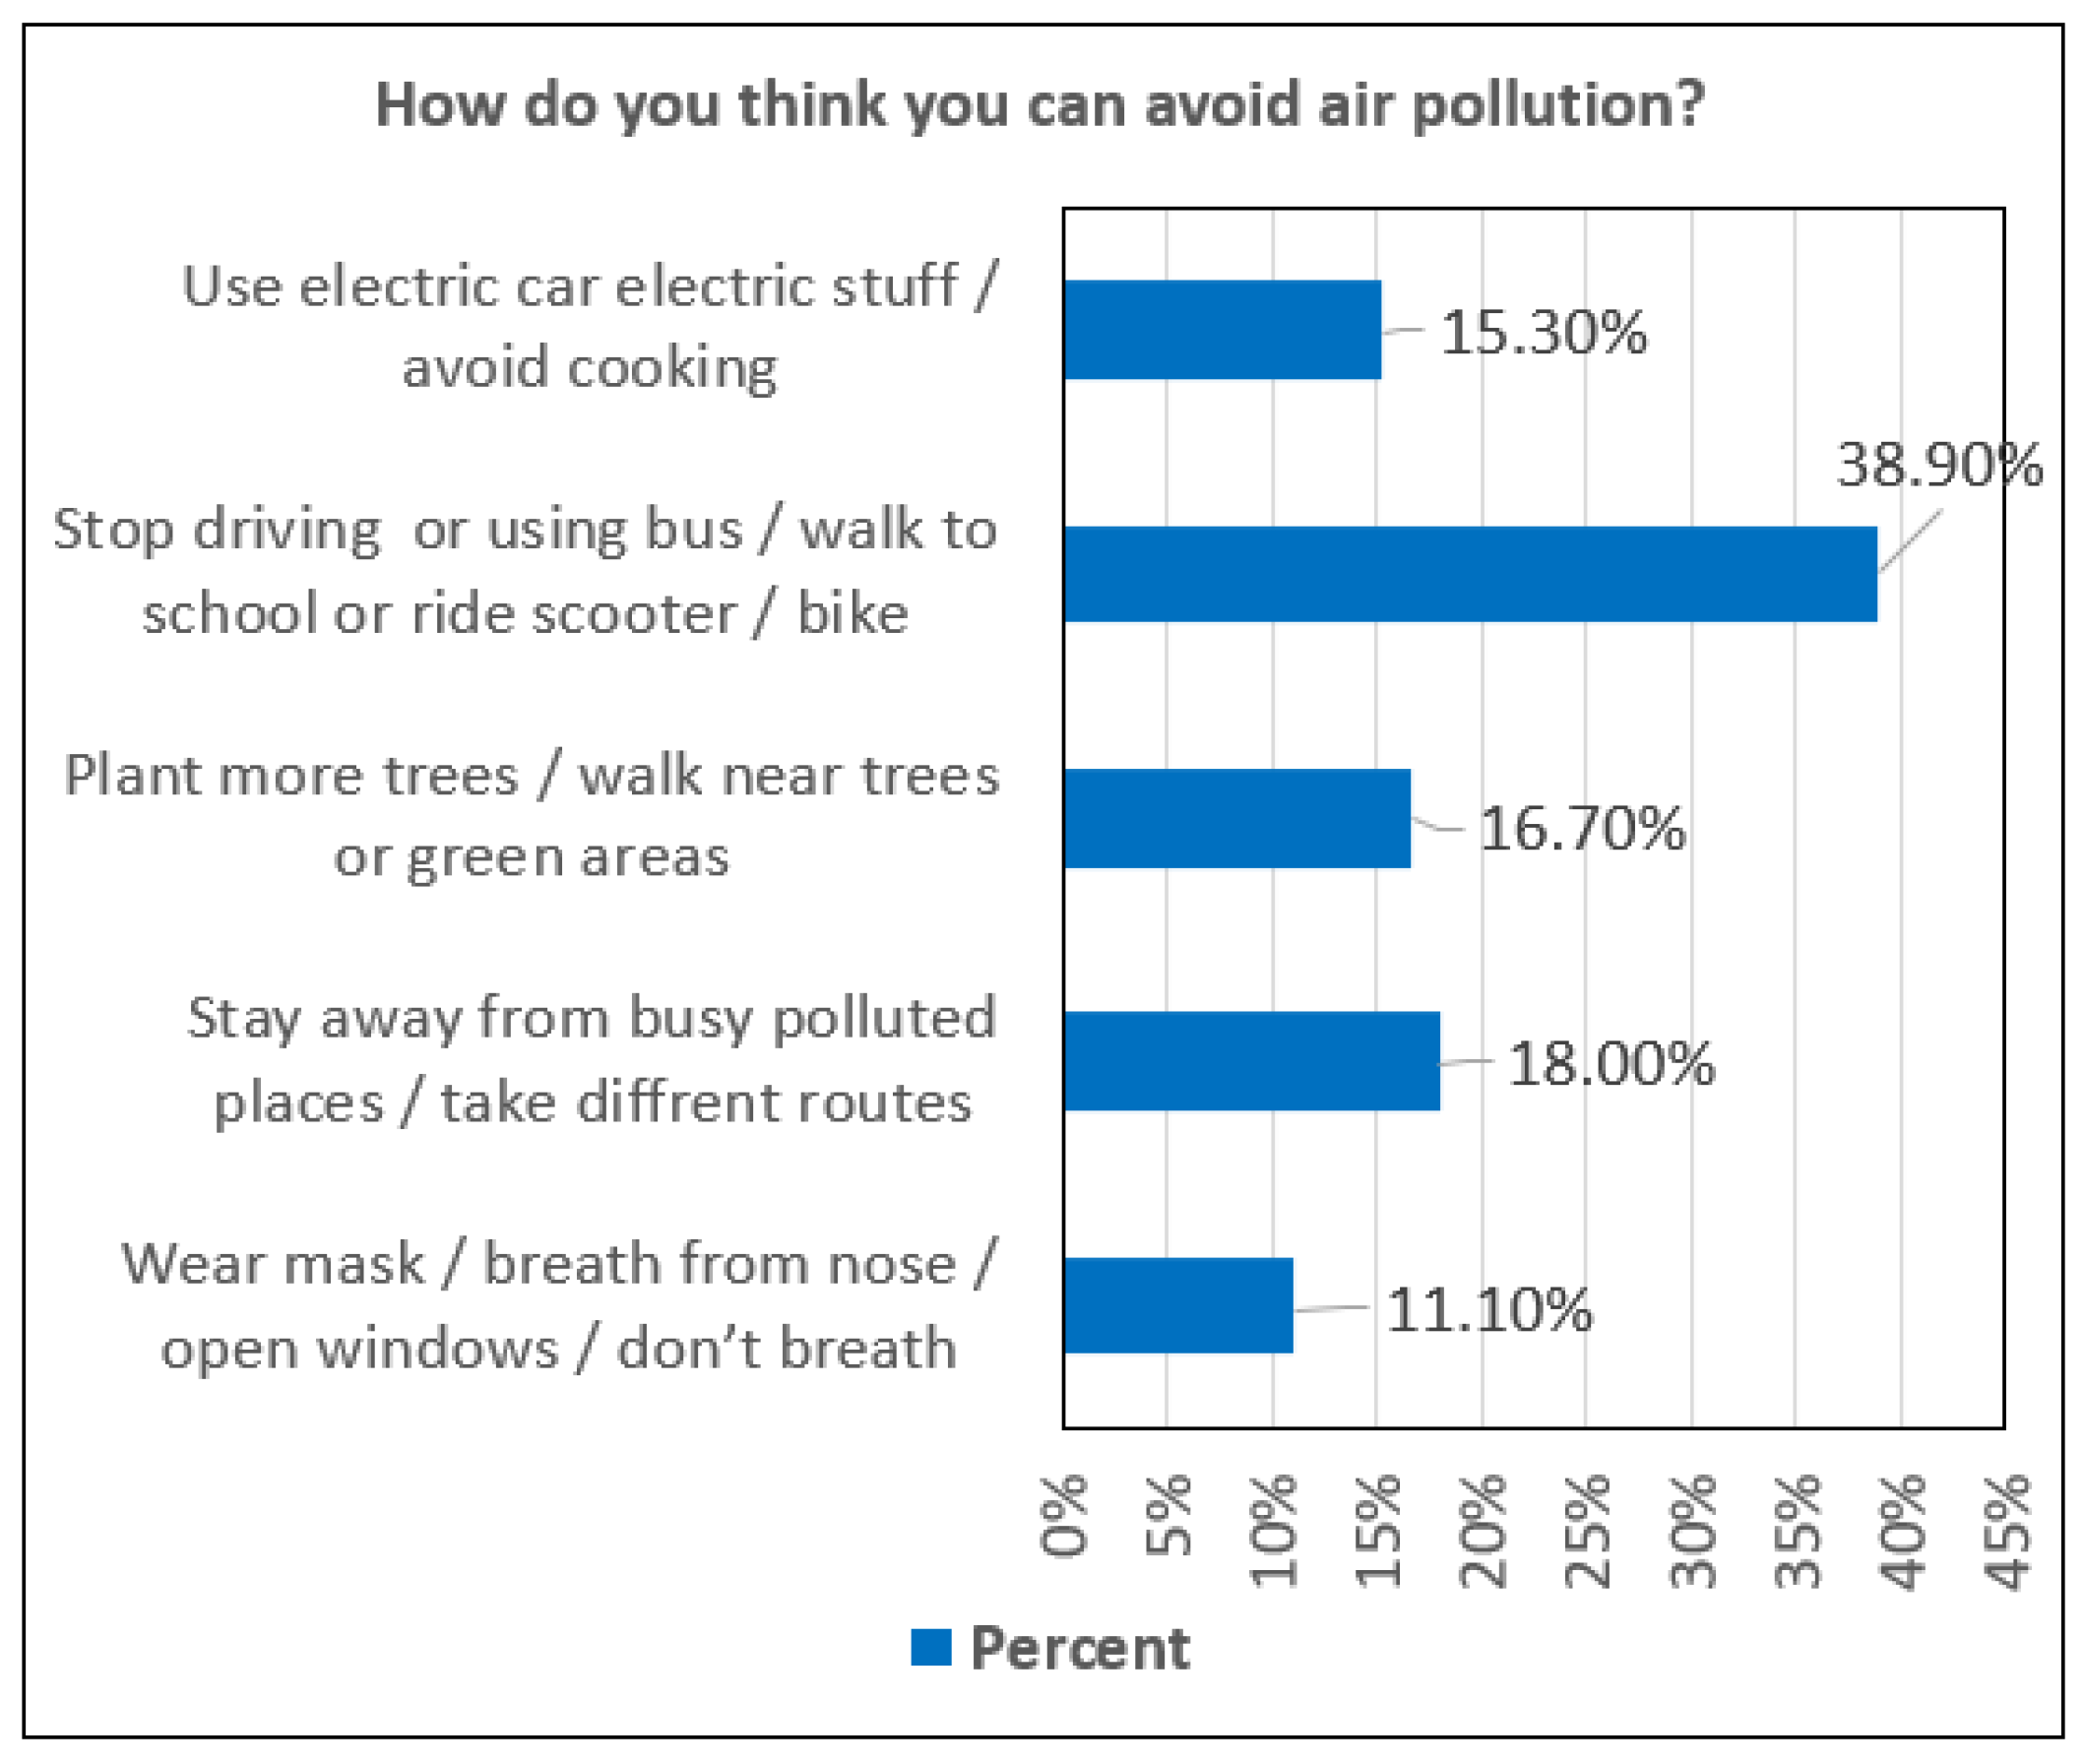
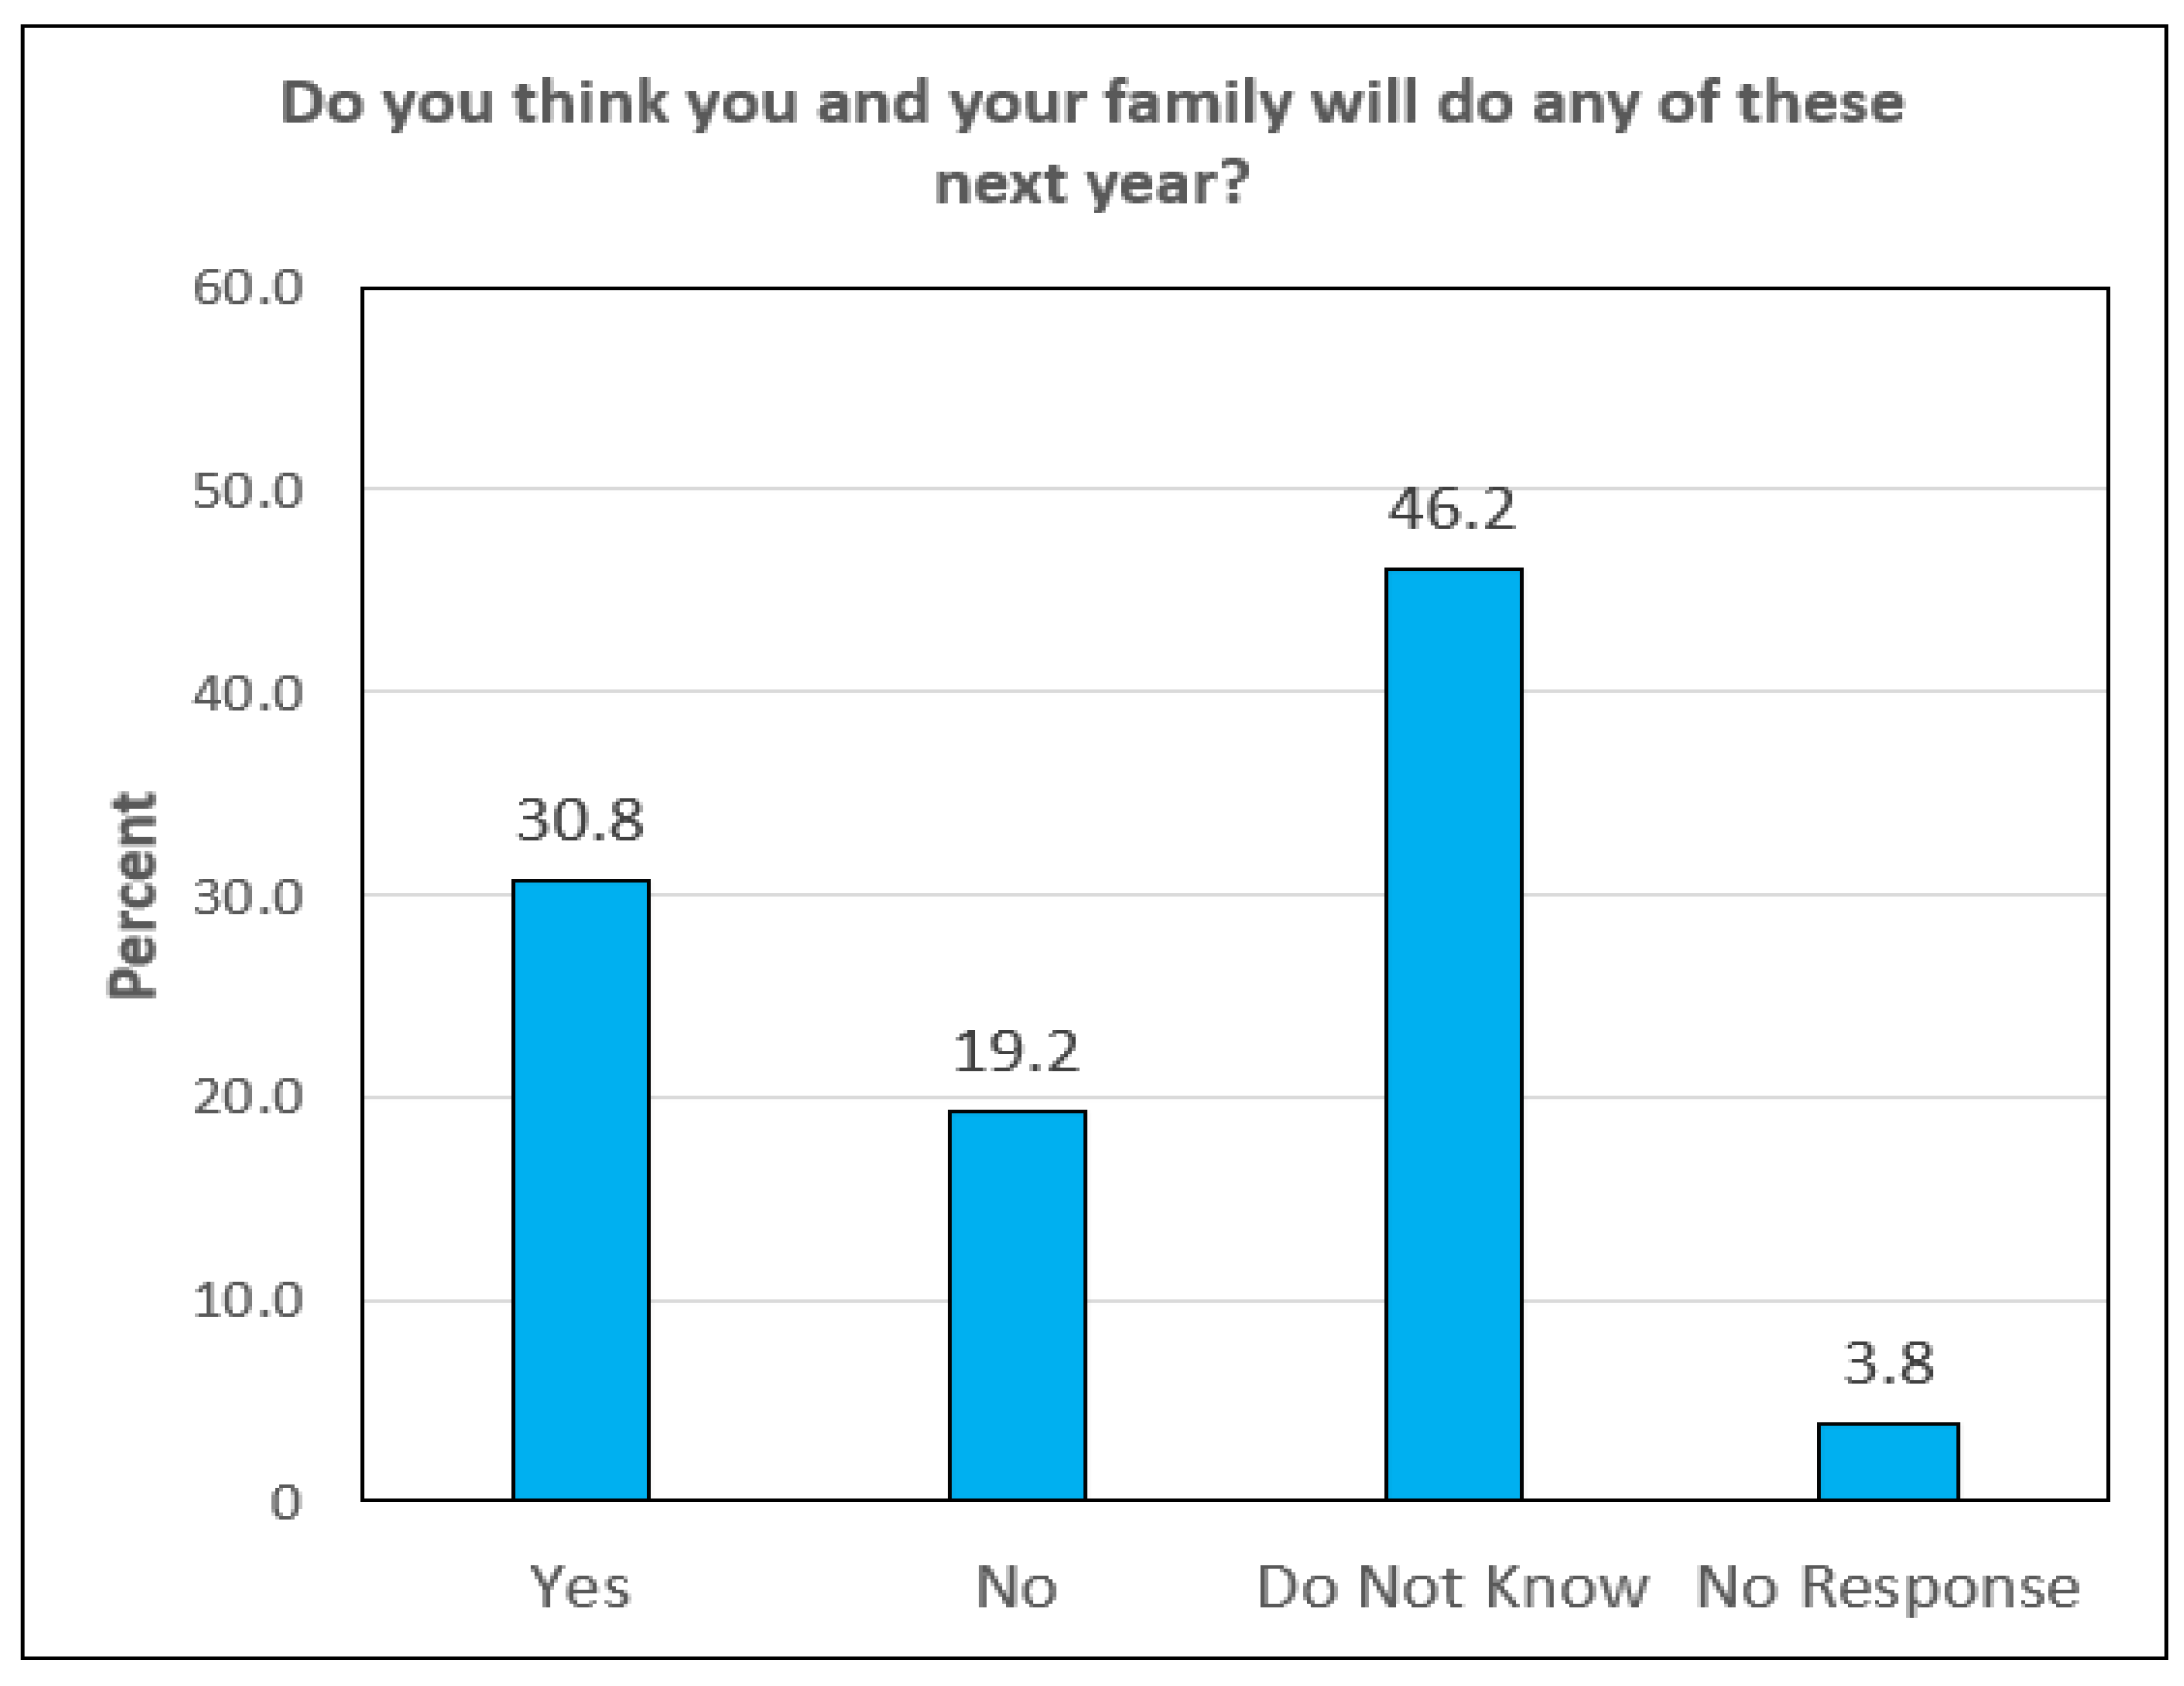
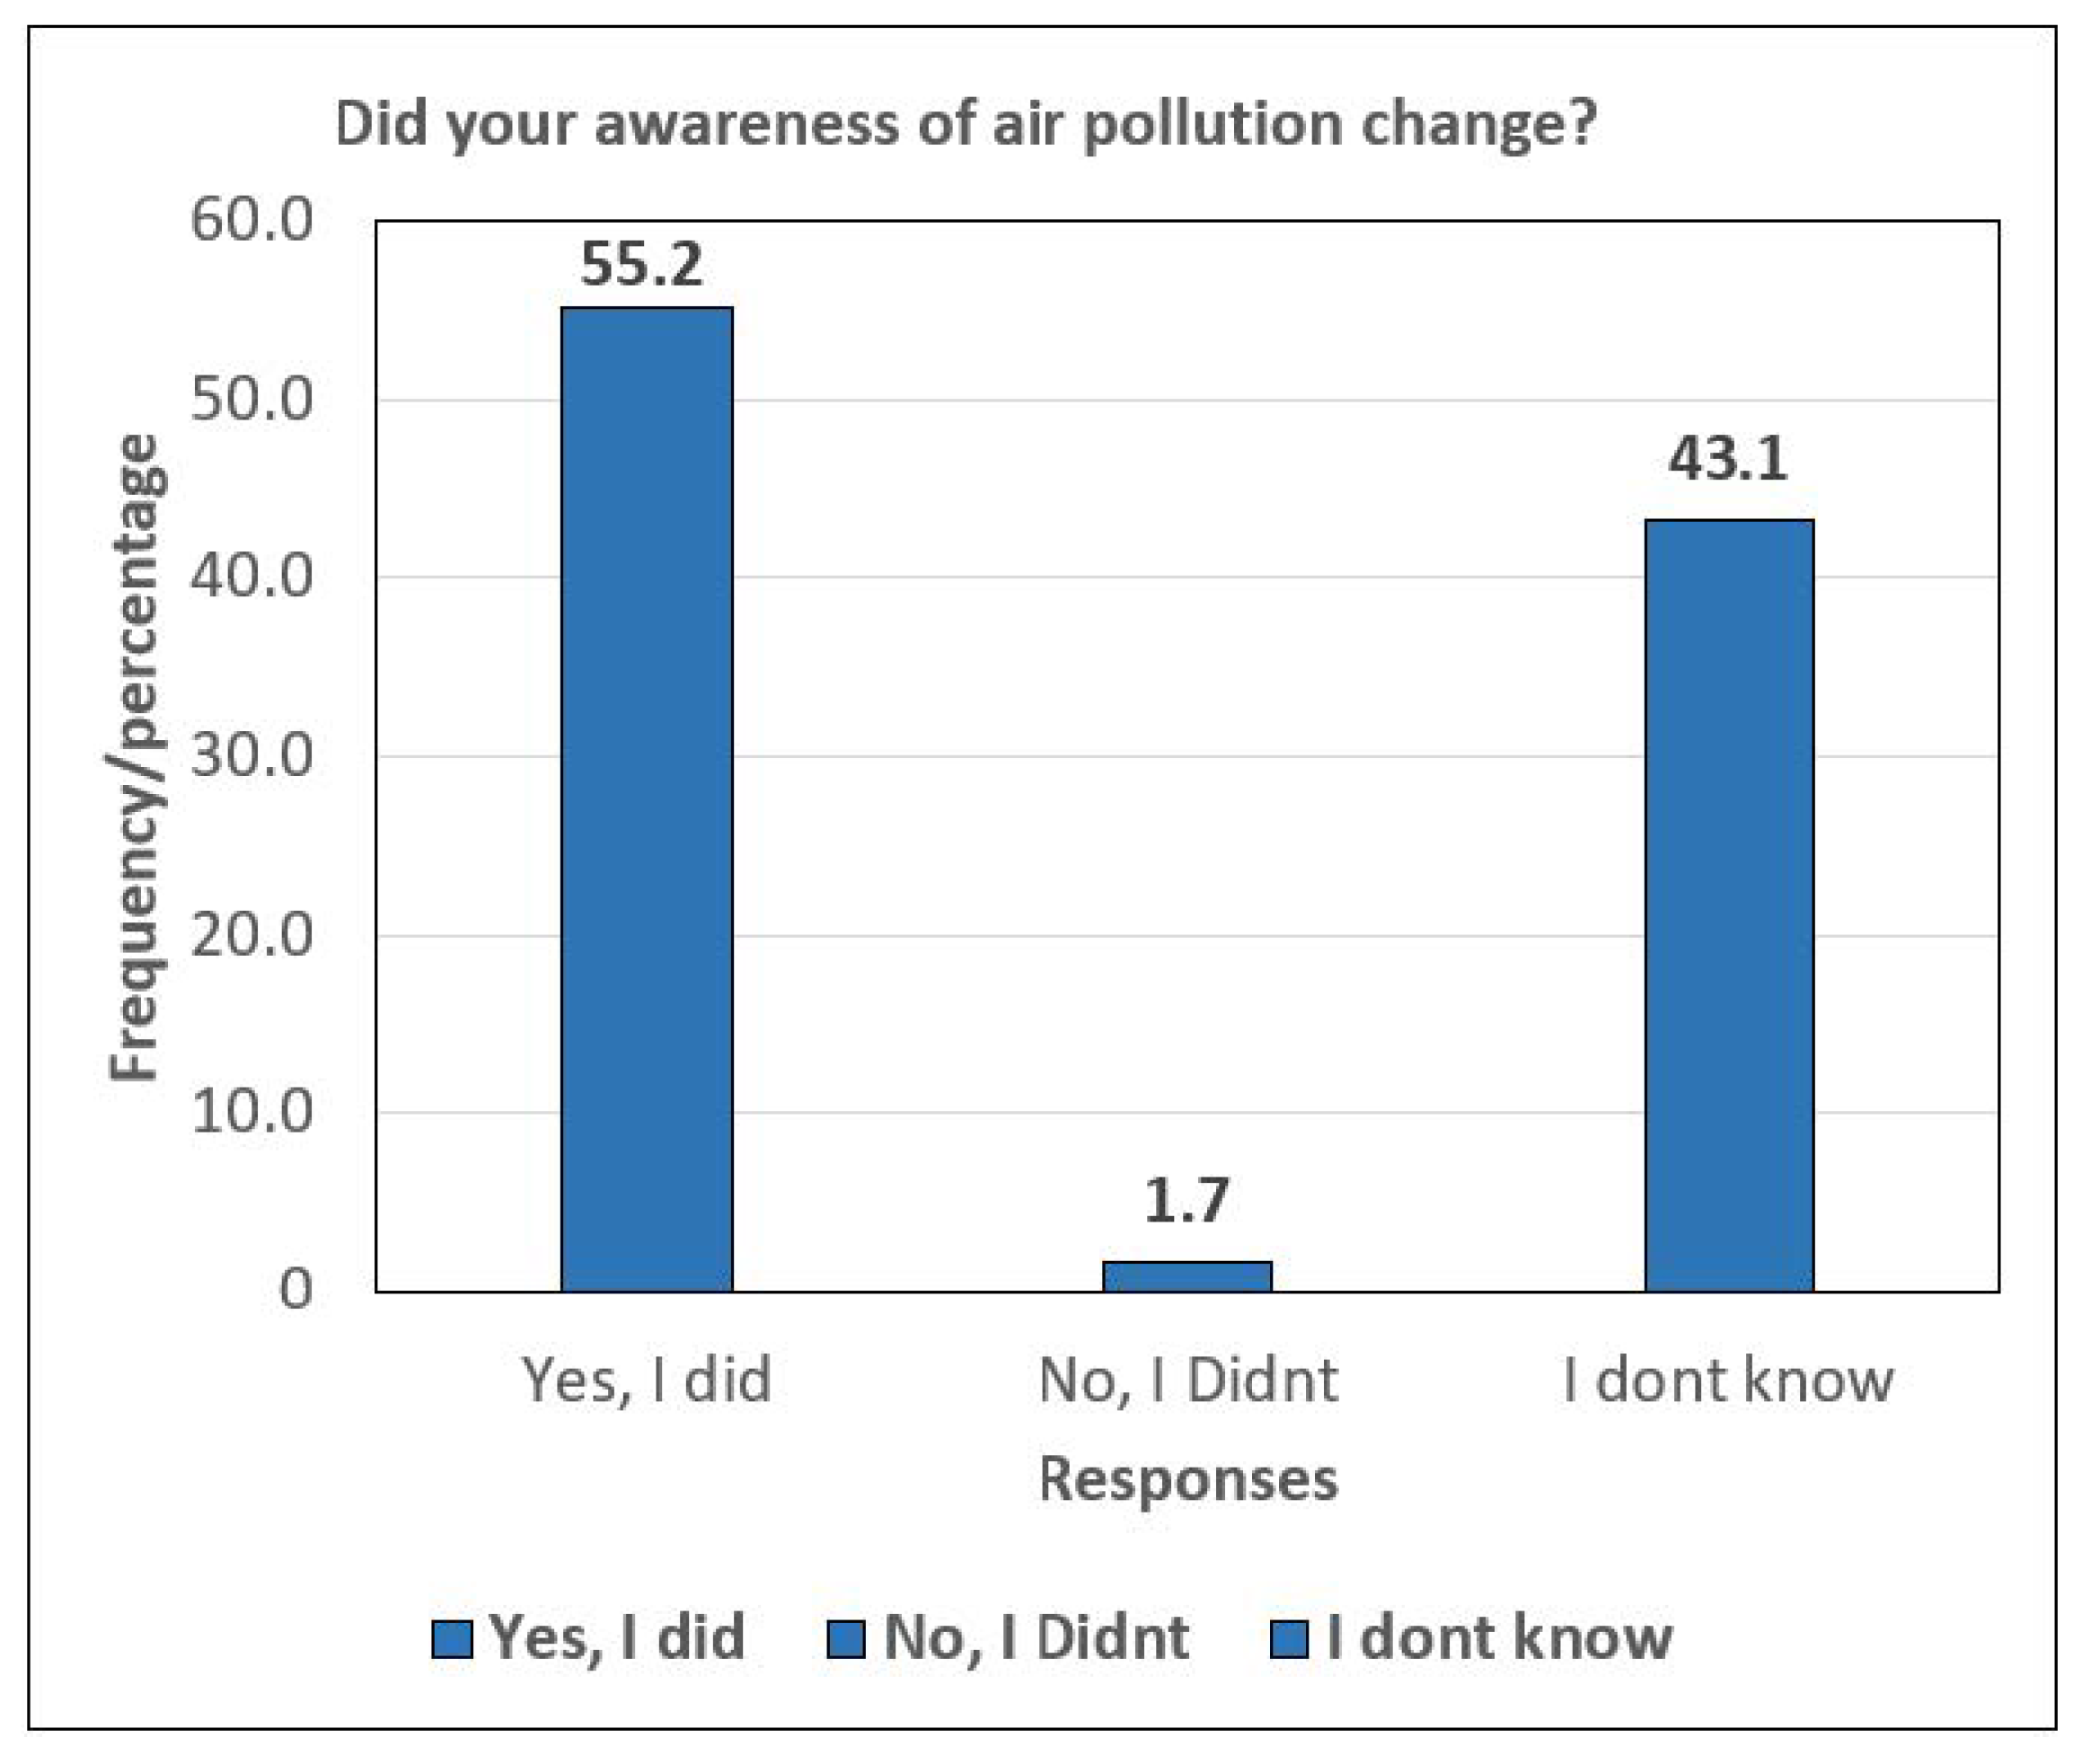
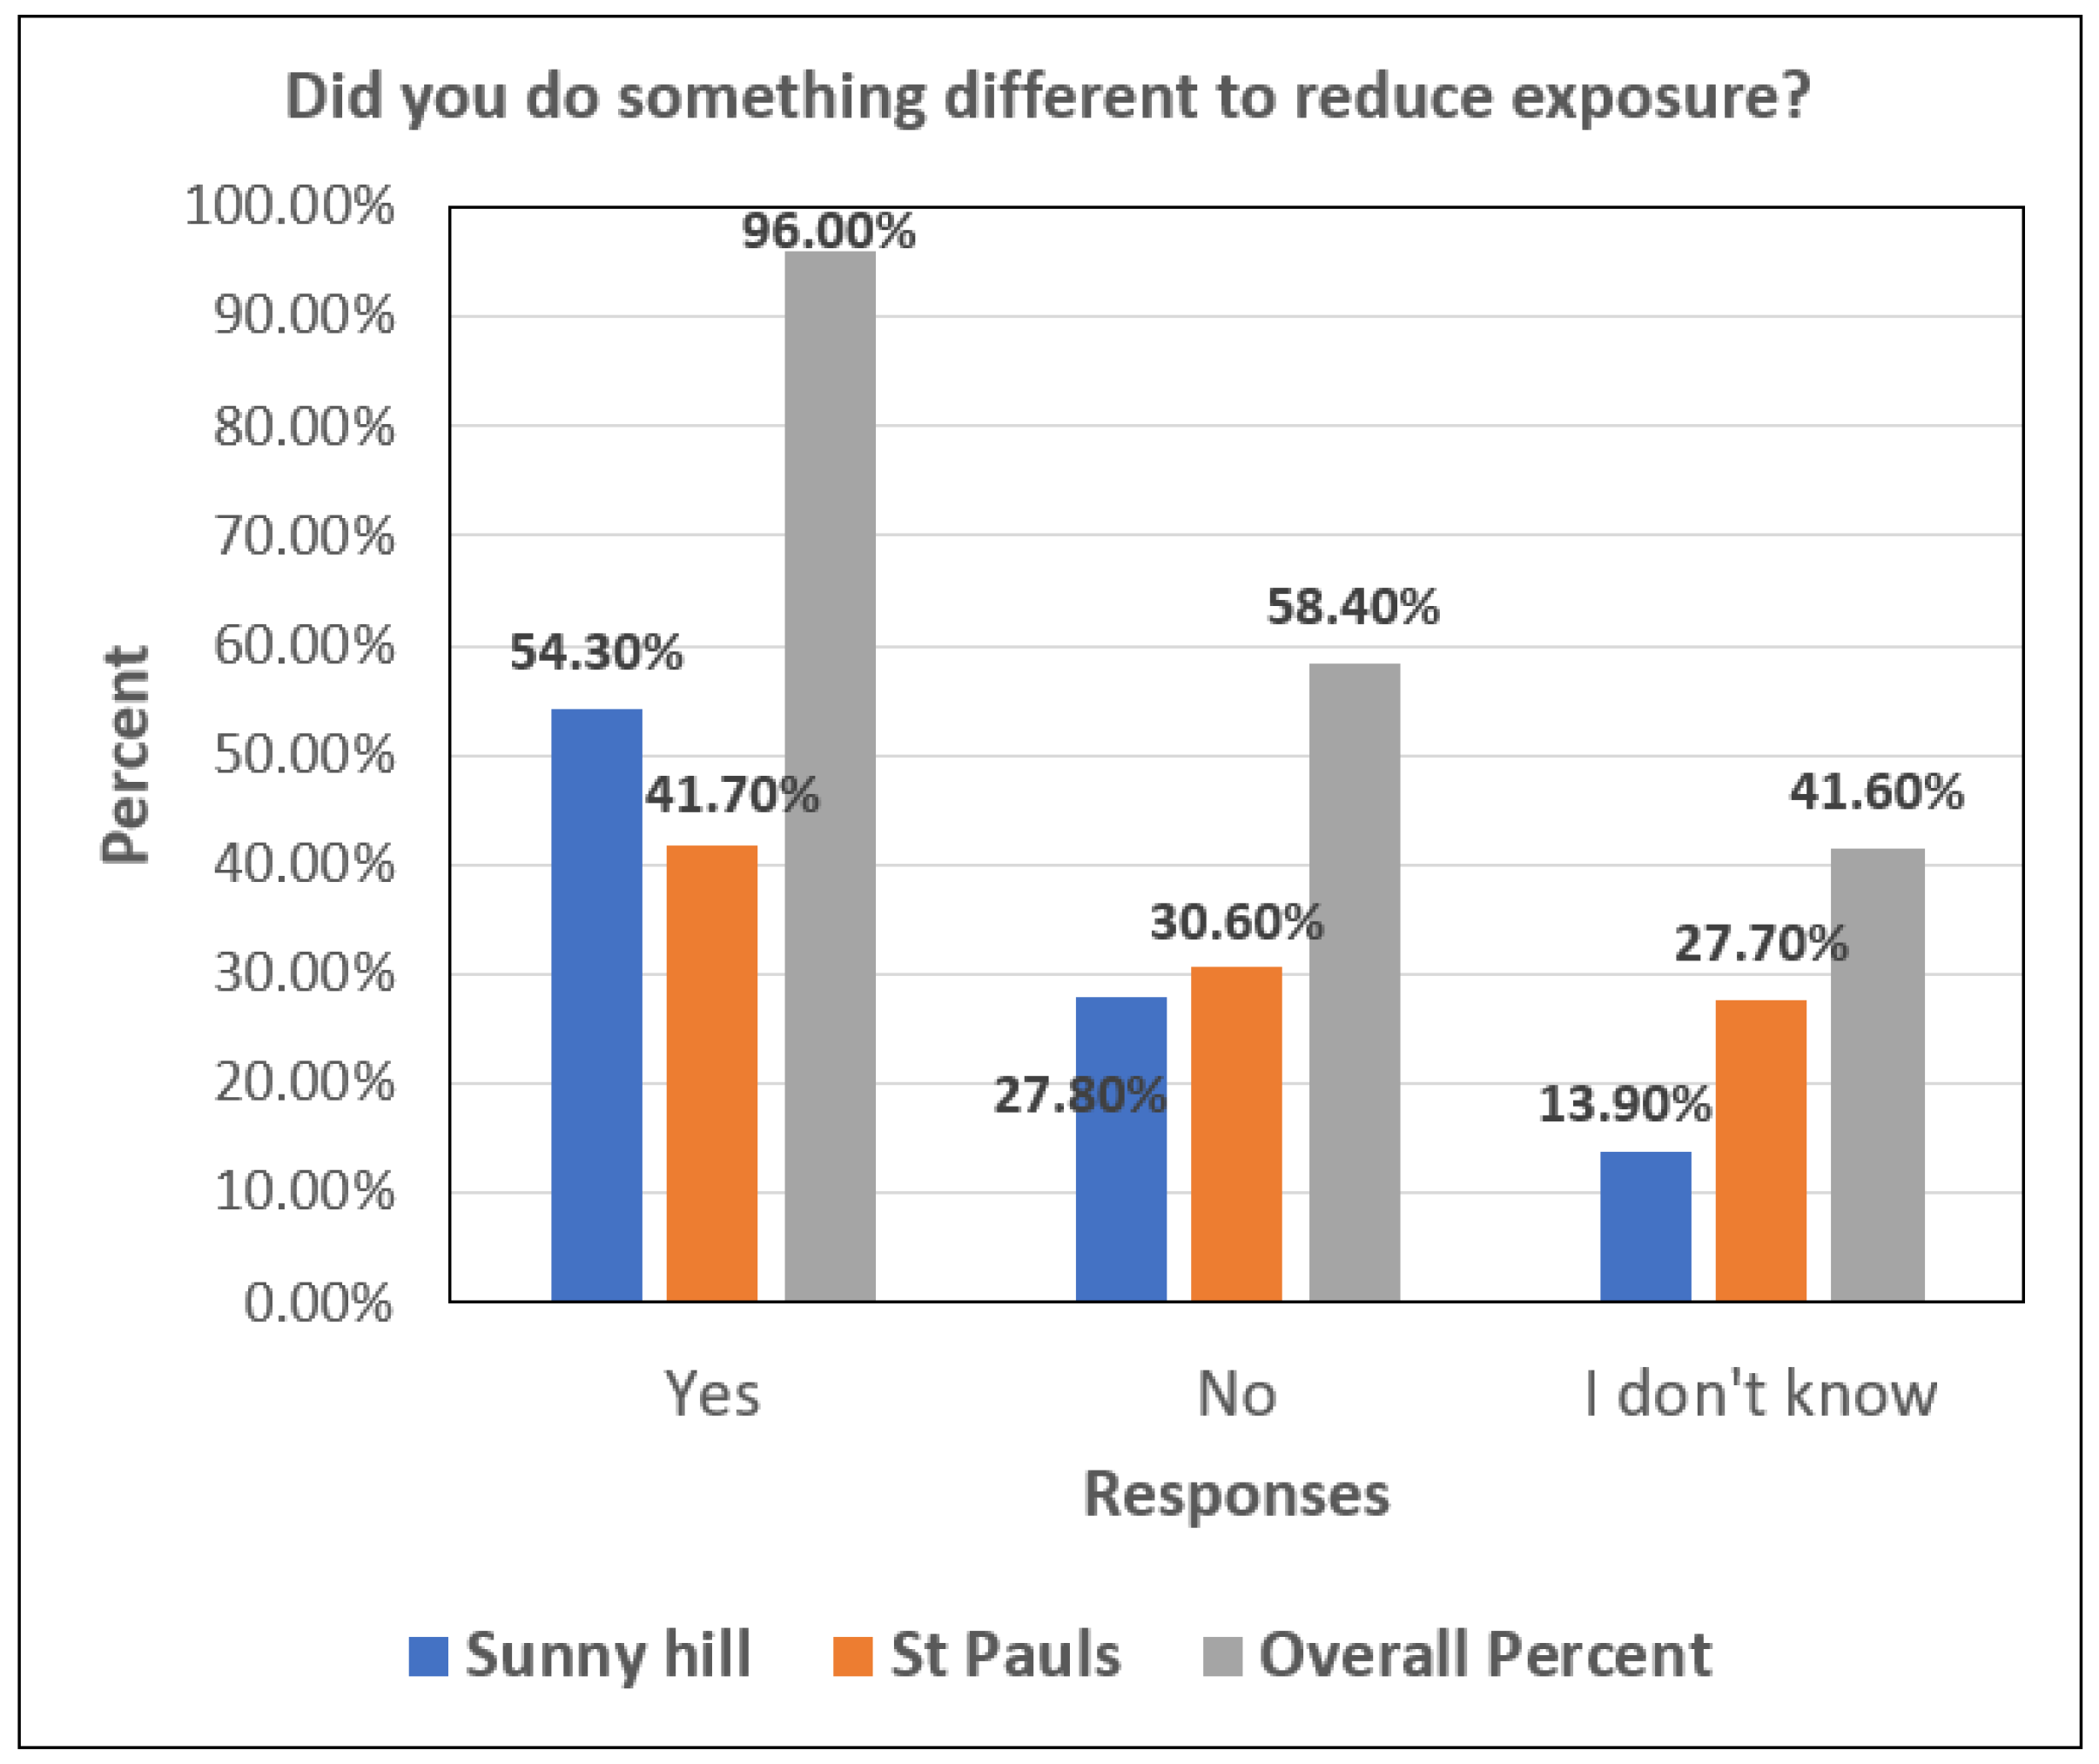
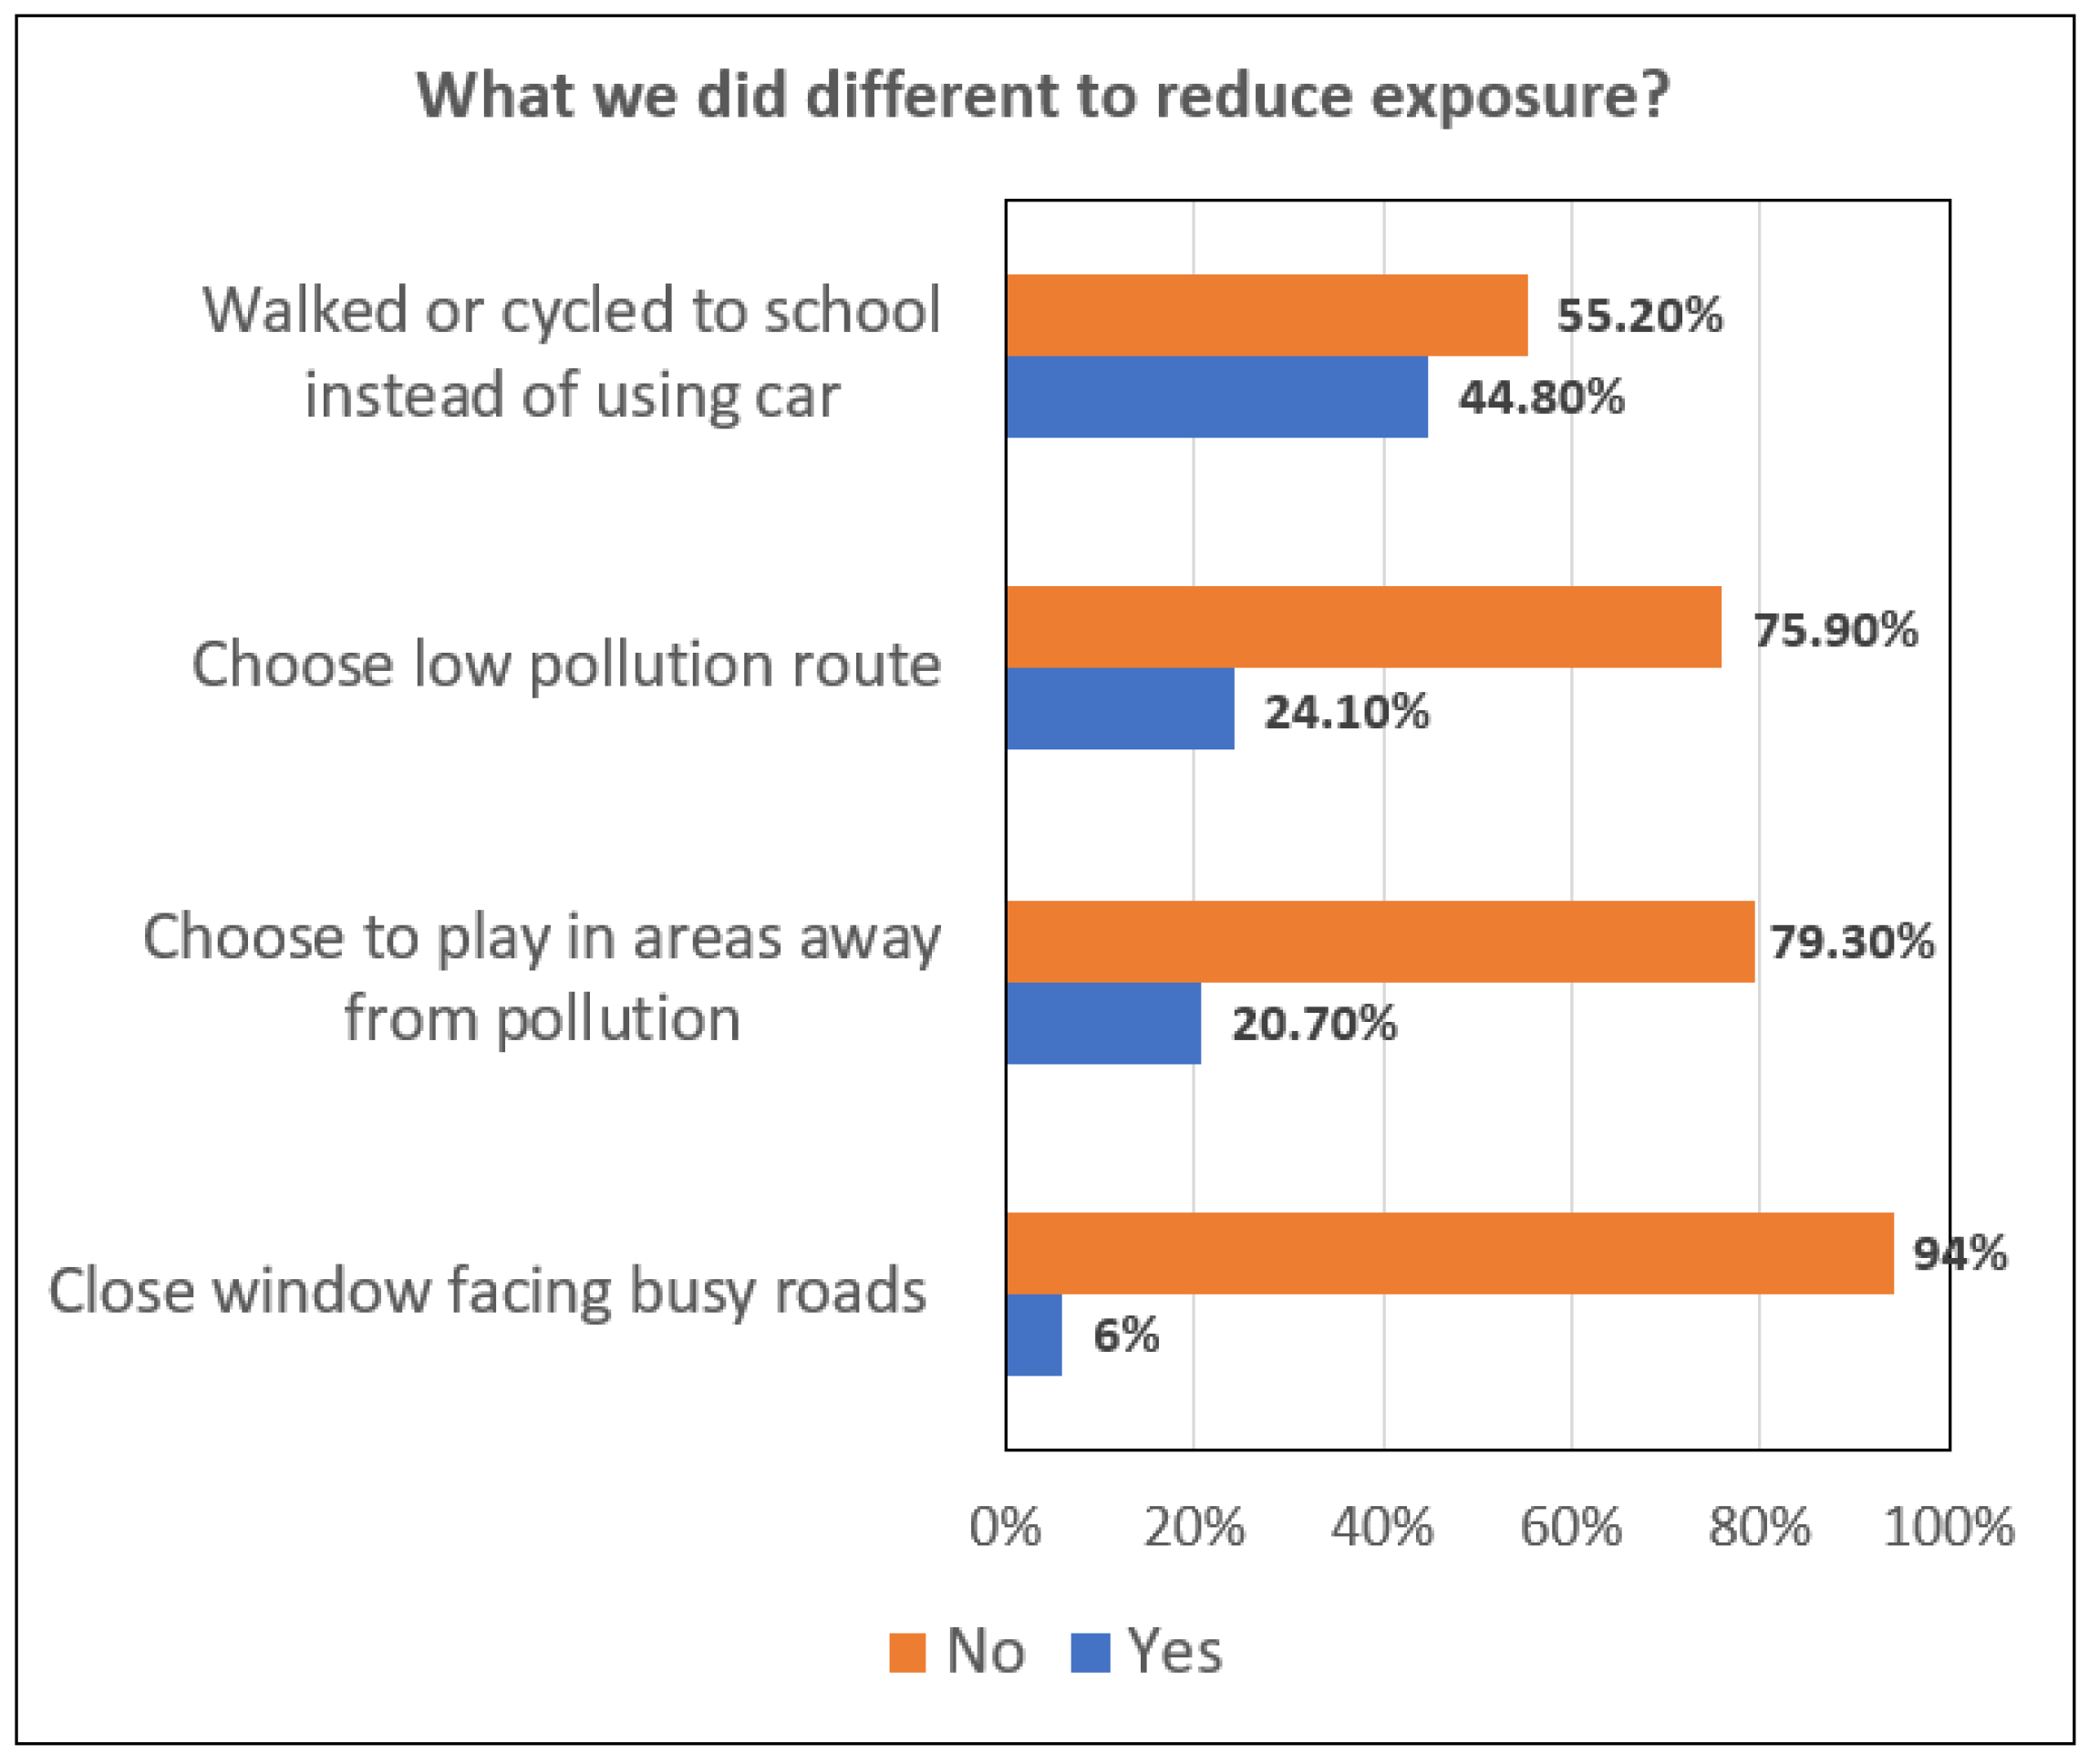
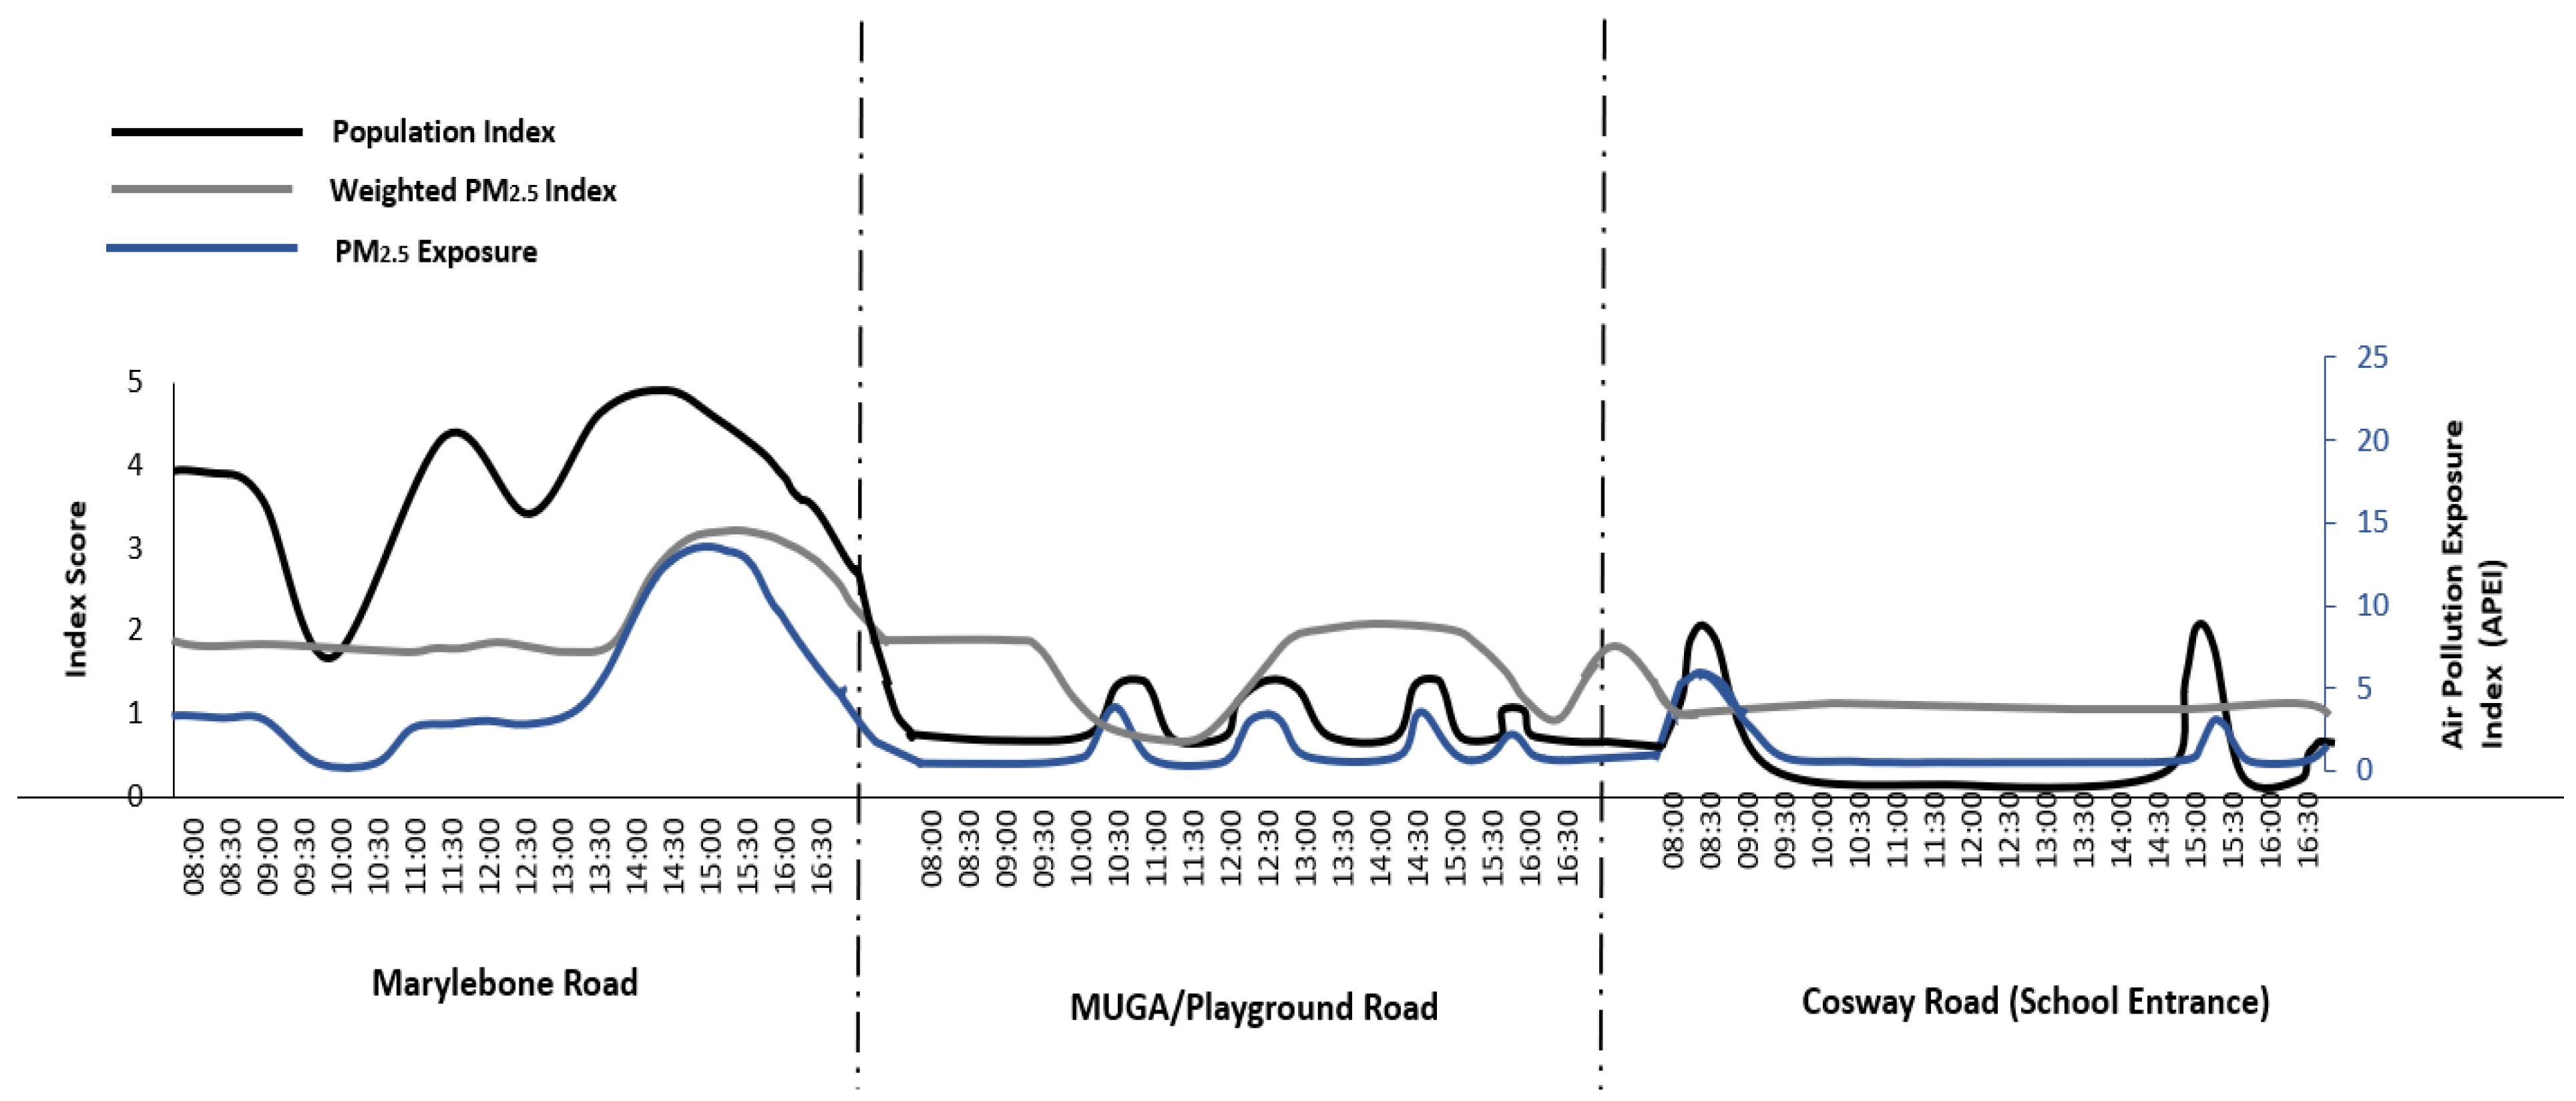

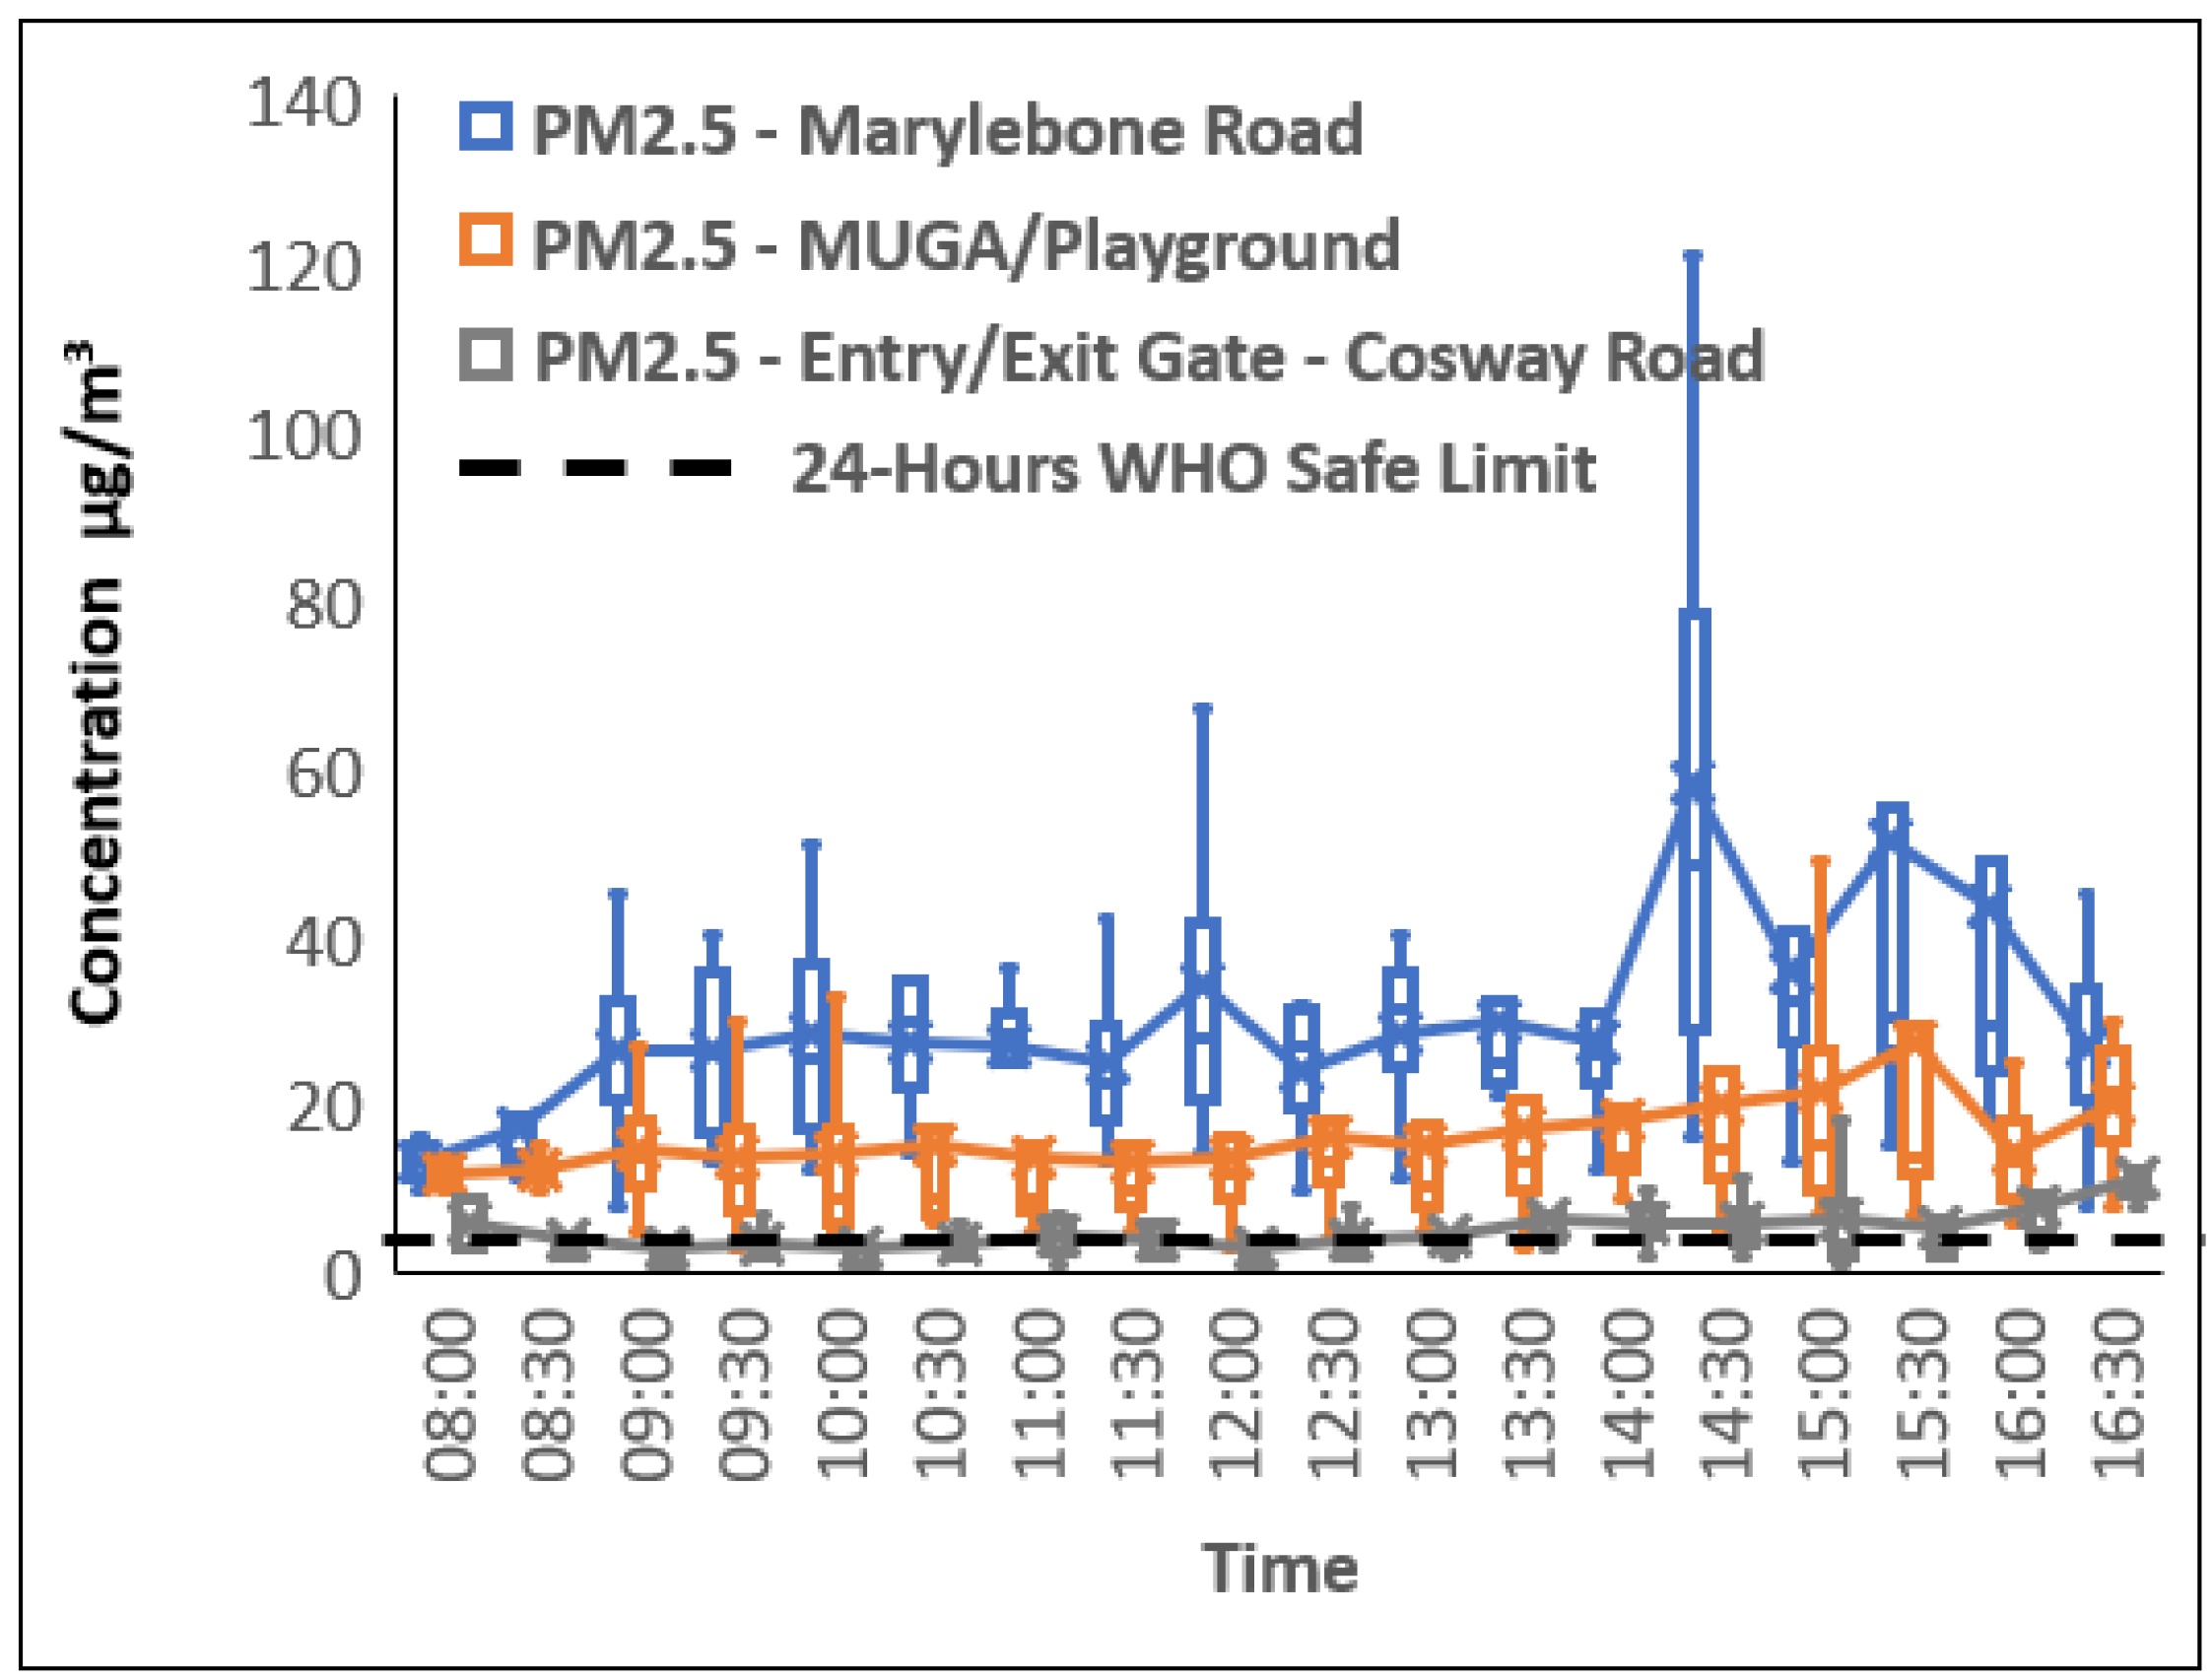
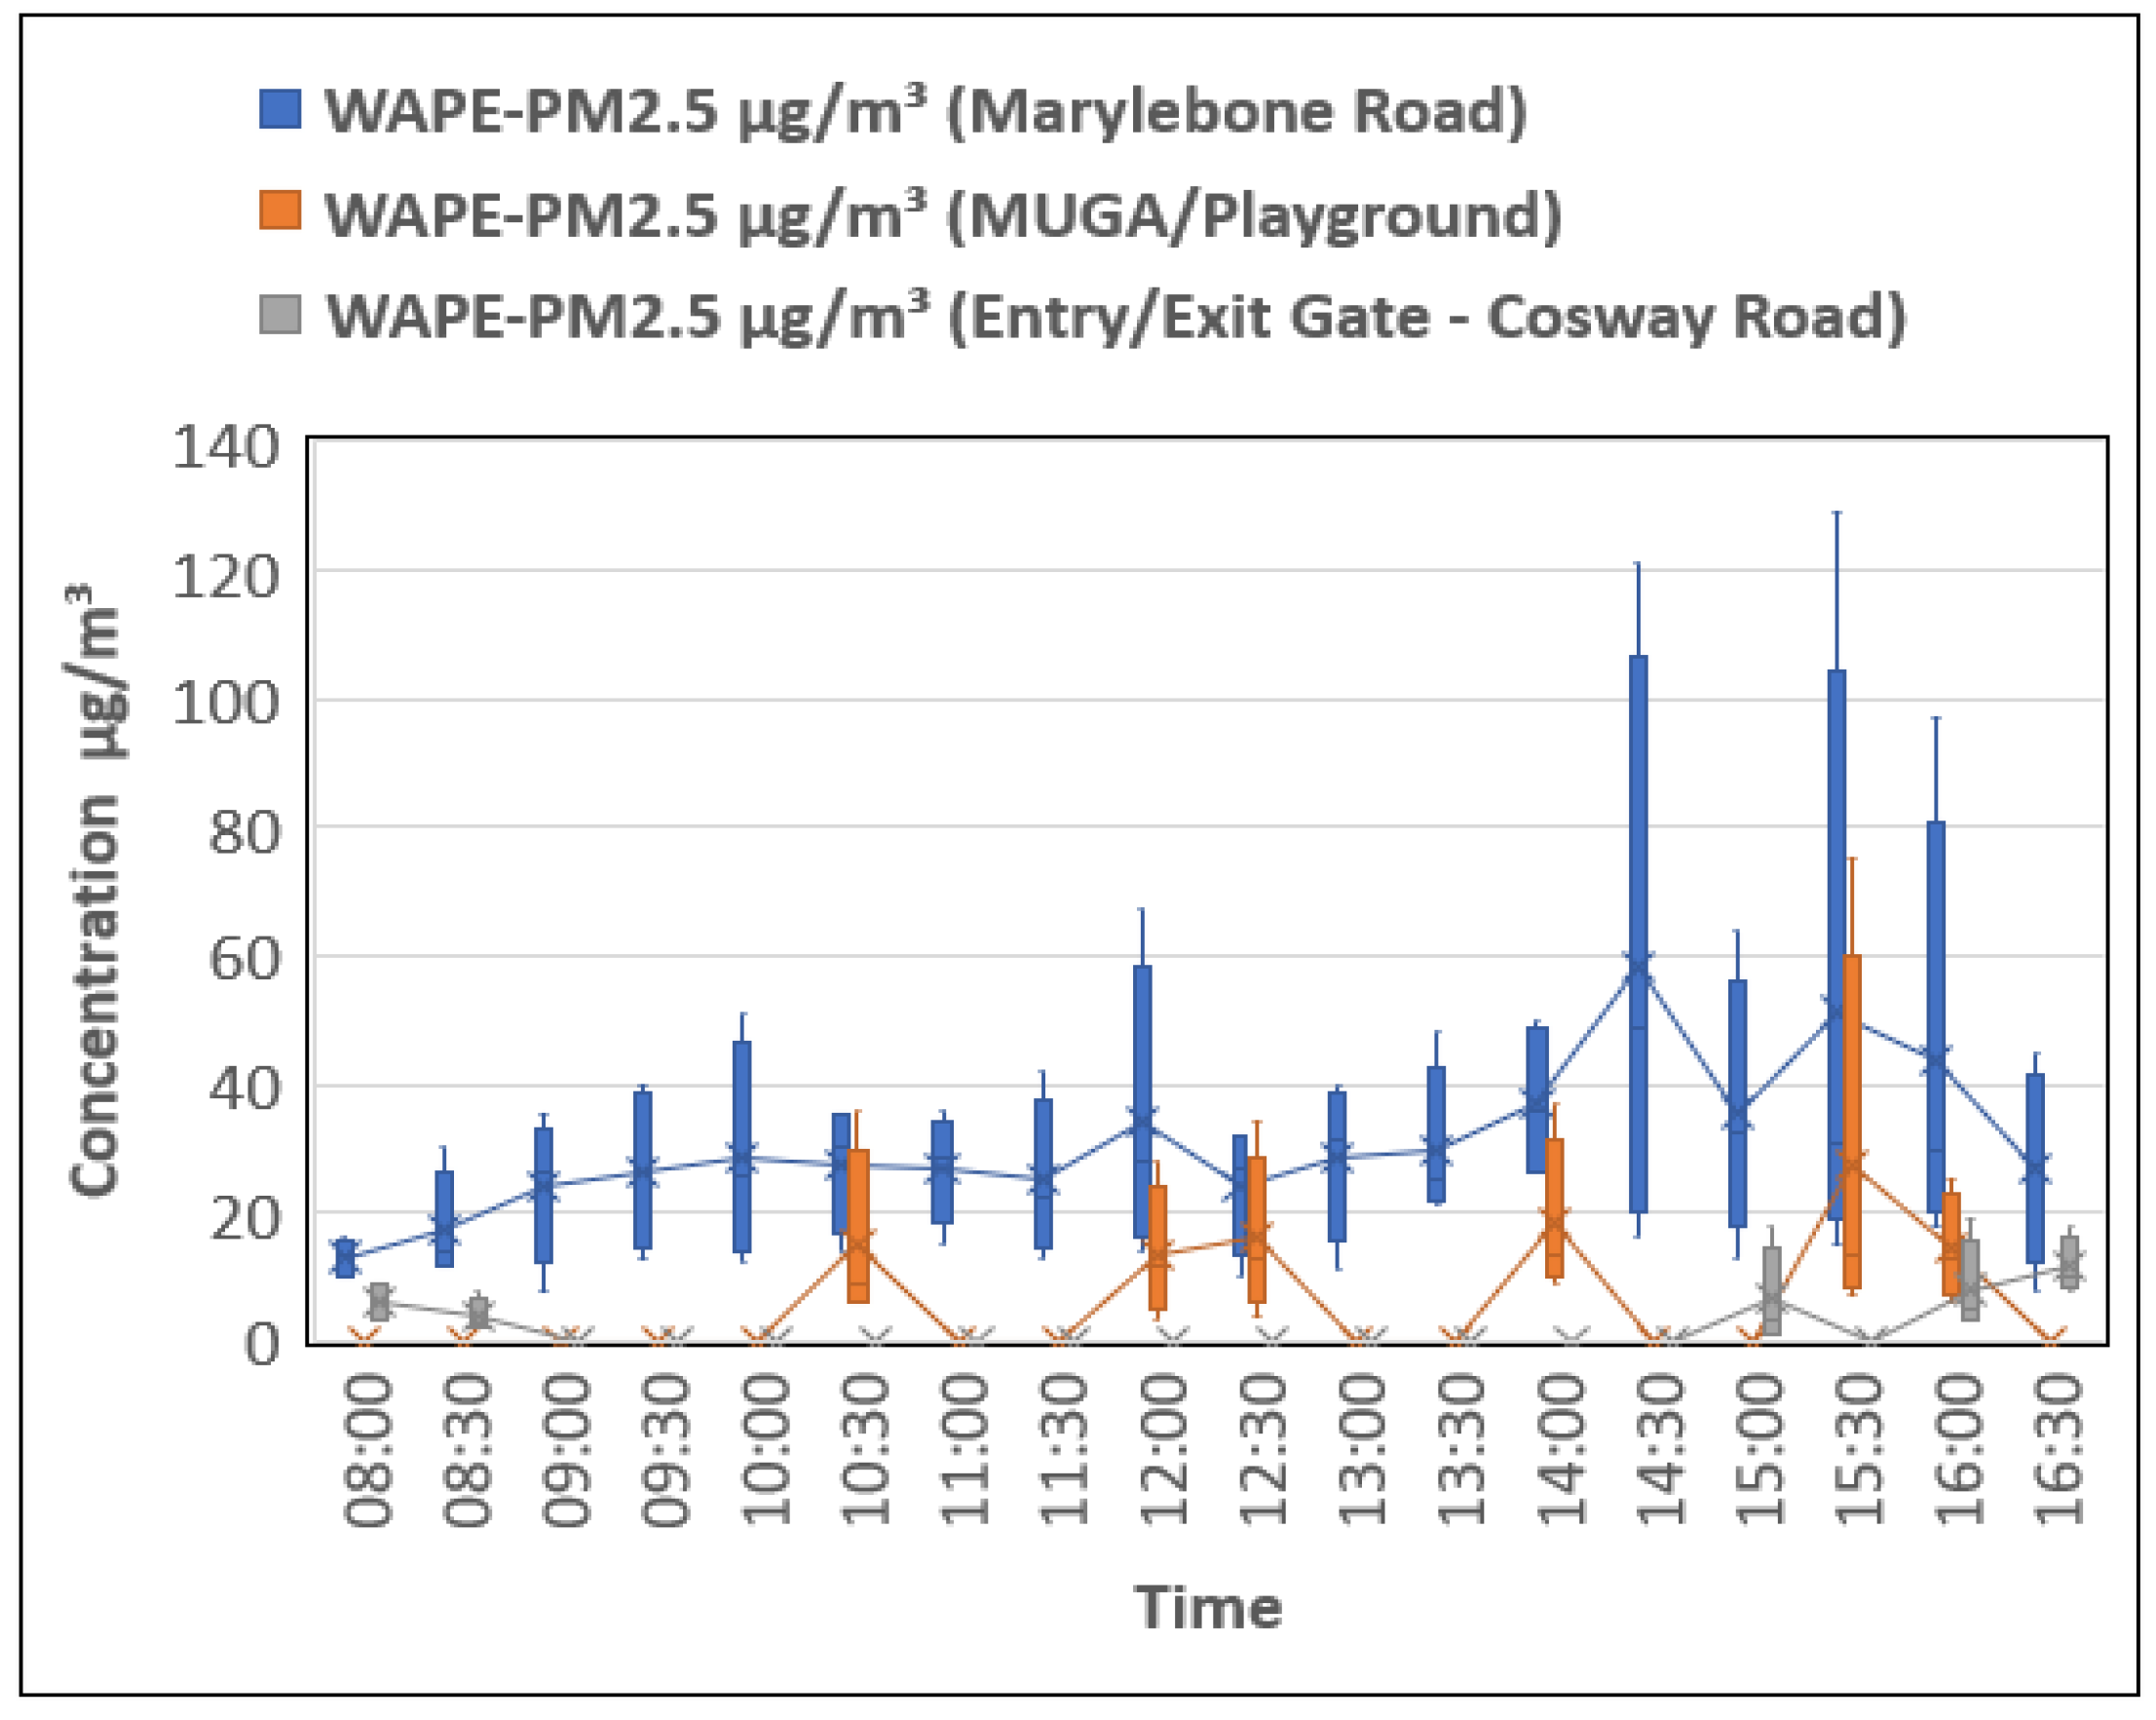
Disclaimer/Publisher’s Note: The statements, opinions and data contained in all publications are solely those of the individual author(s) and contributor(s) and not of MDPI and/or the editor(s). MDPI and/or the editor(s) disclaim responsibility for any injury to people or property resulting from any ideas, methods, instructions or products referred to in the content. |
© 2024 by the authors. Licensee MDPI, Basel, Switzerland. This article is an open access article distributed under the terms and conditions of the Creative Commons Attribution (CC BY) license (https://creativecommons.org/licenses/by/4.0/).