

Influence of Forecrop on Soil Quality Estimated on the Basis of the Growth and Development of Faba Bean and Biochemical Properties of the Soil


Abstract
1. Introduction
2. Materials and Methods
2.1. Soil Material
2.2. Experiment Establishment and Design
2.3. Biometry of Faba Bean
- ▪
- Stem length—SLe (cm);
- ▪
- Number of pods per plant—PNu;
- ▪
- Number of seeds per pod—SNu;
- ▪
- Dry matter yield of: seeds—YDMSe, leaves—YDMLe, stems—YDMSt and siliques—YDMSi (g d.m. per plant).
- ▪
- BBCH 32—2 visibly extended internodes;
- ▪
- BBCH 79—nearly all pods have reached the final length.
2.4. Physicochemical Analysis of the Soil
- ▪
- Particle size distribution—with the laser diffraction method;
- ▪
- pH—with the potentiometric method;
- ▪
- HAC and EBC—with the Kappen method;
- ▪
- Corg and Ntot—using a Vario Max Cube CN analyzer (Elementar Analysen-systeme GmbH, Germany).
2.5. Enzymatic Analysis of the Soil
2.6. Statistical Analysis of the Results
- ▪
- Homogeneous groups (2-way analysis, Tukey t-test p = 0.05)—computed separately for each enzyme and each physical and chemical property of the soil;
- ▪
- Percentage of the observed variability (η2) — determined for enzyme activity and soil chemical properties;
- ▪
- PCA (principal component analysis)—conducted for enzyme activity and soil physicochemical properties;
- ▪
- Pearson’s linear correlations (p = 0.05) between soil biochemical parameters and soil chemical properties — presented as a heat map.
3. Results
3.1. Biometric Traits of Faba Bean
3.2. Biochemical Properties of the Soil
3.3. Physicochemical Properties of the Soil
3.4. Relationships between the Studied Soil Parameters
4. Discussion
4.1. The Influence of Forecrop on the Faba Bean Biometry
4.2. The Influence of Forecrop on the Biochemical Properties of the Soil
4.3. The Influence of Forecrop on the Physicochemical Properties of the Soil
5. Conclusions
Author Contributions
Funding
Institutional Review Board Statement
Informed Consent Statement
Data Availability Statement
Acknowledgments
Conflicts of Interest
Abbreviations
References
- Kooch, Y.; Tavakoli, M.; Akbarinia, M. Tree species could have substantial consequences on topsoil fauna: A feedback of land degradation/restoration. Eur. J. For. Res. 2018, 137, 793–805. [Google Scholar] [CrossRef]
- Yang, H.; Ma, J.; Rong, Z.; Zeng, D.; Wang, Y.; Hu, S.; Ye, W.; Zheng, X. Wheat straw return influences nitrogen-cycling and pathogen associated soil microbiota in a wheat–soybean rotation system. Front. Microbiol. 2019, 10, 1811. [Google Scholar] [CrossRef] [PubMed]
- Jezierska-Tys, S.; Wesołowska, S.; Gałązka, A.; Joniec, J.; Bednarz, J.; Cierpiała, R. Biological activity and functional diversity in soil in different cultivation systems. Int. J. Environ. Sci. Technol. 2020, 17, 4189–4204. [Google Scholar] [CrossRef]
- Siczek, A.; Frąc, M.; Kalembasa, S.; Kalembasa, D. Soil microbial activity of faba bean (Vicia faba L.) and wheat (Triticum aestivum L.) rhizosphere during growing season. Appl. Soil Ecol. 2018, 130, 34–39. [Google Scholar] [CrossRef]
- Furtak, K.; Gałązka, A. Enzymatic activity as a popular parameter used to determine the quality of the soil environment. Pol. J. Agron. 2019, 37, 22–30. [Google Scholar] [CrossRef]
- Acosta-Martínez, V.; Cano, A.; Johnson, J. Simultaneous determination of multiple soil enzyme activities for soil health-biogeochemical indices. Appl. Soil Ecol. 2018, 126, 121–128. [Google Scholar] [CrossRef]
- Maharajan, M.; Sanaullah, M.; Razavi, B.S.; Kuzyakov, Y. Effect of land use and management practices on microbial biomass and enzyme activities in subtropical top- and sub-soils. Appl. Soil Ecol. 2017, 113, 22–28. [Google Scholar] [CrossRef]
- Moghimian, N.; Hosseini, S.M.; Kooch, Y.; Darki, B.Z. Impacts of changes in land use/cover on soil microbial and enzyme activity. Catena 2017, 157, 407–414. [Google Scholar] [CrossRef]
- Filipek-Mazur, B.; Pużyńska, K.; Tabak, M.; Pużyński, S. Enzymatic activity of soil under spelt grown in an organic farming system in Poland’s temperate climate. Agronomy 2020, 10, 930. [Google Scholar] [CrossRef]
- Shrestha, P.; Gautam, R.; Ashwath, N. Effects of agronomic treatments on functional diversity of soil microbial community and microbial activity in a revegetated coal mine spoil. Geoderma 2019, 338, 40–47. [Google Scholar] [CrossRef]
- Wang, J.; Liu, G.B.; Zhang, C.; Wang, G.L.; Fang, L.C.; Cui, Y.X. Higher temporal turnover of soil fungi than bacteria during long term secondary succession in a semiarid abandoned farmland. Soil Till. Res. 2019, 194, 104305. [Google Scholar] [CrossRef]
- Lee, S.H.; Kim, M.S.; Kim, J.G.; Kim, S.O. Use of soil enzymes as indicators for contaminated soil monitoring and sustainable management. Sustainability 2020, 12, 8209. [Google Scholar] [CrossRef]
- Nannipieri, P.; Trasar-Cepeda, C.; Dick, R.P. Soil enzyme activity: A brief history and biochemistry as a basis for appropriate interpretations and meta-analysis. Biol. Fertil. Soils 2018, 54, 11–19. [Google Scholar] [CrossRef]
- Tiwari, R.; Dwivedi, B.S.; Sharma, Y.M.; Sharma, A.; Dwivedi, A.K. Activities of β-glucosidase, phosphatase and dehydrogenase as soil quality indicators: A review. Int. J. Curr. Microbiol. App. Sci. 2019, 8, 834–846. [Google Scholar] [CrossRef]
- Wyszkowska, J.; Borowik, A.; Olszewski, J.; Kucharski, J. Soil bacterial community and soil enzyme activity depending on the cultivation of Triticum aestivum, Brassica napus, and Pisum sativum ssp. arvense. Diversity 2019, 11, 246. [Google Scholar] [CrossRef]
- Bueis, T.; Turrión, M.B.; Bravo, F.; Pando, V.; Muscolo, A. Factors determining enzyme activities in soils under Pinus halepensis and Pinus sylvestris plantations in Spain: A basis for establishing sustainable forest management strategies. Ann. For. Sci. 2018, 75, 34. [Google Scholar] [CrossRef]
- Erdel, E.; Şimşek, U. Effects of soil conservation management systems on soil enzyme activities under wheat cultivation. Pol. J. Environ. Stud. 2023, 32, 1105–1111. [Google Scholar] [CrossRef] [PubMed]
- Garbuz, S.; Mackay, A.; Camps-Arbestain, M.; DeVantier, B.; Minor, M. Biochar increases soil enzyme activities in two contrasting pastoral soils under different grazing management. Crop Pasture Sci. 2022, 74, 101–111. [Google Scholar] [CrossRef]
- Holík, L.; Hlisnikovský, L.; Honzík, R.; Trögl, J.; Burdová, H.; Popelka, J. Soil microbial communities and enzyme activities after long-term application of inorganic and organic fertilizers at different depths of the soil profile. Sustainability 2019, 11, 3251. [Google Scholar] [CrossRef]
- Rao, D.L.N.; Aparna, K.; Mohanty, S. Microbiology and biochemistry of soil organic matter, carbon sequestration and soil health. Indian J. Fertil. 2019, 15, 124–138. [Google Scholar]
- Skowrońska, M.; Bielińska, E.J.; Szymański, K.; Futa, B.; Antonkiewicz, J.; Kołodziej, B. An integrated assessment of the long-term impact of municipal sewage sludge on the chemical and biological properties of soil. Catena 2020, 189, 104484. [Google Scholar] [CrossRef]
- Khalaf, A.S.M.; Al-Ansari, A.M.S. The effect of adding some pesticides in inhibiting the activity of the urease enzyme in sandy loam soil treated with different organic sources. Ann. Rom. Soc. Cell Biol. 2021, 25, 529–546. [Google Scholar]
- Silva-Olaya, A.M.; Mora-Motta, D.A.; Cherubin, M.R.; Grados, D.; Somenahally, A.; Ortiz- Morea, F.A. Soil enzyme responses to land use change in the tropical rainforest of the Colombian Amazon region. PLoS ONE 2021, 16, e0255669. [Google Scholar] [CrossRef]
- Bogati, K.A.; Golińska, P.; Sewerniak, P.; Burkowska-But, A.; Walczak, M. Deciphering the impact of induced drought in agriculture soils: Changes in microbial community structure, enzymatic and metabolic diversity. Agronomy 2023, 13, 1417. [Google Scholar] [CrossRef]
- Buckley, S.; Allen, D.; Brackin, R.; Jämtgård, S.; Näsholm, T.; Schmidt, S. Microdialysis as an in situ technique for sampling soil enzymes. Soil Biol. Biochem. 2019, 135, 20–27. [Google Scholar] [CrossRef]
- Demkina, E.V.; Shanenko, E.F.; Nikolaev, Y.A.; El’-Registan, G.I. Model of the regulation of activity of immobilized enzymes (amylases) in soil. Microbiology 2017, 86, 231–240. [Google Scholar] [CrossRef]
- Zhang, B.; Cai, Y.; Hu, S.; Chang, S.X. Plant mixture effects on carbon-degrading enzymes promote soil organic carbon accumulation. Soil Biol. Biochem. 2021, 163, 108457. [Google Scholar] [CrossRef]
- Zheng, L.T.; Chen, H.Y.H.; Yan, E.R. Tree species diversity promotes litterfall productivity through crown complementarity in subtropical forests. J. Ecol. 2019, 107, 1852–1861. [Google Scholar] [CrossRef]
- Li, X.; Kang, X.; Zou, J.; Yin, J.; Wang, Y.; Li, A.; Ma, X. Allochthonous arbuscular mycorrhizal fungi promote Salix viminalis L.–mediated phytoremediation of polycyclic aromatic hydrocarbons characterized by increasing the release of organic acids and enzymes in soils. Ecotoxicol. Environ. Saf. 2023, 249, 114461. [Google Scholar] [CrossRef]
- Hou, D.; Bolan, N.S.; Tsang, D.C.; Kirkham, M.B.; O’connor, D. Sustainable soil use and management: An interdisciplinary and systematic approach. Sci. Total Environ. 2020, 729, 138961. [Google Scholar] [CrossRef]
- Holatko, J.; Brtnicky, M.; Baltazar, T.; Smutny, V.; Frouz, J.; Kintl, A.; Jaskulska, I.; Ryant, P.; Radziemska, M.; Latal, O.; et al. Long-term effects of wheat continuous cropping vs. wheat in crop rotation on carbon content and mineralisation, aggregate stability, biological activity, and crop yield. Eur. J. Agron. 2024, 158, 127218. [Google Scholar] [CrossRef]
- Zhang, Q.Q.; Men, X.Y.; Hui, C.; Ge, F.; Ouyang, F. Wheat yield losses from pests and pathogens in China. Agric. Ecosyst. Environ. 2022, 326, 107821. [Google Scholar] [CrossRef]
- Zhang, L.; Chu, Q.; Jiang, Y.; Chen, F.; Lei, Y.-D. Impacts of climate change on drought risk of winter wheat in the North China Plain. J. Integr. Agric. 2021, 20, 2601–2612. [Google Scholar] [CrossRef]
- Ghosh, T.; Maity, P.P.; Das, T.K.; Krishnan, P.; Bhatia, A.; Bhattacharya, P.; Sharma, D.K. Variation of porosity, pore size distribution and soil physical properties under conservation agriculture. Indian J. Agric. Sci. 2020, 90, 2051–2058. [Google Scholar] [CrossRef]
- Hazra, K.K.; Nath, C.P.; Singh, U.; Praharaj, C.S.; Kumar, N.; Singh, S.S.; Singh, N.P. Diversification of maize-wheat cropping system with legumes and integrated nutrient management increases soil aggregation and carbon sequestration. Geoderma 2019, 353, 308–319. [Google Scholar] [CrossRef]
- Romero-Salas, E.A.; Navarro-Noya, Y.E.; Luna-Guido, M.; Verhulst, N.; Crossa, J.; Govaerts, B.; Dendooven, L. Changes in the bacterial community structure in soil under conventional and conservation practices throughout a complete maize (Zea mays L.) crop cycle. App. Soil Ecol. 2021, 157, 103733. [Google Scholar] [CrossRef]
- Serafin-Andrzejewska, M.; Helios, W.; Jama-Rodzénska, A.; Kotecki, A.; Kozak, M.; Zarzycki, P.; Kaliska, B. Effect of the depth and rate of sowing on the yield and yield components of determinate and indeterminate faba beans (Vicia faba var. minor L.) cultivars under conditions of Southwestern Poland. Agron. Sci. 2022, 77, 27–40. [Google Scholar] [CrossRef]
- Karkanis, A.; Ntatsi, G.; Lepse, L.; Fernández, J.A.; Vågen, I.M.; Rewald, B.; Alsin, I.; Kronberga, A.; Balliu, A.; Olle, M.; et al. Faba bean cultivation—Revealing novel managing practices for more sustainable and competitive European cropping systems. Front. Plant Sci. 2018, 9, 1115. [Google Scholar] [CrossRef]
- Faligowska, A.; Szymańska, G.; Panasiewicz, K.; Szukała, J.; Koziara, W.; Ratajczak, K. The long-term effect of legumes as forecrops on the productivity of rotation (winter rape-winter wheat-winter wheat) with nitrogen fertilization. Plant Soil Environ. 2019, 65, 138. [Google Scholar] [CrossRef]
- Szymańska, G.; Faligowska, A.; Panasiewicz, K.; Szukała, J.; Ratajczak, K.; Sulewska, H. The long-term effect of legumes as forecrops on the productivity of rotation winter triticale–winter rape with nitrogen fertilisation. Acta Agric. Scand B Soil Plant Sci. 2020, 70, 128–134. [Google Scholar] [CrossRef]
- Adetunji, A.T.; Lewu, F.B.; Mulidzi, R.; Ncube, B. The biological activities of β-glucosidase, phosphatase and urease as Soil quality indicators: A Review. J. Soil Sci. Plant Nutr. 2017, 17, 794–807. [Google Scholar] [CrossRef]
- Komorek, D.; Wyszkowska, J.; Borowik, A.; Zaborowska, M. Microbial activity and diversity in soil sown with Zea mays and Triticosecale. Agriculture 2024, 14, 1070. [Google Scholar] [CrossRef]
- Błońska, E.; Lasota, J.; Zwydak, M. The relationship between soil properties, enzyme activity and land use. For. Res. Pap. 2017, 78, 39–44. [Google Scholar] [CrossRef]
- Daunoras, J.; Kăcergius, A.; Gudiukaite, R. Role of soil microbiota enzymes in soil health and activity changes depending on climate change and the type of soil ecosystem. Biology 2024, 13, 85. [Google Scholar] [CrossRef]
- International Union of Soil Sciences Working Group. World Reference Base for Soil Resources 2014, Update 2015. In International Soil Classification System for Naming Soils and Creating Legends for Soil Maps; World Soil Resources Reports No. 106; FAO: Rome, Italy, 2015. [Google Scholar]
- Wyszkowska, J.; Boros-Lajszner, E.; Kucharski, J. The impact of soil contamination with lead on the biomass of maize intended for energy purposes, and the biochemical and physicochemical properties of the soil. Energies 2024, 17, 1156. [Google Scholar] [CrossRef]
- Öhlinger, R. Dehydrogenase activity with the substrate TTC. In Methods in Soil Biology; Schinner, F., Ohlinger, R., Kandler, E., Margesin, R., Eds.; Springer: Berlin/Heidelberg, Germany, 1996; pp. 241–243. [Google Scholar]
- Johnson, J.L.; Temple, K.L. Some variables affecting the measurement of catalase activity in soil. Soil Sci. Soc. Am. J. 1964, 28, 207–209. [Google Scholar] [CrossRef]
- Alef, K.; Nannipieri, P. (Eds.) Methods in Applied Soil Microbiology and Biochemistry; Academic London: London, UK, 1998; pp. 316–365. [Google Scholar]
- Kucharski, J.; Tomkiel, M.; Baćmaga, M.; Borowik, A.; Wyszkowska, J. Enzyme activity and microorganisms diversity in soil contaminated with the Boreal 58 WG herbicide. J. Environ. Sci. Health B 2016, 51, 446–454. [Google Scholar] [CrossRef]
- Paz-Ferreiro, J.; Gasco, G.; Gutiérrez, B.; Mendez, A. Soil biochemical activities and the geometric mean of enzyme activities after application of sewage sludge and sewage sludge biochar to soil. Biol. Fertil. Soils 2012, 48, 511–517. [Google Scholar] [CrossRef]
- TIBCO Software Inc. Statistica, Version 13.3. In Data Analysis Software System; Tibco Software Inc.: Palo Alto, CA, USA, 2024; Available online: https://docs.tibco.com/products/tibco-statistica-document-management-system-13-3-0 (accessed on 15 April 2024).
- Lemanowicz, J.; Bartkowiak, A.; Lamparski, R.; Wojewódzki, P.; Pobereżny, J.; Wszelaczyńska, E.; Szczepanek, M. Physicochemical and enzymatic soil properties influenced by cropping of primary wheat under organic and conventional farming systems. Agronomy 2020, 10, 1652. [Google Scholar] [CrossRef]
- Litke, L.; Gaile, Z.; Ruža, A. Effect of nitrogen rate and forecrop on nitrogen use efficiency in winter wheat (Triticum aestivum). Agron. Res. 2019, 17, 582–592. [Google Scholar] [CrossRef]
- Magyar, Z.; Pepó, P.; Gyimes, E. Effects of agrotechnical factors on the quality and quantity of yield in winter wheat production. Acta Agric. Debreceniensis 2020, 1, 69–75. [Google Scholar] [CrossRef]
- Pszczółkowska, A.; Okorski, A.; Olszewski, J.; Fordoński, G.; Krzebietke, S.; Chareńska, A. Effects of pre-preceding leguminous crops on yield and chemical composition of winter wheat grain. Plant Soil Environ. 2018, 64, 592–596. [Google Scholar] [CrossRef]
- Kimbirauskiene, R.; Sinkeviciene, A.; Jonaitis, R.; Romaneckas, K. The effect of tillage intensity on faba bean growth and development. Geogr. Res. Bull. 2023, 2, 169–182. [Google Scholar] [CrossRef]
- Janusauskaite, D.; Feiziene, D.; Feiza, V. Nitrogen-induced variations in leaf gas exchange of spring triticale under field conditions. Acta Physiol. Plant 2017, 39, 193. [Google Scholar] [CrossRef]
- Jiang, C.; Zu, C.; Wang, H. Effect of nitrogen fertilization on growth and photosynthetic nitrogen use efficiency in tobacco (Nicotiana tabacum L.). J. Life Sci. 2015, 9, 373–380. [Google Scholar] [CrossRef]
- Wanic, M.; Treder, K. Effect of forecrops on gas exchange and selected agronomic characteristics of wheat and spelt. J. Elem. 2020, 25, 607–619. [Google Scholar] [CrossRef]
- Li, Y.; Nie, C.; Liu, Y.; Du, W.; He, P. Soil microbial community composition closely associates with specific enzyme activities and soil carbon chemistry in a long-term nitrogen fertilized grassland. Sci. Total Environ. 2019, 654, 264–274. [Google Scholar] [CrossRef]
- Chen, Y.P.; Tsai, C.F.; Rekha, P.D.; Ghate, S.D.; Huang, H.Y.; Hsu, Y.H.; Liaw, L.L.; Young, C.C. Agricultural management practices influence the soil enzyme activity and bacterial community structure in tea plantations. Bot. Stud. 2021, 62, 1. [Google Scholar] [CrossRef] [PubMed]
- Goenster, S.; Gründler, C.; Buerkert, A.; Joergensen, R.G. Soil microbial indicators across land use types in the river oasis Bulgan sum center, Western Mongolia. Ecol. Indic. 2017, 76, 111–118. [Google Scholar] [CrossRef]
- De Vries, F.T.; Williams, A.; Stringer, F.; Willcocks, R.; McEwing, R.; Langridge, H.; Straathof, A.L. Changes in root–exudate–induced respiration reveal a novel mechanism through which drought affects ecosystem carbon cycling. New Phytol. 2019, 224, 132–145. [Google Scholar] [CrossRef]
- Steinauer, K.; Chatzinotas, A.; Eisenhauer, N. Root exudate cocktails: The link between plant diversity and soil microorganisms? Ecol. Evol. 2016, 6, 7387–7396. [Google Scholar] [CrossRef]
- Woźniak, A. Chemical properties and enzyme activity of soil as affected by tillage system and previous crop. Agriculture 2019, 9, 262. [Google Scholar] [CrossRef]
- Meena, A.; Rao, K.S. Assessment of soil microbial and enzyme activity in the rhizosphere zone under different land use/cover of a semiarid region, India. Ecol. Proces. 2021, 10, 16. [Google Scholar] [CrossRef]
- Sarto, M.V.M.; Borges, W.L.B.; Sarto, J.R.W.; Pires, C.A.B.; Rice, C.W.; Rosolem, C.A. Soil microbial community and activity in a tropical integrated crop-livestock system. Appl. Soil Ecol. 2020, 145, 103350. [Google Scholar] [CrossRef]
- Silva, É.O.; de Medeiros, E.V.; Duda, G.P.; Junior, M.A.L.; Brossard, M.; de Oliveira, J.B.; dos Santos, U.J.; Hammecker, C. Seasonal effect of land use type on soil absolute and specific enzyme activities in a Brazilian semi-arid region. Catena 2019, 172, 397–407. [Google Scholar] [CrossRef]
- Vinhal-Freitas, I.C.; Corrêa, G.F.; Wendling, B.; Bobuľská, L.; Ferreira, A.S. Soil textural class plays a major role in evaluating the effects of land use on soil quality indicators. Ecol. Indic. 2017, 74, 182–190. [Google Scholar] [CrossRef]
- Jat, H.S.; Datta, A.; Choudhary, M.; Sharma, P.C.; Dixit, B.; Jat, M.L. Soil enzymes activity: Effect of climate smart agriculture on rhizosphere and bulk soil under cereal based systems of north-west India. Eur. J. Soil Biol. 2021, 103, 103292. [Google Scholar] [CrossRef]
- Lasota, J.; Błońska, E.; Piaszczyk, W. State of soil enzymatic activity in relationship to some chemical properties of Brunic Arenosols. Soil Sci. Annual 2021, 72, 140641. [Google Scholar] [CrossRef]
- Wang, R.; Dorodnikov, M.; Yang, S.; Zhang, Y.; Filley, T.R.; Turco, R.F.; Zhang, Y.; Xu, Z.; Li, H.; Jiang, Y. Responses of enzymatic activities within soil aggregates to 9-year nitrogen and water addition in a semi-arid grassland. Soil Biol. Biochem. 2015, 81, 159–167. [Google Scholar] [CrossRef]
- Bonanomi, G.; D’Ascoli, R.; Antignani, V.; Capodilupo, M.; Cozzolino, L.; Marzaioli, R.; Puopolo, G.; Rutigliano, F.A.; Scelza, R.; Scotti, R.; et al. Assessing soil quality under intensive cultivation and tree orchards in Southern Italy. Appl. Soil Ecol. 2011, 47, 184–194. [Google Scholar] [CrossRef]
- Pathan, S.I.; Žifčáková, L.; Ceccherini, M.T.; Pantani, O.L.; Větrovský, T.; Baldrian, P. Seasonal variation and distribution of total and active microbial community of β-glucosidase encoding genes in coniferous forest soil. Soil Biol. Biochem. 2017, 105, 71–80. [Google Scholar] [CrossRef]
- De Almeida, R.F.; Naves, E.R.; da Mota, R.P. Soil quality: Enzymatic activity of soil β-glucosidase. Glob. J. Agric. Res. Rev. 2015, 3, 146–450. [Google Scholar]
- Dong RAbdelkerim-Ouba, D.; Liu, D.; Ma, X.; Wang, S. Impacts of partial substitution of chemical fertilizer with organic manure on the kinetic and thermodynamic characteristics of soil β–glucosidase. Agronomy 2023, 13, 1065. [Google Scholar] [CrossRef]
- Mariscal-Sancho, I.; Ball, B.; McKenzie, B. Influence of tillage practices, organic manures and extrinsic factors on β-glucosidase activity: The final step of cellulose hydrolysis. Soil Systems 2018, 2, 21. [Google Scholar] [CrossRef]
- Kwiatkowski, C.A.; Harasim, E.; Feledyn-Szewczyk, B.; Antonkiewicz, J. Enzymatic activity of loess soil in organic and conventional farming systems. Agriculture 2020, 10, 135. [Google Scholar] [CrossRef]
- Jurado, M.M.; Suárez-Estrella, F.; Vargas-García, M.C.; López, M.J.; López-González, J.A.; Moreno, J. Evolution of enzymatic activities and carbon fractions throughout composting of plant waste. J. Environ. Manag. 2014, 133, 355–364. [Google Scholar] [CrossRef]
- Pobereżny, J.; Wszelaczyńska, E.; Lamparski, R.; Lemanowicz, J.; Bartkowiak, A.; Szczepanek, M.; Gościnna, K. The impact of spring wheat species and sowing density on soil biochemical properties, content of secondary plant metabolites and the presence of Oulema ssp. PeerJ 2023, 11, e14916. [Google Scholar] [CrossRef]
- Wang, Y.; Tu, C.; Cheng, L.; Li, C.; Gentry, L.F.; Hoyt, G.D.; Zhang, X.; Hu, S. Long term impact of farming practices on soil organic carbon and nitrogen pools and microbial biomass and activity. Soil Tillage Res. 2011, 117, 8–16. [Google Scholar] [CrossRef]
- Yuan, J.; Sadiq, M.; Rahim, N.; Tahir, M.M.; Liang, Y.; Zhuo, M.; Yan, L.; Shaheen, A.; Mahmood, B.; Li, G. Changes in soil properties and crop yield under sustainable conservation tillage systems in spring wheat agroecosystems. Land 2023, 12, 1253. [Google Scholar] [CrossRef]
- Haruna, S.I. Influence of winter wheat on soil thermal properties of a Paleudalf. Int. Agrophys. 2019, 33, 389–395. [Google Scholar] [CrossRef]


| Soil Properties | Unit | Forecrop (Fc) | |||
|---|---|---|---|---|---|
| Spring Wheat (SW) | Winter Wheat (WW) | Maize (M) | Winter Rape (WR) | ||
| Soil type | Silty loam clay (Slc) | Silty loam clay (Slc) | Silty loam clay (Slc) | Silty loam clay (Slc) | |
| Particle-size distribution | |||||
| Clay (<0.002 mm) | % | 1.000 ± 0.026 | 1.000 ± 0.010 | 2.000 ± 0.021 | 1.000 ± 0.030 |
| Silt (0.02–0.05 mm) | 69.000 ± 2.082 | 65.000 ± 1.000 | 69.000 ± 1.732 | 61.000 ± 2.517 | |
| Sand (0.0–2.0 mm) | 30.000 ± 1.528 | 34.000 ± 2.517 | 29.000 ± 2.082 | 38.000 ± 2.646 | |
| Chemical properties | |||||
| pH | 1 Mol KCl dm−3 | 6.233 ± 0.058 | 6.367 ± 0.058 | 6.233 ± 0.058 | 5.933 ± 0.058 |
| Hydrolytic acidity (HAC) | mMol+ kg−1 d.m. soil | 26.750 ± 0.433 | 18.750 ± 0.750 | 21.250 ± 0.433 | 28.000 ± 0.433 |
| Sum of exchangeable bases (EBC) | 238.000 ± 2.00 | 298.000 ± 2.00 | 386.667 ± 2.309 | 210.000 ± 2.00 | |
| Sorption capacity (CEC) | 264.750 ± 2.385 | 316.750 ± 1.250 | 407.917 ± 2.554 | 238.000 ± 2.385 | |
| Base saturation (BS) | % | 89.896 ± 0.090 | 94.080 ± 0.260 | 95.645 ± 0.076 | 88.236 ± 0.089 |
| Organic carbon content (Corg) | g kg−1 d.m. soil | 18.220 ± 0.023 | 18.770 ± 0.018 | 17.170 ± 0.013 | 18.290 ± 0.012 |
| Total nitrogen content (Ntot) | 2.460 ± 0.009 | 2.630 ± 0.004 | 2.625 ± 0.006 | 2.745 ± 0.004 | |
| C:N ratio | 7.406 ± 0.009 | 7.137 ± 0.035 | 6.541 ± 0.060 | 6.663 ± 0.035 | |
| Forecrop (Fc) | Dehydrogenases (Deh) µMol TFF | Catalase (Cat) Mol O2 | Alkaline Phosphatase (Pal) | Acid Phosphatase (Pac) | β-Glucosidase (Glu) | Arylsulfatase (Aryl) | Urease (Ure) mMol N-NH4 | Geometric Mean of Enzyme Activities (GMea) |
|---|---|---|---|---|---|---|---|---|
| mMol PNP | ||||||||
| SW | 22.161 ± 0.363 | 0.592 ± 0.004 | 4.587 ± 0.230 | 6.359 ± 0.101 | 0.518 ± 0.003 | 0.520 ± 0.021 | 1.044 ± 0.021 | 1.951 ± 0.001 |
| WW | 12.056 ± 0.872 | 0.622 ± 0.004 | 6.419 ± 0.144 | 6.340 ± 0.252 | 0.430 ± 0.00 9 | 1.280 ± 0.032 | 1.278 ± 0.021 | 2.153 ± 0.002 |
| M | 12.172 ± 1.320 | 0.624 ± 0.002 | 4.928 ± 0.166 | 6.940 ± 0.089 | 0.448 ± 0.002 | 0.757 ± 0.018 | 0.731 ± 0.086 | 1.813 ± 0.002 |
| WR | 20.112 ± 0.810 | 0.554 ± 0.004 | 4.408 ± 0.083 | 7.202 ± 0.022 | 0.475 ± 0.005 | 0.542 ± 0.022 | 1.317 ± 0.065 | 1.981 ± 0.001 |
| Fc | Stem Length (cm) | Pod Number (Plant−1) | Seed Number (Pod−1) | Dry Matter Yield Of | |||
|---|---|---|---|---|---|---|---|
| Seeds | Leaves | Stems | Silique | ||||
| g d.m. Plant−1 | |||||||
| SW | 93.880 ± 1.339 a | 6.120 ± 0.676 a | 1.708 ± 0.071 b | 3.915 ± 0.712 a | 2.489 ± 0.144 a | 3.554 ± 0.279 a | 2.213 ± 0. 092 a |
| WW | 94.943 ± 4.253 a | 5.300 ± 0.817 ab | 1.782 ± 0.075 b | 4.099 ± 1.018 a | 1.993 ± 0.340 ab | 3.488 ± 0.338 a | 2.157 ± 0.395 a |
| M | 92.307 ± 2.451 b | 4.967 ± 1.054 ab | 1.885 ± 0.078 a | 3.714 ± 0.496 ab | 2.168 ± 0.51 7 ab | 3.242 ± 0.554 b | 2.075 ± 0.372 b |
| WR | 89.783 ± 3.172 c | 4.233 ± 0.446 c | 1.810 ± 0.044 a | 3.408 ± 0.915 b | 1.860 ± 0.421 b | 2.976 ± 0.804 c | 1.739 ± 0.455 c |
| p-value | 0.072 | 0.004 | 0.044 | 0.508 | 0.052 | 0.008 | 0.029 |
| Fc | Deh µMol TFF | Cat Mol O2 | Pal | Pac | Glu | Aryl | Ure mMol N-NH4 | GMea |
|---|---|---|---|---|---|---|---|---|
| mMol PNP | ||||||||
| Us | ||||||||
| SW | 13.537 ± 1.118 d | 0.551 ± 0.004 d | 3.309 ± 0.018 f | 5.603 ± 0.157 d | 0.333 ± 0.006 g | 0.303 ± 0.004 e | 0.420 ± 0.018 g | 1.286 ± 0.009 f |
| WW | 8.375 ± 0.598 f | 0.588 ± 0.004 c | 3.877 ± 0.102 d | 3.898 ± 0.039 h | 0.408 ± 0.029 e | 0.350 ± 0.007 d | 0.892 ± 0.018 b | 1.378 ± 0.002 e |
| M | 5.558 ± 0.538 g | 0.591 ± 0.007 bc | 2.647 ± 0.056 g | 4.816 ± 0.049 e | 0.403 ± 0.014 e | 0.384 ± 0.014 c | 0.589 ± 0.034 d | 1.210 ± 0.017 g |
| WR | 15.023 ± 0.733 c | 0.531 ± 0.003 e | 2.486 ± 0.156 h | 4.153 ± 0.027 g | 0.380 ± 0.006 f | 0.330 ± 0.035 e | 0.498 ± 0.017 f | 1.262 ± 0.008 f |
| Ss | ||||||||
| SW | 17.408 ± 0.490 b | 0.632 ± 0.004 a | 3.494 ± 0.128 e | 5.720 ± 0.103 c | 0.582 ± 0.001 a | 0.436 ± 0.028 a | 0.552 ± 0.018 e | 1.632 ± 0.022 d |
| WW | 12.273 ± 0.062 e | 0.639 ± 0.004 a | 5.663 ± 0.069 a | 4.375 ± 0.093 f | 0.416 ± 0.003 d | 0.411 ± 0.011 b | 1.245 ± 0.017 a | 1.702 ± 0.010 c |
| M | 19.249 ± 0.775 a | 0.651 ± 0.004 a | 4.004 ± 0.033 c | 6.421 ± 0.028 b | 0.430 ± 0.015 c | 0.438 ± 0.007 a | 1.241 ± 0.017 a | 1.853 ± 0.010 a |
| WR | 17.842 ± 0.838 b | 0.607 ± 0.007 b | 4.247 ± 0.001 b | 6.648 ± 0.135 a | 0.533 ± 0.002 b | 0.412 ± 0.007 b | 0.792 ± 0.017 c | 1.764 ± 0.004 b |
| p-value | ||||||||
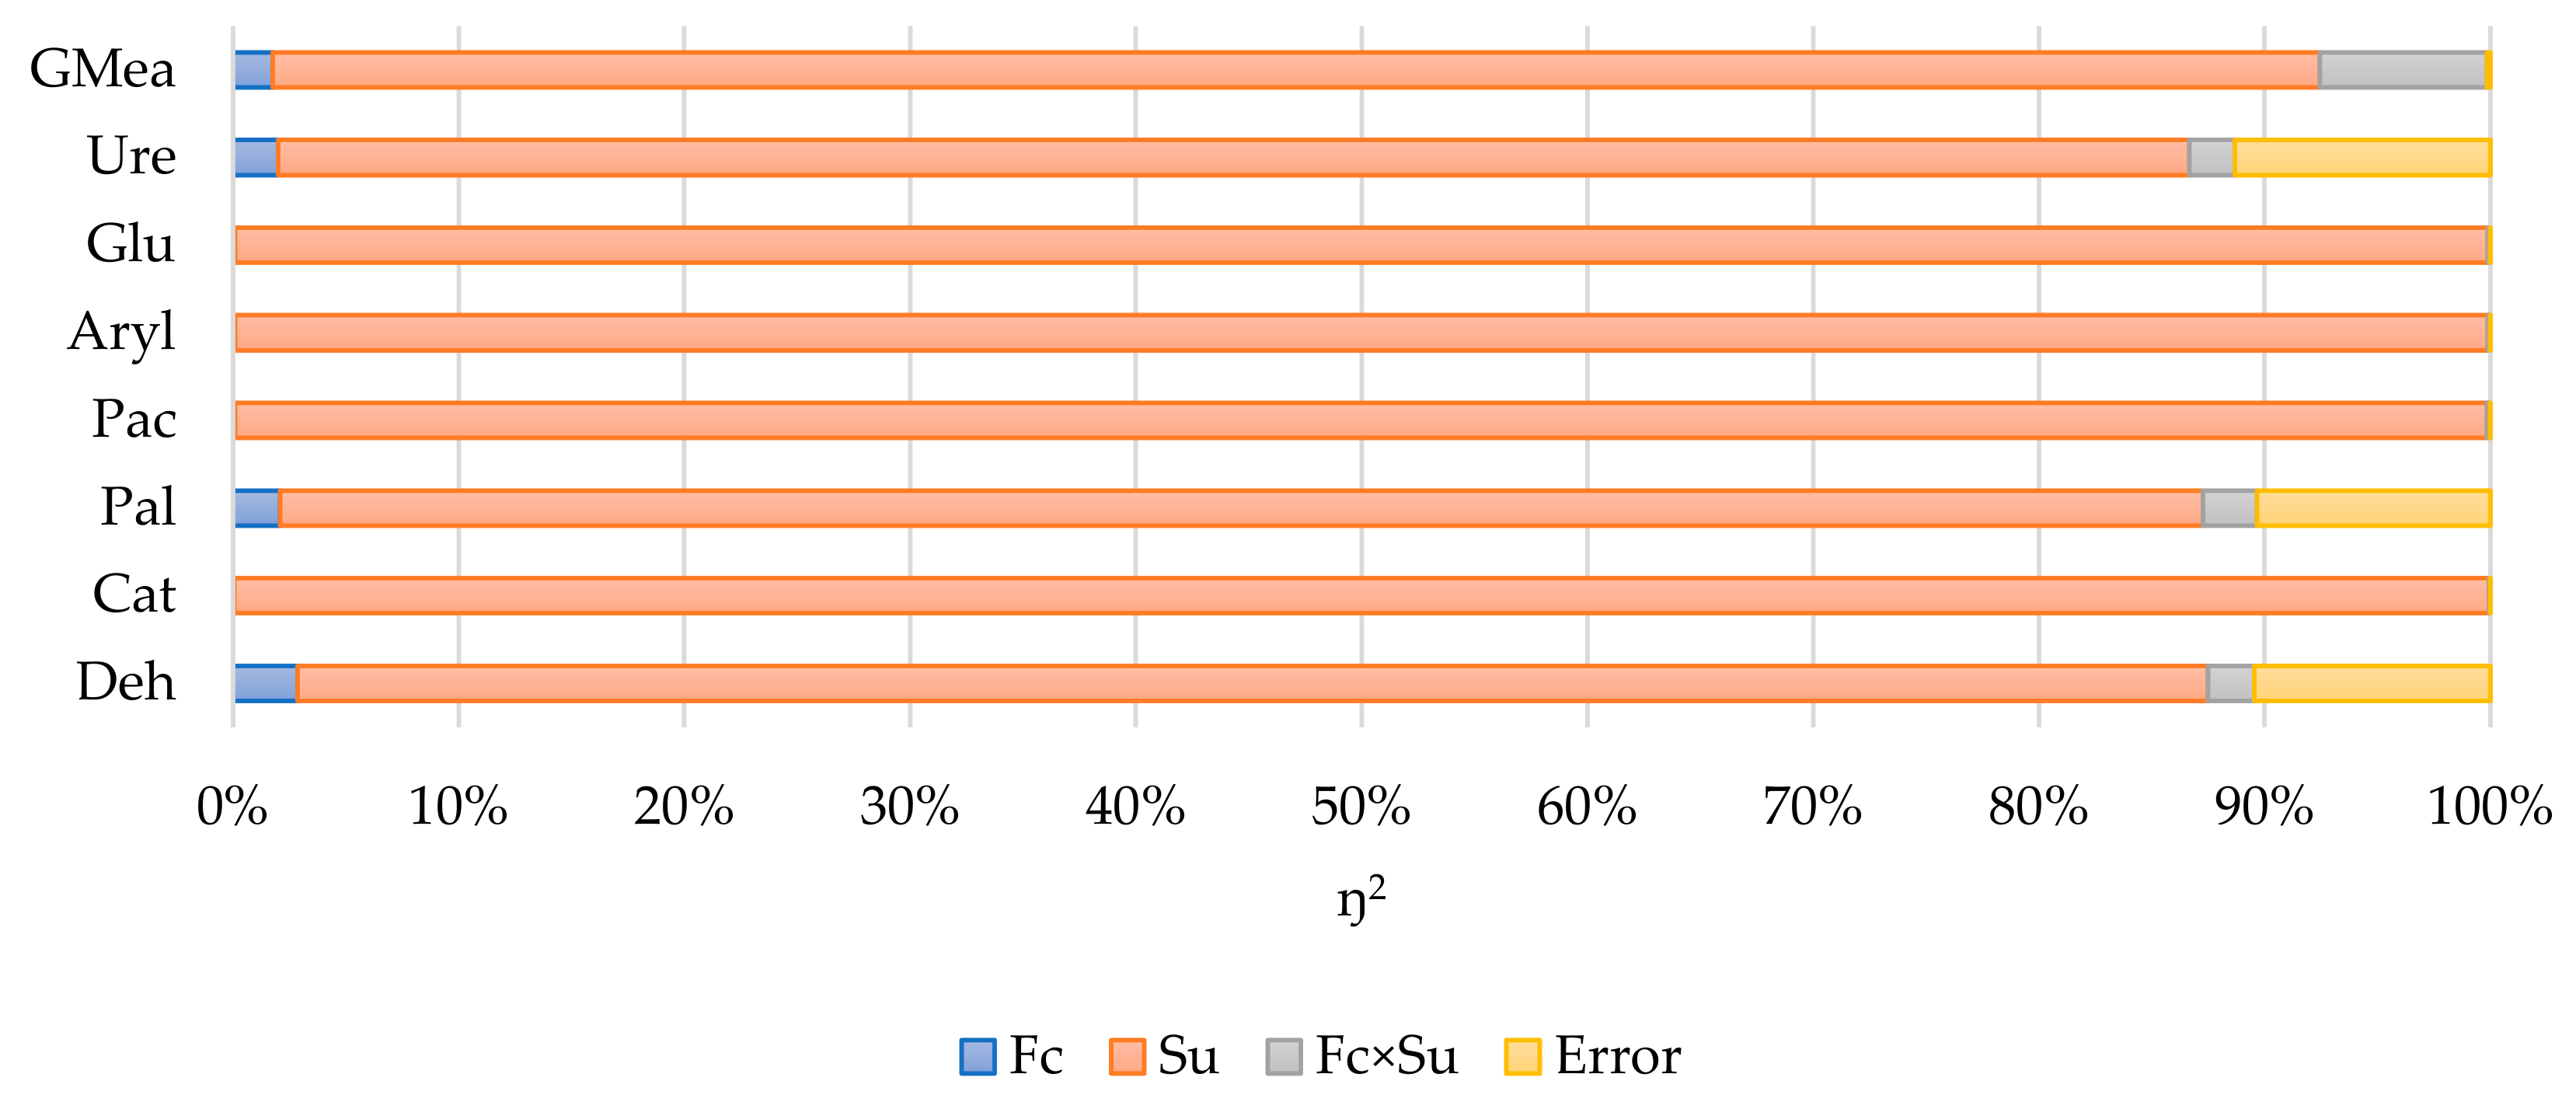
| Fc | 0.064 | <0.001 | 0.086 | <0.001 | <0.001 | <0.001 | 0.042 | <0.001 |
| Su | <0.001 | <0.001 | <0.001 | <0.001 | <0.001 | <0.001 | <0.001 | <0.001 |
| Fc×Su | 0.032 | <0.001 | 0.043 | <0.001 | <0.001 | <0.001 | 0.023 | <0.001 |
| Fc | pH | HAC | EBC | CEC | BS (%) | Corg | Ntot | C:N |
|---|---|---|---|---|---|---|---|---|
| mmol(+) kg−1 d.m. Soil | g kg−1 d.m. Soil | |||||||
| Us | ||||||||
| SW | 6.167 ± 0.058 b | 27.750 ± 0.750 b | 240.000 ± 2.000 d | 267.750 ± 1.750 d | 89.635 ± 0.299 c | 20.090 ± 0.230 a | 2.540 ± 0.090 a | 7.914 ± 0.190 ab |
| WW | 6.333 ± 0.58 a | 19.250 ± 0.433 e | 300.667 ± 2.082 b | 319.917 ± 1.665 b | 93.982 ± 0.165 a | 18.770 ± 0.180 c | 2.415 ± 0.035 bc | 7.773 ± 0.038 ab |
| M | 6.167 ± 0.058 b | 21.750 ± 0.750 cd | 228.000 ± 2.000 e | 249.750 ± 2.750 e | 91.293 ± 0.204 b | 19.030 ± 0.130 bc | 2.520 ± 0.060 ab | 7.555 ± 0.232 b |
| WR | 5.833 ± 0.058 c | 29.250 ± 0.750 b | 212.000 ± 2.000 f | 241.250 ± 1.750 f | 87.875 ± 0.336 e | 17.700 ± 0.120 d | 2.265 ± 0.035 d | 7.816 ± 0.174 ab |
| Ss | ||||||||
| SW | 6.067 ± 0.058 b | 29.250 ± 0.750 b | 236.000 ± 2.000 d | 265.250 ± 2.750 d | 88.974 ± 0.168 d | 19.430 ± 0.060 b | 2.455 ± 0.015 ab | 7.915 ± 0.024 ab |
| WW | 6.333 ± 0.058 a | 20.250 ± 0.750 de | 334.000 ± 2.000 a | 354.250 ± 2.750 a | 94.285 ± 0.167 a | 20.260 ± 0.360 a | 2.525 ± 0.005 ab | 8.024 ± 0.158 a |
| M | 6.033 ± 0.058 b | 23.250 ± 0.750 c | 256.000 ± 2.000 c | 279.250 ± 2.462 c | 91.675 ± 0.222 b | 18.775 ± 0.325 c | 2.330 ± 0.020 cd | 8.058 ± 0.070 a |
| WR | 5.633 ± 0.058 d | 31.250 ± 0.433 a | 217.333 ± 1.155 f | 248.583 ± 1.588 e | 87.429 ± 0.094 c | 19.405 ± 0.085 b | 2.405 ± 0.025 bc | 8.069 ± 0.119 a |
| p-value | ||||||||
| Fc | <0.001 | <0.001 | <0.001 | <0.001 | <0.001 | <0.001 | <0.001 | 0.046 |
| Su | <0.001 | <0.001 | <0.001 | <0.001 | 0.053 | <0.001 | 0.032 | <0.001 |
| Fc×Su | <0.001 | <0.001 | <0.001 | <0.001 | 0.001 | <0.001 | <0.001 | 0.023 |
| Variable | Fc | Deh | Cat | Pal | Pac | Aryl | Glu | Ure | GMea | pH | HAC | EBC | CEC | BS | Corg | Ntot | C:N | SLe | PNu | SNu | YDMSe | YDMLe | YDMSt | YDMSi |
|---|---|---|---|---|---|---|---|---|---|---|---|---|---|---|---|---|---|---|---|---|---|---|---|---|
| Fc | 1.000 | |||||||||||||||||||||||
| Deh | 0.350 | 1.000 | ||||||||||||||||||||||
| Cat | −0.438 | −0.065 | 1.000 | |||||||||||||||||||||
| Pal | 0.083 | −0.873 | 0.100 | 1.000 | ||||||||||||||||||||
| Pac | 0.609 | 0.940 | −0.340 | −0.738 | 1.000 | |||||||||||||||||||
| Aryl | −0.214 | 0.393 | −0.610 | −0.713 | 0.394 | 1.000 | 0.801 ÷ 1.00 | |||||||||||||||||
| Glu | −0.394 | 0.652 | 0.578 | −0.753 | 0.355 | 0.200 | 1.000 | 0.601 ÷ 0.800 | ||||||||||||||||
| Ure | 0.269 | −0.326 | 0.602 | 0.672 | −0.323 | −0.997 * | −0.174 | 1.000 | 0.401 ÷ 0.600 | |||||||||||||||
| GMea | 0.752 | 0.474 | 0.245 | 0.004 | 0.532 | −0.568 | 0.119 | 0.629 | 1.000 | 0.201 ÷ 0.400 | ||||||||||||||
| pH | −0.716 | −0.667 | 0.753 | 0.505 | −0.869 | −0.521 | 0.104 | 0.465 | −0.305 | 1.000 | 0.01 ÷ 0.200 | |||||||||||||
| HAC | 0.227 | 0.571 | −0.784 | −0.695 | 0.679 | 0.903 | 0.054 | −0.874 | −0.220 | −0.837 | 1.000 | –0.200 ÷ 0.00 | ||||||||||||
| EBC | −0.337 | −0.860 | 0.528 | 0.865 | −0.903 | −0.750 | −0.350 | 0.698 | −0.117 | 0.867 | −0.909 | 1.000 | −0.400 ÷ −0.201 | |||||||||||
| CEC | −0.346 | −0.883 | 0.494 | 0.874 | −0.918 | −0.726 | −0.379 | 0.671 | −0.153 | 0.861 | −0.889 | 0.999 * | 1.000 | −0.600 ÷ −0.401 | ||||||||||
| BS | −0.309 | −0.663 | 0.745 | 0.734 | −0.769 | −0.854 | −0.107 | 0.817 | 0.095 | 0.885 | −0.991 * | 0.952 | 0.937 | 1.000 | −0.800 ÷ −0.601 | |||||||||
| Corg | −0.331 | −0.964 * | −0.178 | 0.777 | −0.861 | −0.158 | −0.731 | 0.091 | −0.617 | 0.496 | −0.331 | 0.694 | 0.726 | 0.441 | 1.000 | −1.00 ÷ −0.801 | ||||||||
| Ntot | −0.542 | −0.913 | −0.133 | 0.614 | −0.875 | 0.010 | −0.559 | −0.083 | −0.787 | 0.552 | −0.254 | 0.625 | 0.659 | 0.377 | 0.967 * | 1.000 | ||||||||
| C:N | 0.911 | 0.094 | −0.120 | 0.393 | 0.314 | −0.597 | −0.438 | 0.639 | 0.840 | −0.364 | −0.196 | 0.054 | 0.038 | 0.111 | −0.173 | −0.420 | 1.000 | |||||||
| SLe | −0.859 | −0.654 | 0.649 | 0.380 | −0.873 | −0.295 | 0.146 | 0.232 | −0.518 | 0.969 * | −0.676 | 0.764 | 0.766 | 0.746 | 0.534 | 0.642 | −0.576 | 1.000 | ||||||
| PNu | −0.989 * | −0.208 | 0.470 | −0.218 | −0.492 | 0.263 | 0.523 | −0.310 | −0.695 | 0.657 | −0.168 | 0.230 | 0.234 | 0.238 | 0.186 | 0.413 | −0.927 | 0.803 | 1.000 | |||||
| SNu | 0.722 | 0.362 | 0.305 | 0.121 | 0.419 | −0.669 | 0.063 | 0.723 | 0.992 * | −0.202 | −0.335 | 0.011 | −0.025 | 0.215 | −0.526 | −0.708 | 0.859 | −0.429 | −0.679 | 1.000 | ||||
| YDMSe | −0.832 | −0.705 | 0.623 | 0.442 | −0.905 | −0.325 | 0.077 | 0.261 | −0.517 | 0.973 * | −0.696 | 0.802 | 0.804 | 0.769 | 0.586 | 0.680 | −0.538 | 0.997 * | 0.766 | −0.422 | 1.000 | |||
| YDMLe | −0.821 | 0.230 | 0.281 | −0.638 | −0.048 | 0.573 | 0.736 | −0.592 | −0.583 | 0.264 | 0.223 | −0.235 | −0.233 | −0.182 | −0.190 | 0.067 | −0.929 | 0.447 | 0.889 | −0.627 | 0.389 | 1.000 | ||
| YDMSt | −0.972 * | −0.486 | 0.567 | 0.113 | −0.742 | −0.016 | 0.315 | −0.043 | −0.659 | 0.859 | −0.445 | 0.540 | 0.544 | 0.522 | 0.416 | 0.589 | −0.790 | 0.954 * | 0.943 | −0.601 | 0.936 | 0.687 | 1.000 | |
| YDMSi | −0.914 | −0.334 | 0.761 | 0.041 | −0.635 | −0.152 | 0.495 | 0.106 | −0.441 | 0.880 | −0.547 | 0.526 | 0.518 | 0.593 | 0.208 | 0.372 | −0.693 | 0.931 | 0.912 | −0.385 | 0.903 | 0.683 | 0.962 * | 1.000 |
Disclaimer/Publisher’s Note: The statements, opinions and data contained in all publications are solely those of the individual author(s) and contributor(s) and not of MDPI and/or the editor(s). MDPI and/or the editor(s) disclaim responsibility for any injury to people or property resulting from any ideas, methods, instructions or products referred to in the content. |
© 2024 by the authors. Licensee MDPI, Basel, Switzerland. This article is an open access article distributed under the terms and conditions of the Creative Commons Attribution (CC BY) license (https://creativecommons.org/licenses/by/4.0/).
Share and Cite
Baćmaga, M.; Wyszkowska, J.; Kucharski, J. Influence of Forecrop on Soil Quality Estimated on the Basis of the Growth and Development of Faba Bean and Biochemical Properties of the Soil. Sustainability 2024, 16, 7492. https://doi.org/10.3390/su16177492
Baćmaga M, Wyszkowska J, Kucharski J. Influence of Forecrop on Soil Quality Estimated on the Basis of the Growth and Development of Faba Bean and Biochemical Properties of the Soil. Sustainability. 2024; 16(17):7492. https://doi.org/10.3390/su16177492
Chicago/Turabian StyleBaćmaga, Małgorzata, Jadwiga Wyszkowska, and Jan Kucharski. 2024. "Influence of Forecrop on Soil Quality Estimated on the Basis of the Growth and Development of Faba Bean and Biochemical Properties of the Soil" Sustainability 16, no. 17: 7492. https://doi.org/10.3390/su16177492
APA StyleBaćmaga, M., Wyszkowska, J., & Kucharski, J. (2024). Influence of Forecrop on Soil Quality Estimated on the Basis of the Growth and Development of Faba Bean and Biochemical Properties of the Soil. Sustainability, 16(17), 7492. https://doi.org/10.3390/su16177492