Abstract
With the deployment of cooperative intelligent transportation systems (C-ITSs), the telecommunication systems and their performance occupy a key position in ensuring safe, robust, and resilient services to the end-users. Regardless of the adopted protocol, adequate road network coverage might affect the service performance, in terms of traffic and environmental efficiency. In this study, we analyze the traffic efficiency and emission pollutant sensitivity to the location of ad hoc network antennas when the C-ITS services disseminate dynamic messages to control the speed limit and ensure sustainable mobility. We design the experimentation with short-range communication resulting from an ad hoc network and requiring Roadside Units (RSUs) along the road to broadcast messages within their communication range to the end-user. The performance variability according to the RSUs’ location and effective road network coverage are highlighted through our microscopic simulation-based experimentations. This paper develops a sensitivity analysis to evaluate the impact of the network mesh according to the C-ITS service under consideration. Focus is placed on the variable speed limit (VSL) service, controlling upstream speed to restrict congestion and ensure more sustainable mobility. The results show that, while the traffic efficiency improves even at a low market penetration rate (MPR) of the connected vehicles, the environmental efficiency improves only at a high MPR. From the telecommunication perspective, an expansive broadcast strategy appears to be more effective than the conservative approach.
1. Introduction
Traffic congestion on the road network tends to strongly reduce vehicle throughput when it propagates over time and space, which is followed by a high level of fuel consumption and air pollution. This remains a recurring challenge for researchers and traffic engineers. To cope with these issues, various dynamic control methods on freeways are being studied and operated. A variable speed limit (VSL) is one of the most popular strategies implemented by road managers on motorways experiencing traffic jams due to (i) recurrent bottlenecks (also known as head-fixed bottlenecks) and/or (ii) shock waves. The concept of a VSL lies in the application of upstream speed restrictions in order to artificially reduce downstream throughput and dampen the congestion waves, or to homogenize traffic by reducing the speed differences between cars.
In the literature, a distinction is made between the approaches supporting VSL systems: reactive approaches, i.e., based on knowledge-driven thresholds to trigger the control, versus proactive approaches, i.e., based on an estimation of the traffic states’ propagation. The earliest VSL systems were reactive ones and showed their efficiency in speed homogenization, traffic stabilization, and therefore, traffic safety by reducing the speed differences between the drivers [1,2,3]. However, as the system only reacts to current traffic conditions and the occurrence of breakdowns, the activation delay negatively affects the global efficiency of the VSL strategy. In this context, proactive VSL systems have been developed to anticipate future traffic conditions (instead of reacting to them) and rely on estimating the propagation of traffic states on the road network [4]. The traffic state estimation is performed by various models, while the most popular one is Model Predictive Control (MPC) [5]. More recently, to remove the underlying assumptions of model-based approaches, some alternative methods benefiting from Artificial Intelligence (AI) are emerging. In particular, these approaches apply Reinforcement Learning (RL) [6,7]. Their use is recommended to formulate some original activation policy for speed reduction. It can be observed that the majority of the studies related to the deployment of a variable speed limit (VSL) have been focused on the development of the algorithm and investigating its effectiveness (e.g., [4,8,9,10,11]). In more recent works, there have been efforts to optimize ramp flows and prove the impact of a VSL on the main traffic by reducing exhaust emissions [12] and energy consumption [13].
A different approach is adopted in this study, where an attempt has been made to compare the impacts of a particular VSL algorithm on traffic and environmental efficiency with different deployment protocols: through traditional variable message signs (VMSs), where all drivers are notified about the speed limit, and through deploying a particular cooperative ITS (C-ITS) service to notify only the drivers of connected vehicles using in-vehicle signage (IVS). The exploration of these dimensions was completed from the perspective of analyzing the impact of the C-ITS antennas (also known as Roadside Units (RSUs)) on service performance. Existing works on C-ITS applications for VSL implementation have focused more on developing or augmenting the VSL algorithms or using Vehicle-to-Infrastructure (V2I) communication for improved traffic state estimations. For example, Kattan et al. [5] use information collected from connected vehicles in addition to those from loop detectors to estimate traffic states. Grumert et al. [14] propose not only collecting data from the connected vehicles (in addition to the loop detectors), but delivering control and imposing speed limits thanks to Roadside Units (RSUs) and V2I communication.
However, only a few studies have been conducted with a focus on the telecommunication network. For example, the work in [15] focuses on developing and optimizing a vehicular ad hoc network (VANET) to send accident alerts and speed advice to the vehicles to smooth the traffic flow. Ref. [16] provides a direct quantitative comparison of different Vehicle-to-Infrastructure (V2I) communications systems to show their scaling behavior with the number of users and the geographical coverage. Ref. [17] performs an assessment based on simulations of realistic road networks and traffic intensity, of the effectiveness of the telecommunication network in improving the travel time and safety-relevant events of emergency vehicles. The assessment considered different constraints of telecommunications. Ref. [18] evaluates the performance of V2I systems from the perspective of different measures, such as running time, data rate, and resource management. Refs. [19,20] attempt to optimize the performance of VANETs for different traffic situations to improve the quality of video streaming services for infotainment and safety applications. From another perspective, there have been several attempts (e.g., [21,22]) to optimize and reduce the energy use of the telecommunication networks for various traffic scenarios. As can be observed, the major focus has been on optimizing the telecommunication networks to reduce latency, the packet loss rate, signal loss, energy use, etc., with limited emphasis on the impact of coverage on the overall traffic and environmental performances. The same has been emphasized in several articles, e.g., [23,24], which stress, among other aspects, the need for further research on the positioning, latency, and signal loss related to the telecommunication infrastructure with a focus on 5G communication.
This present study aims to explore the coverage impacts of the telecommunication network specifically from the perspectives of road managers in terms of traffic and environmental efficiency. Therefore, the following key research questions were identified for the particular use case under study:
- How do the traffic efficiency and environmental impacts evolve according to the dissemination technology: C-ITS service versus variable message sign?
- What is the impact of the market penetration rate of C-ITS services?
- What is the impact of RSU coverage in disseminating speed limit instructions to the connected drivers?
The key performance indicators (KPIs) that were selected to address the research questions include the following:
- The average speed by road section and time period: This enables characterizing the impact on the global flow and highlighting the effect of the C-ITS service when the penetration rates vary. It is captured by intrusive sensors, such as loop sensors;
- The pollutant emissions indicators, and emissions, which could be directly measured on equipped vehicles or assessed by simulation tools.
Some recent studies (e.g., [25,26]) have also highlighted the effect of the distribution of CVs in the traffic stream. While the present study considers a uniform distribution of CVs in the traffic stream, it will be interesting to investigate the effectiveness of the VSL algorithm for different CV distributions.
The remainder of this paper is organized as follows. The full methodology is introduced in Section 2. This includes (i) the calibration process of the microscopic simulation environment with a validation on the variable speed limit dynamics and (ii) details about the experimental design with two alternative strategies to broadcast C-ITS messages and deliver traffic control. Section 3 focuses on the experimental results and analysis, while Section 4 concludes the paper with recommendations.
2. Methodology
The methodology involves the application of a calibrated Traffic Micro-simulation Model (TMM) to compare the performance in terms of traffic and environmental efficiency for three different scenarios:
- (a)
- Baseline, i.e., without the application of any variable speed limit (VSL);
- (b)
- Application of the VSL to all vehicles using variable message signs (VMSs);
- (c)
- Application of the VSL only to connected vehicles using in-vehicle signage (IVS).
The adopted methodology involves several key steps described as follows.
2.1. Calibration for a Highway Environment
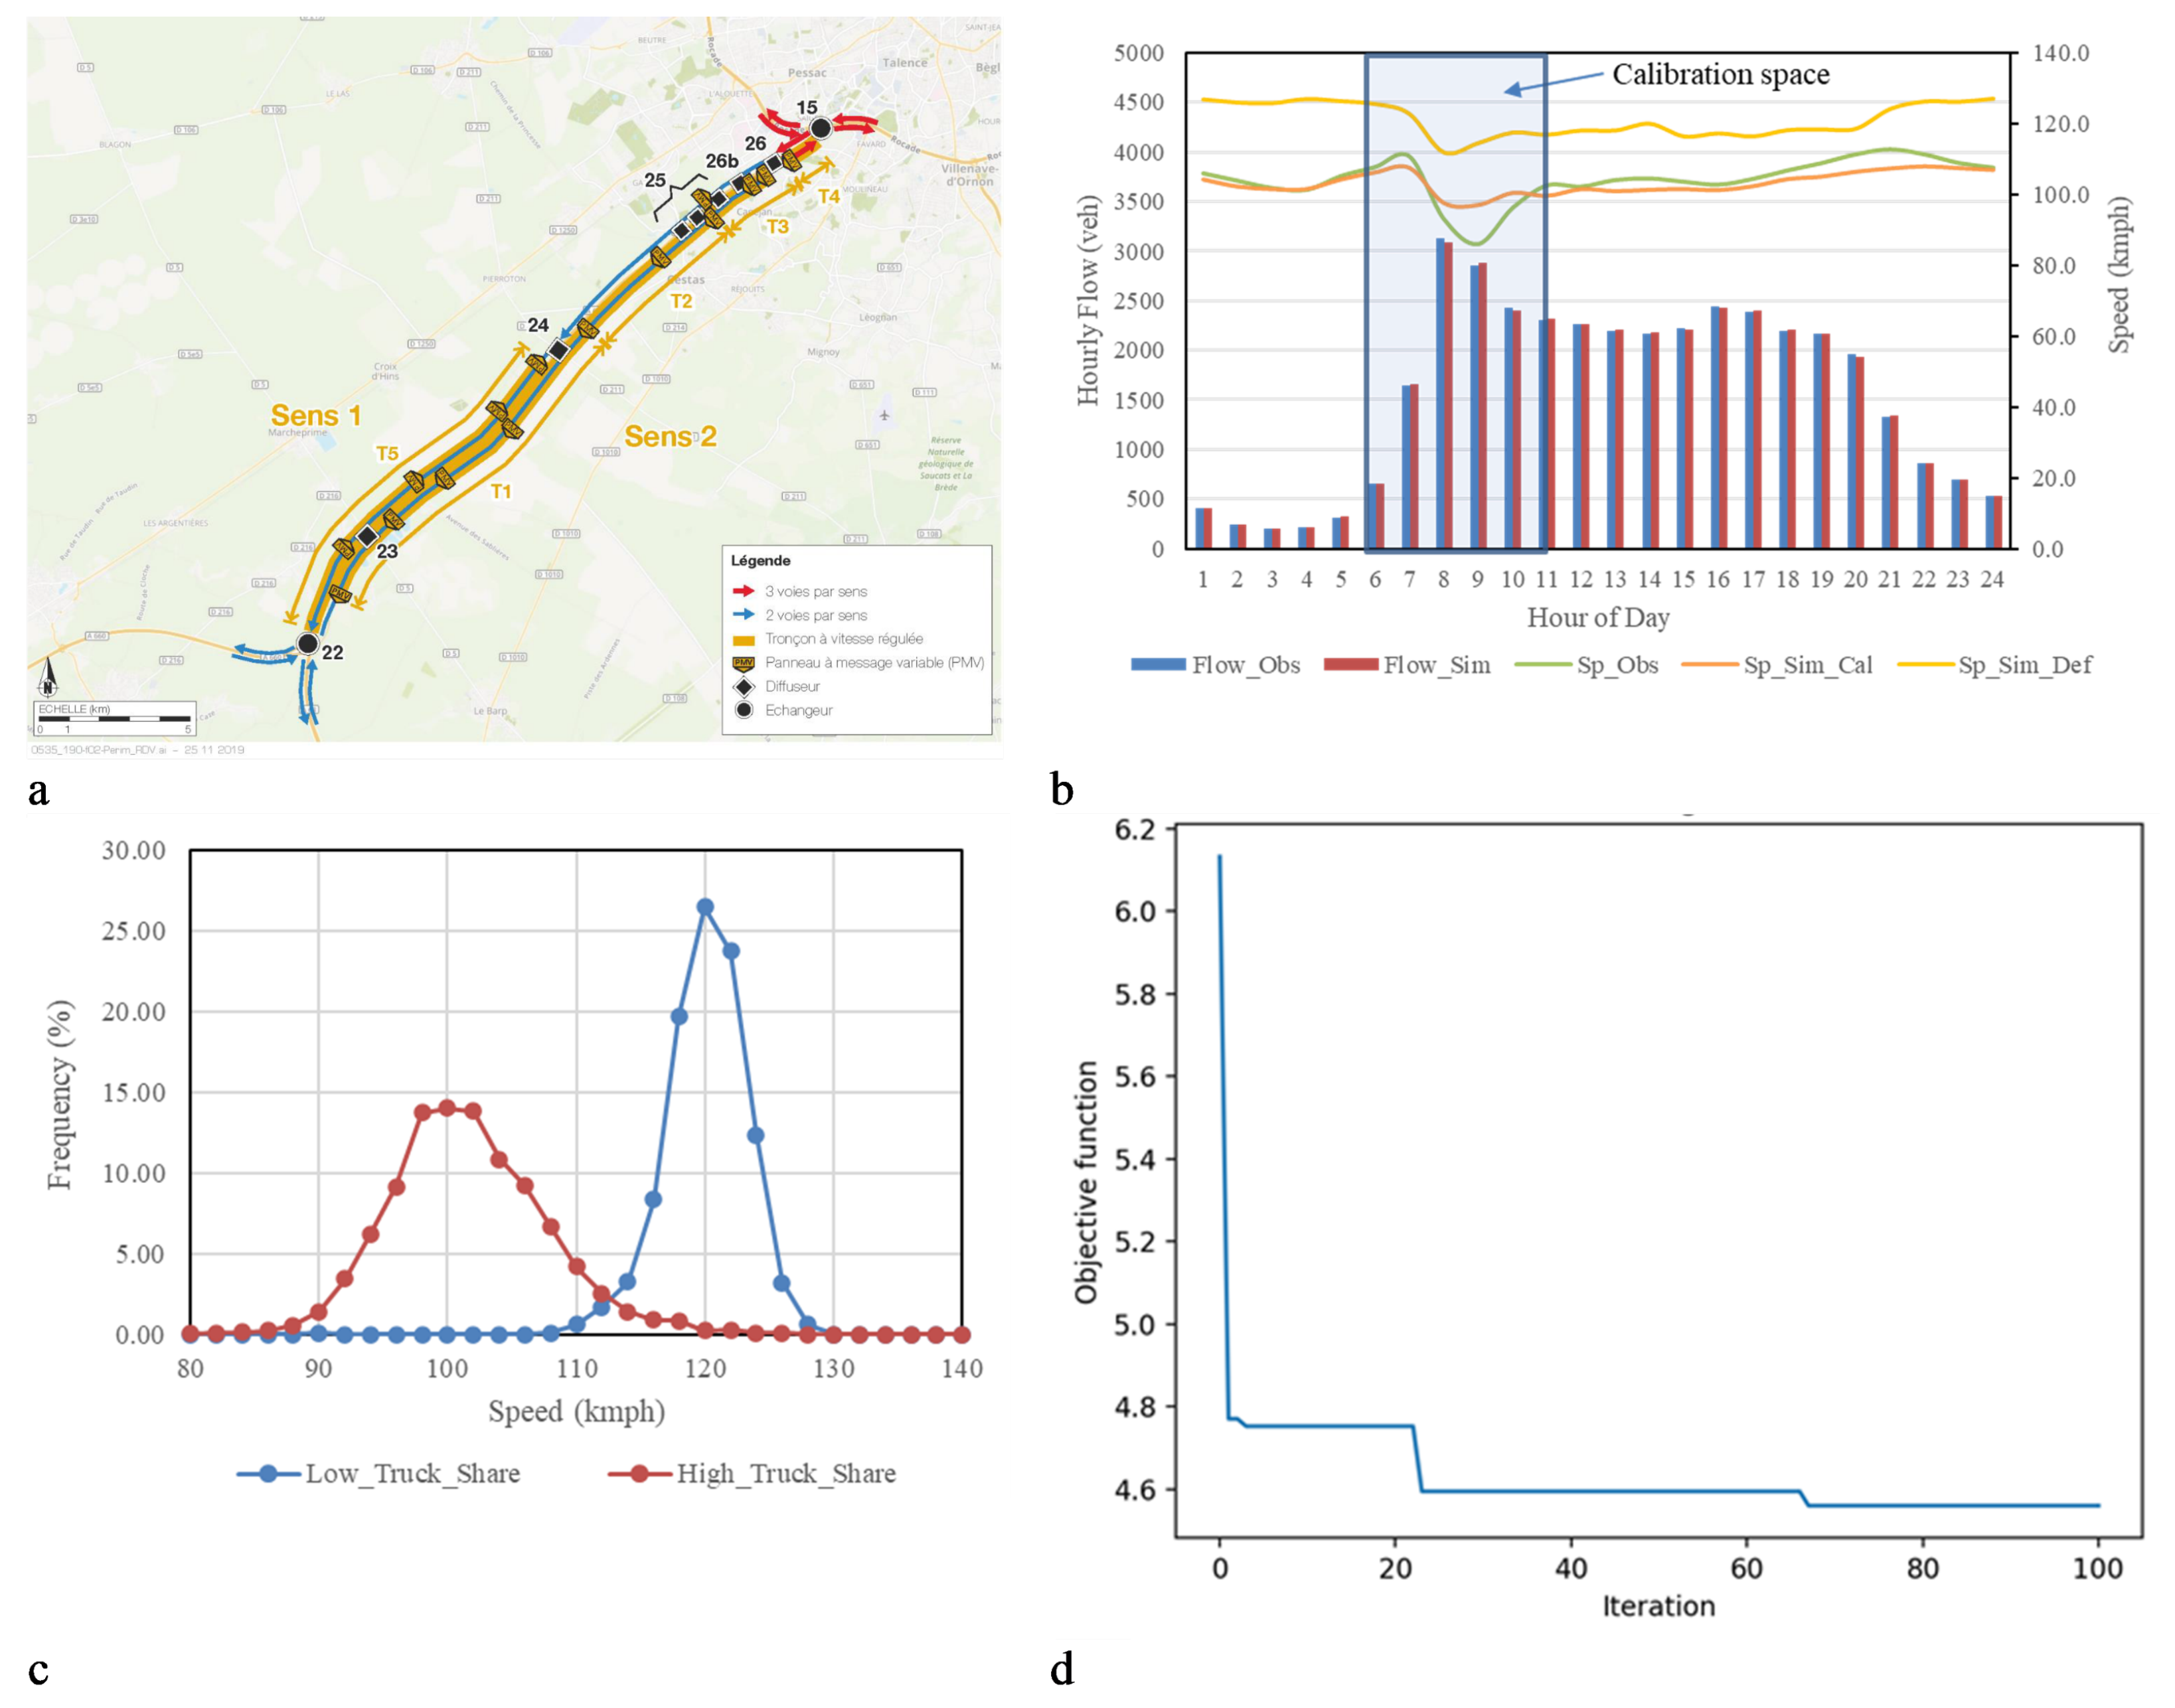
This is the pre-evaluation step, which involves the calibration of a TMM, SUMO [27], for replicating a highway environment. In order to calibrate the model, the loop detector information for a section of the A63 motorway near the city of Bordeaux, France (Figure 1a), was obtained. The loop detectors provided the speed and flow values, aggregated over a period of 6 min. Some typical weekdays were identified as having no traffic incidents, no inclement weather, which may cause traffic disruptions, and no unusual variations in traffic. The flow () and speed () values were recorded and averaged over a 24-h period (Figure 1b). Since the available loop detector data revealed only aggregated speeds, no information was available for individual car and truck speeds. Therefore, to estimate the same, an effort was made to observe the speeds during low-flow conditions and with variable hourly shares of trucks in the traffic stream during a typical weekday. The free-flow speed distributions during the lean traffic hours with respect to the low and high share of trucks (Figure 1c) in the traffic stream revealed statistically significant differences. With low shares of trucks, the mean speed was observed to be around 120 kmph, while with high shares of trucks, the same was around 100 kmph. Accordingly, these two vehicle categories were included in the simulation model, and initially, simulation runs were conducted with default parameter values, as suggested for cars and trucks. However, a comparison of the simulated () and observed () speed distributions revealed statistically significant variations with the Scatter Index (SI) being higher than 20%. This established the need for calibration, and we performed a Latin Hypercube-Sampling (LHS)-based experiment ([28]) to identify the most sensitive car-following parameters of the Krauss model ([27]). Accordingly, we obtained 6 parameters for the vehicle class car (viz., , , , , , ) and 4 parameters for the vehicle class truck (viz., , , , ), which were selected for optimization.

Figure 1.
Description of study area and simulation model calibration: (a) selected section of A63 motorway; (b) 24-h speed and flow data for a typical weekday; (c) free-flow speed distributions for different shares of trucks; (d) convergence plot of GA operation.
The Genetic Algorithm (GA) has been widely and effectively applied by researchers as a heuristic optimization tool for parameter optimization and calibration of TMMs (e.g., [29,30,31]). Therefore, we adopted a GA-based optimization of the selected parameters with the RMSE value of speed as the fitness function. After several initial iterations, the GA parameters were selected as follows:
- Number of iterations: 100;
- Population size: 50;
- Selection procedure: Tournament selection;
- Crossover probability: 0.5 (uniform crossover);
- Mutation probability: 0.1 (Random mutation).
As can be observed from Figure 1d, the convergence of the Genetic Algorithm (GA) was achieved with the objective function stabilizing at a constant value between the 60th and 100th iterations. Within this range, the quality of the solution remained consistent. This shows that the optimal solution has been achieved by the 60th iteration. The optimal values of the parameters after performing the calibration vis-à-vis the default values are illustrated in Table 1. The calibration was performed during 6 h around the morning peak period, and the model was validated for all 24 h of traffic; in both cases, the RMSE of simulated speed () with respect to was less than 5%, which revealed a successful calibration of the simulation model for motorway traffic operations.

Table 1.
Default and calibrated values of selected parameters.
The pollutant emissions result from the co-simulation framework combining SUMO (microscopic simulation tool) with the Passenger Car and Heavy Duty Emission Model (PHEM Light). PHEM [32] is an instantaneous vehicle emission model. Since the COLOMBO project, SUMO has embedded a light version of this model, enabling it to mimic instantaneous pollutant emissions for many vehicles in European cities. In this study, the vehicles were modeled by two average vehicle profiles depicting the average French vehicle fleet: one profile for Passenger cars (PHEMlight/PC-G-EU4) and one profile for Heavy-Duty Vehicles (PHEMlight/HDV-G-EU4). Such a simplified modeling facilitates comparisons between scenarios.
2.2. Validation for VSL Application
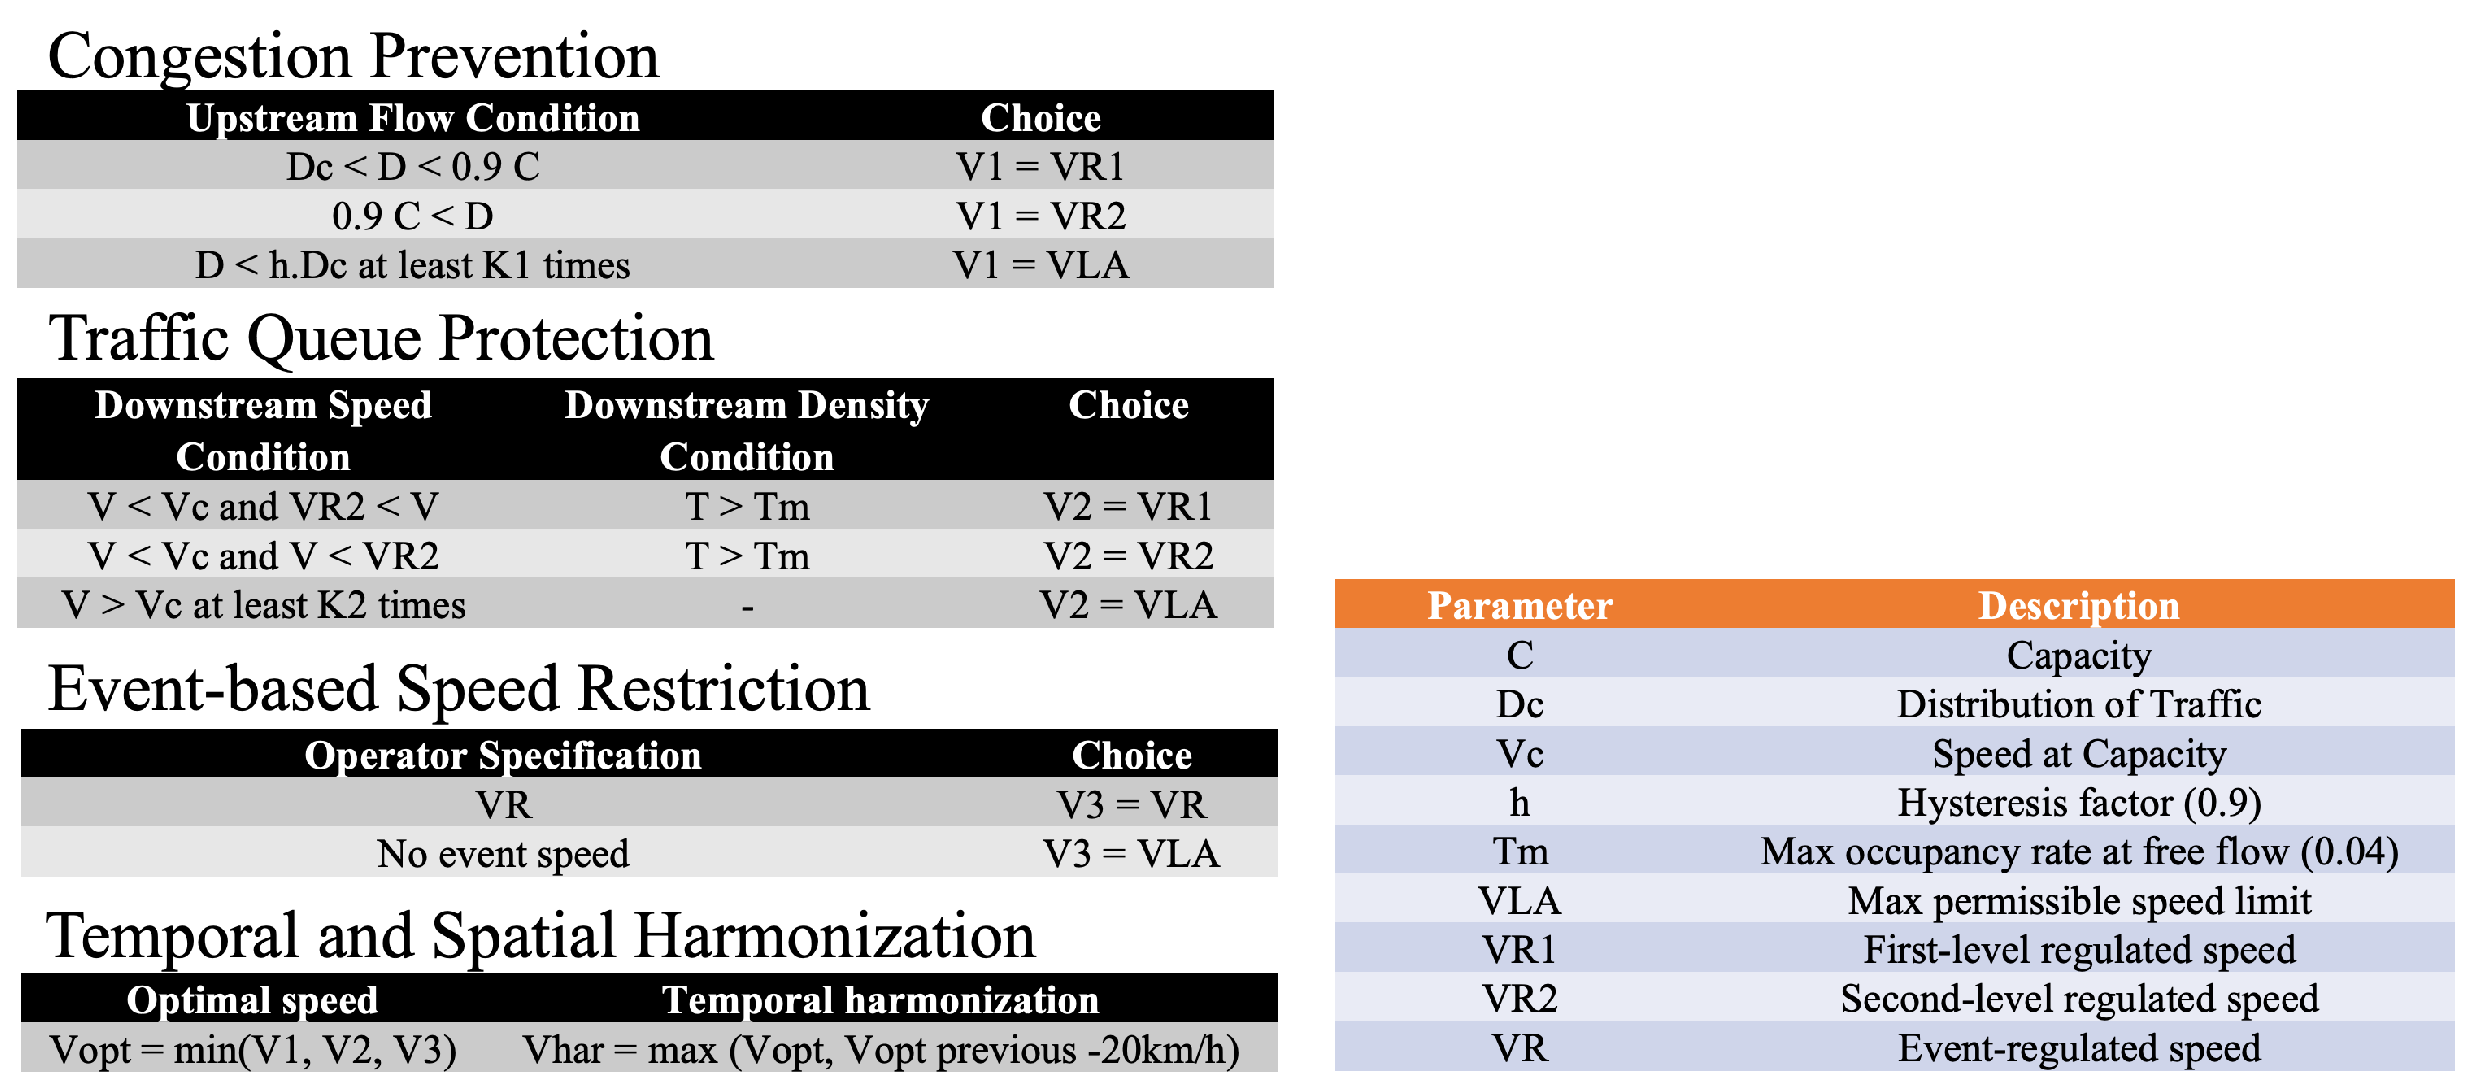
In the next step, it will be important to validate the performance of the calibrated TMM with a VSL algorithm application that has already been implemented in the field using VMSs for non-connected drivers. The VSL algorithm is detailed in the report [33], while the supporting hypothesis and the calibration process were developed in the works performed by Duret [34]. The VSL control is implemented on any section of the main road (i.e., except on-ramps/off-ramps), and it consists of four stages, as mentioned below and demonstrated in Figure 2:
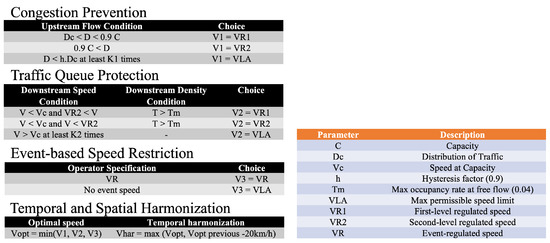
Figure 2.
Variable speed limit algorithm implemented on the A63 Highway near Bordeaux.
- Congestion prevention: The congestion prevention algorithm uses the upstream loop sensor data to regulate the flow rate by reducing speed.
- Traffic queue protection: The traffic queue protection algorithm uses the downstream loop sensor data to assess the downstream speed and reduce the speed upstream, if necessary.
- Event-based speed restriction: An “event” speed can be specified by the operator for each section. This speed is then the maximum speed that can be proposed by the system for this section, the spatial harmonization remaining applicable. The following are the cases of use of this feature: (a) the presence of an accident requiring a speed reduction upstream; (b) a construction site in an area requiring a temporary reduction of the authorized speed limit.
- Temporal and spatial harmonization: The optimal speed for a section is the minimum speed among the recommended speeds V1, V2, and V3 for the different elementary algorithms. The decrease of the regulated speed on a section can only be a maximum of −20 kmph. This constraint is called temporal harmonization. Also, the reduction of the regulated speed on successive sections in the direction of traffic can only be a maximum of −20 kmph. This constraint is called spatial harmonization.
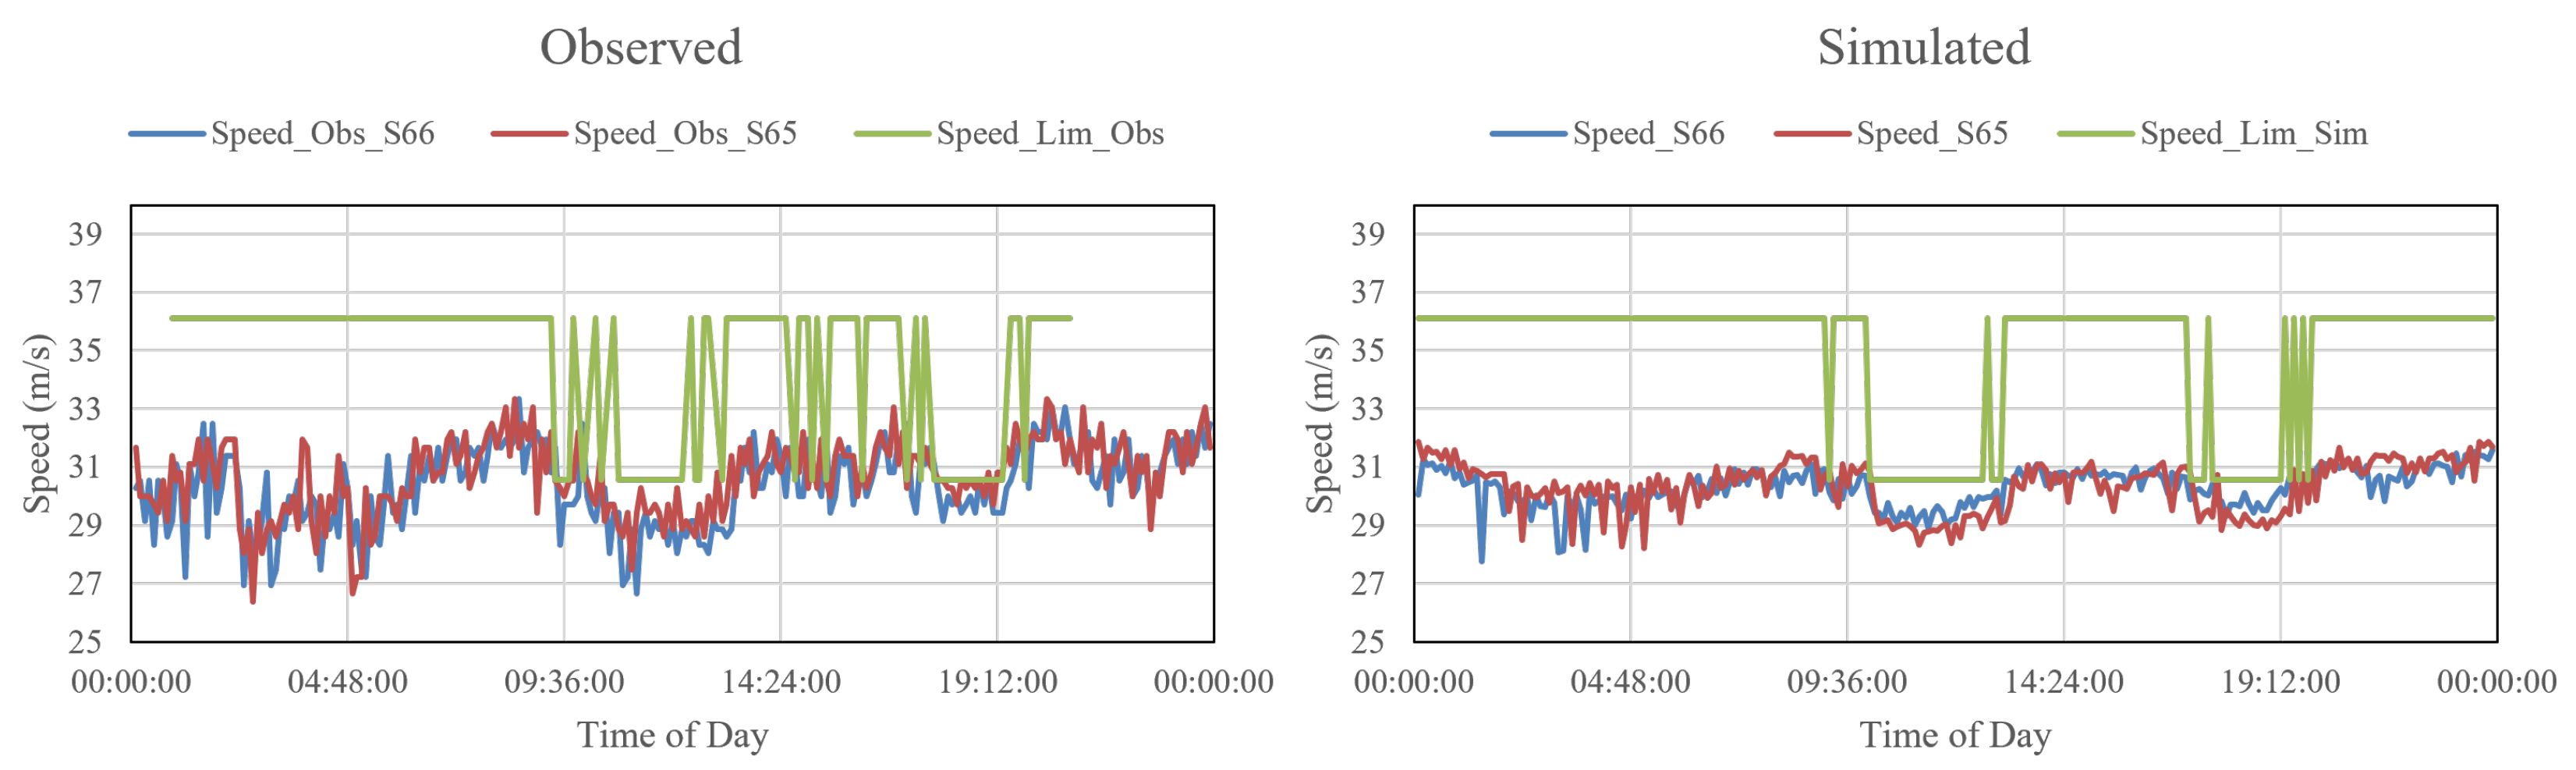
The same algorithm was implemented in the TMM to provide VMS-based advice to the vehicles. In order to implement VMSs in the simulation, a communication layer was set up through a TCP-based client/server architecture, called the Traffic Control Interface (TraCI), which allowed coupling between the traffic model and a python script. Vehicle-state information can be extracted at each time step from SUMO through the help of TraCI, and new instructions can be provided based on different VSL logics to alter the current vehicle state within the same time step. Subsequently, the speed characteristics and the VSL activations were recorded from the simulation and compared with the observed values from the field for different sections (T1 and T5) of the highway (Figure 1a) and for different days of the week (Saturday and Thursday). An example of the comparison between the observed and simulated results is demonstrated in Figure 3. It may be observed that speed restrictions are triggered at the same time during the simulation, and in all cases, the Scatter Index values of the simulated speed outputs from the observed speeds was less than 10%. This establishes the successful application of the VSL algorithm in the simulation using TraCI and validates the performance of the simulation model.

Figure 3.
Observed and simulated speeds and speed limits of test section.
In this simulation, two parameters might affect the macroscopic driving behavior under the application of variable speed limits: the average distance of acceptance and the response delay for acceptance. The acceptance delay of the speed instruction displayed by VMSs is directly implemented within the features of the vehicle (i.e., reaction delay of the driver) and results from the calibration (see Section 2.1). In terms of traffic modeling, the impact of the average distance of acceptance is equivalent to sliding downstream or upstream of the VMS. It is like sliding the longitudinal x-axis along a specific distance, which has little effect on the final results. Nevertheless, to be compliant with the ergonomy study developed by Smiley et al. [35], it was assumed that the VMSs are readable around 153.6 m upstream of the effective location of the VMS (i.e., 4.25 s before reaching the VMS with a speed of 130 kmph), while the reading/reaction time was set on average to 1 s and the response time to 5 s (up to 8 s according to the required maneuver—lane changing for instance). Then, the effective distance of acceptance is really close to the effective position of the VMS and set to 63 m downstream of the VMS (between 63 m and 171 m with a speed of 130 kmph).
To further refine the analysis and to assess a range for the driver’s acceptance rate using VMS technology, a scenario was evaluated with a gradual reduction of the driver’s acceptance rate (from 100% to 0%). The two-field objective was the following: (i) evaluating if the simulator could reach better performance results to reproduce field observations (i.e., could be refined), when the acceptance rate is lower, and (ii) identifying the maximum acceptance rate before reaching significant differences in terms of performance (on macroscopic traffic indicators). It resulted from the analysis that no distinction can be made in terms of performance (i.e., average speed profile) for acceptance rates between 100% and 60%. When the acceptance rate was lower than 60%, the Scatter Index (SI) became higher than 5% and the ability of the model to replicate the field observations decreased. As a consequence, since the traffic model was calibrated without VSL and does not require re-calibration when VSL is activated, this means that the driver’s acceptance rate for VMSs is in the range [60%; 100%]. This implies that no further effect on traffic efficiency is expected when the driver’s acceptance rate is higher than 60%. The results are illustrated by Figure 4.
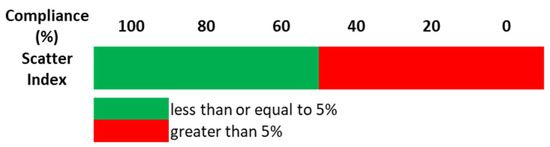
Figure 4.
Evolution of the replicability performance of the model according to a gradual reduction of the driver’s acceptance rate of the VMS.
2.3. Design of the Experiment
Since both are driven by human beings, no distinction has been made between the driving behavior of connected and non-connected vehicles in terms of the car-following and lane-changing models. The only difference results from the disposal of further information: while the drivers of unequipped vehicles can only rely on variable message signs (if available) to obtain speed instructions, equipped vehicles receive the information directly from RSUs (with ITSG5 technology) or Traffic Management Systems (TMS) (with 4G technology). Additionally, based on the findings from a different use-case [36], a response time component, following , was incorporated for the drivers of connected vehicles. Moreover, due to a lack of necessary information from the field, the driver was assumed to be fully compliant with the speed instruction, irrespective of the means of communication (i.e., VMS or IVS).
Figure 5 illustrates the different factors that have been taken into account while designing the experiment. These include the following:
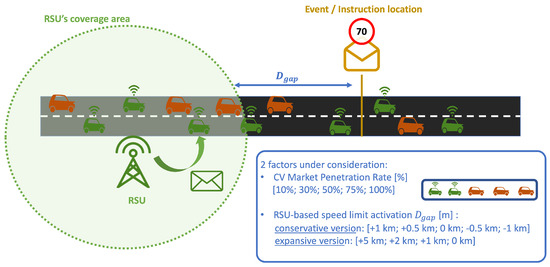
Figure 5.
Design of the experiment.
- Market penetration rate of connected vehicles;
- Distance gap between the effective location to apply the instruction (event location) and the coverage of the RSU, featuring its border. A distance gap of 500 m upstream means that the RSU coverage area ended 500 m upstream of the event to report and warn the connected vehicle users. The underlying objective of this factor is to highlight the impact of gaps or discontinuities in the road network coverage by the RSUs. With the existence of , two possible configurations can be assumed:
- –
- Conservative broadcast process for RSU: This assumes that the only C-ITS instructions that an RSU can broadcast are the ones about an event located within the range of the RSU’s coverage area [37]. Consequently, when gaps occur in the coverage of the road network, some messages cannot be delivered at the exact and expected location, but only upstream or downstream. This results in spatial inaccuracies to apply management strategies. The delivery location of the message is based on the coverage of the RSU such that the speed limit information is provided exactly at the same location as where the VMS is presently operational or at different locations upstream or downstream of the VMS.
- –
- Expansive broadcast process for the RSU: This assumes that an RSU can broadcast a C-ITS instruction about any event located downstream of its coverage area. As a consequence, the RSU delivers the last up-to-date message to the connected drivers, when it leaves the RSU’s coverage area, but some changes in the message (activation of the speed limit, etc.) might occur in the meantime. Then, some temporal delays could be expected and observed while implementing the C-ITS instructions. In this context, it is assumed that RSUs can deliver messages about events out of the range of their own coverage area. Due to spatial gaps between the RSUs’ coverage areas, some delays or obsolete information might occur. For instance, with an RSU is located upstream of the effective location of the VMS and the event, the last updated message delivered by the RSU at the border of the RSU’s coverage area might be outdated, when the vehicle reaches the event. This might result in a connected vehicle not applying the current and effective instruction (or, less likely, applying an obsolete instruction, if the message does not have an expiry date).
The various levels related to each factor are as follows:
- CV market penetration rate: 10%, 30%, 50%, 75%, and 100%.
- Distance gap :
- –
- Conservative version: RSU-based speed limit activation: 0 km, 0.5 km upstream, 1.0 km upstream, 0.5 km downstream, and 1 km downstream of the presently located VMS.
- –
- Expansive version: RSU-based speed limit activation: +5 km, +2 km, +1 km, and 0 km.
A fully factorial design was adopted to cover each possible combination of different levels of market penetrations and RSU coverage, and simulation runs were performed for each scenario to obtain the selected KPIs. The findings and corresponding recommendations are summarized in the following subsection.
3. Experimentation Results and Analysis
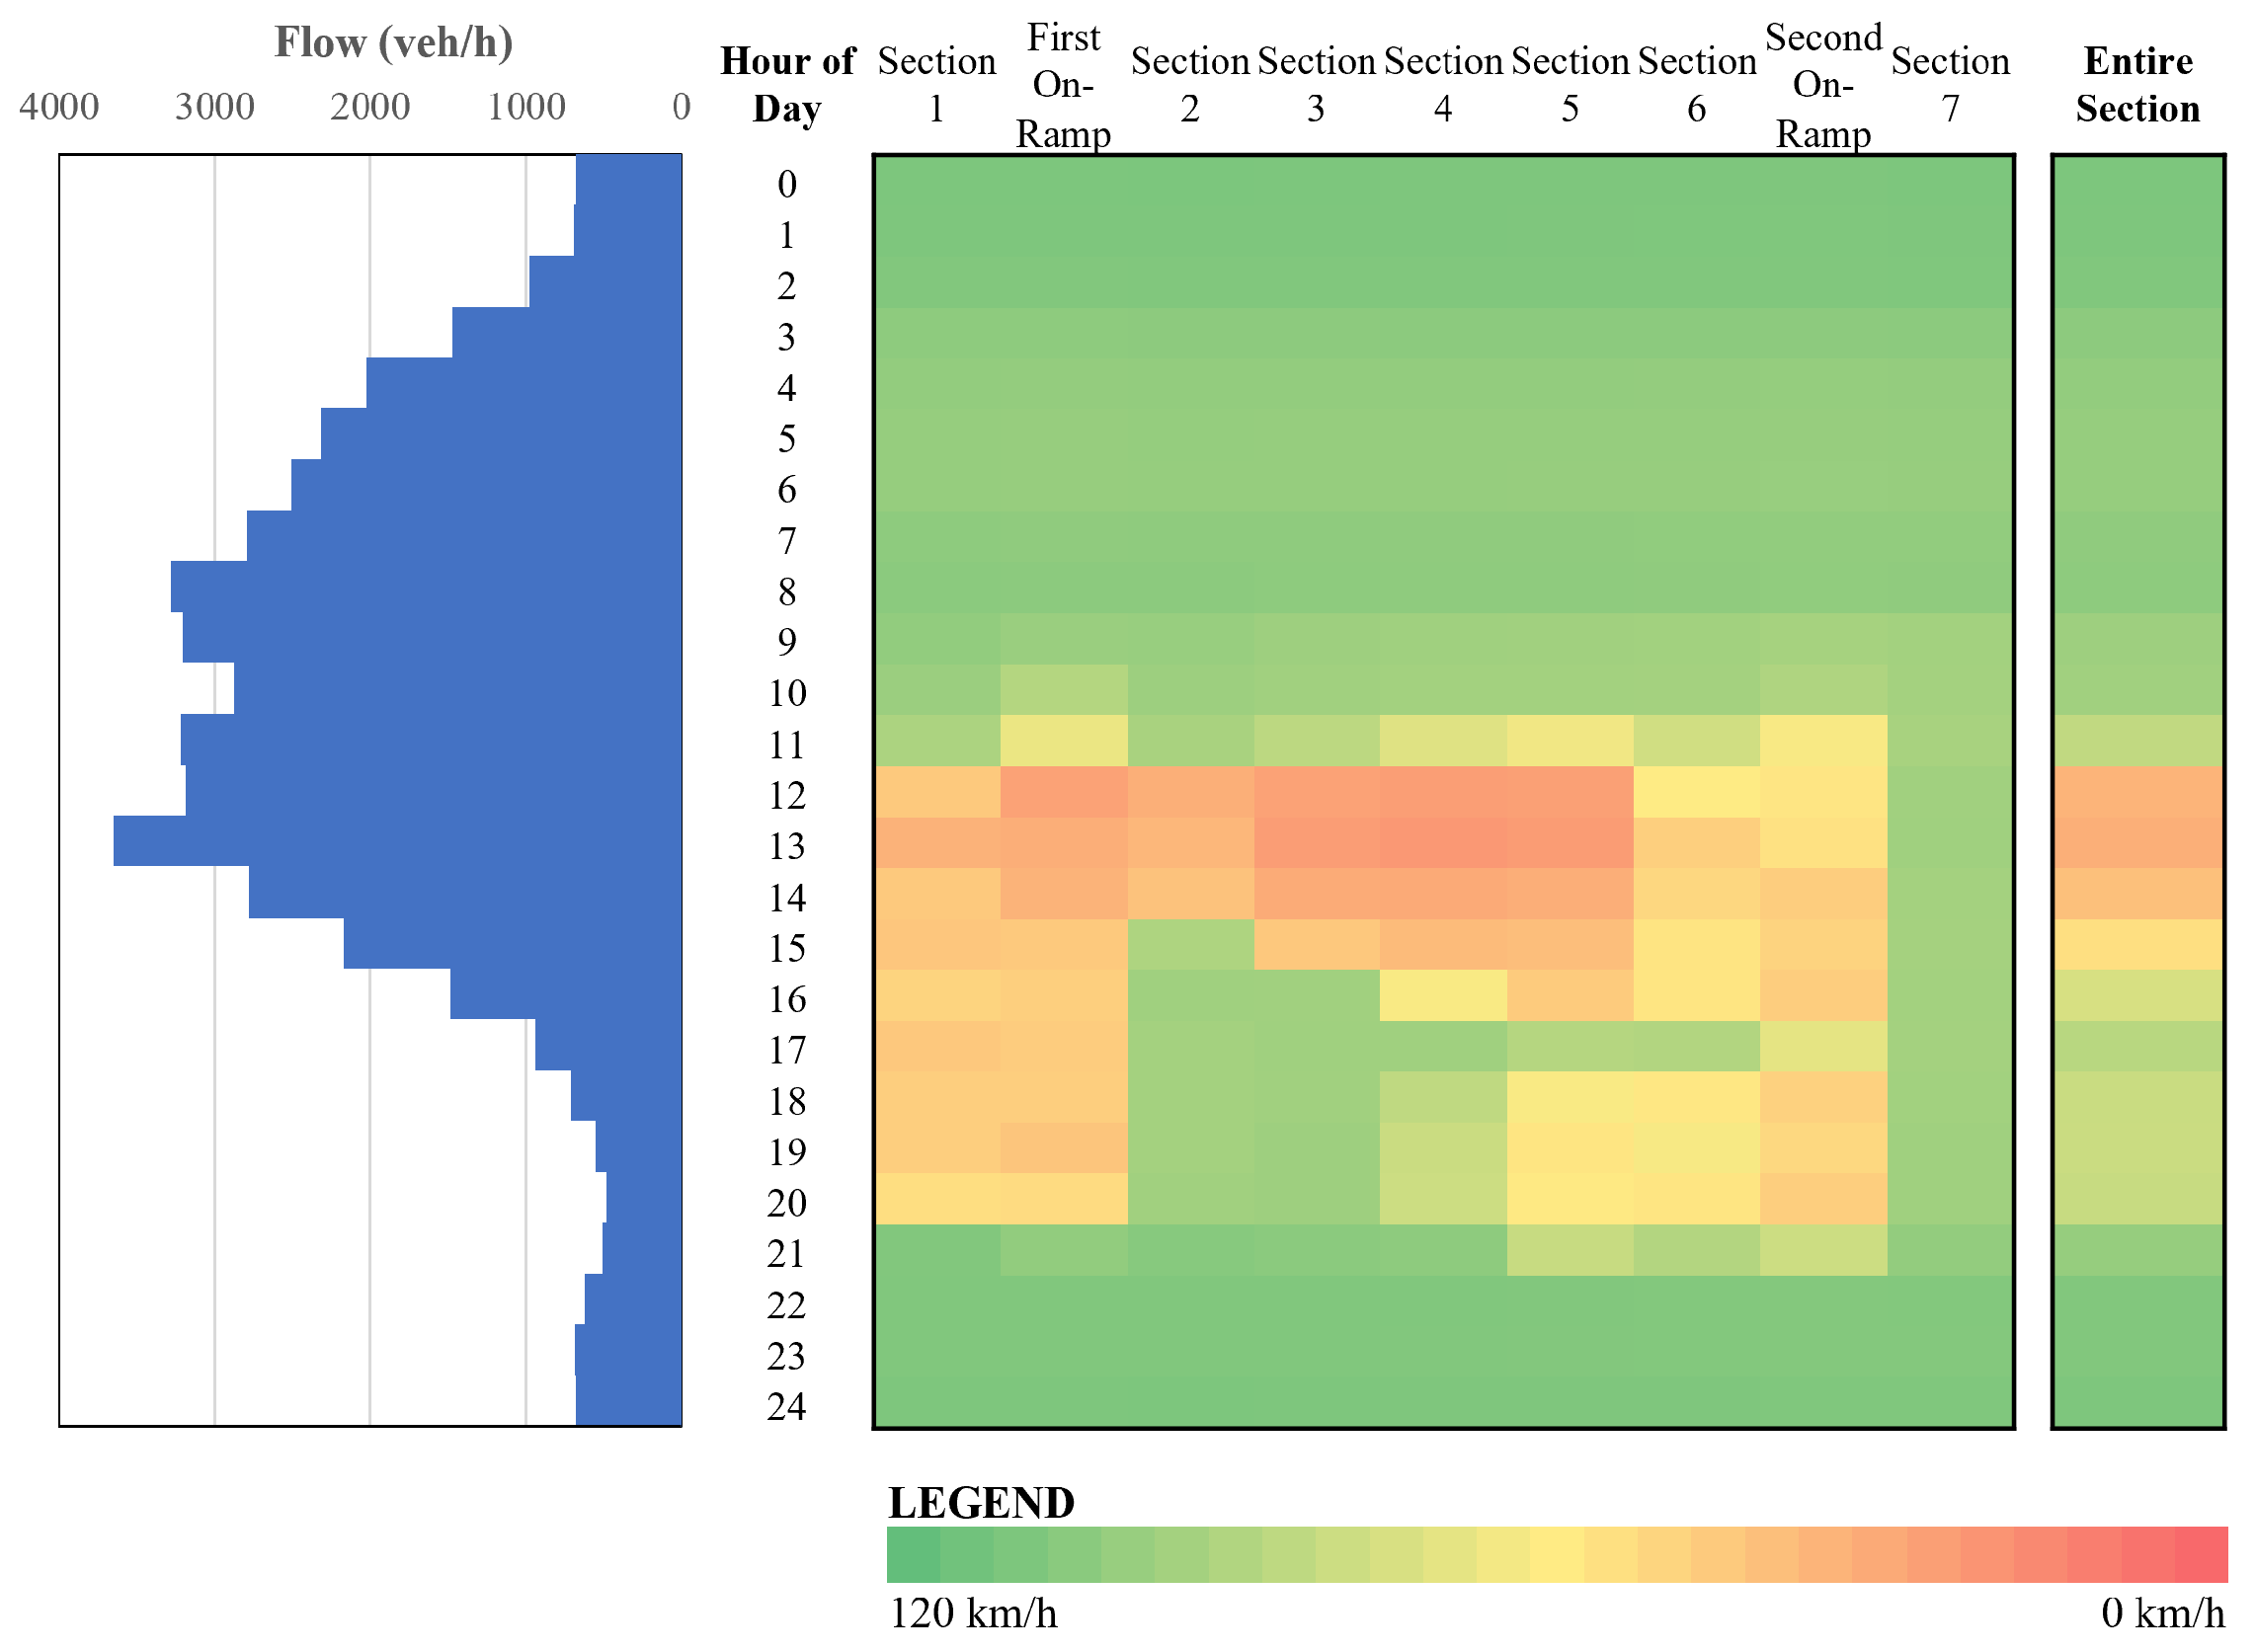
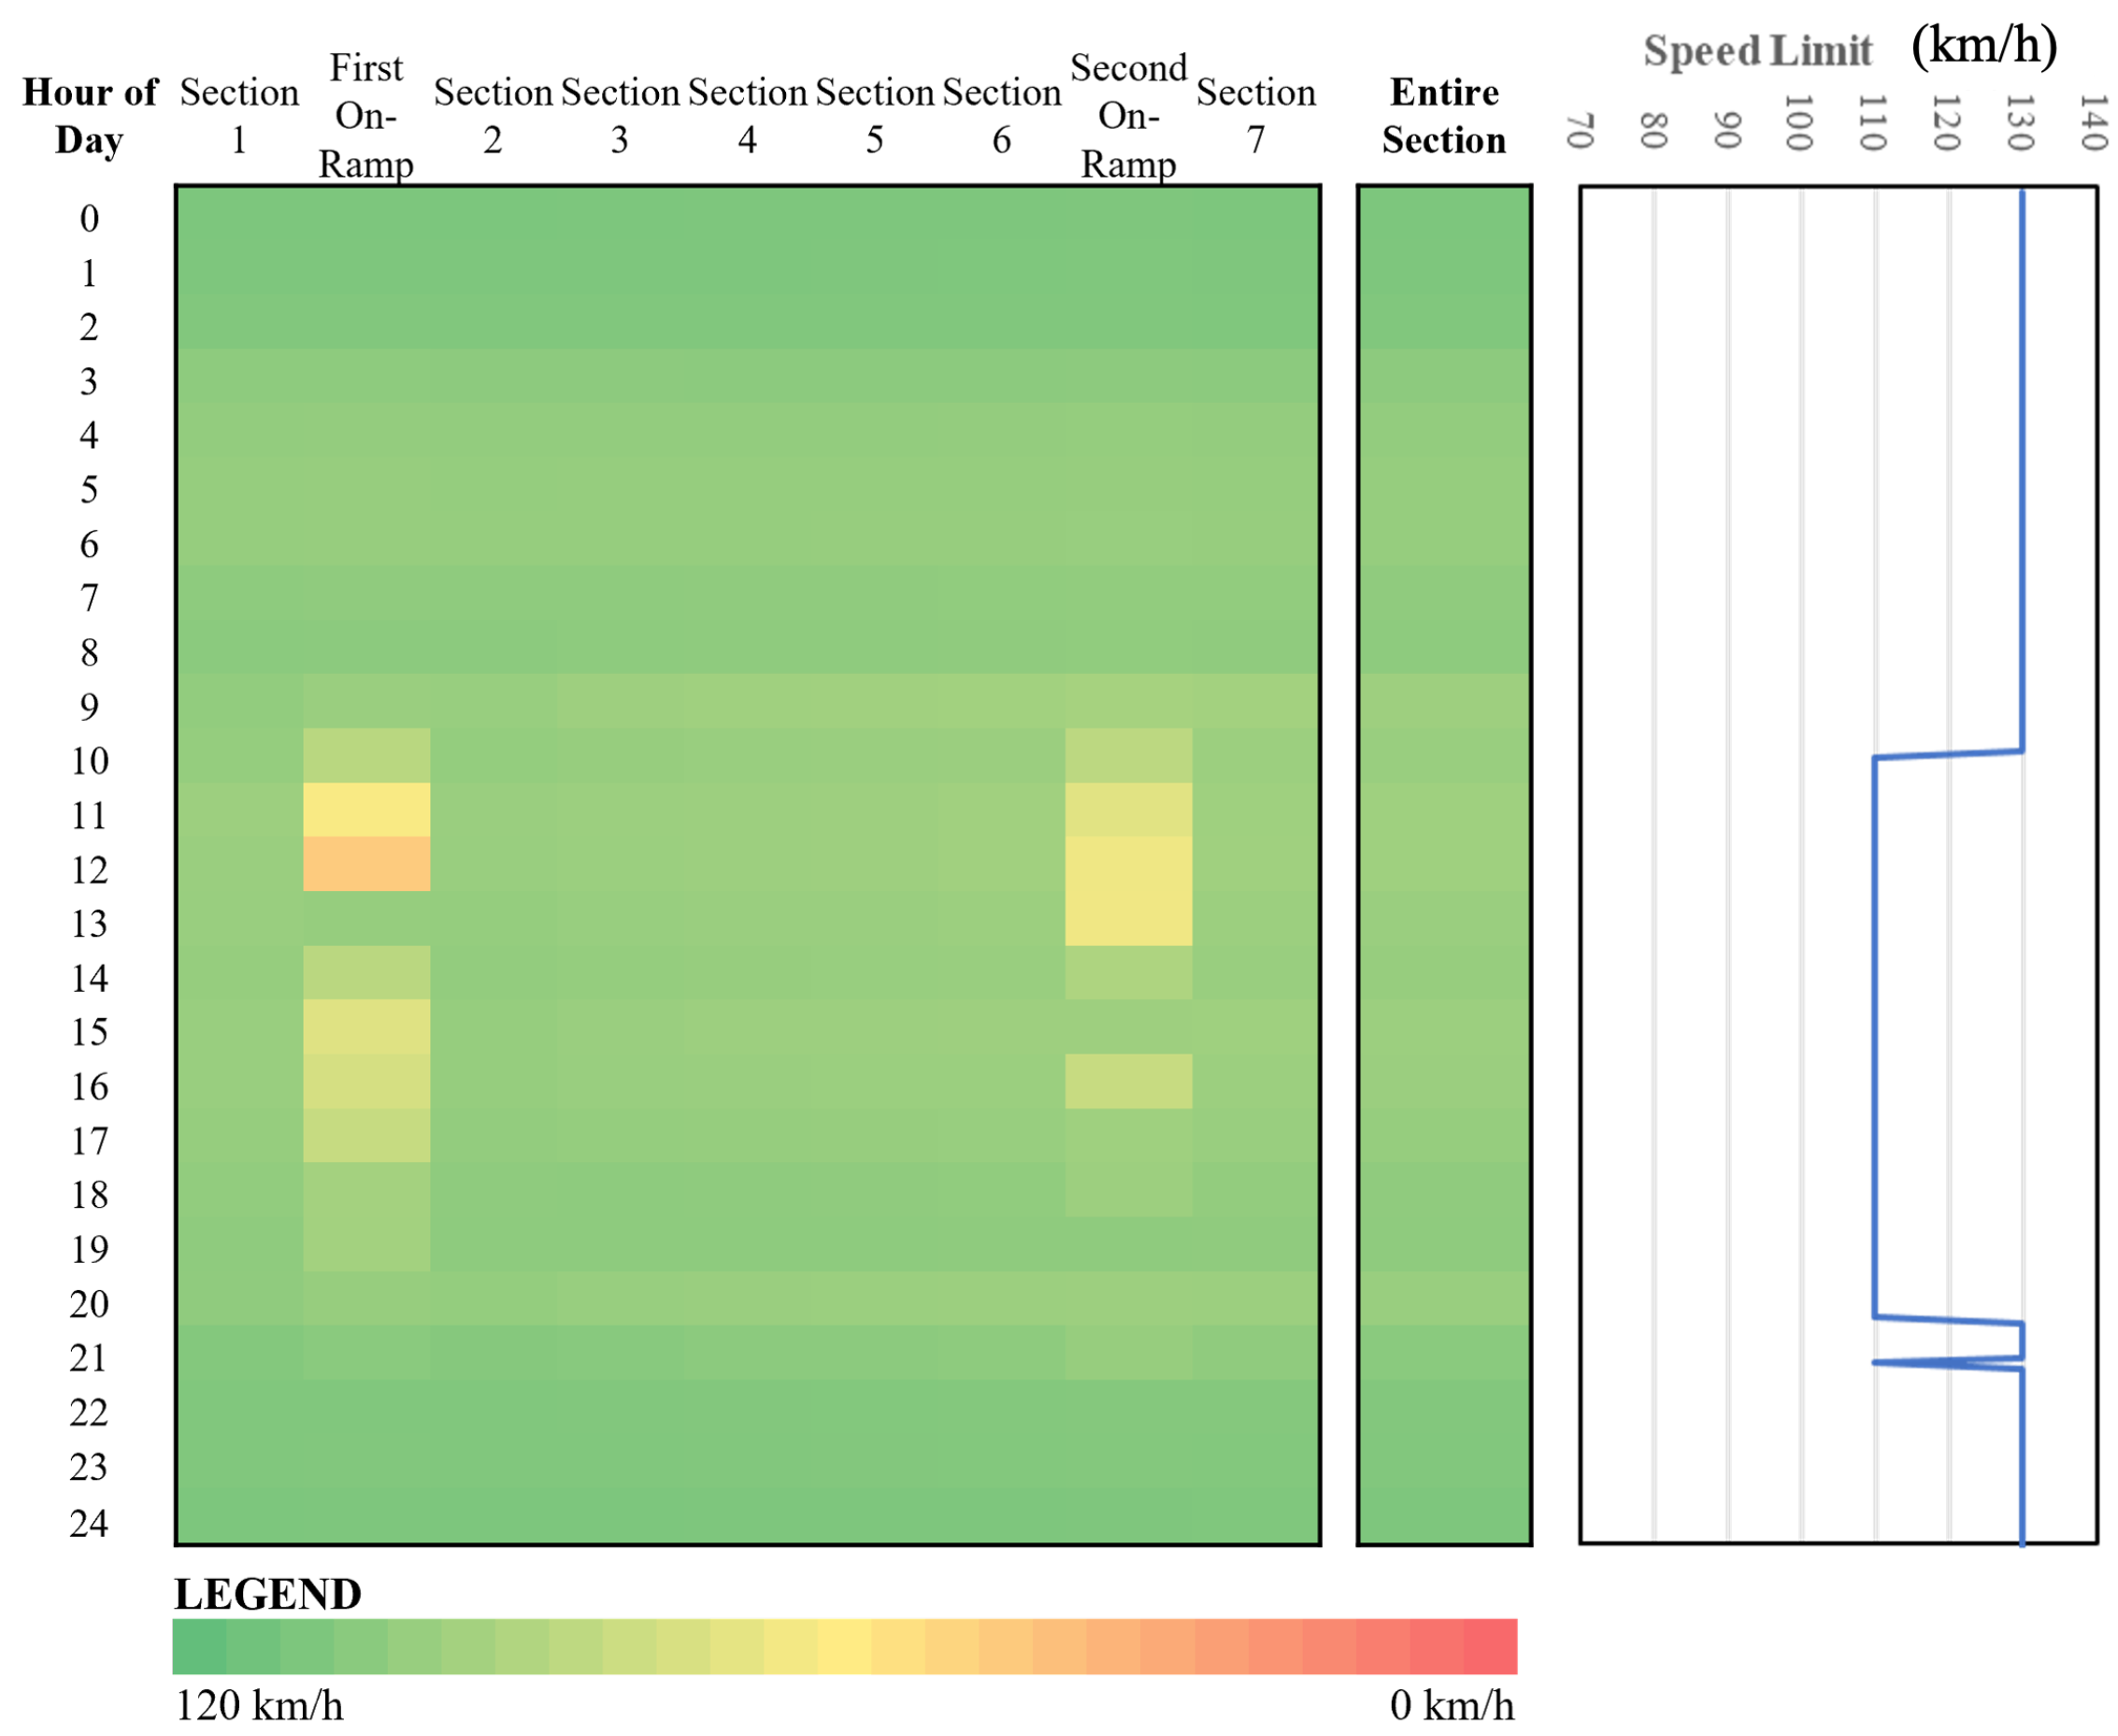
In order to perform a simulation-based comparison of the VSL use-case with the provision of variable speed limits through VMSs, a typical 24-h flow demand profile was taken along the test section of the A63 highway (see Figure 1a) along with the incoming flows at two interchanges within the section. The hourly flows and hourly speeds without any variable speed limit control are demonstrated in Figure 6 for each successive section of the test corridor along with the average hourly speed for the entire section. It shows that high shares of merging traffic create congestion on the on-ramps, which then propagates to the upstream sections. Except for the on-ramp section, each section of the highway corridor might activate (or not) the VSL system. The speed profiles are significantly enhanced when VSL information is provided using VMSs, as can be seen from Figure 7, which shows the average speeds and the triggered speed limits during different hours of the day. This also brings out the clear benefits of implementing variable speed limits on highways.
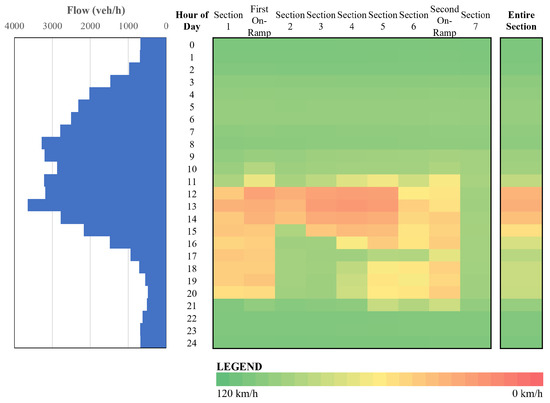
Figure 6.
Hourly Traffic flows and average speeds along test section without VSL information.
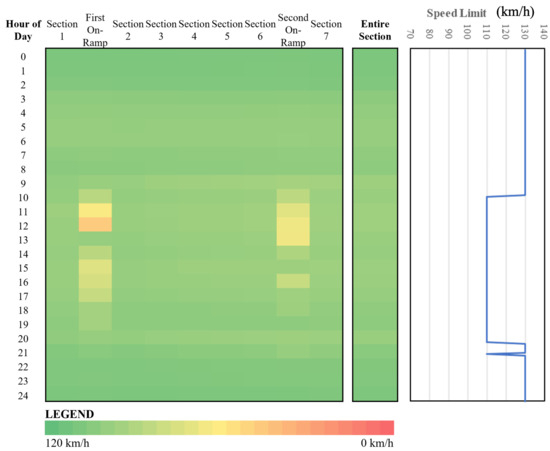
Figure 7.
Hourly average speeds and speed limits along test section with VSL information using VMSs.
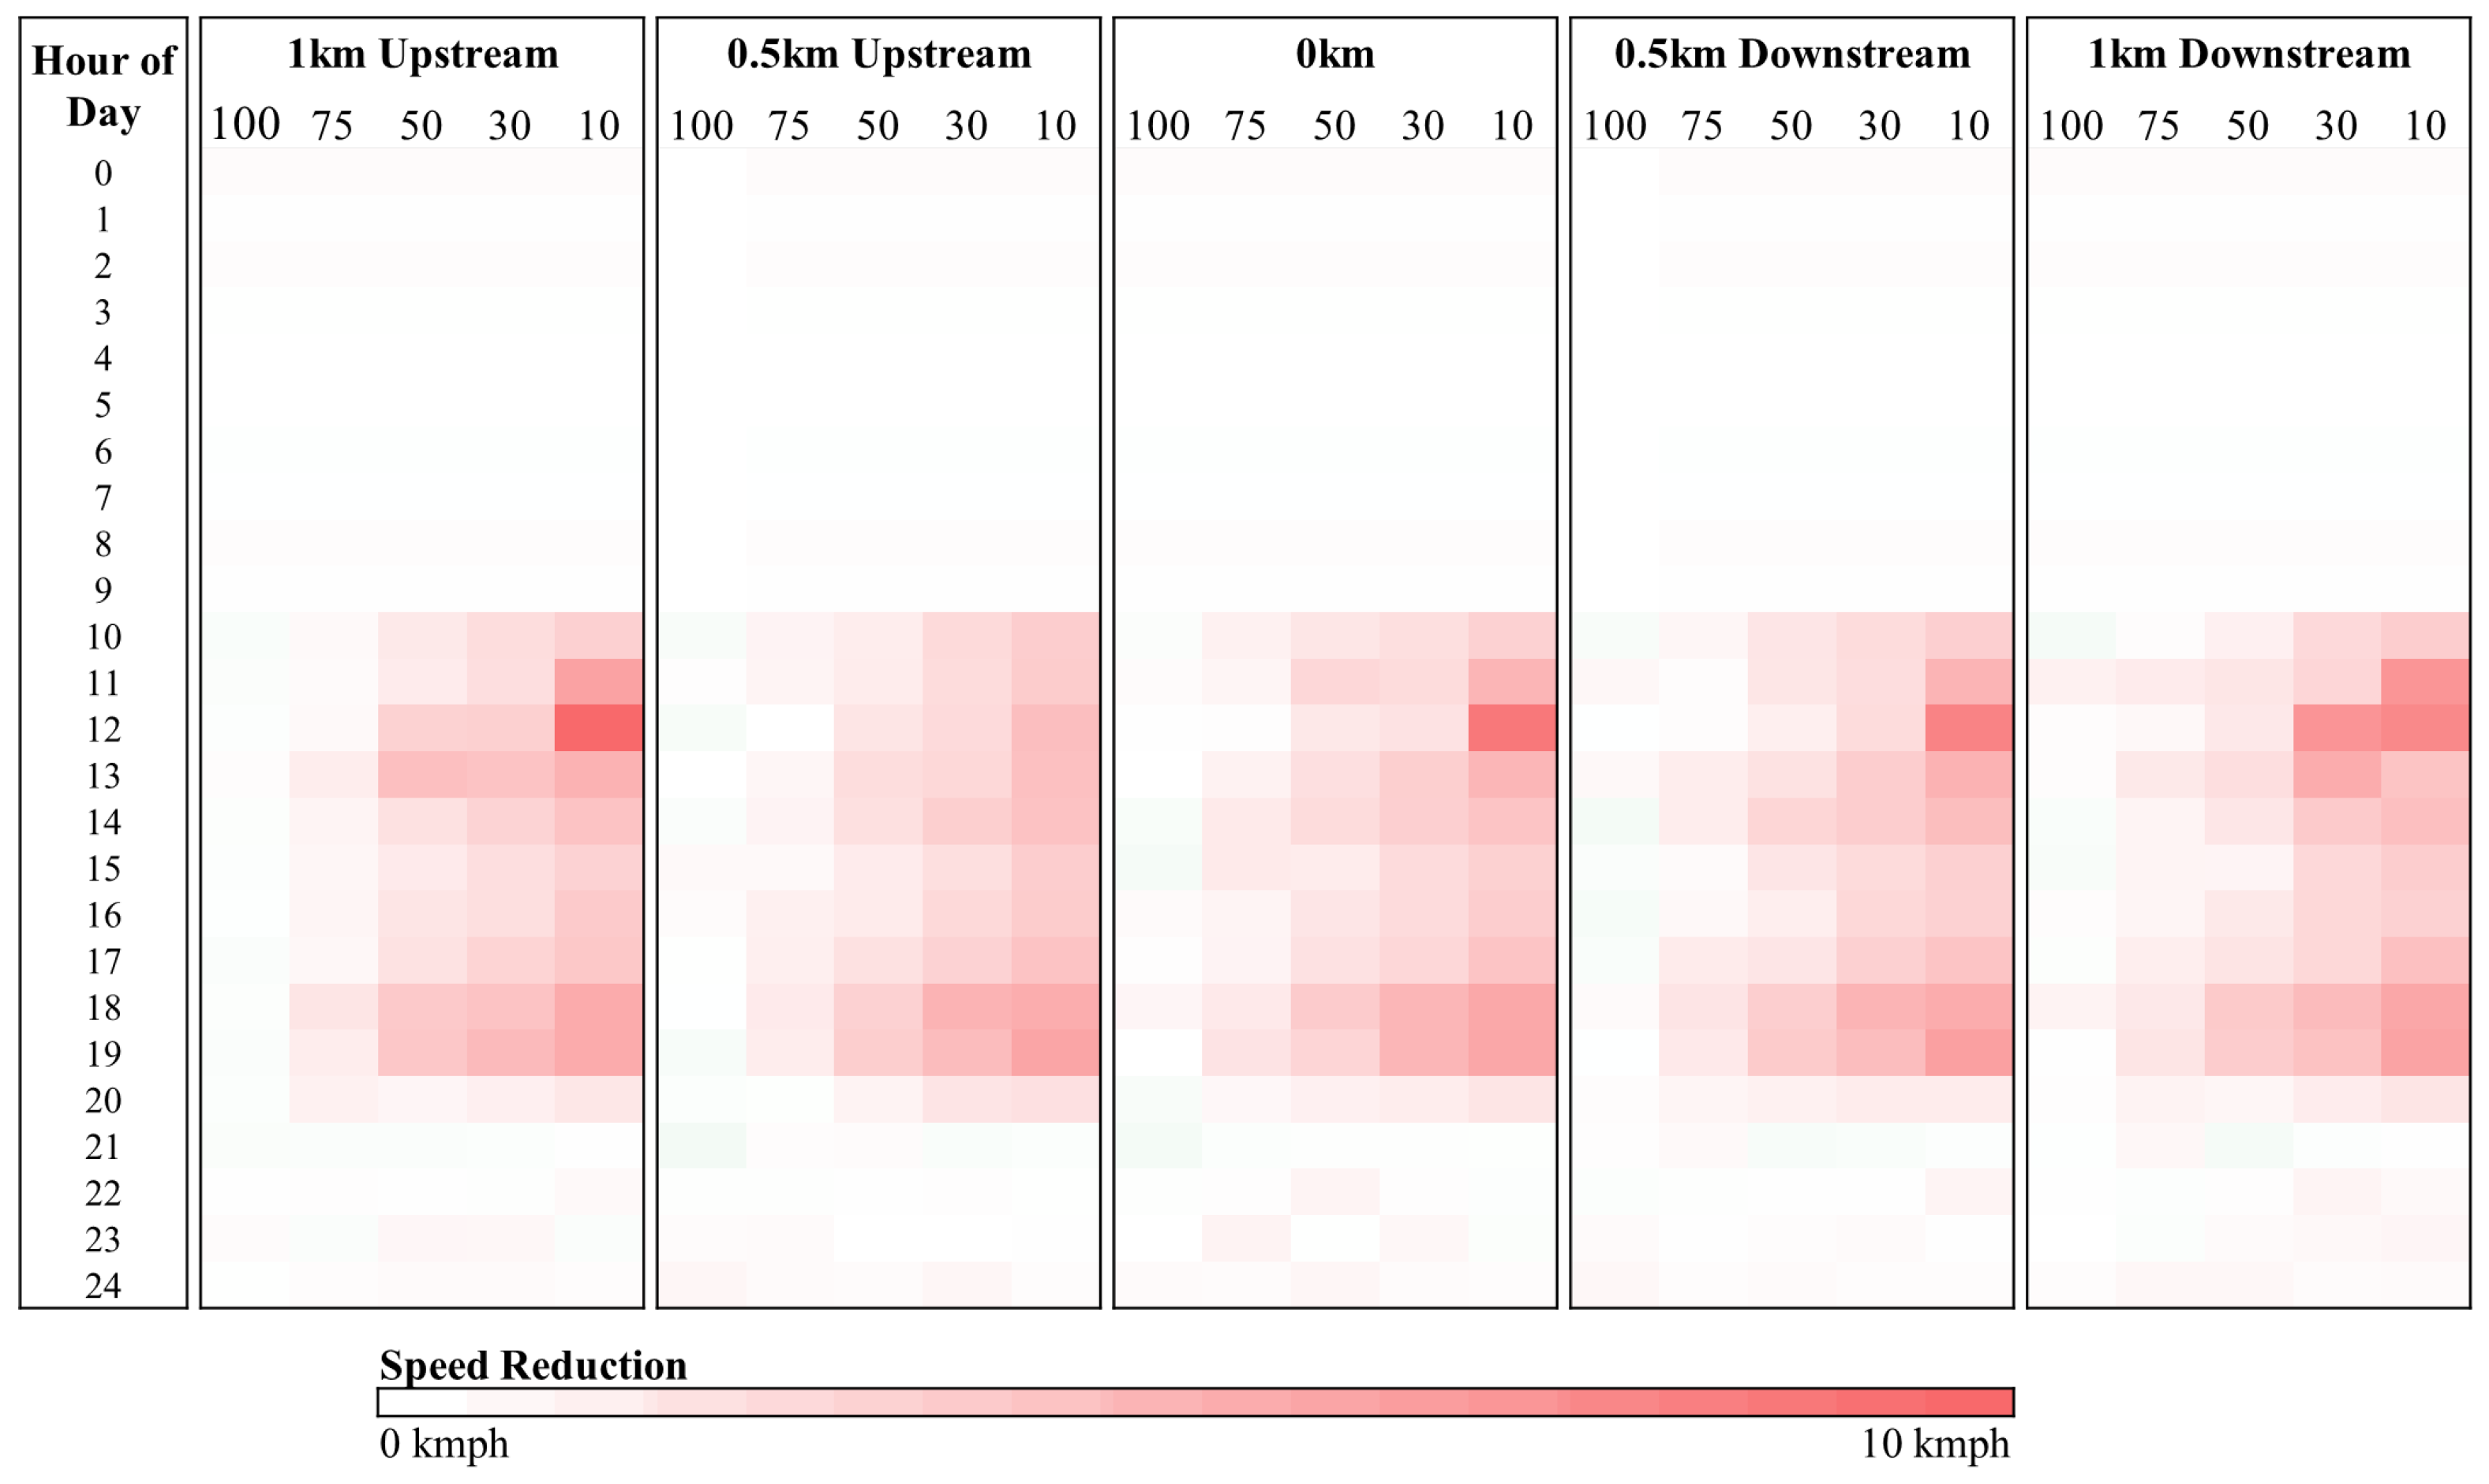
The next step was to observe the impacts for various levels of market penetration (viz., 10%, 30%, 50%, 75%, and 100%) and at various activation points with the conservative broadcast process for the RSUs. It can be observed from Figure 8 that, in situations of a mixed traffic environment with equipped and unequipped vehicles, the effectiveness of the VSL use-case, in terms of speed as the KPI, is similar to VMSs, if the activation area is within 0.5 km upstream and downstream of the VMS location. If the activation area is located at a large distance downstream of the event location, it becomes difficult to address the congestion originating from the on-ramp near the VMS location. On the other hand, a distant upstream activation area gives the opportunity for unequipped vehicles to overtake the CV, especially at low market penetration rates of CVs, making the VSL application less effective.
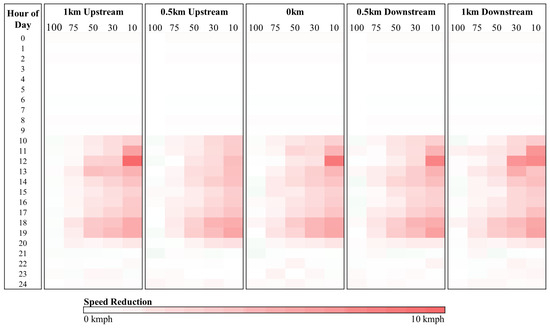
Figure 8.
Change in hourly average speeds in test section for different scenarios of IVSs in comparison to VMSs.
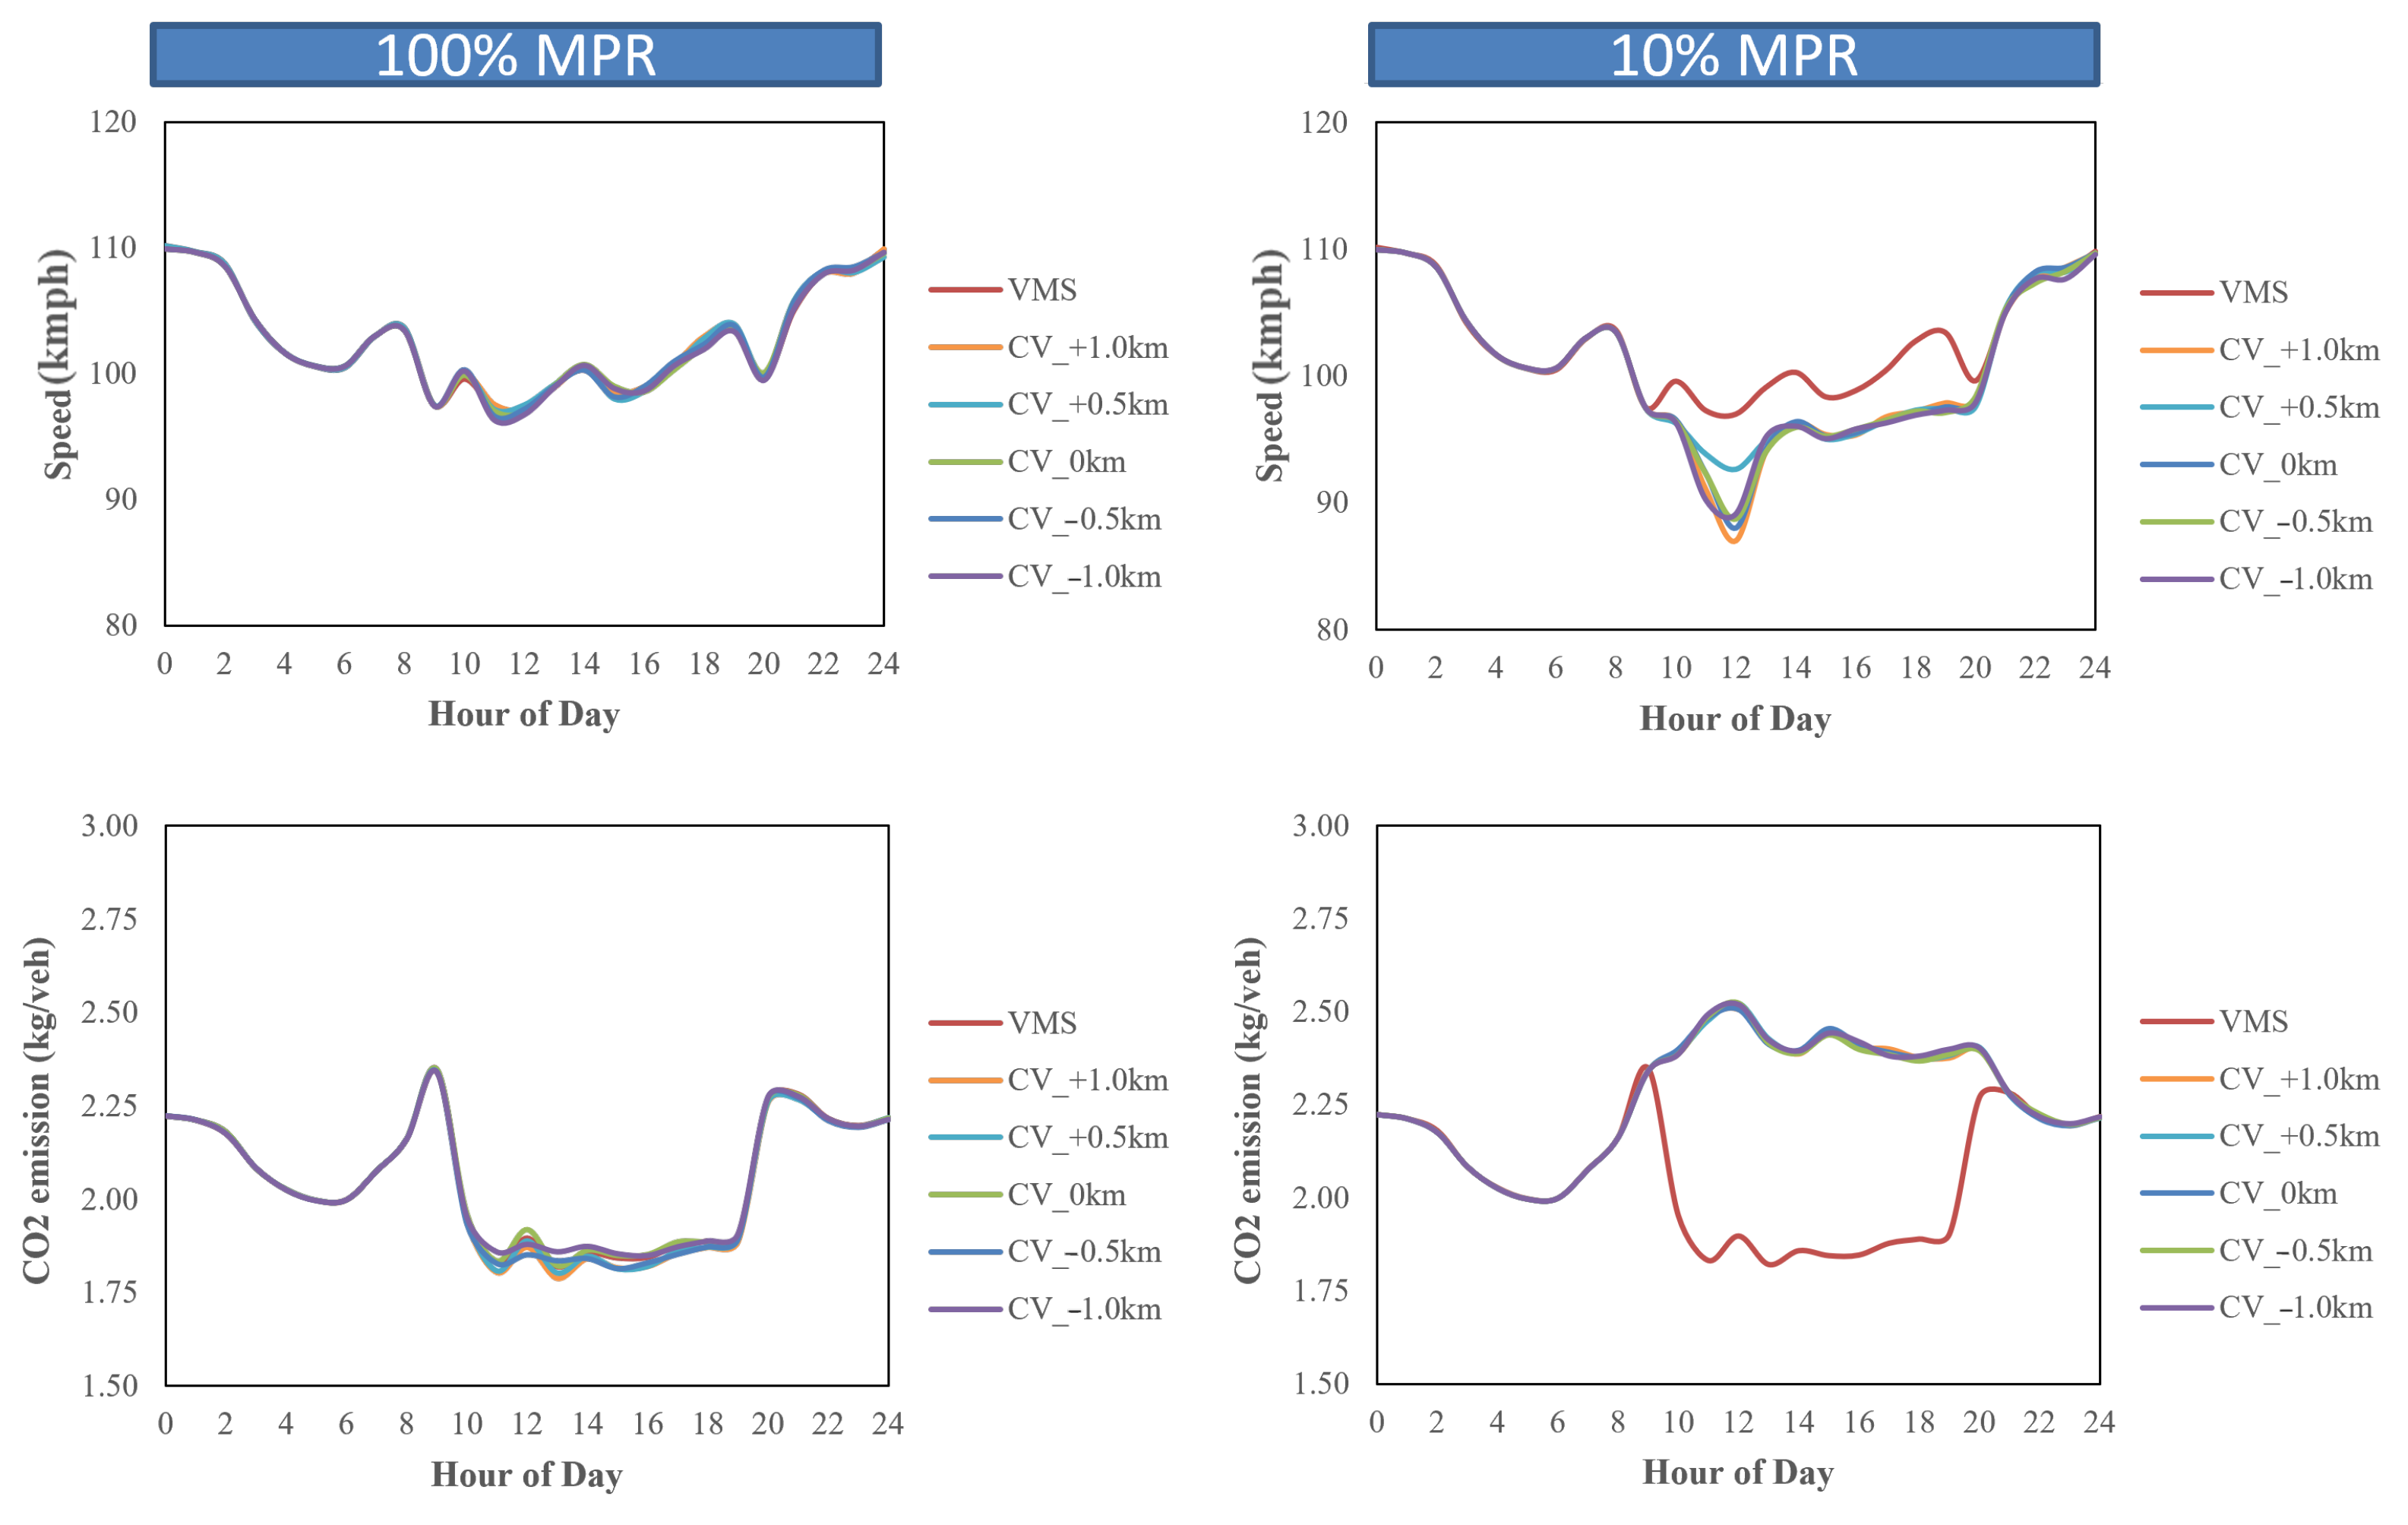
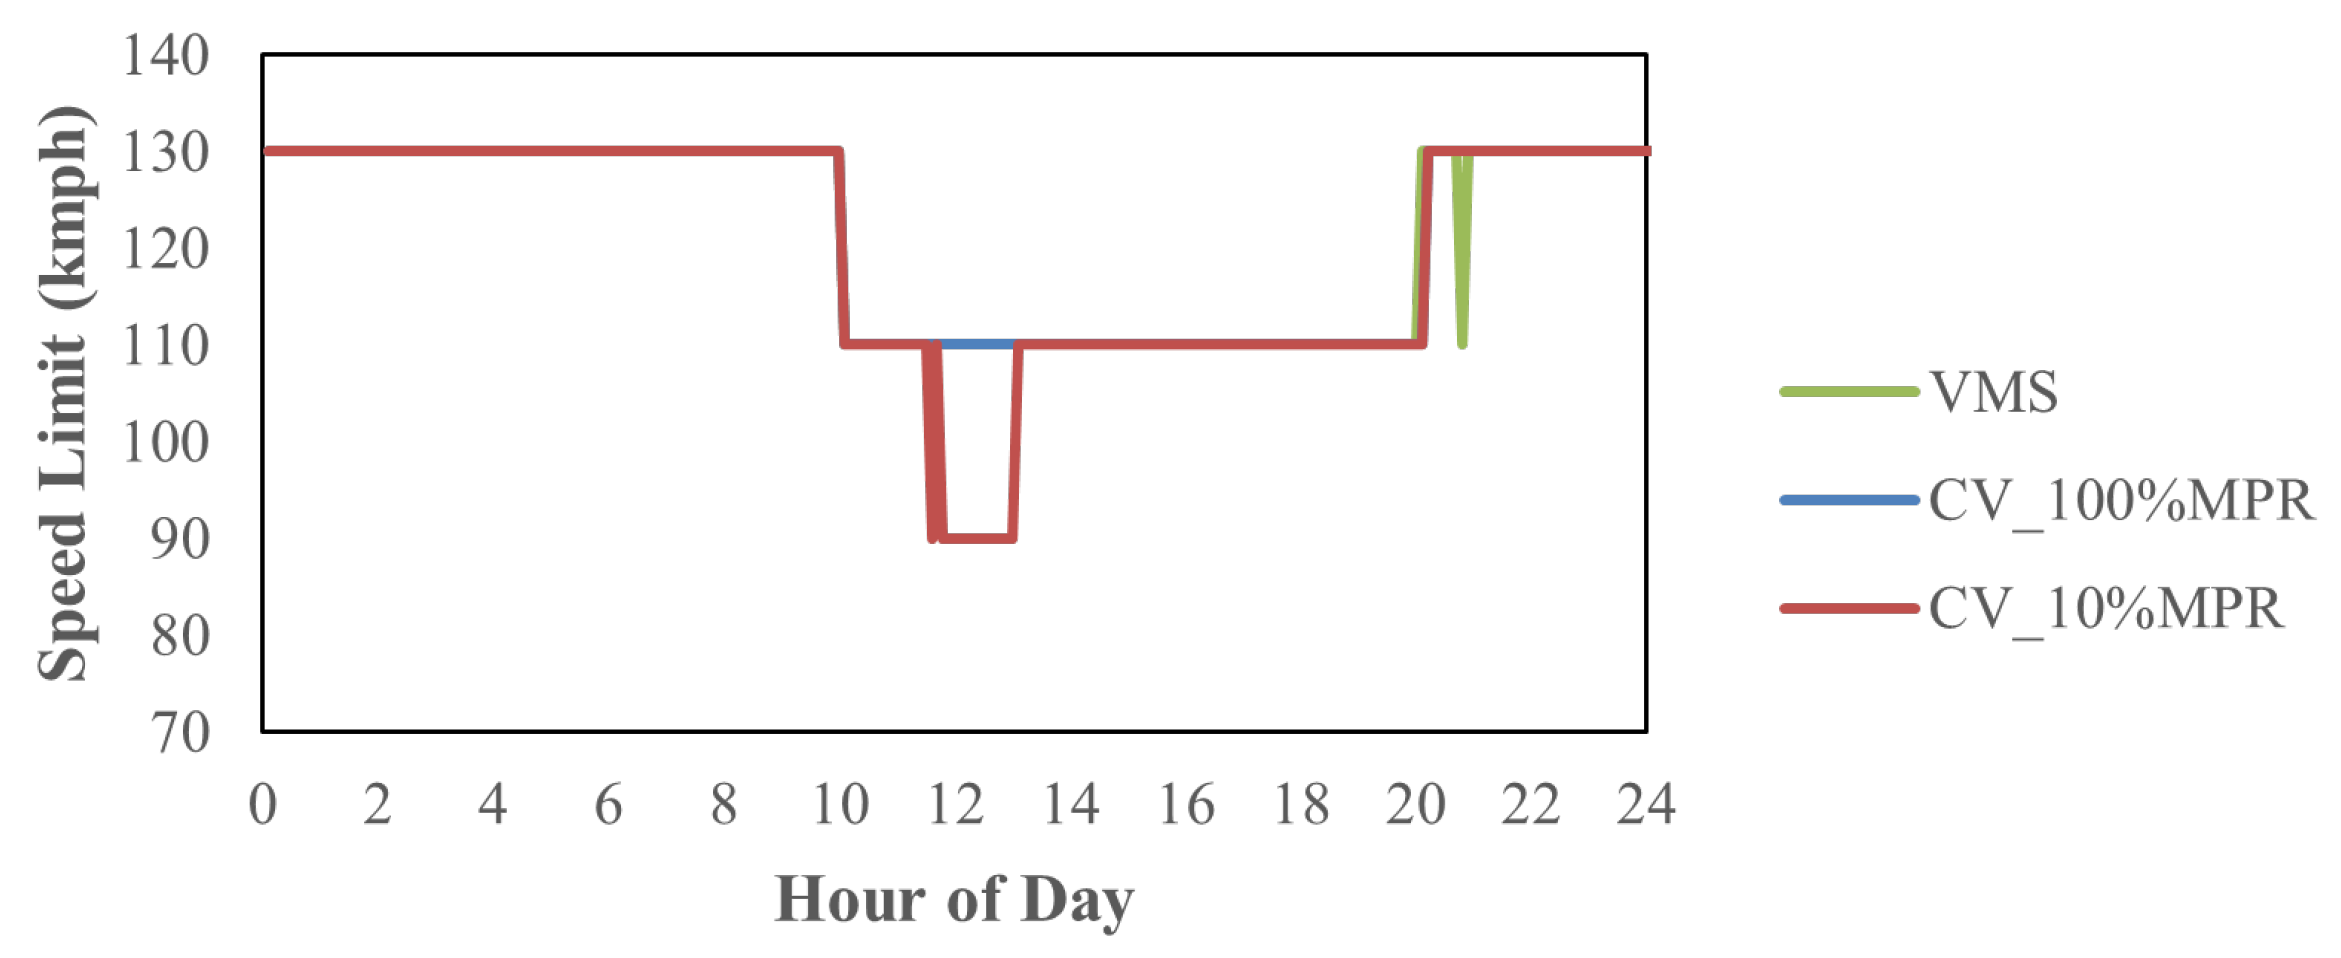
Moreover, the performance starts deteriorating as the MPR falls below 50%, and at 10% MPR, it is significantly less effective as compared to VMSs. In fact, during the activation period of the VSL, the average speed is reduced additionally by about 5–10 kmph at 10% MPR as compared to VMSs. The same can be observed in Figure 9, which also shows that the response times of the drivers of CVs do not have any visible impact on the performances in comparison to using VMSs. Moreover, from Figure 10, it can be observed that, at a low MPR, the situation is further worsened since, contrary to VMSs, where a speed limit of 110 kmph was sufficient, a 90 kmph speed limit is also triggered, and congestion is aggravated, not only due to the merging, but also the higher speed heterogeneity between the equipped and unequipped vehicles. Therefore, the results indicate that VSL information should be provided using both IVSs and VMSs until a CV market penetration of 30% or more is reached.

Figure 9.
Hourly average speeds and emissions along test section with the VSL-IVS at 100% and 10% MPR.
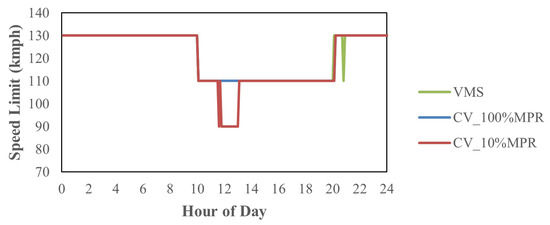
Figure 10.
Hourly speed limits along test section.
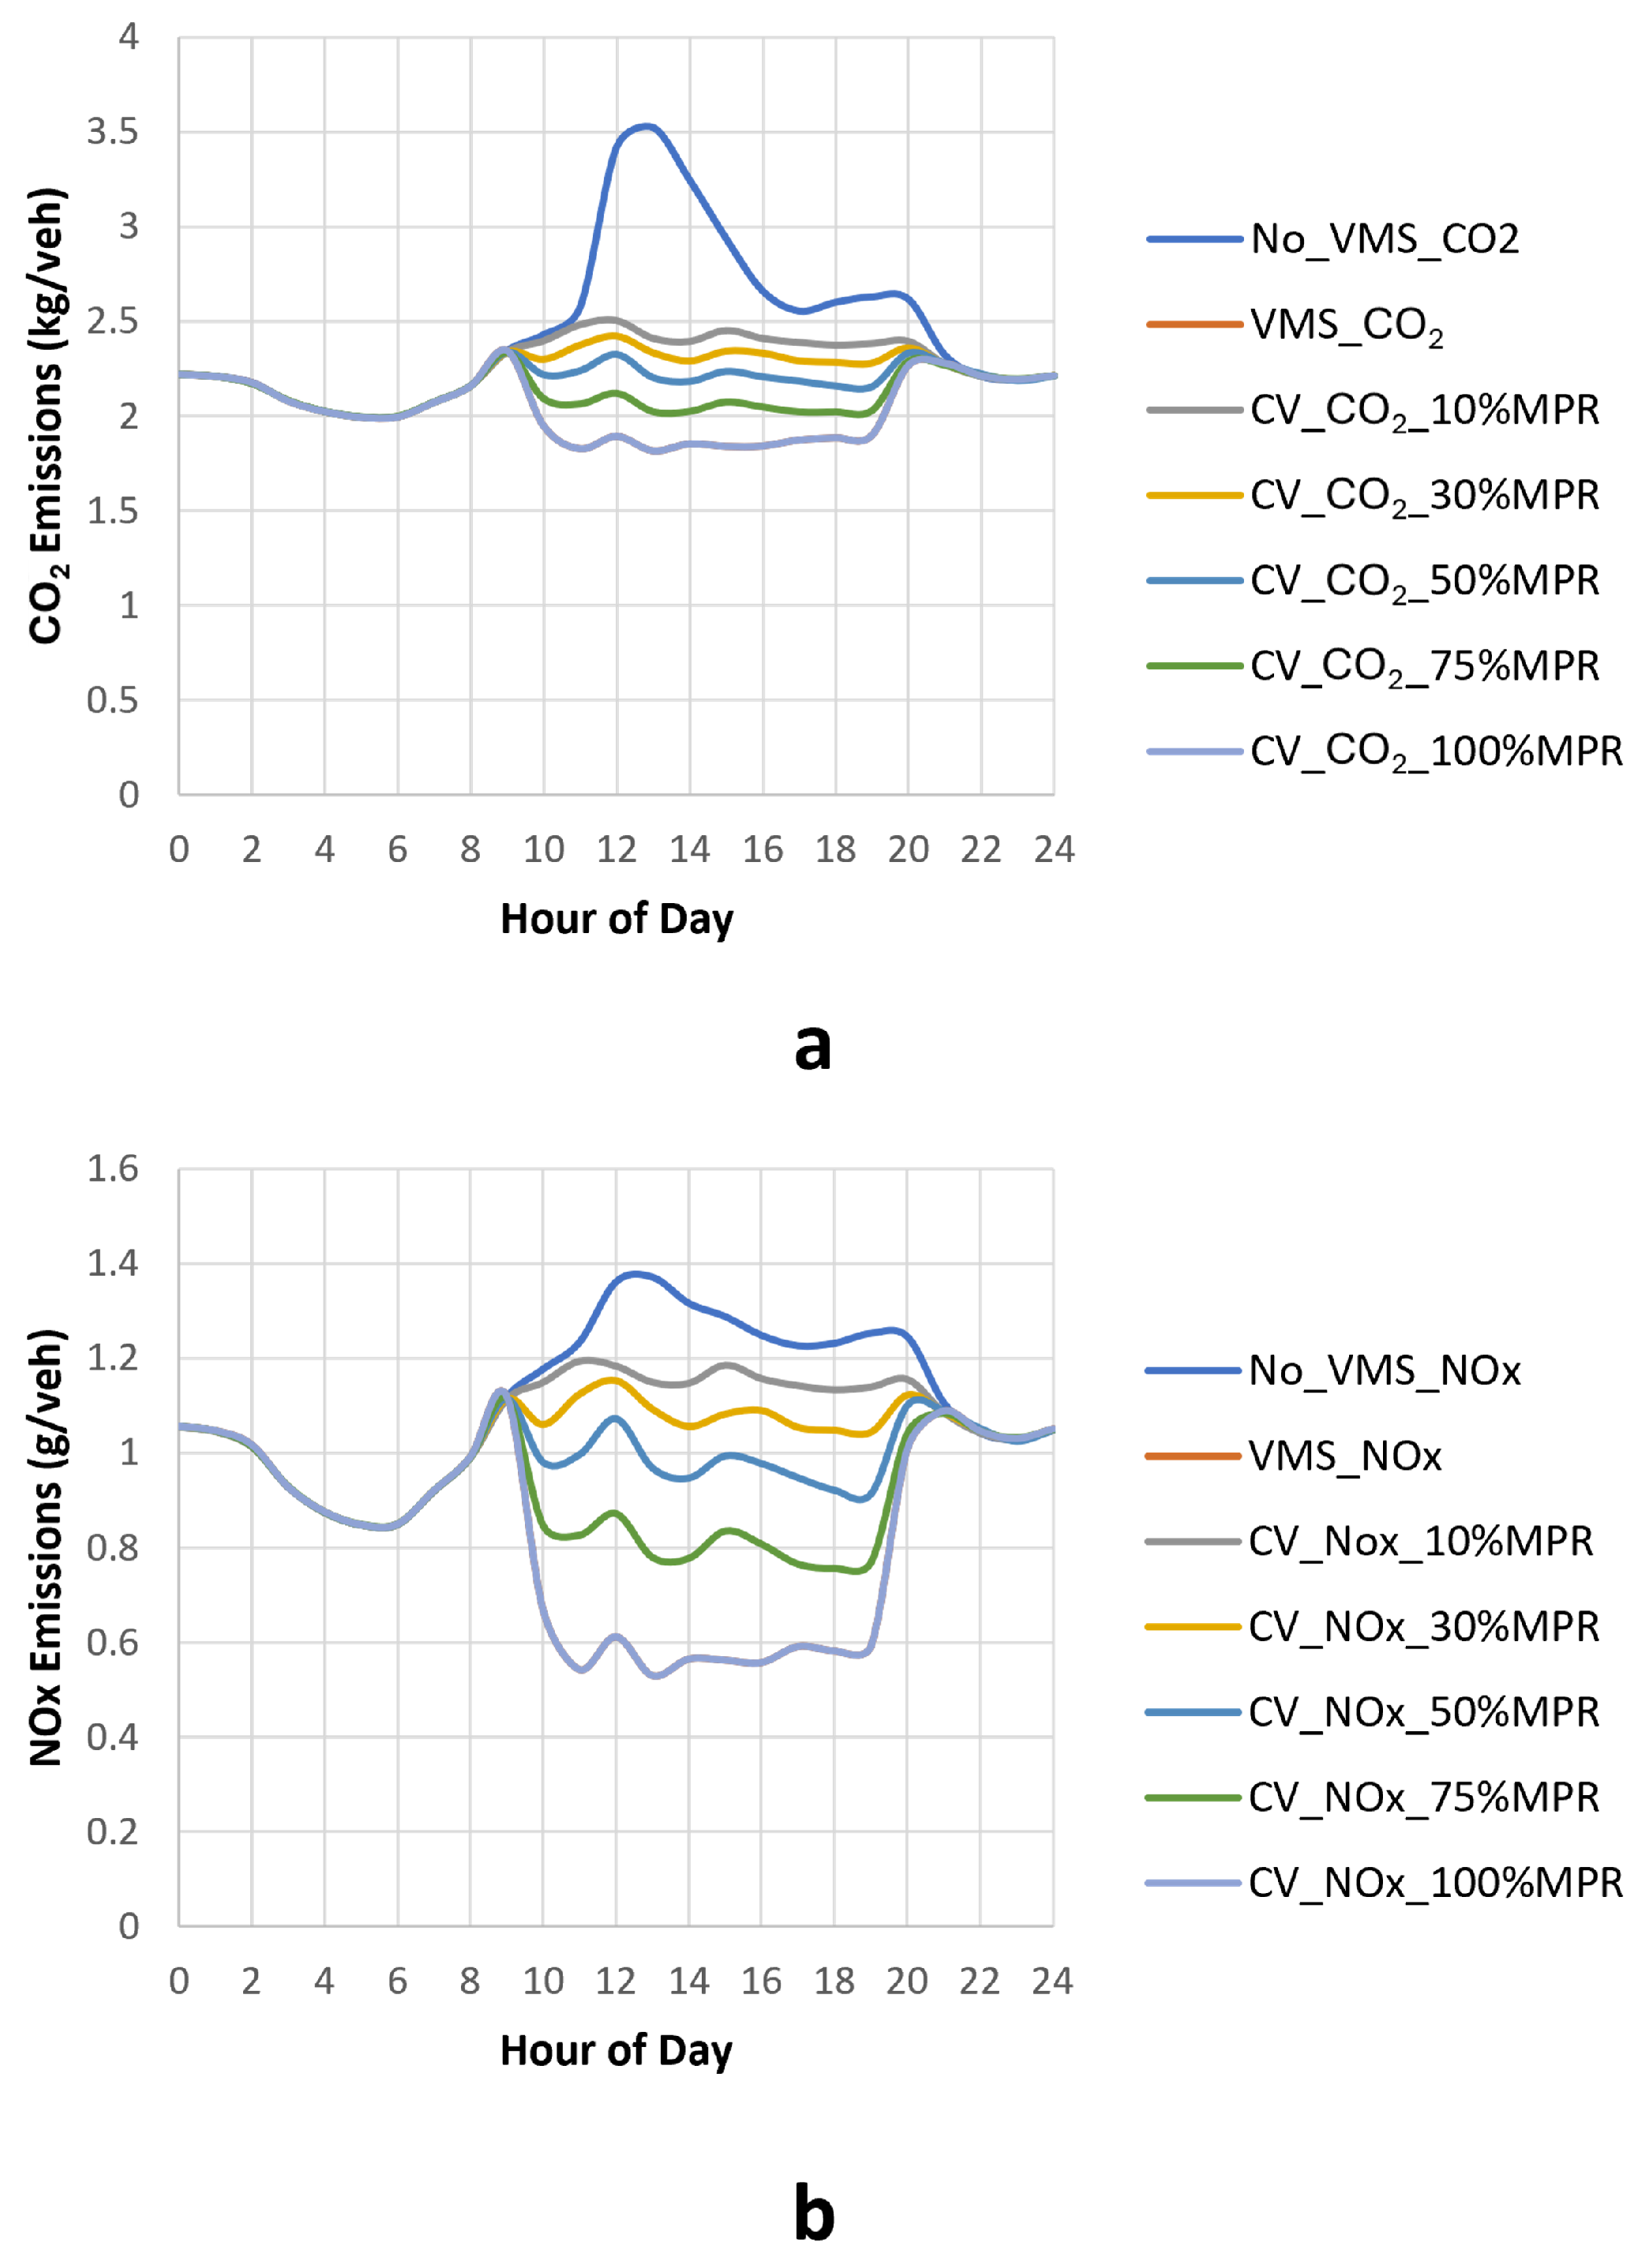
While comparable speed profiles between VMSs and VSL-equipped CVs are observed in many scenarios, some distinct differences may be observed in terms of and emissions with a change in the market penetration rate of CVs. Figure 11 shows that, although the emission performance in a fully connected environment is similar to that for a VMS, there is an increase in emissions with the reduction in the market penetration rate of CVs. This may be caused primarily by the speed oscillations of unequipped vehicles. These findings are, obviously, based on the assumption that the drivers, irrespective of the means of communication (through road signage for unequipped vehicles or HMI for CVs), are fully compliant with the speed instructions. In reality, however, the variations in compliance to the speed instructions through different means of communication is likely to affect the overall emission performances. Nevertheless, please note that, despite a low market penetration of CVs (around 10%) in the traffic stream, we observed substantial benefits in pollutant emission as compared to the case where no VSLs are applied.

Figure 11.
Hourly (a) and (b) emissions along test section at different MPR of CV with activation area at the VMS location.
The traffic and environmental impacts for different market penetrations of CVs are summarized in Figure 12. It might be observed that there are fewer variations in terms of speed gain with variations in the MPR than emissions. Despite similar trends in and emissions, higher benefits are observed for emissions at a high MPR of connected vehicles, while emissions benefits are higher at a low MPR. This is due to emissions being more sensitive to changes in speed [38] as compared to emissions.
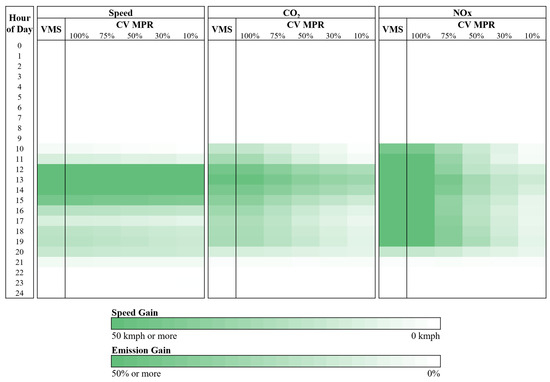
Figure 12.
Comprehensive traffic and environment performance evaluation of the VSL use-case according to market penetration rate and day period.
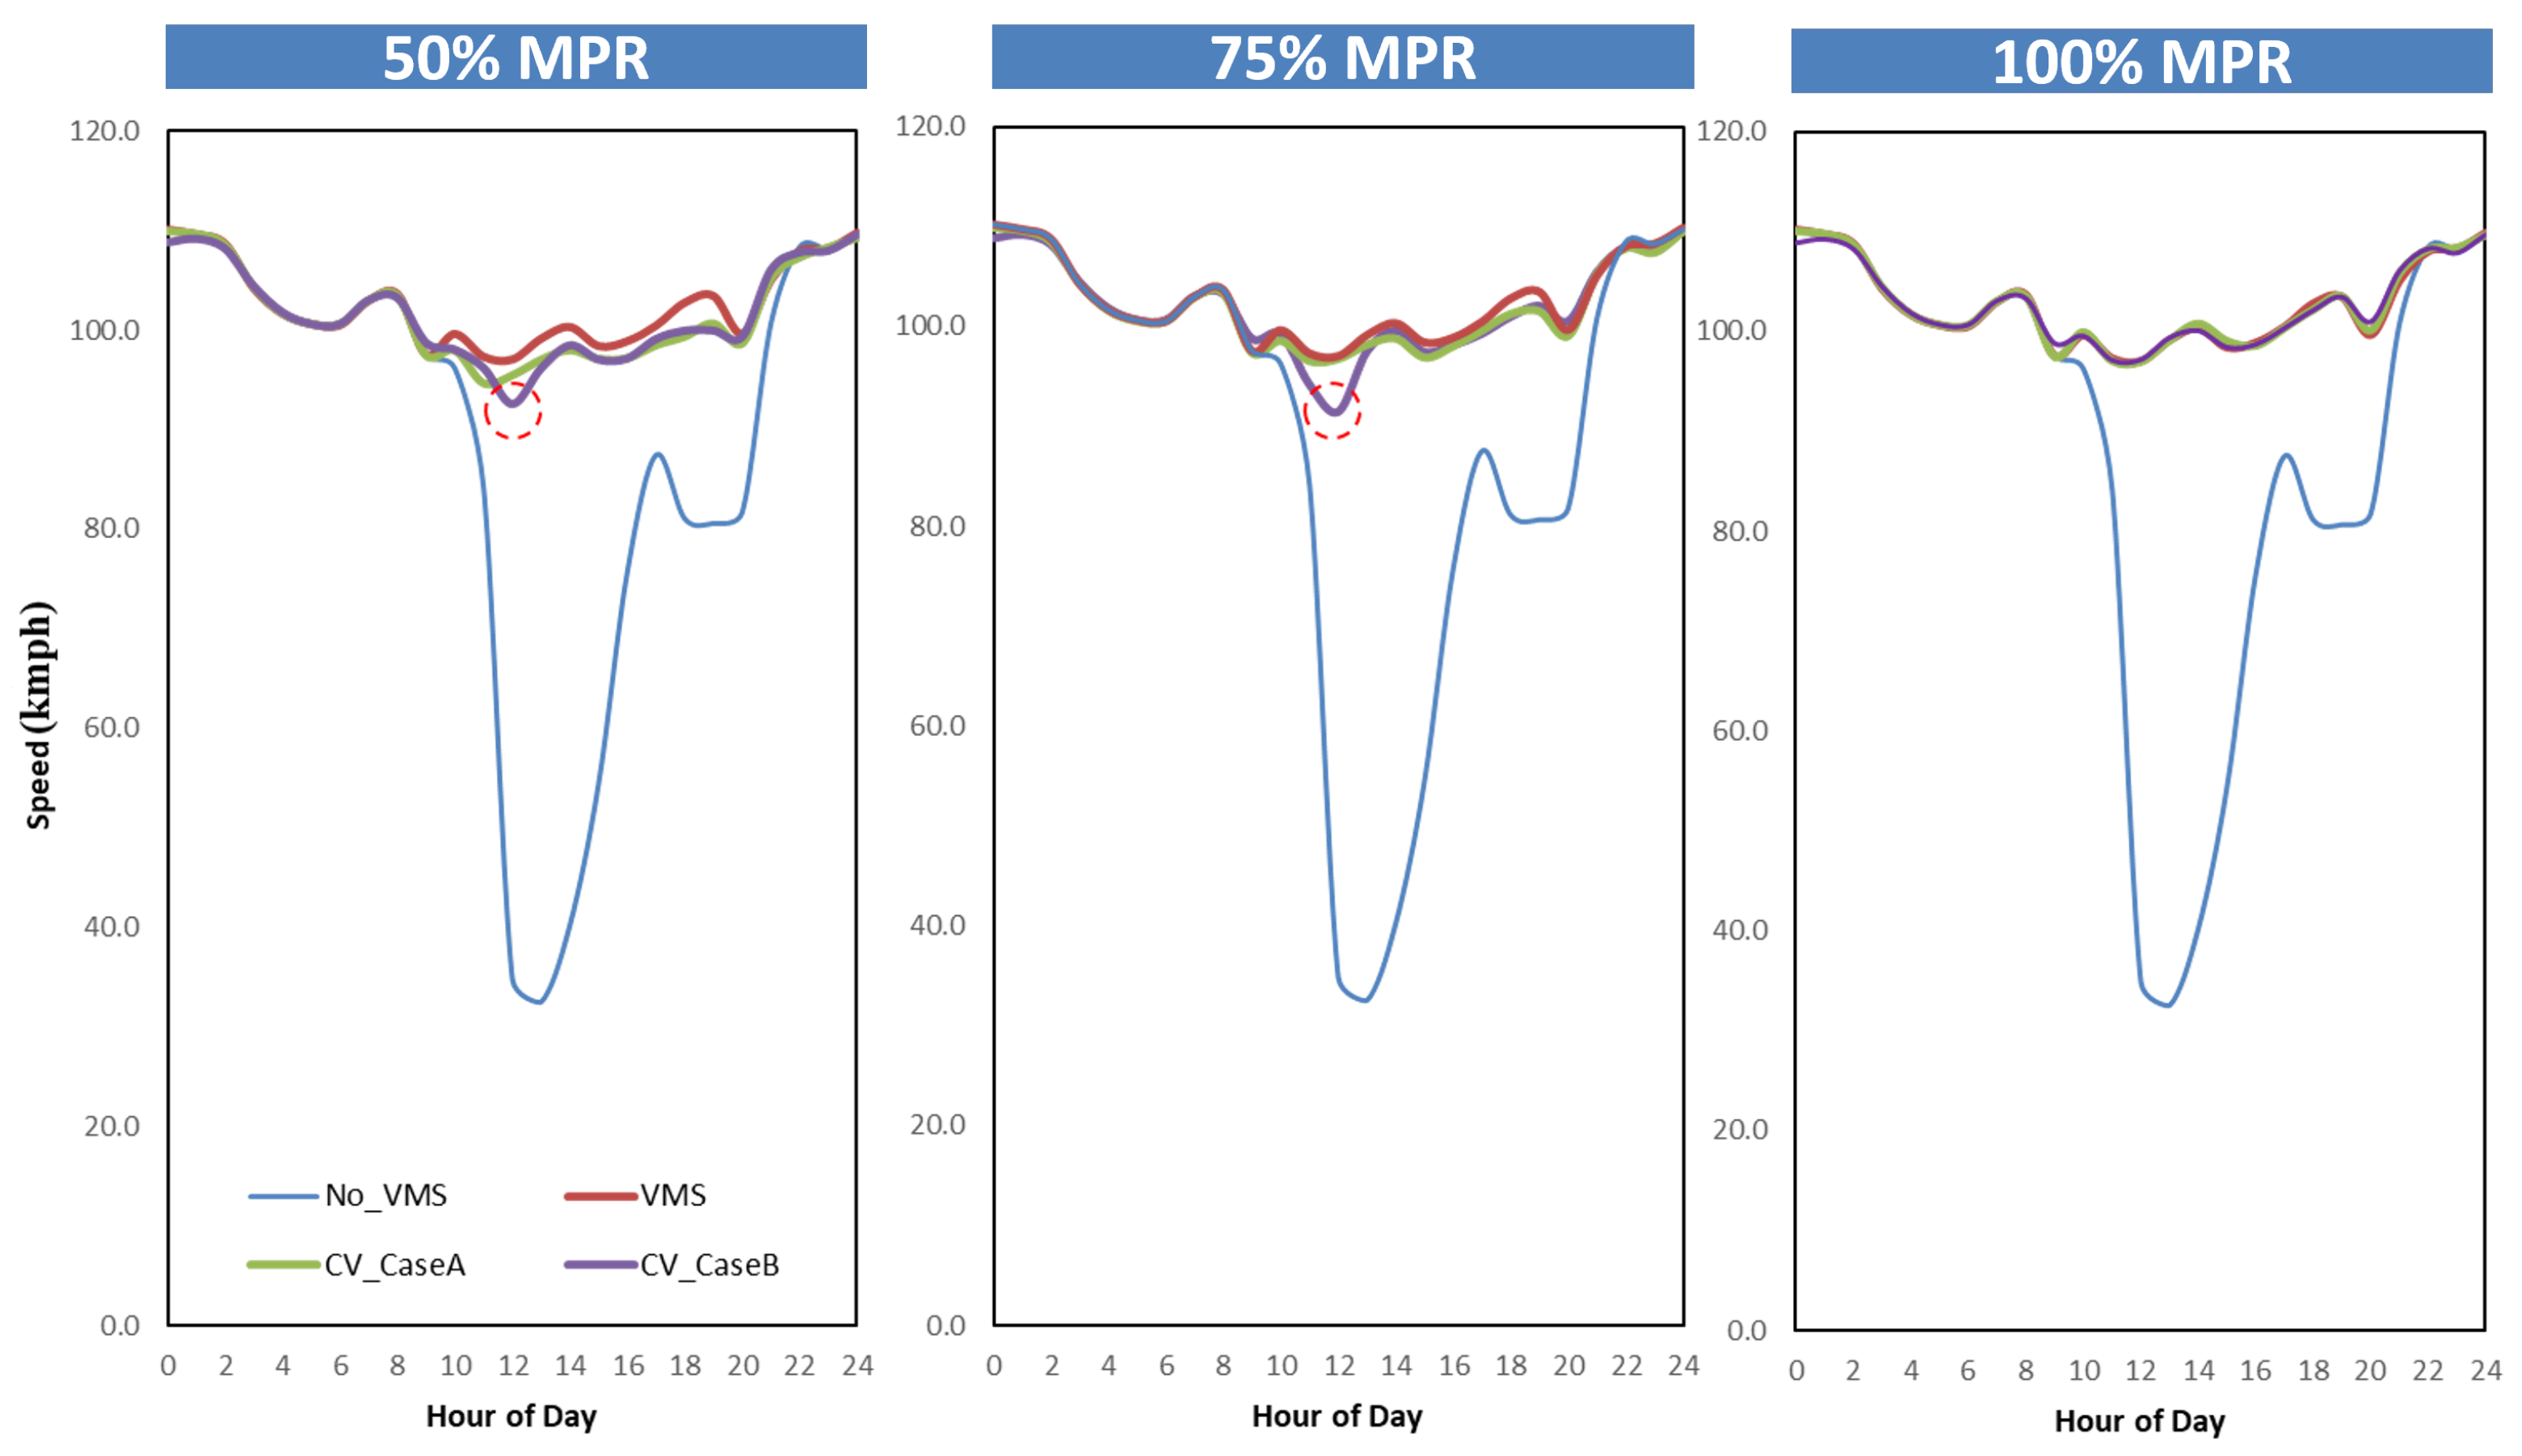
The expansive broadcast process for RSUs does not point out any significant difference regardless of the value: the antenna can be located 5 km upstream or at the exact position of the event without impact on performance, except during congested situations with high traffic demand and high traffic merging, in a mixed traffic environment (see Figure 13). Therefore, the expansive broadcast process for RSUs appears to be more suitable than the conservative process in situations where RSU coverage ends more than 0.5 km upstream of the event location.
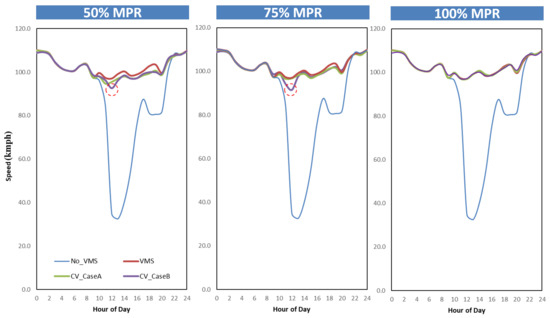
Figure 13.
Hourly speed profiles along test section with CV-CaseA. conservative strategy and CV-CaseB. expansive strategy.
4. Conclusions
The present study provides several key insights by comparing the deployment of a variable speed limit algorithm through variable message signs (VMSs) for non-connected vehicles and cooperative intelligent transport system (C-ITS) services in the form of in-vehicle signage for human-driven connected vehicles. The study was developed in a microscopic simulation framework with assumptions regarding the driver’s response time and compliance with instructions. As a consequence, the results are indicative and should be interpreted carefully. The major findings, observations, and subsequent recommendations from the present study are highlighted as follows:
- Impact on traffic efficiency: Using in-vehicle signage to provide variable speed limit instructions shows considerable promise in terms of traffic efficiency even at a low market penetration rate of CVs. For example, as compared to a scenario with no VSL, the average traffic stream speed is improved by about 25 kmph during the peak periods of operation at a 10% market penetration rate (MPR) and about 30 kmph at market penetration rates of 75% or higher (see Figure 12). The average traffic stream speed improves till an MPR of 50% and then remains similar for higher market penetration rates of CVs.
- Impact on environmental efficiency: While there are some environmental benefits at a low MPR of CVs, the effectiveness in terms of environmental efficiency improves significantly with an increased MPR of CVs. Contrary to the traffic stream speed, the emissions are visibly reduced with each level of increase in the MPR (see Figure 11). The increase in emissions at a low MPR is primarily due to the speed oscillations of the unequipped vehicles at a microscopic level.
- Operation based on market penetration rate of CVs: Based on the results, it may be recommended to maintain speed limit instructions through operational variable message signs till a minimum CV market penetration of 30% is achieved in order to achieve meaningful impacts. The findings suggest that CVs might positively impact the traffic stream performance substantially when their MPR is more than 30%, and the impacts may remain similar even if VMSs are removed.
- Distance gap from event location: Providing speed instructions upstream of the event location appears to be more effective than providing the same downstream when full coverage of the Roadside Units (RSUs) cannot be achieved along the motorway. This may be due to the difficulties coping with a late speed instruction transmission, especially when the variable message sign is close to the on-ramp congestion. However, providing the same instruction further upstream of the event location reduces effectiveness at a low MPR. If the activation area is more than 500 m upstream, it gives unequipped vehicles the opportunity to overtake CVs, especially at lower market penetration rates of CVs, which makes it less effective.
- Message notification configuration: The expansive broadcast strategy appears to be more effective than the conservative one for a large distance gap to the event position (upper than 1 km).
It may be mentioned that the study does not investigate the delays caused in the wireless communication between RSUs and CVs due to latency and packet loss resulting in reduced reliability of on-time message transmission. These aspects may be incorporated as a future extension of the present work, especially for the operation of connected and autonomous vehicles. Furthermore, the present study also makes some assumptions about the response behavior of the connected driver, which can also be further refined, for example by incorporating the non-compliance or reduced compliance of the drivers to the speed instructions.
Author Contributions
The authors confirm their contribution to the paper as follows: study conception and design: K.B., P.-A.L. and N.-E.E.F.; data collection: K.B.; analysis and interpretation of the results: K.B., P.-A.L., N.-E.E.F. and E.F.; draft manuscript preparation: P.-A.L., K.B., H.B. and E.F. All authors reviewed the results and approved the final version of the manuscript.
Funding
This research was funded by the https://www.c-roads.eu/pilots/core-members/france/Partner/project/show/indid.html (accessed on 2 June 2024) consortium, co-financed by the Connecting Europe Facility of the European Union (Grant Numbers INEA/CEF/TRAN/M2018/1788494 and 2018-FR-TM-0097-S). The contents of this publication are the sole responsibility of the authors and do not necessarily reflect the opinion of the European Union.
Institutional Review Board Statement
Not applicable.
Informed Consent Statement
Not applicable.
Data Availability Statement
Data are contained within the article.
Conflicts of Interest
The authors declare no conflicts of interest. The funders had no role in the design of the study; in the collection, analyses, or interpretation of data; in the writing of the manuscript; nor in the decision to publish the results.
References
- Smulders, S. Control by variable speed signs: The Dutch experiment. In Proceedings of the International Conference on Road Traffic Monitoring and Control (6th: 1992: London, England), London, UK, 28–30 April 1992. [Google Scholar]
- Smulders, S.; Helleman, D. Variable Speed Control: State-of-the-Art and Synthesis. In Proceedings of the 9th International Conference on Road Transport Information and Control, London, UK, 21–23 April 1998. [Google Scholar]
- Khondaker, B.; Kattan, L. Variable Speed Limit: An Overview. Transp. Lett. 2015, 7, 264–278. [Google Scholar] [CrossRef]
- Hegyi, A.; Hoogendoorn, S.; Schreuder, M.; Stoelhorst, H.; Viti, F. SPECIALIST: A dynamic speed limit control algorithm based on shock wave theory. In Proceedings of the 2008 11th International IEEE Conference on Intelligent Transportation Systems, Beijing, China, 12–15 October 2008; pp. 827–832. [Google Scholar]
- Kattan, L.; Khondaker, B.; Derushkina, O.; Poosarla, E. A Probe-Based Variable Speed Limit System. J. Intell. Transp. Syst. 2015, 19, 339–354. [Google Scholar] [CrossRef]
- Kušić, K.; Dusparic, I.; Guériau, M.; Gregurić, M.; Ivanjko, E. Extended Variable Speed Limit control using Multi-agent Reinforcement Learning. In Proceedings of the 2020 IEEE 23rd International Conference on Intelligent Transportation Systems (ITSC), Rhodes, Greece, 20–23 September 2020; pp. 1–8. [Google Scholar]
- Kušić, K.; Ivanjko, E.; Gregurić, M.; Miletić, M. An Overview of Reinforcement Learning Methods for Variable Speed Limit Control. Appl. Sci. 2020, 10, 4917. [Google Scholar] [CrossRef]
- Wang, M.; Daamen, W.; Hoogendoorn, S.P.; van Arem, B. Connected variable speed limits control and car-following control with vehicle-infrastructure communication to resolve stop-and-go waves. J. Intell. Transp. Syst. 2016, 20, 559–572. [Google Scholar] [CrossRef]
- Grumert, E.F.; Tapani, A. Bottleneck mitigation through a variable speed limit system using connected vehicles. Transp. A Transp. Sci. 2020, 16, 213–233. [Google Scholar] [CrossRef]
- Fang, X.; Péter, T.; Tettamanti, T. Variable Speed Limit Control for the Motorway–Urban Merging Bottlenecks Using Multi-Agent Reinforcement Learning. Sustainability 2023, 15, 1464. [Google Scholar] [CrossRef]
- Yang, J.; Wang, P.; Ju, Y. Variable Speed Limit Intelligent Decision-Making Control Strategy Based on Deep Reinforcement Learning under Emergencies. Sustainability 2024, 16, 965. [Google Scholar] [CrossRef]
- Yang, P.; Ma, M.; Wu, C. Ecologically Oriented Freeway Control Methods Integrated Speed Limits and Ramp Toll Booths Layout. Sustainability 2024, 16, 4404. [Google Scholar] [CrossRef]
- Vrbanić, F.; Miletić, M.; Tišljarić, L.; Ivanjko, E. Influence of Variable Speed Limit Control on Fuel and Electric Energy Consumption, and Exhaust Gas Emissions in Mixed Traffic Flows. Sustainability 2022, 14, 932. [Google Scholar] [CrossRef]
- Grumert, E.; Tapani, A. Using connected vehicles in a variable speed limit system. Transp. Res. Procedia 2017, 27, 85–92. [Google Scholar] [CrossRef]
- Chen, A.; Khorashadi, B.; Chuah, C.N.; Ghosal, D.; Zhang, M. Smoothing vehicular traffic flow using vehicular-based ad hoc networking & computing grid (VGrid). In Proceedings of the 2006 IEEE Intelligent Transportation Systems Conference, Toronto, ON, Canada, 17–20 September 2006; pp. 349–354. [Google Scholar]
- Belanovic, P.; Valerio, D.; Paier, A.; Zemen, T.; Ricciato, F.; Mecklenbrauker, C.F. On Wireless Links for Vehicle-to-Infrastructure Communications. IEEE Trans. Veh. Technol. 2010, 59, 269–282. [Google Scholar] [CrossRef]
- Pollicino, F.; Stabili, D.; Marchetti, M. On the effectiveness of BSM communications in V2V emergency scenarios. In Proceedings of the 2022 IEEE 95th Vehicular Technology Conference: (VTC2022-Spring), Helsinki, Finland, 19–22 June 2022; pp. 1–5. [Google Scholar] [CrossRef]
- Kanthavel, D.; Sangeetha, S.; Keerthana, K. An empirical study of vehicle to infrastructure communications—An intense learning of smart infrastructure for safety and mobility. Int. J. Intell. Netw. 2021, 2, 77–82. [Google Scholar] [CrossRef]
- Shin, Y.; Choi, H.; Nam, Y.; Lee, E. Video Packet Distribution Scheme for Multimedia Streaming Services in VANETs. Sensors 2021, 21, 7368. [Google Scholar] [CrossRef] [PubMed]
- Shin, Y.; Choi, H.S.; Nam, Y.; Cho, H.; Lee, E. Particle Swarm Optimization Video Streaming Service in Vehicular Ad-Hoc Networks. IEEE Access 2022, 10, 102710–102723. [Google Scholar] [CrossRef]
- Bijalwan, A.; Hussain, I.; Purohit, K.C.; Kumar, M.A. Enhanced Ant Colony Optimization for Vehicular Ad Hoc Networks Using Fittest Node Clustering. Sustainability 2023, 15, 5903. [Google Scholar] [CrossRef]
- Joshua, C.J.; Jayachandran, P.; Md, A.Q.; Sivaraman, A.K.; Tee, K.F. Clustering, Routing, Scheduling, and Challenges in Bio-Inspired Parameter Tuning of Vehicular Ad Hoc Networks for Environmental Sustainability. Sustainability 2023, 15, 4767. [Google Scholar] [CrossRef]
- Du, J.; Ahn, K.; Farag, M.; Rakha, H. Environmental and Safety Impacts of Vehicle-to-Everything Enabled Applications: A Review of State-of-the-Art Studies. arXiv 2021, arXiv:2202.01675. [Google Scholar]
- Lozano Domínguez, J.M.; Mateo Sanguino, T.J. Review on V2X, I2X, and P2X Communications and Their Applications: A Comprehensive Analysis over Time. Sensors 2019, 19, 2756. [Google Scholar] [CrossRef]
- Fauchet, E.; Laharotte, P.A.; Bhattacharyya, K.; El Faouzi, N.E. Sensitivity Analysis of Lagrangian-Based Variable Speed Limit Strategies apropos of Market Penetration and Spatial Distribution of Connected Vehicles. In Proceedings of the 102nd Annual Meeting of the Transportation Research Board, Washington, DC, USA, 8–12 January 2023. [Google Scholar]
- Sharma, A.; Zheng, Z.; Kim, J.; Bhaskar, A.; Haque, M.M. Assessing traffic disturbance, efficiency, and safety of the mixed traffic flow of connected vehicles and traditional vehicles by considering human factors. Transp. Res. Part C Emerg. Technol. 2021, 124, 102934. [Google Scholar] [CrossRef]
- Lopez, P.A.; Behrisch, M.; Bieker-Walz, L.; Erdmann, J.; Flötteröd, Y.P.; Hilbrich, R.; Lücken, L.; Rummel, J.; Wagner, P.; Wießner, E. Microscopic traffic simulation using sumo. In Proceedings of the 2018 21st International Conference on Intelligent Transportation Systems (ITSC), Maui, HI, USA, 4–7 November 2018; pp. 2575–2582. [Google Scholar]
- Park, B.; Schneeberger, J. Microscopic simulation model calibration and validation: Case study of VISSIM simulation model for a coordinated actuated signal system. Transp. Res. Rec. 2003, 1856, 185–192. [Google Scholar] [CrossRef]
- Park, B.; Qi, H. Microscopic simulation model calibration and validation for freeway work zone network-a case study of VISSIM. In Proceedings of the 2006 IEEE Intelligent Transportation Systems Conference, Toronto, ON, Canada, 17–20 September 2006; pp. 1471–1476. [Google Scholar]
- Pourabdollah, M.; Bjärkvik, E.; Fürer, F.; Lindenberg, B.; Burgdorf, K. Calibration and evaluation of car following models using real-world driving data. In Proceedings of the 2017 IEEE 20th International Conference on Intelligent Transportation Systems (ITSC), Yokohama, Japan, 16–19 October 2017; pp. 1–6. [Google Scholar]
- Bhattacharyya, K.; Maitra, B.; Boltze, M. Calibration of micro-simulation model parameters for heterogeneous traffic using mode-specific performance measure. Transp. Res. Rec. 2020, 2674, 135–147. [Google Scholar] [CrossRef]
- Krajzewicz, D.; Behrisch, M.; Wagner, P.; Luz, R.; Krumnow, M. Second generation of pollutant emission models for SUMO. In Proceedings of the Modeling Mobility with Open Data: 2nd SUMO Conference 2014, Berlin, Germany, 15–16 May 2014; Springer: Berlin/Heidelberg, Germany, 2015; pp. 203–221. [Google Scholar]
- Duret, A. Expérimentation d’une Régulation Dynamique des Vitesses sur A31 Méthodes D’élaboration des Algorithmes de Régulation; CETE de Lyon, PCI Régulation Dyamique des Réseaux de Transports: Lyon, France, 2013. [Google Scholar]
- Duret, A. A Multi-lane Capacity Model Designed for Variable Speed Limit Applications. Traffic Manag. 2016, 3, 183–201. [Google Scholar]
- Alison, S. Conception de Panneaux de Signalisation Qui Répondent aux Besoins et Préférences du Consommateur. Available online: https://www2.gnb.ca/content/dam/gnb/Departments/trans/pdf/fr/routeautoroute/Signalisationcommerciale/FormattedSign_Templates_Specifications-f.pdf (accessed on 2 June 2024).
- Bhattacharyya, K.; Laharotte, P.A.; Burianne, A.; El Faouzi, N.E. Assessing Connected Vehicle’s Response to Green Light Optimal Speed Advisory From Field Operational Test and Scaling Up. IEEE Trans. Intell. Transp. Syst. 2022, 24, 6725–6736. [Google Scholar] [CrossRef]
- Xue, L.; Yang, Y.; Dong, D. Roadside infrastructure planning scheme for the urban vehicular networks. Transp. Res. Procedia 2017, 25, 1380–1396. [Google Scholar] [CrossRef]
- Zhou, H.; Zhao, H.; Feng, Q.; Yin, Z.; Li, J.; Qin, K.; Li, M.; Cao, L. Effects of Environmental Parameters on Real-World Nox Emissions and Fuel Consumption for Heavy-Duty Diesel Trucks Using an OBD Approach; Technical Report, SAE Technical Paper; SAE: Warrendale, PA, USA, 2018. [Google Scholar]


Disclaimer/Publisher’s Note: The statements, opinions and data contained in all publications are solely those of the individual author(s) and contributor(s) and not of MDPI and/or the editor(s). MDPI and/or the editor(s) disclaim responsibility for any injury to people or property resulting from any ideas, methods, instructions or products referred to in the content. |
© 2024 by the authors. Licensee MDPI, Basel, Switzerland. This article is an open access article distributed under the terms and conditions of the Creative Commons Attribution (CC BY) license (https://creativecommons.org/licenses/by/4.0/).