
Energy Consumption of Electric Vehicles in Europe


Abstract
1. Introduction
2. Methods
2.1. Data Collection
2.2. Data Analysis
- Average real-world energy consumption [kWh/100 km] and drive range [km] as the arithmetic mean of the minimum and maximum values obtained from EVD [7];
- Average real-world drive range [km] based on the energy consumption data from Spritmonitor [28] by assuming direct proportionality between certified and real-world energy consumption and the corresponding drive ranges;
- Average price as the arithmetic mean of vehicle prices in Germany and the Netherlands.
3. Results
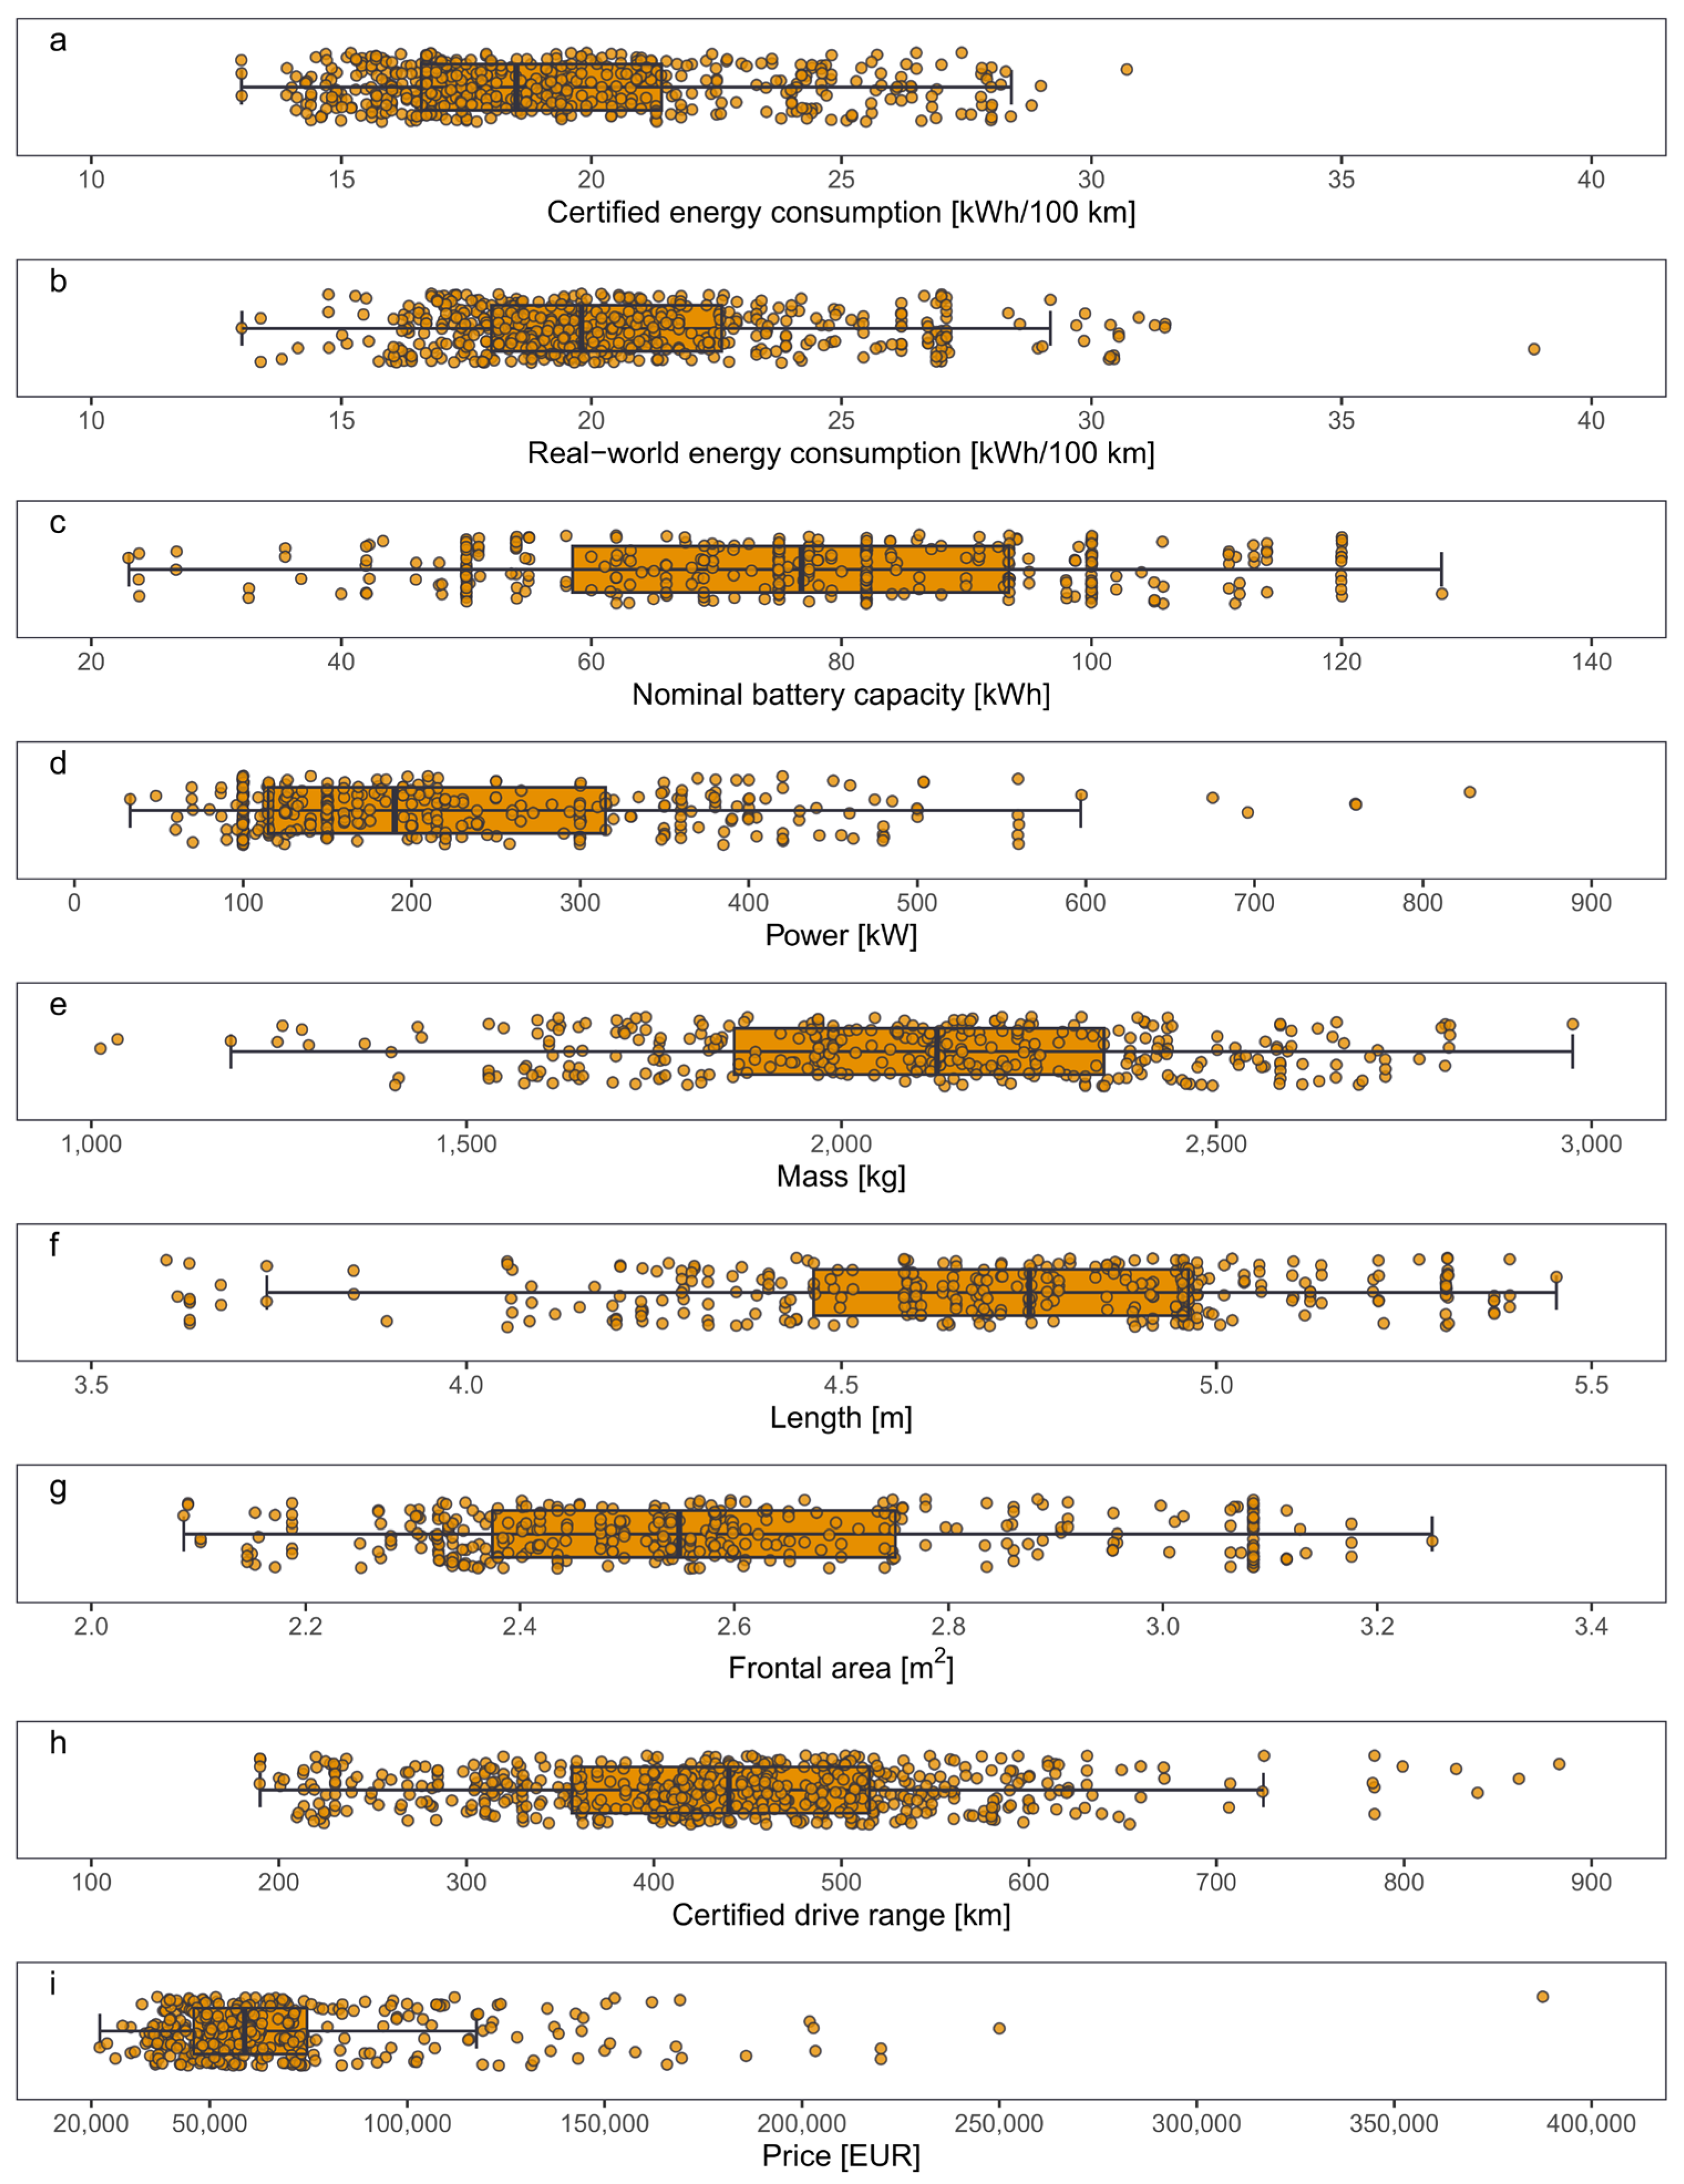
3.1. Overview—Vehicle Attributes
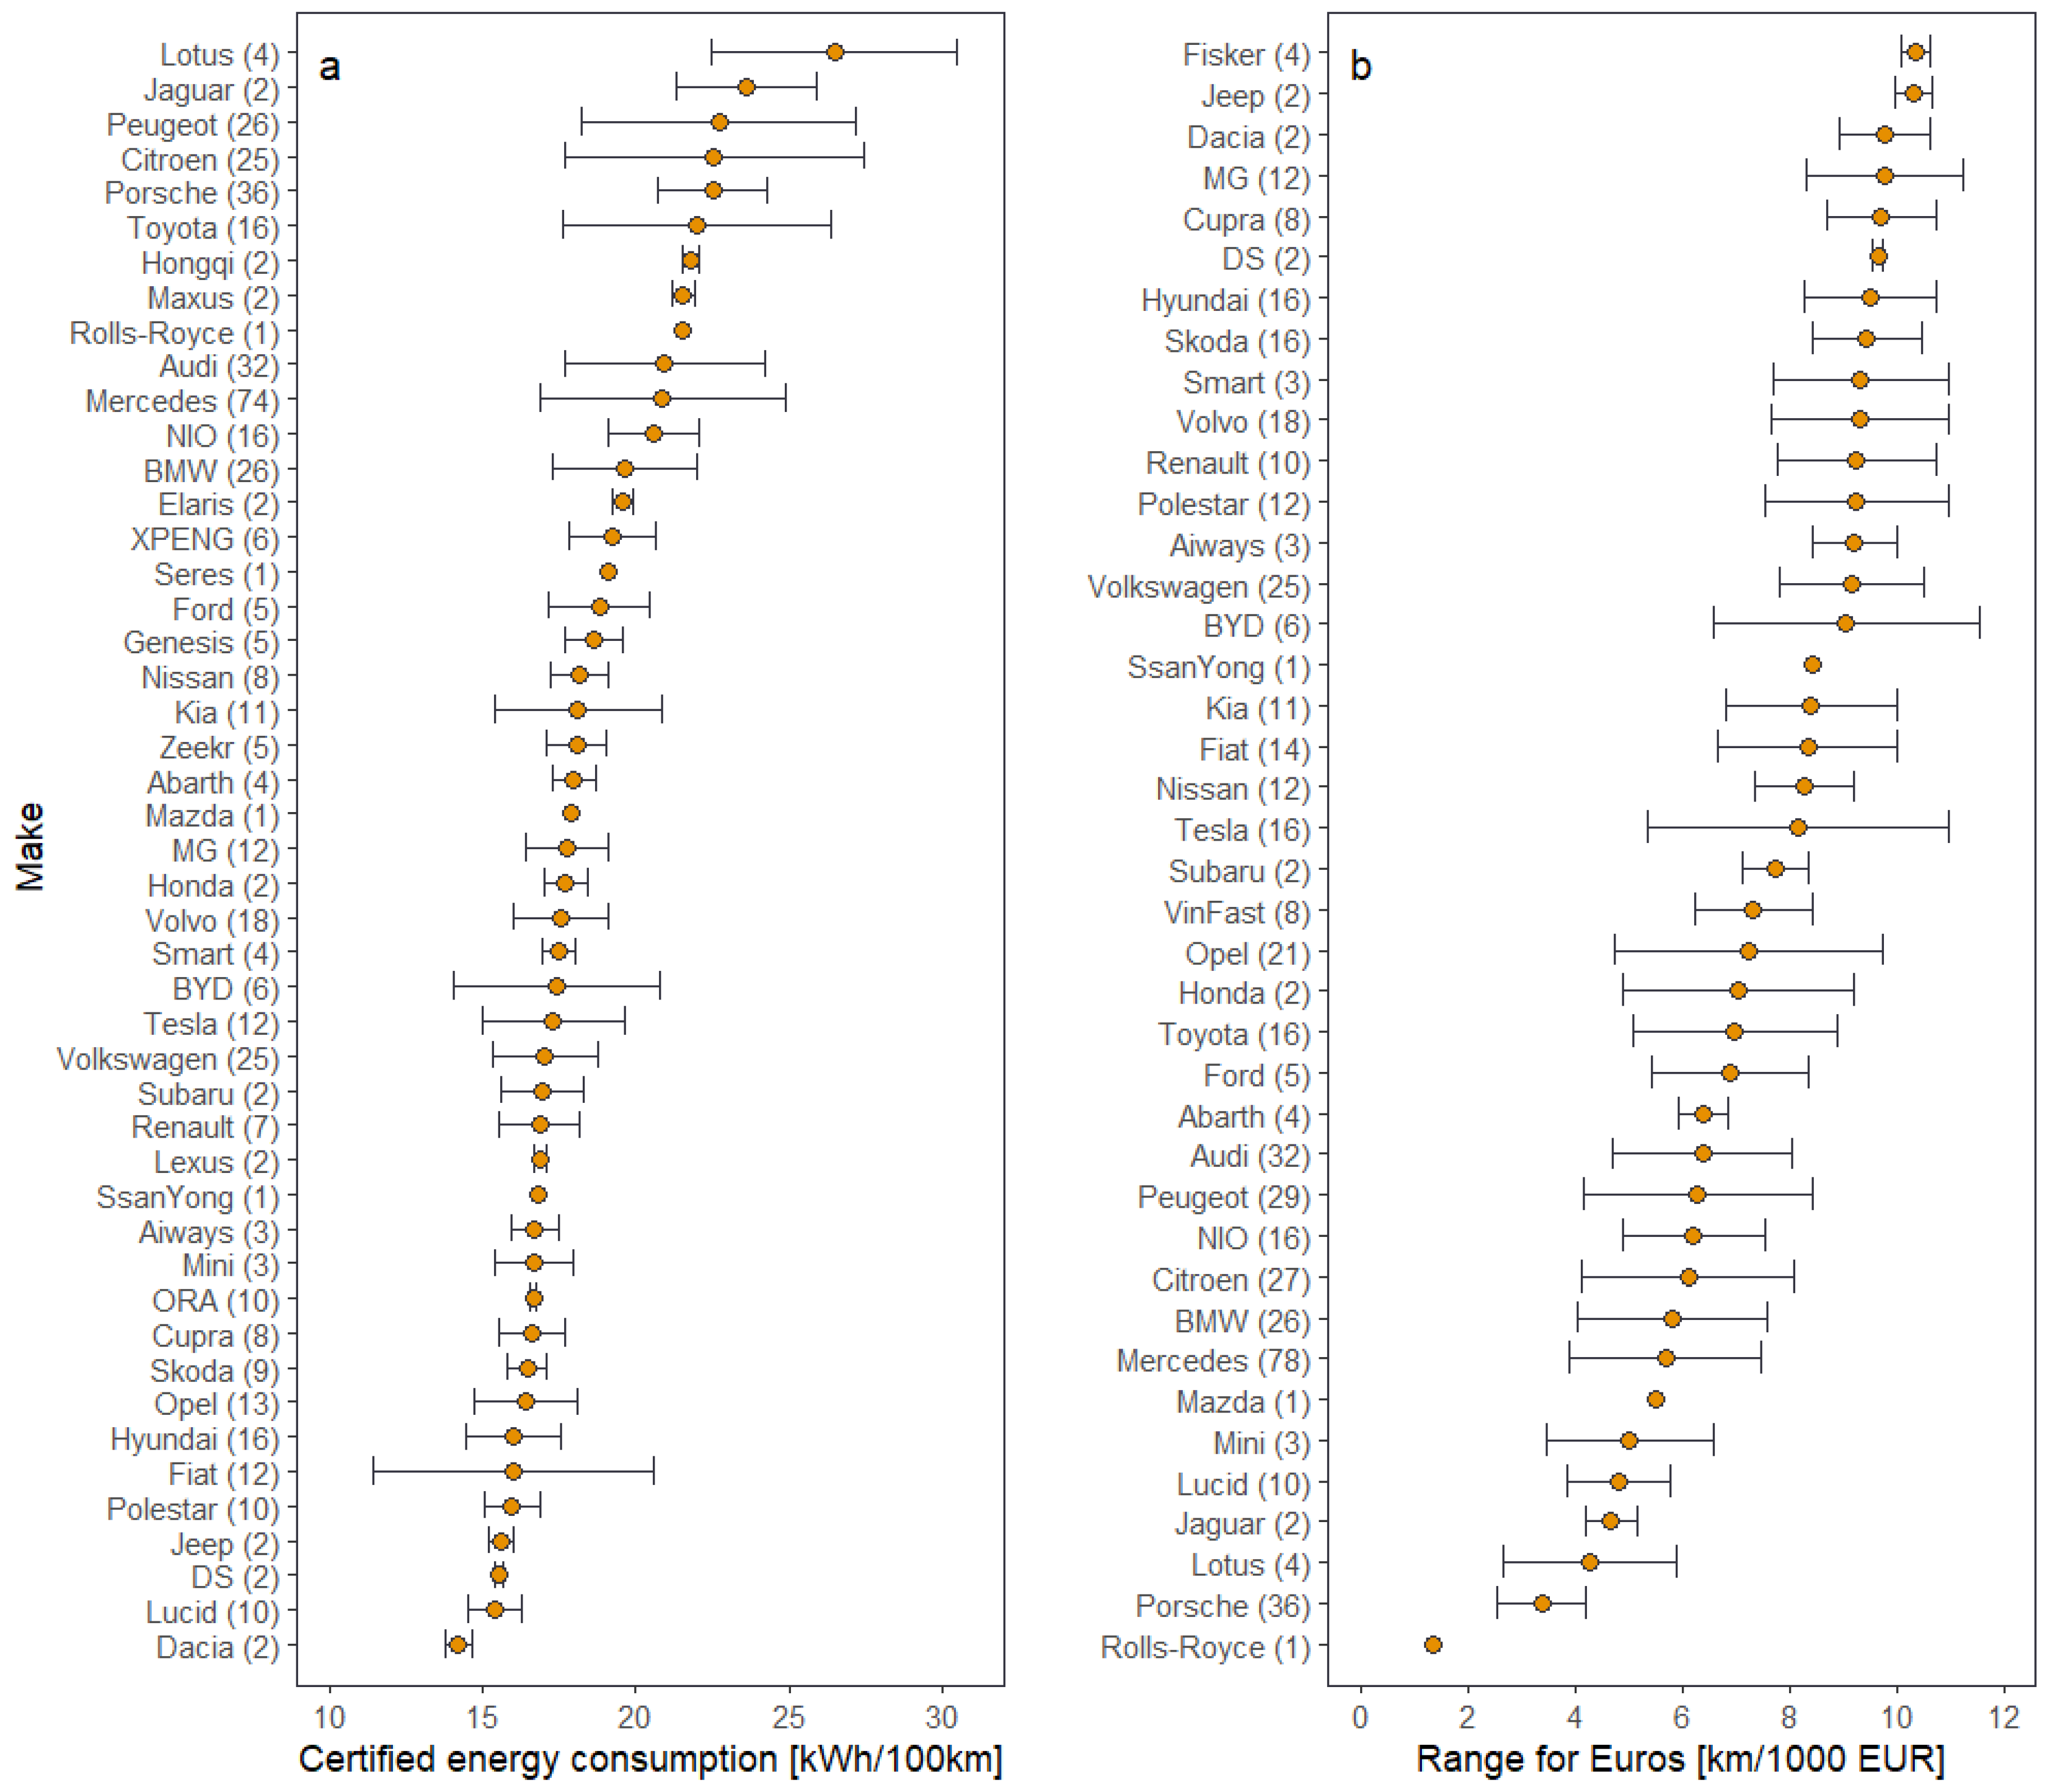
3.1.1. Energy Consumption
3.1.2. Other Vehicle Attributes
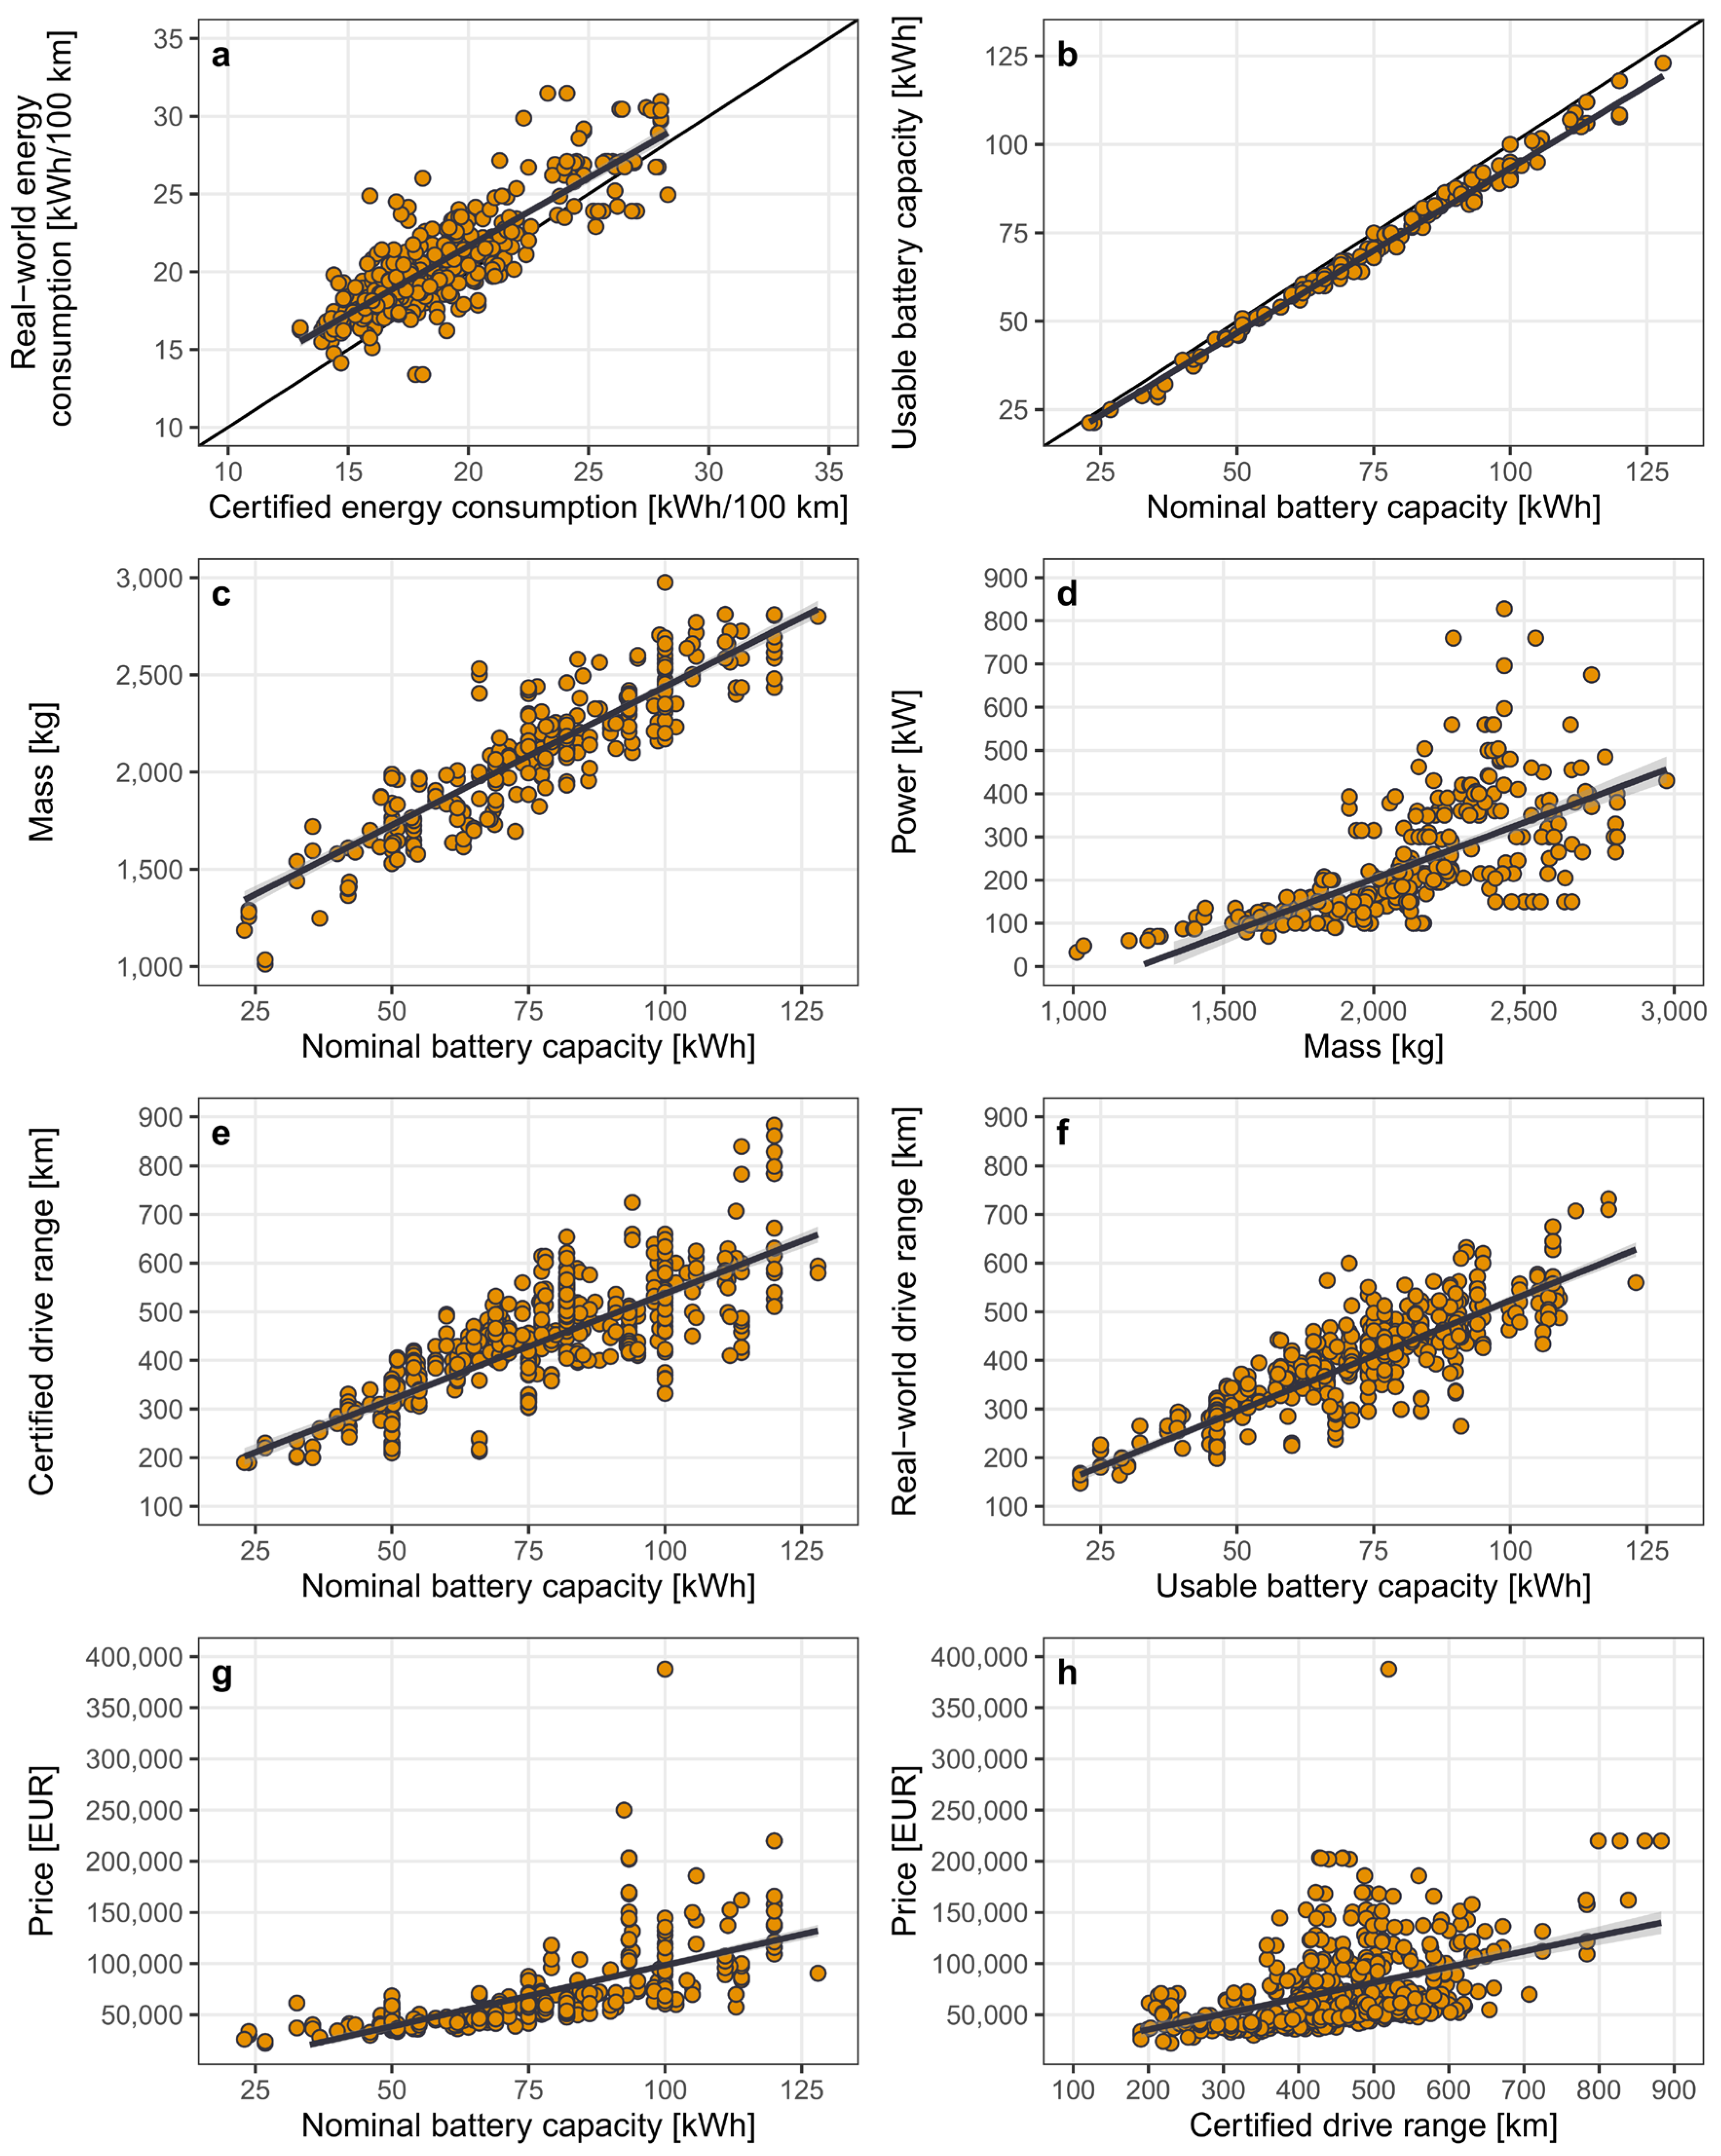
3.2. Regression Analyses—Efficiency Trade-Offs
- Each 100 kg of vehicle mass increases certified and real-world energy consumption by 0.20 ± 0.06 kWh/100 km and 0.17 ± 0.05 kWh/100 km, respectively (Figure 3a; Model 2); each doubling of mass increases certified and real-world energy consumption by around 24 ± 6% (Model 4).
- Each 1 m2 of frontal area increases certified and real-world energy consumption by 8.5 ± 0.6 kWh/100 km and 9.2 ± 0.5 kWh/100, respectively (Figure 3b; Model 2); each doubling of frontal area doubles the certified and real-world energy consumption (Model 4).
- Each 100 kW of rated power increases certified energy consumption by only 0.42 ± 0.18 kWh/100 km, whereas the effect on real-world energy consumption is insignificant (Figure 3c; Model 2); log-transformation suggests rated power does not significantly affect certified energy consumption and may slightly decrease real-world energy consumption (Model 4).
- All-wheel drive capability does not significantly increase certified energy consumption, but it tends to increase real-world energy consumption by 1.0 ± 0.3 kWh/100 km compared to two-wheel drivetrains (Model 2).
- Cheaper vehicles are more efficient (Figure 3f); vehicle prices cover a wide range and are weakly correlated with energy consumption; each 10,000 EUR of vehicle price increases certified and real-world energy consumption by some 0.3 ± 0.1 kWh/100 km (Model 1g); a doubling of vehicle price increases energy consumption by some 0.2 kWh/100 km (Model 3g).
- Each additional 10 kWh of nominal battery capacity increases certified and real-world energy consumption by 0.59 ± 0.07 kWh/100 km and 0.51 ± 0.07 kWh/100 km, respectively (Model 1e); each doubling of battery capacity increases certified and real-world energy consumption by around 20% (Model 3e).
- Each additional 100 km of drive range tends to decrease certified and real-world energy consumption by 0.86 ± 0.13 kWh/100 km and 0.88 ± 0.16 kWh/100 km, respectively (Model 1f); each doubling of drive range decreases certified and real-world energy consumption by 15 ± 3% and 12 ± 3%, respectively (Model 3f).
3.3. Complementary Regression Analyses
- Real-world energy consumption is significantly higher than certified energy consumption (Figure 4a); the discrepancy appears to decrease with higher consumption levels; each 1 kWh/100 km increase in certified energy consumption raises real-world energy consumption by only 0.88 ± 0.03 kwh/100 km (Model 1g).
- Usable battery capacity is generally below nominal battery capacity (Figure 4b); the discrepancy appears to increase for larger batteries; each 10 kWh increase in nominal battery capacity raises useable battery capacity by 9.3 ± 0.6 kWh (Model 1h).
- Each 10 kWh of nominal battery capacity increases vehicle mass by 143 ± 4 kg (Figure 4c); statistically, vehicles would weigh 1015 ± 34 kg without a battery (Model 1i), suggesting that the electric battery accounts for roughly half (i.e., 1100 ± 400 kg) of the average mass of electric vehicles (2102 ± 351 kg; Table 1).
- With each 0.1 m2 of frontal area, vehicle mass increases by 46 ± 6 kg (Model 1j).
- With each 100 kg of vehicle mass, power increases by 26 ± 2 kW (Figure 4d; Model 1k).
- Each 10 kWh of nominal battery capacity adds some 45 ± 2 km of drive range during both certification and real-world driving (Figure 4e,f; Models 1k and 1l); a doubling of both nominal and usable battery capacity tends to increase certified and real-world drive range by 80% (Models 3l and 3m).
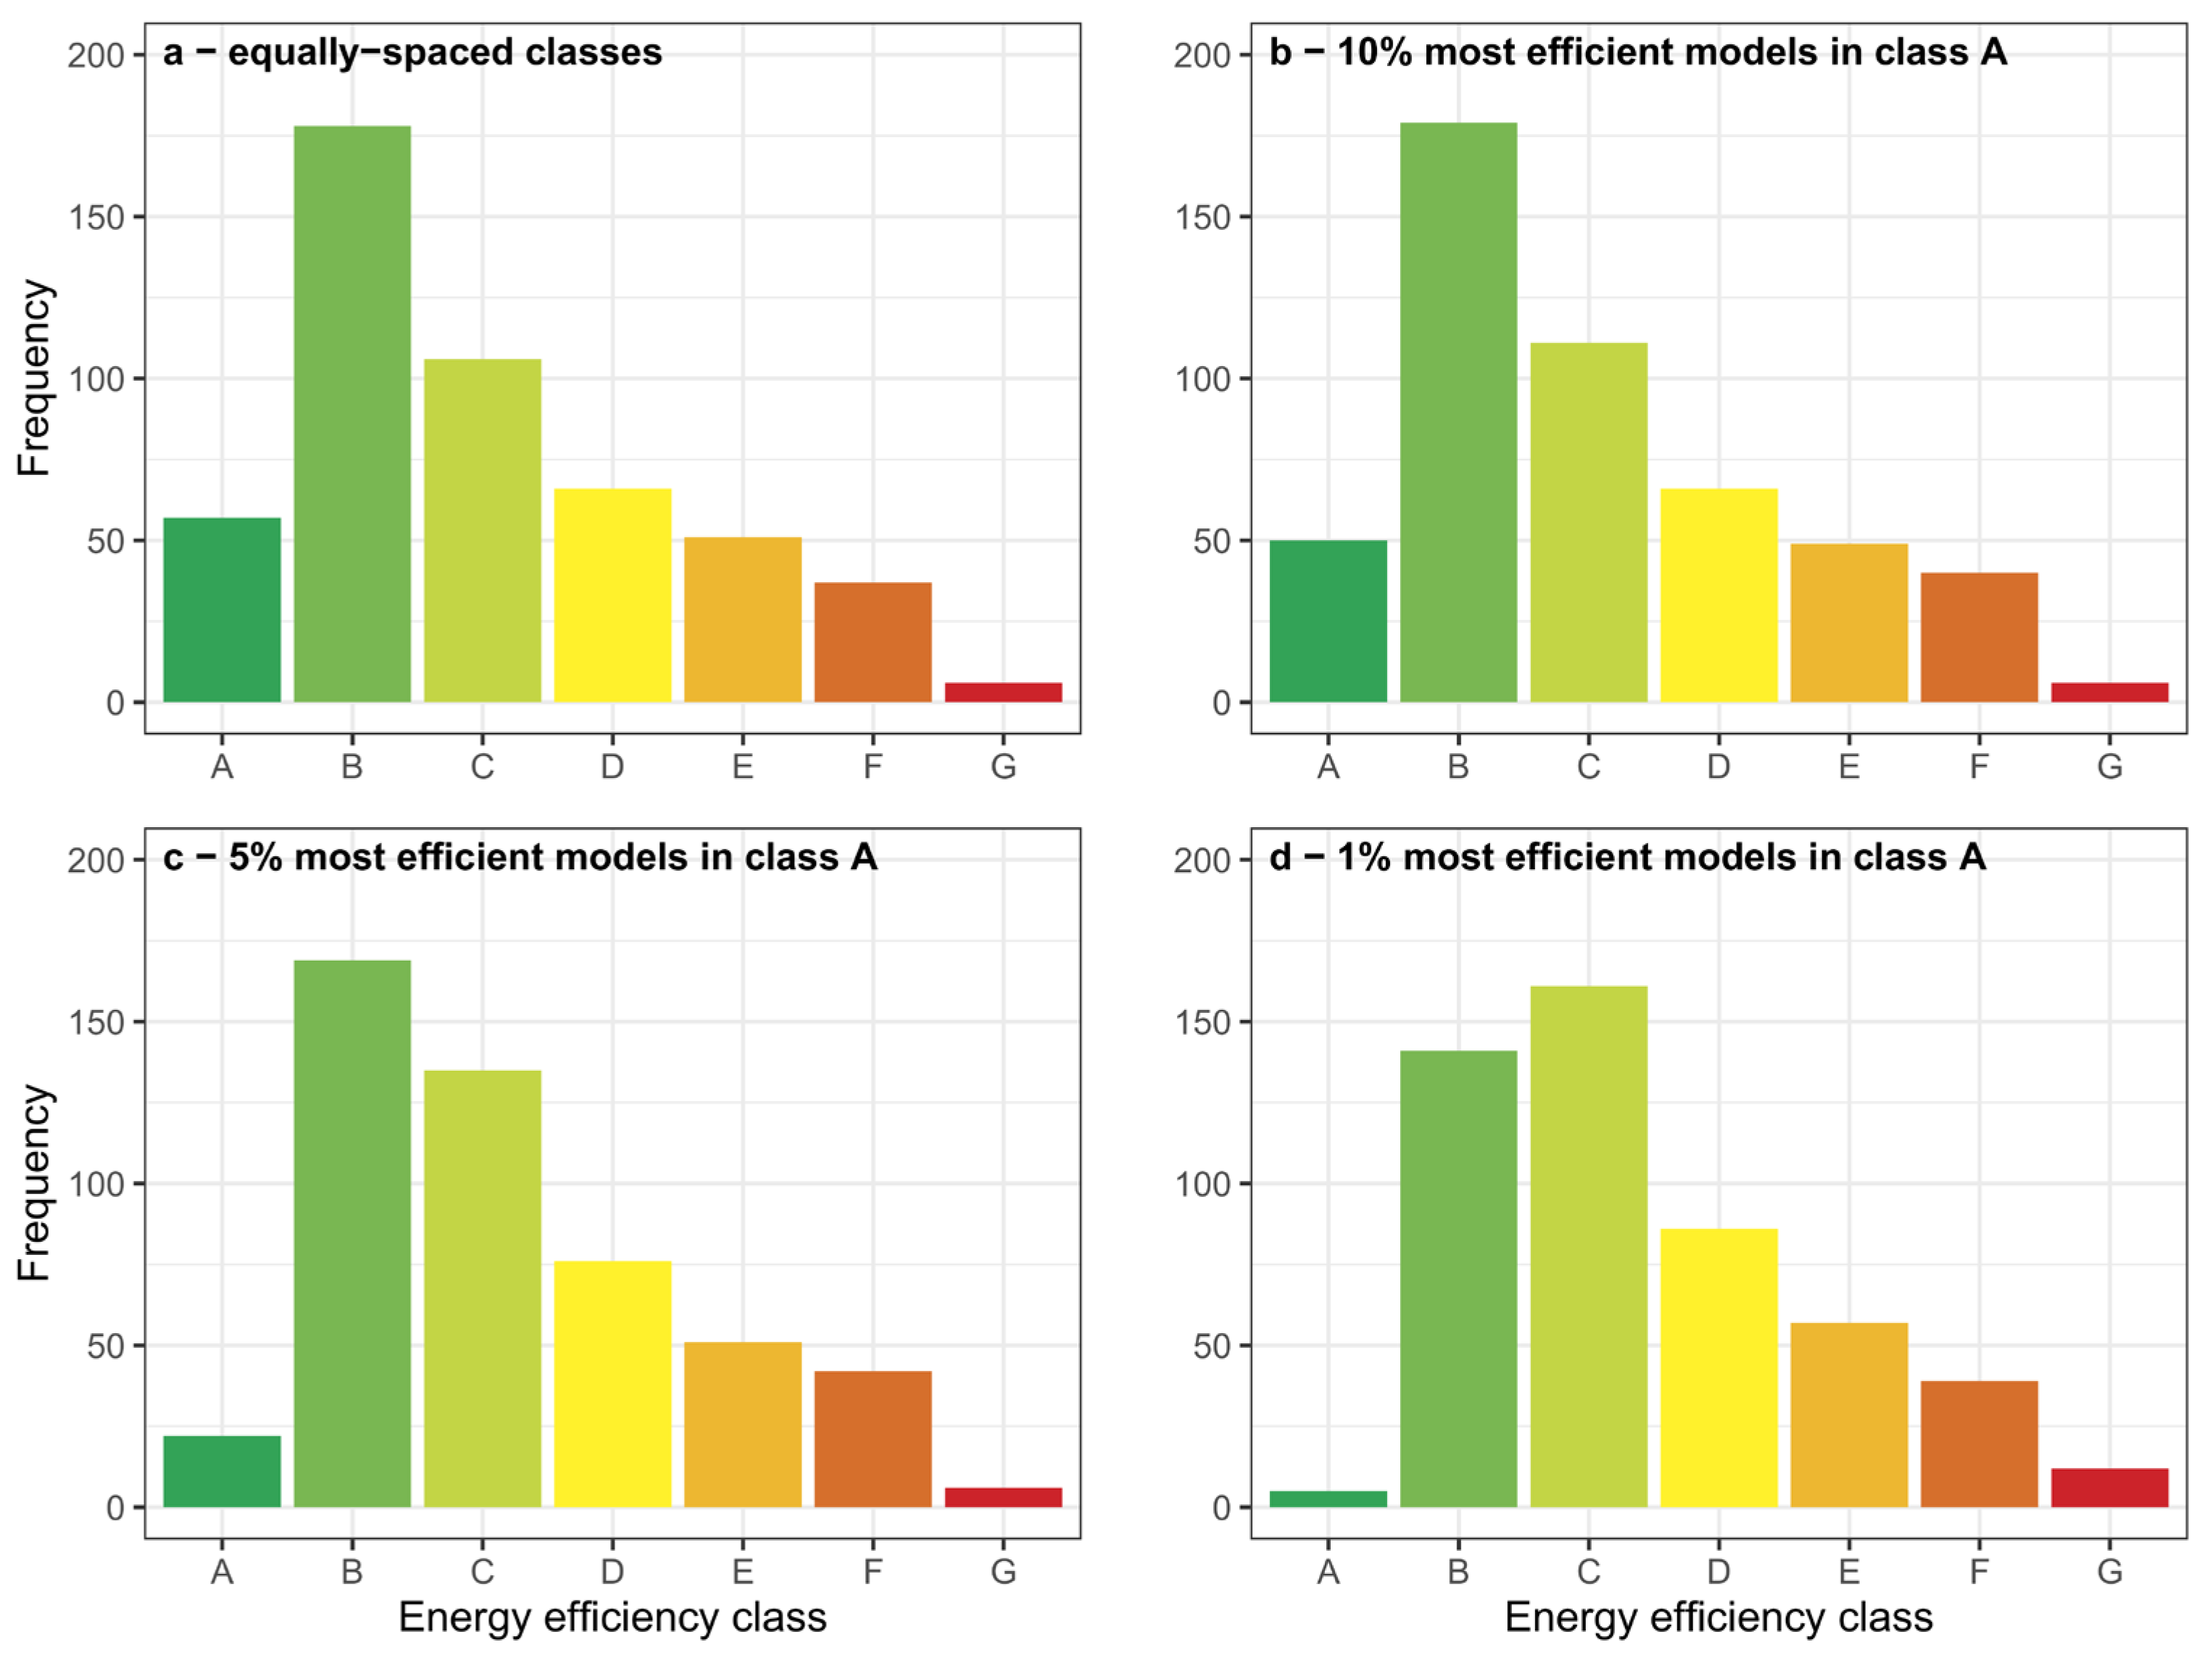
3.4. Energy Labeling of Electric Cars
- Relevant—to distinguish energy efficient from less energy efficient vehicles, thereby driving innovation and supporting informed consumer choices.
- Accurate—to correctly reflect the energy consumption experienced by consumers on the road under normal operating conditions.
- Accessible—to communicate information in a clear manner.
- Long-lasting—to remain relevant over time by being as technologically neutral and accommodating of innovation as possible.
4. Discussion
4.1. Strengths and Limitations of the Research
- Timeliness: While our results may hold for the short-term future and vehicle markets outside Europe, they will become less accurate over time. Incremental innovation, technological breakthroughs, and pricing policy in a growing and increasingly diverse market will affect vehicle attributes and efficiency trade-offs.
- Vehicle sales: We capture models available on the market but not actual vehicle sales. Therefore, our findings characterize the electric car market but not the fleet of electric cars operated on the road. Caution should be applied when using our energy consumption data for fleet-wide energy and emissions modeling.
- Vehicle models: Drawing the boundary of what constitutes a model, rather than a variant or version of a model, is not straightforward. We consider vehicles to be individual models if they differ by name or battery capacity. This way, technically similar vehicles such as Citroen e-SpaceTrourer, Fiat e-Ulysses, Peugeot e-Traveller, Opel Zafira, and Toyota Proace are included as individual models in our analysis. This approach causes an overrepresentation of vehicles that are similar but sold by several manufacturers. However, we consider this approach to be practical and justifiable given the challenges associated with implementing alternative system boundaries.
- Energy consumption: Real-world energy consumption values can vary greatly depending on, e.g., ambient temperature, drivers’ behavior, or road profile. Furthermore, data samples in Spritmonitor [28] are still small for most models. Overall, we consider our data to be indicative of the real-world energy consumption and operating conditions, although they may not capture all specific conditions, such as very low winter temperatures.
- System boundary: We focus here on the energy consumption related to vehicle use. It is beyond the scope of this research to evaluate the overall energetic and environmental impacts of electric vehicles, which requires a holistic life-cycle assessment, including vehicle production, end-of-life treatment, and electricity generation (e.g., [39,40,41,42]).
- Regression analysis: The coefficients of determination suggest that both the linear and power-law regression models fit our data similarly well. However, the regression coefficients of both models are only robust if the underlying data meet certain criteria, such as normality, homogeneity, and independence [43]. Regression residuals should be uncorrelated with the independent variable. The diagnostic plots in Figures S1–S50 in the Supplementary Material suggest that this requirement may not always be met and that residuals can be heteroscedastic. We address the observed heteroscedasticity by estimating heteroscedasticity-robust standard errors for all regression coefficients [33].
4.2. Comparison of Results
4.3. Implications for Policymakers
4.3.1. Deviation between Certified and Real-World Energy Consumption
4.3.2. Energy Labeling
4.3.3. Efficiency Improvements
5. Conclusions
- As of 2023, a large variety of electric cars and vans is available on the market; their certified and real-world energy consumption ranges from 13 to 30 kWh/100 km and averages 19 ± 4 kWh/100 km and 21 ± 4 kWh/100 km, respectively.
- There are considerable efficiency trade-offs; energy consumption is positively correlated with frontal area, vehicle mass, and battery capacity, but less so with rated power and vehicle price; energy consumption is negatively correlated with drive range, indicating that improved powertrain efficiency is an important factor for extending the drive range of electric vehicles.
- The electric battery accounts for half of the vehicle mass and is thereby an important driver of energy consumption; our regression analysis confirms that increasing the energy density of batteries would indeed benefit both the energy consumption and the drive range of vehicles.
- Real-world energy consumption tends to be higher than certified energy consumption, suggesting that the type approval test systematically underestimates the energy consumption of electric vehicles on the road; policymakers should monitor the situation and adapt the test procedure if needed.
- Efficient vehicles are available at any price, but drive range has a cost; this finding points to important price-range trade-offs, which should be made transparent to consumers when purchasing electric vehicles.
- The large variability in energy consumption values suggests there is a need to inform consumers about the energy use, energy-related costs, and efficiency trade-offs of electric cars through a dedicated energy label.
Supplementary Materials
Author Contributions
Funding
Institutional Review Board Statement
Informed Consent Statement
Data Availability Statement
Acknowledgments
Conflicts of Interest
Abbreviations
| kg | kilogram |
| km | kilometer |
| kW | kilowatt |
| kWh | kilowatt-hour |
| m | meter |
| MAX | maximum value |
| MIN | minimum value |
| SD | standard deviation |
| TEH | ‘test energy high’-energy consumption value for the vehicle configuration with the highest energy consumption during type approval |
| TEL | ‘test energy low’-energy consumption value for the vehicle configuration with the lowest energy consumption during type approval |
Appendix A


| Energy Consumption | Coefficient | Value | Standard Error | t Value | Pr (>abs t) | p Value | Adjusted R2 |
|---|---|---|---|---|---|---|---|
| Model 1a: energy consumption = α + β × mass | |||||||
| Certified | (Intercept) *** | 7.11 | 0.65 | 10.98 | 2.97 × 10⁻²⁵ | <2.2 × 10⁻¹⁶ | 0.30 |
| Mass *** | 5.80 × 10⁻³ | 3.21 × 10⁻⁴ | 18.07 | 1.56 × 10−56 | |||
| Real-world | (Intercept) *** | 9.47 | 0.61 | 15.42 | 4.40 × 10−44 | <2.2 × 10⁻¹⁶ | 0.26 |
| Mass *** | 5.44 × 10⁻³ | 3.19 × 10⁻⁴ | 17.03 | 1.63 × 10−51 | |||
| Model 1b: energy consumption = α + β × power | |||||||
| Certified | (Intercept) *** | 18.12 | 0.37 | 48.73 | 7.69 × 10−192 | 6.41 × 10⁻⁵ | 0.04 |
| Power *** | 5.33 × 10⁻³ | 1.32 × 10⁻³ | 4.03 | 6.41 × 10⁻⁵ | |||
| Real-world | (Intercept) *** | 20.13 | 0.34 | 59.24 | 1.35 × 10−226 | 2.36 × 10⁻² | <0.01 |
| Power ** | 2.70 × 10⁻³ | 1.19 × 10⁻³ | 2.27 | 2.36 × 10⁻² | |||
| Model 1c: energy consumption = α + β × frontal area | |||||||
| Certified | (Intercept) *** | −4.24 | 1.23 | −3.46 | 5.82 × 10⁻⁴ | <2.2 × 10⁻¹⁶ | 0.45 |
| Frontal area *** | 9.15 | 0.47 | 19.36 | 1.05 × 10−62 | |||
| Real-world | (Intercept) *** | −5.30 | 0.99 | −5.35 | 1.38 × 10⁻⁷ | <2.2 × 10⁻¹⁶ | 0.56 |
| Frontal area *** | 10.08 | 0.38 | 26.62 | 1.65 × 10−97 | |||
| Model 1d: energy consumption = α + β × all-wheel drive | |||||||
| Certified | (Intercept) *** | 18.75 | 0.24 | 78.77 | 1.20 × 10−283 | 5.90 × 10⁻⁶ | 0.04 |
| All-wheel drive *** | 1.45 | 0.32 | 4.58 | 5.90 × 10⁻⁶ | |||
| Real-world | (Intercept) *** | 20.25 | 0.23 | 88.68 | 1.43 × 10−305 | 1.11 × 10⁻⁴ | 0.02 |
| All-wheel drive *** | 1.23 | 0.32 | 3.90 | 1.11 × 10⁻⁴ | |||
| Model 1e: energy consumption = α + β × nominal battery capacity | |||||||
| Certified | (Intercept) *** | 14.78 | 0.57 | 25.84 | 4.65 × 10−94 | 1.50 × 10⁻¹⁵ | 0.12 |
| Nominal battery capacity *** | 5.94 × 10⁻² | 7.21 × 10⁻³ | 8.24 | 1.50 × 10⁻¹⁵ | |||
| Real-world | (Intercept) *** | 16.94 | 0.55 | 31.04 | 3.72 × 10−118 | 2.07 × 10⁻¹² | 0.09 |
| Nominal battery capacity *** | 5.08 × 10⁻² | 7.04 × 10⁻³ | 7.21 | 2.07 × 10⁻¹² | |||
| Model 1f: energy consumption = α + β × drive range | |||||||
| Certified | (Intercept) *** | 23.14 | 0.68 | 33.83 | 3.82 × 10−131 | 3.03 × 10⁻¹⁰ | 0.08 |
| Drive range *** | −8.55 × 10⁻³ | 1.33 × 10⁻³ | −6.43 | 3.03 × 10⁻¹⁰ | |||
| Real-world | (Intercept) *** | 24.07 | 0.72 | 33.26 | 3.72 × 10−128 | 9.49 × 10⁻⁸ | 0.06 |
| Drive range *** | −8.77 × 10⁻³ | 1.62 × 10⁻³ | −5.42 | 9.49 × 10⁻⁸ | |||
| Model 1g: energy consumption = α + β × price | |||||||
| Certified | (Intercept) *** | 16.99 | 0.39 | 43.42 | 6.50 × 10−171 | 1.41 × 10⁻⁹ | 0.13 |
| Price *** | 3.29 × 10⁻⁵ | 5.33 × 10⁻⁶ | 6.17 | 1.41 × 10⁻⁹ | |||
| Real-world | (Intercept) *** | 18.98 | 0.38 | 49.71 | 9.38 × 10−194 | 4.02 × 10⁻⁶ | 0.06 |
| Price *** | 2.63 × 10⁻⁵ | 5.65 × 10⁻⁶ | 4.66 | 4.02 × 10⁻⁶ | |||
| Model 2: energy consumption = α + β × mass + β × power + β × frontal area + β × all-wheel drive | |||||||
| Certified | (Intercept) *** | −7.96 | 1.21 | −6.59 | 1.10 × 10⁻¹⁰ | <2.2 × 10⁻¹⁶ | 0.55 |
| Mass *** | 2.03 × 10⁻³ | 5.76 × 10⁻⁴ | 3.53 | 4.60 × 10⁻⁴ | |||
| Power ** | 4.16 × 10⁻³ | 1.83 × 10⁻³ | 2.27 | 2.35 × 10⁻² | |||
| Frontal area *** | 8.52 | 0.59 | 14.35 | 2.63 × 10−39 | |||
| All-wheel drive | 0.16 | 0.36 | 0.44 | 0.66 | |||
| Real-world | (Intercept) *** | −6.43 | 0.95 | −6.78 | 3.37 × 10⁻¹¹ | <2.2 × 10⁻¹⁶ | 0.60 |
| Mass *** | 1.65 × 10⁻³ | 5.17 × 10⁻⁴ | 3.19 | 1.49 × 10⁻³ | |||
| Power | −1.34 × 10⁻³ | 1.47 × 10⁻³ | −0.91 | 0.36 | |||
| Frontal area *** | 9.16 | 0.50 | 18.48 | 2.74 × 10−58 | |||
| All-wheel drive *** | 1.02 | 0.34 | 3.01 | 2.74 × 10⁻³ | |||
| Model 3a: log(energy consumption) = α + β × log(mass) | |||||||
| log(Certified) | (Intercept) *** | −1.61 | 0.23 | −6.89 | 1.66 × 10⁻¹¹ | <2.2 × 10⁻¹⁶ | 0.32 |
| log(Mass) *** | 0.60 | 3.07 × 10⁻² | 19.42 | 5.80 × 10−63 | |||
| log(Real-world) | (Intercept) *** | −0.96 | 0.20 | −4.83 | 1.86 × 10⁻⁶ | <2.2 × 10⁻¹⁶ | 0.30 |
| log(Mass) *** | 0.52 | 2.65 × 10⁻² | 19.75 | 2.12 × 10−64 | |||
| Model 3b: log(energy consumption) = α + β × log(power) | |||||||
| log(Certified) | (Intercept) *** | 2.57 | 8.47 × 10⁻² | 30.35 | 2.19 × 10−115 | 5.76 × 10⁻⁶ | 0.05 |
| log(Power) *** | 7.11 × 10⁻² | 1.55 × 10⁻² | 4.58 | 5.76 × 10⁻⁶ | |||
| log(Real-world) | (Intercept) *** | 2.78 | 7.69 × 10⁻² | 36.17 | 5.84 × 10−141 | 1.73 × 10⁻³ | 0.02 |
| log(Power) *** | 4.47 × 10⁻² | 1.42 × 10⁻² | 3.15 | 1.73 × 10⁻³ | |||
| Model 3c: log(energy consumption) = α + β × log(frontal area) | |||||||
| log(Certified) | (Intercept) *** | 1.83 | 5.72 × 10⁻² | 32.01 | 4.60 × 10−123 | <2.2 × 10⁻¹⁶ | 0.43 |
| log(Frontal area) *** | 1.18 | 5.93 × 10⁻² | 19.93 | 1.84 × 10−65 | |||
| log(Real-world) | (Intercept) *** | 1.85 | 4.19 × 10⁻² | 44.21 | 8.20 × 10−174 | <2.2 × 10⁻¹⁶ | 0.57 |
| log(Frontal area) *** | 1.23 | 4.31 × 10⁻² | 28.62 | 6.06 × 10−107 | |||
| Model 3d: log(energy consumption) = α + β × all-wheel drive | |||||||
| log(Certified) | (Intercept) *** | 2.91 | 1.17 × 10⁻² | 248.07 | 0.00 | 9.35 × 10⁻⁸ | 0.05 |
| All-wheel drive *** | 8.44 × 10⁻² | 1.56 × 10⁻² | 5.42 | 9.35 × 10⁻⁸ | |||
| log(Real-world) | (Intercept) *** | 2.99 | 1.06 × 10⁻² | 281.06 | 0.00 | 1.90 × 10⁻⁶ | 0.04 |
| All-wheel drive *** | 6.83 × 10⁻² | 1.42 × 10⁻² | 4.82 | 1.90 × 10⁻⁶ | |||
| Model 3e: log(energy consumption) = α + β × log(nominal battery capacity) | |||||||
| log(Certified) | (Intercept) *** | 1.98 | 0.10 | 19.77 | 1.18 × 10−64 | <2.2 × 10⁻¹⁶ | 0.14 |
| log(Nominal battery capacity) *** | 0.22 | 2.33 × 10⁻² | 9.63 | 3.04 × 10⁻²⁰ | |||
| log(Real-world) | (Intercept) *** | 2.23 | 8.61 × 10⁻² | 25.94 | 3.12 × 10−94 | <2.2 × 10⁻¹⁶ | 0.12 |
| log(Nominal battery capacity) *** | 0.18 | 2.01 × 10⁻² | 9.17 | 1.23 × 10⁻¹⁸ | |||
| Model 3f: log(energy consumption) = α + β × log(drive range) | |||||||
| log(Certified) | (Intercept) *** | 3.85 | 0.20 | 19.56 | 1.27 × 10−63 | 3.83 × 10⁻⁶ | 0.05 |
| log(Certified drive range) *** | −0.15 | 3.20 × 10⁻² | −4.63 | 3.83 × 10⁻⁶ | |||
| log(Real-world) | (Intercept) *** | 3.70 | 0.18 | 20.27 | 6.07 × 10−67 | 1.46 × 10⁻⁴ | 0.04 |
| log(Real-world drive range) *** | −0.12 | 3.03 × 10⁻² | −3.83 | 1.46 × 10⁻⁴ | |||
| Model 3g: log(energy consumption) = α + β × log(price) | |||||||
| log(Certified) | (Intercept) *** | 0.79 | 0.18 | 4.29 | 2.18 × 10⁻⁵ | <2.2 × 10⁻¹⁶ | 0.23 |
| log(Price) *** | 0.19 | 1.68 × 10⁻² | 11.55 | 1.69 × 10⁻²⁷ | |||
| log(Real-world) | (Intercept) *** | 1.22 | 0.19 | 6.28 | 7.35 × 10⁻¹⁰ | <2.2 × 10⁻¹⁶ | 0.16 |
| log(Price) *** | 0.16 | 1.78 × 10⁻² | 9.18 | 1.21 × 10⁻¹⁸ | |||
| Model 4: log(energy consumption) = α + β × log(mass) + β × log(power) + β × log(frontal area) + β × all-wheel drive | |||||||
| log(Certified) | (Intercept) | 2.96 × 10⁻² | 0.38 | 7.85 × 10⁻² | 0.94 | <2.2 × 10⁻¹⁶ | 0.54 |
| log(Mass) *** | 0.24 | 6.51 × 10⁻² | 3.73 | 2.10 × 10⁻⁴ | |||
| log(Power) | 1.29 × 10⁻² | 2.37 × 10⁻² | 0.54 | 0.59 | |||
| log(Frontal area) *** | 1.03 | 7.71 × 10⁻² | 13.41 | 3.28 × 10⁻³⁵ | |||
| All-wheel drive ** | 3.99 × 10⁻² | 1.90 × 10⁻² | 2.10 | 3.59 × 10⁻² | |||
| log(Real-world) | (Intercept) | 0.45 | 0.33 | 1.36 | 0.18 | <2.2 × 10⁻¹⁶ | 0.63 |
| log(Mass) *** | 0.24 | 6.04 × 10⁻² | 4.04 | 6.25 × 10⁻⁵ | |||
| log(Power) *** | −5.49 × 10⁻² | 1.96 × 10⁻² | −2.80 | 5.38 × 10⁻³ | |||
| log(Frontal area) *** | 1.02 | 6.93 × 10⁻² | 14.75 | 5.21 × 10−41 | |||
| All-wheel drive *** | 7.19 × 10⁻² | 1.48 × 10⁻² | 4.86 | 1.59 × 10⁻⁶ | |||
| Coefficient | Value | Standard Error | t Value | Pr (>abs t) | p Value | Adjusted R2 | |
|---|---|---|---|---|---|---|---|
| Real-world vs. Certified energy consumption | Model 1g: real-world energy consumption = α + β × certified energy consumption | ||||||
| (Intercept) *** | 4.11 | 0.48 | 8.63 | 1.44 × 10⁻¹⁶ | <2.2 × 10⁻¹⁶ | 0.75 | |
| Certified energy consumption *** | 0.88 | 2.65 × 10⁻² | 33.14 | 8.93 × 10−118 | |||
| Usable vs. Nominal battery capacity | Model 1h: usable battery capacity = α + β × nominal battery capacity | ||||||
| (Intercept) | 6.41 × 10⁻² | 0.41 | 0.16 | 0.88 | <2.2 × 10⁻¹⁶ | 0.99 | |
| Nominal battery capacity *** | 0.93 | 6.18 × 10⁻³ | 150.85 | 1.56 × 10−313 | |||
| Mass vs. Nominal battery capacity | Model 1i: mass = α + β × nominal battery capacity | ||||||
| (Intercept) *** | 1015 | 34 | 29.83 | 6.28 × 10−97 | <2.2 × 10⁻¹⁶ | 0.79 | |
| Nominal battery capacity *** | 14.25 | 0.41 | 34.41 | 8.42 × 10−113 | |||
| Mass vs. Frontal area | Model 1j: mass = α + β × frontal area | ||||||
| (Intercept) *** | 697 | 184 | 3.79 | 1.79 × 10⁻⁴ | 1.44 × 10⁻¹³ | 0.18 | |
| Frontal area *** | 460 | 60 | 7.71 | 1.44 × 10⁻¹³ | |||
| Power vs. Mass | Model 1k: power = α + β × mass | ||||||
| (Intercept) *** | −315 | 29 | −11.05 | 1.90 × 10⁻²⁴ | <2.2 × 10⁻¹⁶ | 0.43 | |
| Mass *** | 0.26 | 1.52 × 10⁻² | 17.10 | 9.77 × 10−48 | |||
| Certified drive range vs. Nominal battery capacity | Model 1l: certified drive range = α + β × nominal battery capacity | ||||||
| (Intercept) *** | 102 | 12 | 8.86 | 1.14 × 10⁻¹⁷ | <2.2 × 10⁻¹⁶ | 0.60 | |
| Nominal battery capacity *** | 4.35 | 0.16 | 27.13 | 1.60 × 10−103 | |||
| Real-world drive range vs. Usable battery capacity | Model 1m: real-world drive range = α + β × usable battery capacity | ||||||
| (Intercept) *** | 68 | 8 | 8.37 | 6.10 × 10⁻¹⁶ | <2.2 × 10⁻¹⁶ | 0.71 | |
| Usable battery capacity *** | 4.56 | 0.12 | 36.99 | 1.82 × 10−144 | |||
| Price vs. Nominal battery capacity | Model 1n: price = α + β × nominal battery capacity | ||||||
| (Intercept) *** | −21,119 | 3681 | −5.74 | 1.45 × 10⁻⁸ | <2.2 × 10⁻¹⁶ | 0.43 | |
| Nominal battery capacity *** | 1196 | 59 | 20.23 | 1.57 × 10−71 | |||
| Price vs. Certified drive range | Model 1o: price = α + β × certified drive range | ||||||
| (Intercept) | 5105 | 4880 | 1.05 | 0.30 | <2.2 × 10⁻¹⁶ | 0.22 | |
| Certified drive range *** | 153 | 12 | 12.39 | 2.99 × 10⁻³¹ | |||
| log(Real-world energy consumption) vs. log(Certified energy consumption) | Model 3g: log(real-world energy consumption) = α + β × log(certified energy consumption) | ||||||
| (Intercept) *** | 0.70 | 6.22 × 10⁻² | 11.20 | 1.41 × 10⁻²⁵ | <2.2 × 10⁻¹⁶ | 0.73 | |
| log(Certified energy consumption) *** | 0.79 | 2.14 × 10⁻² | 37.03 | 1.47 × 10−132 | |||
| log(Usable battery capacity) vs. log(Nominal battery capacity) | Model 3h: log(usable battery capacity) = α + β × log(nominal battery capacity) | ||||||
| (Intercept) *** | −0.12 | 2.54 × 10⁻² | −4.55 | 7.65 × 10⁻⁶ | <2.2 × 10⁻¹⁶ | 0.99 | |
| log(Nominal battery capacity) *** | 1.01 | 5.91 × 10⁻³ | 170.98 | 0.00 | |||
| log(Mass) vs. log(Nominal battery capacity) | Model 3i: log(mass) = α + β × log(nominal battery capacity) | ||||||
| (Intercept) *** | 5.51 | 6.95 × 10⁻² | 79.36 | 1.82 × 10−221 | <2.2 × 10⁻¹⁶ | 0.80 | |
| log(Nominal battery capacity) *** | 0.50 | 1.58 × 10⁻² | 31.41 | 1.54 × 10−102 | |||
| log(Mass) vs. log(Frontal area) | Model 3j: log(mass) = α + β × log(frontal area) | ||||||
| (Intercept) *** | 6.76 | 0.11 | 60.32 | 1.14 × 10−183 | 2.17 × 10⁻¹⁴ | 0.22 | |
| log(Frontal area) *** | 0.79 | 9.89 × 10⁻² | 7.99 | 2.17 × 10⁻¹⁴ | |||
| log(Power) vs. log(Mass) | Model 3k: log(power) = α + β × log(mass) | ||||||
| (Intercept) *** | −13.06 | 0.69 | −18.97 | 3.01 × 10−55 | <2.2 × 10⁻¹⁶ | 0.54 | |
| log(Power) *** | 2.40 | 9.13 × 10⁻² | 26.29 | 6.36 × 10−84 | |||
| log(Certified drive range) vs. log(Nominal battery capacity) | Model 3l: log(certified drive range) = α + β × log(nominal battery capacity) | ||||||
| (Intercept) *** | 2.75 | 9.91 × 10⁻² | 27.79 | 7.68 × 10−107 | <2.2 × 10⁻¹⁶ | 0.63 | |
| log(Nominal battery capacity) *** | 0.76 | 2.29 × 10⁻² | 33.43 | 1.37 × 10−134 | |||
| log(Real-world drive range) vs. log(Usable battery capacity) | Model 3m: log(real-world drive range) = α + β × log(usable battery capacity) | ||||||
| (Intercept) *** | 2.57 | 8.30 × 10⁻² | 30.94 | 1.13 × 10−117 | <2.2 × 10⁻¹⁶ | 0.73 | |
| log(Usable battery capacity) *** | 0.80 | 1.96 × 10⁻² | 40.66 | 9.56 × 10−160 | |||
| log(Price) vs. log(Nominal battery capacity) | Model 3n: log(price) = α + β × log(nominal battery capacity) | ||||||
| (Intercept) *** | 6.51 | 0.17 | 38.80 | 4.10 × 10−174 | <2.2 × 10⁻¹⁶ | 0.59 | |
| log(Nominal battery capacity) *** | 1.06 | 3.97 × 10⁻² | 26.66 | 1.52 × 10−107 | |||
| log(Price) vs. log(Certified drive range) | Model 3o: log(price) = α + β × log(certified drive range) | ||||||
| (Intercept) *** | 6.52 | 0.31 | 20.95 | 5.66 × 10−72 | <2.2 × 10⁻¹⁶ | 0.25 | |
| log(Certified drive range) *** | 0.75 | 5.19 × 10⁻² | 14.54 | 1.06 × 10−40 | |||
| Efficiency Class | |||||||||
|---|---|---|---|---|---|---|---|---|---|
| Criterion | Classification | Class Size | A | B | C | D | E | F | G |
| Certified energy consumption [kWh/100 km] | Equal class size over the entire data range | 2.53 | <15.5 | 15.5–18.0 | 18.1–20.5 | 20.6–23.0 | 23.1–25.5 | 25.6–28.1 | ≥28.2 |
| 10% vehicles in A; B–G equal class size | 2.55 | <15.4 | 15.4–17.9 | 18.0–20.4 | 20.5–23.0 | 23.1–25.5 | 25.6–28.1 | ≥28.2 | |
| 5% in A; B–G equal class size | 2.67 | <14.7 | 14.7–17.3 | 17.4–19.9 | 20.0–22.6 | 22.7–25.3 | 25.4–28.0 | ≥28.1 | |
| 1% in A; B–G equal class size | 2.78 | <14.0 | 14.0–16.7 | 16.8–19.5 | 19.6–22.3 | 22.4–25.0 | 25.1–27.8 | ≥27.9 | |
| Certified energy consumption per 100 kWh nominal battery capacity [1/km] | Equal class size over the entire data range | 8.34 | <20.8 | 20.8–29.1 | 29.2–37.4 | 37.5–45.8 | 45.9–54.1 | 54.2–62.4 | ≥62.5 |
| 10% vehicles in A; B–G equal class size | 8.67 | <18.8 | 18.8–27.4 | 27.5–36.1 | 36.2–44.8 | 44.9–53.4 | 53.5–62.1 | ≥62.2 | |
| 5% in A; B–G equal class size | 8.95 | <17.2 | 17.2–26.0 | 26.1–35.0 | 35.1–43.9 | 44.0–52.9 | 53.0–61.8 | ≥61.9 | |
| 1% in A; B–G equal class size | 9.59 | <13.3 | 13.3–22.8 | 22.9–32.4 | 32.5–42.0 | 42.1–51.6 | 51.7–61.2 | ≥61.3 | |
| Certified energy consumption per 100 km drive range [kWh/km2] | Equal class size over the entire data range | 1.56 | <3.26 | 3.26–4.81 | 4.82–6.37 | 6.38–7.93 | 7.94–9.49 | 9.50–11.05 | ≥11.06 |
| 10% vehicles in A; B–G equal class size | 1.61 | <2.96 | 2.96–4.56 | 4.57–6.17 | 6.18–7.78 | 7.79–9.39 | 9.40–11.00 | ≥11.01 | |
| 5% in A; B–G equal class size | 1.66 | <2.66 | 2.66–4.31 | 4.32–5.97 | 5.98–7.63 | 7.64–9.29 | 9.30–10.95 | ≥10.96 | |
| 1% in A; B–G equal class size | 1.78 | <1.94 | 1.94–3.71 | 3.72–5.49 | 5.50–7.27 | 7.28–9.05 | 9.06–10.83 | ≥10.84 | |
References
- EEA. New Registrations of Electric Vehicles in Europe. EEA–European Environmental Agency, 2023. Available online: https://www.eea.europa.eu/en/analysis/indicators/new-registrations-of-electric-vehicles (accessed on 1 February 2024).
- IEA. Executive Summary. Global EV Outlook 2023. IEA–International Energy Agency, 2023. Available online: https://www.iea.org/reports/global-ev-outlook-2023/executive-summary (accessed on 21 March 2024).
- ICCT. Electric Vehicles Market Monitor for Light-Duty Vehicles: China, Europe, United States, and India, 2022. 2023. Available online: https://theicct.org/wp-content/uploads/2023/06/Major-Mkts_briefing_FINAL.pdf (accessed on 27 September 2023).
- ACEA. Vehicles on European Roads. ACEA-European Automobile Manufacturers Association, 2024. Available online: https://www.acea.auto/files/ACEA-Report-Vehicles-on-European-roads-.pdf (accessed on 27 April 2024).
- EC. Regulation (EU) 2023/851 of the European Parliament and of the Council of 19 April 2023 amending Regulation (EU) 2019/631 as regards strengthening the CO2 emission performance standards for new passenger cars and new light commercial vehicles in line with the union’s increased climate ambition. EC–European Commission. Off. J. Eur. Union 2023, L110, 5–20. [Google Scholar]
- EEA. Electric vehicles in Europe. Report No 20/2016. EEA-European Environmental Agency No 20/2016. 2016. Available online: https://op.europa.eu/en/publication-detail/-/publication/1a4a941c-9a8d-11e6-9bca-01aa75ed71a1/language-en (accessed on 28 April 2024). [CrossRef]
- EVD. Electric Vehicle Database. EV Database (9-Five-9 Ventures BV). 2023. Available online: https://ev-database.org (accessed on 5 August 2023).
- Weiss, M.; Zerfass, A.; Helmers, E. Fully electric and plug-in hybrid cars-An analysis of learning rates, user costs, and costs for mitigating CO2 and air pollutant emissions. J. Clean. Prod. 2019, 212, 1478–1489. [Google Scholar] [CrossRef] [PubMed]
- Xu, J.; Cai, X.; Cai, S.; Shao, X.; Hu, C.; Lu, S.; Ding, S. High-energy lithium-ion batteries: Recent progress and a promising future in applications. Energy Environ. Mater. 2023, 6, 12450. [Google Scholar] [CrossRef]
- Helmers, E.; Marx, P. Electric cars: Technical characteristics and environmental impacts. Environ. Sci. Eur. 2012, 24, 14. [Google Scholar] [CrossRef]
- Yadlapalli, R.T.; Kotapati, A.; Kandipati, R.; Koritala, C.S. A review of energy efficient technologies for electric vehicle applications. J. Energy Storage 2022, 50, 104212. [Google Scholar] [CrossRef]
- EC. Directive 1999/94/EC of the European Parliament and of the Council of 13 December 1999 relating to the availability of consumer information on fuel economy and CO2 emissions in respect of the marketing of new passenger cars. EU–European Commission. Off. J. Eur. Union 1999, L012, 16. [Google Scholar]
- EC. Regulation (EC) No 715/2007 of the European Parliament and of the Council of 20 June 2007 on type approval of motor vehicles with respect to emissions from light passenger cars and commercial vehicles (Euro 5 and Euro 6). EC–European Commission. Off. J. Eur. Union 2007, L171, 1–16. Available online: https://eur-lex.europa.eu/eli/reg/2007/715/oj (accessed on 8 January 2024).
- EC. Directive 2007/46/EC establishing a framework for the approval of motor vehicles and their trailers, and of systems, components and separate technical units intended for such vehicles. EC–European Commission. Off. J. Eur. Union 2007, L263, 1–160. [Google Scholar]
- EC. Transition Pathway for a Green, Digital, and Resilient EU Mobility Industrial Ecosystem. News Article, 29 January 2024. EC–European Commission, Directorate-General for Internal Market, Industry, Entrepreneurship and SMEs, 2024. Available online: https://single-market-economy.ec.europa.eu/news/transition-pathway-green-digital-and-resilient-eu-mobility-industrial-ecosystem-2024-01-29_en (accessed on 27 April 2024).
- EC. Sustainable and Smart Mobility Strategy–Putting European Transport on Track for the Future. Document SWD(2020) 331 Final. EC–European Commission, 2020. Available online: https://eur-lex.europa.eu/resource.html?uri=cellar:5e601657-3b06-11eb-b27b-01aa75ed71a1.0001.02/DOC_1&format=PDF (accessed on 28 April 2024).
- E-CUBE. 2030 peak power demand in North-West Europe. Report (Final version)–September 2020. E-CUBE Strategy Consultants and the Institute of Energy Economics at the University of Cologne gGmbH (EWI), 2020. Available online: https://www.ewi.uni-koeln.de/cms/wp-content/uploads/2020/09/E-CUBE-EWI-2030-Peak-Power-Demand-in-North-West-Europe-vf3.pdf (accessed on 28 April 2024).
- Prognos. Entwicklung des Bruttostromverbrauches Bis 2030. Prognos AG Berlin, 2021. Available online: https://www.prognos.com/de/projekt/entwicklung-des-bruttostromverbrauches-bis-2030 (accessed on 28 April 2024).
- EC. Commission Regulation (EU) 2017/1151 supplementing Regulation (EC) No 715/2007 of the European Parliament and of the Council on type-approval of motor vehicles with respect to emissions from light passenger and commercial vehicles (Euro 5 and Euro 6) and on access to vehicle repair and maintenance information, amending Directive 2007/46/EC of the European Parliament and of the Council, Commission Regulation (EC) No 692/2008 and Commission Regulation (EU) No 1230/2012 and repealing Commission Regulation (EC) No 692/2008. EC-European Commission. Off. J. Eur. Union 2017, L175, 1–839. [Google Scholar]
- EC. Directive (EU) 2023/1791 of the European Parliament and of the Council of 13 September 2023 on energy efficiency and amending Regulation (EU) 2023/955 (recast). EC–European Commission. Off. J. Eur. Union 2023, L231, 1–111. Available online: https://eur-lex.europa.eu/legal-content/EN/TXT/?uri=OJ%3AJOL_2023_231_R_0001&qid=1695186598766 (accessed on 24 April 2024).
- EEC. Council Directive 92/75/EEC of 22 September 1992 on the indication by labelling and standard product information of the consumption of energy and other resources by household appliances. EEC–European Economic Community. Off. J. Eur. Communities 1992, L297, 6–19. [Google Scholar]
- EC. Regulation (EC) No 1222/2009 of the European Parliament and of the Council of 25 November 2009 on the labelling of tires with respect to fuel efficiency and other essential parameters. EU–European Commission. Off. J. Eur. Union 2009, L342, 46. [Google Scholar]
- EC. Commission Delegated Regulation (EU) 2015/1186 of 24 April 2015 supplementing Directive 2010/30/EU of the European Parliament and of the Council with regard to the energy labelling of local space heaters. EU–European Commission. Off. J. Eur. Union 2015, L193, 20–42. [Google Scholar]
- EC. Commission Delegated Regulation (EU) 2019/2013 of 11 March 2019 supplementing Regulation (EU) 2017/1369 of the European Parliament and of the Council with regard to energy labelling of electronic displays and repealing Commission Delegated Regulation (EU) No 1062/2010. EC–European Commission. Off. J. Eur. Union 2019, L315, 1–28. [Google Scholar]
- EC. Commission Delegated Regulation (EU) 2023/1669 of 16 June 2023 supplementing Regulation (EU) 2017/1369 of the European Parliament and of the Council with regard to the energy labelling of smartphones and slate tablets. EC–European Commission. Off. J. Eur. Union 2023, L214, 9–49. [Google Scholar]
- UNECE. Addendum 153–UN Regulation No. 154. 2021. Available online: https://unece.org/sites/default/files/2021-08/R154e.pdf (accessed on 5 June 2024).
- BEV. BEV-Database. Eberhard Droege Consulting, 2023. Available online: https://bev-database.de (accessed on 5 August 2023).
- Spritmonitor. Verbrauchswerte Real Erfahren; Fisch und Fischl GmbH: Thyrnau, Germany, 2023; Available online: https://www.spritmonitor.de/ (accessed on 31 August 2023).
- Bowling, B. Air Drag Coefficients and Frontal Area Calculation. 2010. Available online: http://www.bgsoflex.com/airdragchart.html (accessed on 30 May 2024).
- Hucho, W.-H.; Sovran, G. Aerodynamics of road vehicles. Annu. Rev. Fluid Mech. 1993, 25, 485–537. [Google Scholar] [CrossRef]
- Knittel, C. Automobiles on steroids. Product attribute trade-offs and technological progress in the automobile sector. Am. Econ. Rev. 2011, 101, 3368–3399. [Google Scholar] [CrossRef]
- Tietge, U.; Mock, P.; Franco, V.; Zacharof, N. From laboratory to road: Modeling the divergence between official and real-world fuel consumption and CO2 emission values in the German passenger car market for the years 2001–2014. Energy Policy 2017, 103, 212–222. [Google Scholar] [CrossRef]
- Blair, G.; Cooper, J.; Coppock, A.; Humphreys, M.; Sonnet, L.; Fultz, N. Package ‘estimatr’; R Foundation for Statistical Computing: Vienna, Austria, 2018; Available online: https://cran.r-project.org/web/packages/estimatr/estimatr.pdf (accessed on 23 April 2018).
- R Core Team. R: A Language and Environment for Statistical Computing; R Foundation for Statistical Computing: Vienna, Austria, 2024; Available online: https://www.R-project.org/ (accessed on 25 January 2024).
- Weiss, M.; Irrgang, L.; Kiefer, A.T.; Roth, J.R.; Helmers, E. Mass- and power-related efficiency trade-offs and CO2 emissions of compact passenger cars. J. Clean. Prod. 2020, 243, 118326. [Google Scholar] [CrossRef]
- Haq, G.; Weiss, M. CO2 labelling of passenger cars in Europe: Status, challenges, and future prospects. Energy Policy 2016, 95, 324–335. [Google Scholar] [CrossRef]
- She, Z.-Y.; Sun, Q.; Ma, J.-J.; Xie, B.-C. What are the barriers to widespread adoption of battery electric vehicles? A survey of public perception in Tianjin, China. Transp. Policy 2017, 56, 29–40. [Google Scholar] [CrossRef]
- Pamidimukkala, A.; Kermanshachi, S.; Rosenberger, J.M.; Hladik, G. Barriers and motivators to the adoption of electric vehicles: A global review. Green Energy Intell. Transp. 2024, 3, 100153. [Google Scholar] [CrossRef]
- Moro, A.; Lonza, L. Electricity carbon intensity in European Member States: Impacts on GHG emissions of electric vehicles. Transp. Res. Part D Transp. Environ. 2018, 64, 5–14. [Google Scholar] [CrossRef]
- Skrúcaný, T.; Kendra, M.; Stopka, O.; Milojević, S.; Figlus, T.; Csiszár, C. Impact of the electric mobility implementation on the greenhouse gases production in Central European countries. Sustainability 2019, 11, 4948. [Google Scholar] [CrossRef]
- Helmers, E.; Dietz, J.; Weiss, M. Sensitivity analysis in the life-cycle assessment of electric vs. combustion engine cars under approximate real-world conditions. Sustainability 2020, 12, 1241. [Google Scholar] [CrossRef]
- Das, P.K.; Bhat, M.Y.; Sajith, S. Life cycle assessment of electric vehicles: A systematic review of literature. Environ. Sci. Pollut. Res. 2024, 31, 73–89. [Google Scholar] [CrossRef] [PubMed]
- Zuur, A.F.; Ieno, E.N.; Walker, N.J.; Saveliev, A.A.; Smith, G.M. Mixed Effects Models and Extensions in Ecology with R; Springer: New York, NY, USA, 2009. [Google Scholar]
- Madziel, M.; Campisi, T. Energy consumption of electric vehicles: Analysis of selected parameters based on created database. Energies 2023, 16, 1437. [Google Scholar] [CrossRef]
- Galvin, R. Are electric vehicles getting too big and heavy? Modelling future vehicle journeying demand on a decarbonized US electricity grid. Energy Policy 2022, 161, 112746. [Google Scholar] [CrossRef]
- Weiss, M.; Cloos, K.C.; Helmers, E. Energy efficiency trade-offs in small to large electric vehicles. Environ. Sci. Eur. 2020, 32, 46. [Google Scholar] [CrossRef]
- Spritmonitor. Sparsame Elektrofahrzeuge-E-Autos Mit Wenig Stromverbrauch; Fisch und Fischl GmbH: Thyrnau, Germany, 2024; Available online: https://www.spritmonitor.de/de/sparsame_elektrofahrzeuge.html (accessed on 18 April 2024).
- Redelbach, M.; Klötzke, M.; Friedrich, H.E. Impact of Lightweight Design on Energy Consumption and Cost Effectiveness of Alternative Powertrain Concepts. In Proceedings of the European Electric Vehicle Congress, Brussels, Belgium, 19–22 November 2012. [Google Scholar]
- Kozłowski, E.; Wiśniowski, P.; Gis, M.; Zimakowska-Laskowska, M.; Borucka, A. Vehicle acceleration and speed as factors determining energy consumption in electric vehicles. Energies 2024, 17, 4051. [Google Scholar] [CrossRef]
- Komnos, D.; Tsiakmakis, S.; Pavlovic, J.; Ntziachristos, L.; Fontaras, G. Analysing the real-world fuel and energy consumption of conventional and electric cars in Europe. Energy Convers. Manag. 2022, 270, 116161. [Google Scholar] [CrossRef]
- EC. Ecodesign and energy labelling working plan 2022–2024. EC–European Commission. Off. J. Eur. Union 2022, C 182, 1–12. [Google Scholar]
- EC. Regulation (EU) 2019/631 of 17 April 2019 stetting CO2 emission performance standards for new passenger cars and for new light commercial vehicles, and repealing Regulations (EC) No 443/2009 and (EU) No 510/2011. EC–European Commission. Off. J. Eur. Union 2019, L111, 13. [Google Scholar]
- Wikipedia. European Union Energy Label. 2024. Available online: https://en.wikipedia.org/wiki/European_Union_energy_label (accessed on 17 April 2024).
- Lauvergne, R.; Perez, Y.; Françon, M.; De La Cruz, A.T. Integration of electric vehicles into transmission grids: A case study on generation adequacy in Europe in 2040. Appl. Energy 2022, 326, 120030. [Google Scholar] [CrossRef]
- Garcia, B.B.; Ferraz, B.; Vidor, F.F.; Gazzana, D.S.; Ferraz, R.G. Chapter Eleven-Power Loss Analysis in Distribution Systems Considering the Massive Penetration of Electric Vehicles. In Advanced Technologies in Electric Vehicles; Gali, V., Canha, L.N., Resener, M., Ferraz, B., Varaprasad, M.V.G., Eds.; Academic Press: Cambridge, MA, USA, 2024; pp. 279–297. ISBN 9780443189999. [Google Scholar] [CrossRef]
- Anastasiadis, A.G.; Kondylis, G.P.; Polyzakis, A.; Vokas, G. Effects of increased electric vehicles into a distribution network. Energy Procedia 2019, 157, 586–593. [Google Scholar] [CrossRef]
- Gielen, D.; Lyons, M. Critical Materials for the Energy Transition: Rare Earth Elements. International Renewable Energy Agency, Abu Dhabi. Technical paper 2/2022. 2022. Available online: https://www.irena.org/-/media/Irena/Files/Technical-papers/IRENA_Rare_Earth_Elements_2022.pdf?rev=6b1d592393f245f193b08eeed6512abc (accessed on 14 June 2024).
- STHDA. Linear Regression Assumption and Diagnostics in R: Essentials. STHDA–Statistical Tools for High-throughput Data Analysis. 2018. Available online: http://www.sthda.com/english/articles/39-regression-model-diagnostics/161-linear-regression-assumptions-and-diagnostics-in-r-essentials/ (accessed on 1 February 2024).

| Parameter [Unit] (Sample Size) | Mean | SD | Median | Min | Max |
|---|---|---|---|---|---|
| Energy consumption | |||||
| Certified a [kWh/100 km] (501) | 19.4 | 3.8 | 18.5 | 13.0 | 30.7 |
| Certified—TEL [kWh/100 km] (312) | 18.5 | 3.4 | 17.6 | 13.0 | 28.3 |
| Certified—TEH [kWh/100 km] (189) | 20.7 | 3.9 | 19.8 | 14.3 | 30.7 |
| Real-world b [kWh/100 km] (496) | 20.7 | 3.7 | 19.8 | 13.0 | 38.9 |
| Drive range, based on | |||||
| Certified energy consumption a [km] (552) | 438 | 122 | 440 | 190 | 883 |
| Certified energy consumption—TEL [km] (339) | 449 | 128 | 455 | 190 | 883 |
| Certified energy consumption—TEH [km] (213) | 420 | 111 | 420 | 203 | 828 |
| Real-world energy consumption b [km] (496) | 383 | 109 | 384 | 148 | 733 |
| Certified drive range per 1000 EUR vehicle price (548) | 7.00 | 2.43 | 7.01 | 1.34 | 11.93 |
| Real-world drive range per 1000 EUR vehicle price (493) | 6.50 | 2.06 | 6.69 | 1.25 | 11.00 |
| Nominal battery capacity [kWh] (342) | 76 | 22 | 77 | 23 | 128 |
| Usable battery capacity [kWh] (342) | 71 | 21 | 71 | 21 | 123 |
| Mass [kg] (342) | 2102 | 351 | 2128 | 1012 | 2975 |
| Power [kW] (342) | 230 | 139 | 190 | 33 | 828 |
| Frontal area [m2] (342) | 2.59 | 0.28 | 2.55 | 2.09 | 3.25 |
| Length [m] (342) | 4.71 | 0.39 | 4.75 | 3.60 | 5.45 |
| Width [m] (342) | 1.89 | 0.07 | 1.90 | 1.62 | 2.08 |
| Height [m] (342) | 1.62 | 0.14 | 1.61 | 1.35 | 1.94 |
| Price c [EUR] (339) | 70,135 | 40,245 | 58,844 | 22,150 | 387,645 |
Disclaimer/Publisher’s Note: The statements, opinions and data contained in all publications are solely those of the individual author(s) and contributor(s) and not of MDPI and/or the editor(s). MDPI and/or the editor(s) disclaim responsibility for any injury to people or property resulting from any ideas, methods, instructions or products referred to in the content. |
© 2024 by the authors. Licensee MDPI, Basel, Switzerland. This article is an open access article distributed under the terms and conditions of the Creative Commons Attribution (CC BY) license (https://creativecommons.org/licenses/by/4.0/).
Share and Cite
Weiss, M.; Winbush, T.; Newman, A.; Helmers, E. Energy Consumption of Electric Vehicles in Europe. Sustainability 2024, 16, 7529. https://doi.org/10.3390/su16177529
Weiss M, Winbush T, Newman A, Helmers E. Energy Consumption of Electric Vehicles in Europe. Sustainability. 2024; 16(17):7529. https://doi.org/10.3390/su16177529
Chicago/Turabian StyleWeiss, Martin, Trey Winbush, Alexandra Newman, and Eckard Helmers. 2024. "Energy Consumption of Electric Vehicles in Europe" Sustainability 16, no. 17: 7529. https://doi.org/10.3390/su16177529
APA StyleWeiss, M., Winbush, T., Newman, A., & Helmers, E. (2024). Energy Consumption of Electric Vehicles in Europe. Sustainability, 16(17), 7529. https://doi.org/10.3390/su16177529