
Quality Management System in Air Quality Measurements for Sustainable Development


Abstract
1. Introduction
- EN 14625:2013 Ambient air. Standard method for the measurement of the concentration of ozone by ultraviolet photometry [12];
- EN 14212:2012 Ambient air. Standard method for the measurement of the concentration of sulphur dioxide by ultraviolet fluorescence [13];
- EN 14211:2013 Ambient air. Standard method for the measurement of the concentration of nitrogen dioxide and nitrogen monoxide by chemiluminescence [14];
- EN 12341:2014 Ambient air. Standard gravimetric measurement method for the determination of the PM10 or PM2.5 mass concentration of suspended particulate matter [15].
2. Materials and Methods
3. Results
4. Discussion
5. Conclusions
Author Contributions
Funding
Institutional Review Board Statement
Informed Consent Statement
Data Availability Statement
Acknowledgments
Conflicts of Interest
References
- Adams, M.D.; Kanaroglou, P.S. Mapping real-time air pollution health risk for environmental management: Combining mobile and stationary air pollution monitoring with neural network models. J. Environ. Manag. 2016, 168, 133–141. [Google Scholar] [CrossRef] [PubMed]
- van Donkelaar, A.; Martin, R.V.; Brauer, M.; Kahn, R.; Levy, R.; Verduzco, C.; Villeneuve, P.J. Global estimates of ambient fine particulate matter concentrations from satellite-based aerosol optical depth: Development and application. Environ. Health Perspect. 2010, 118, 847–855. [Google Scholar] [CrossRef] [PubMed]
- Lelieveld, J.; Evans, J.S.; Fnais, M.; Giannadaki, D.; Pozzer, A. The contribution of outdoor air pollution sources to premature mortality on a global scale. Nature 2015, 525, 367–371. [Google Scholar] [CrossRef] [PubMed]
- Evans, J.; van Donkelaar, A.; Martin, R.V.; Burnett, R.; Rainham, D.G.; Birkett, N.J.; Krewski, D. Estimates of global mortality attributable to particulate air pollution using satellite imagery. Environ. Res. 2013, 120, 33–42. [Google Scholar] [CrossRef]
- Hoek, G.; Krishnan, R.M.; Beelen, R.; Peters, A.; Ostro, B.; Brunekreef, B.; Kaufman, J.D. Long-term air pollution exposure and cardio-respiratory mortality: A review. Environ. Health 2013, 12, 43. [Google Scholar] [CrossRef]
- Duan, R.R.; Hao, K.; Yang, T. Air pollution and chronic obstructive pulmonary disease. Chronic Dis. Transl. Med. 2020, 6, 260–269. [Google Scholar] [CrossRef]
- Karakatsani, A.; Analitis, A.; Perifanou, D.; Ayres, J.G.; Harrison, R.M.; Kotronarou, A.; Kavouras, I.G.; Pekkanen, J.; Hämeri, K.; Kos, G.P.A.; et al. Particulate matter air pollution and respiratory symptoms in individuals having either asthma or chronic obstructive pulmonary disease: A European multicentre panel study. Environ. Health 2012, 11, 75. [Google Scholar] [CrossRef]
- Ezzati, M.; Lopez, A.D.; Rodgers, A.; Hoorn, S.V.; Murray, C.J.L. Selected major risk factors and global and regional burden of disease. Lancet 2002, 360, 1347–1360. [Google Scholar] [CrossRef]
- ISO/IEC 17025; General Requirements for the Competence of Testing and Calibration Laboratories. International Organization for Standardization: Geneva, Switzerland, 2017.
- Directive 2008/50/EC of the European Parliament and of the Council of 21 May 2008 on Ambient Air Quality and Cleaner Air for Europe. Available online: https://eur-lex.europa.eu/eli/dir/2008/50/oj (accessed on 22 July 2024).
- Rozporządzenie Ministra Klimatu i Środowiska z Dnia 11 Grudnia 2020 r. w Sprawie Dokonywania Oceny Poziomów Substancji w Powietrzu. Dz.U. 2020 poz. 2279. Available online: https://isap.sejm.gov.pl/isap.nsf/DocDetails.xsp?id=WDU20200002279 (accessed on 22 July 2024).
- EN 14625:2013; Ambient Air. Standard Method for the Measurement of the Concentration of Ozone by Ultraviolet Photometry. European Committee for Standardization: Brussels, Belgium, 2013.
- EN 14212:2012; Ambient Air. Standard Method for the Measurement of the Concentration of Sulphur Dioxide by Ultraviolet Fluorescence. European Committee for Standardization: Brussels, Belgium, 2012.
- EN 14211:2013; Ambient Air. Standard Method for the Measurement of the Concentration of Nitrogen Dioxide and Nitrogen Monoxide by Chemiluminescence. European Committee for Standardization: Brussels, Belgium, 2013.
- EN 12341:2014; Ambient Air. Standard Gravimetric Measurement Method for the Determination of the PM10 or PM2.5 Mass Concentration of Suspended Particulate Matter. European Committee for Standardization: Brussels, Belgium, 2014.
- EN 16450:2017; Ambient Air. Automated Measuring Systems for the Measurement of the Concentration of Particulate Matter (PM10; PM2.5). European Committee for Standardization: Brussels, Belgium, 2017.
- Song, J.; Han, K.; Stettler, M.E.J. Deep-MAPS: Machine-Learning-Based Mobile Air Pollution Sensing. IEEE Internet Things J. 2021, 8, 7649–7660. [Google Scholar] [CrossRef]
- Buček, P.; Maršolek, P.; Bílek, J. Low-cost sensors for air quality monitoring—The current state of the technology and a use overview. Chem. Didact. Ecol. Metrol. 2021, 26, 41–54. [Google Scholar] [CrossRef]
- European Co-Operation for Accreditation. EA-4/16: EA Guidelines on the Expression of Uncertainty in Quantitative Testing. Available online: http://www.sadcmet.org/SADCWaterLab/Archived_Reports/2006%20Reports%20and%20Docs/EA-4-16r.pdf (accessed on 24 July 2024).
- Obwieszczenie Ministra Klimatu i Środowiska z Dnia 12 Kwietnia 2021 r. w Sprawie Ogłoszenia Jednolitego Tekstu Rozporządzenia Ministra Środowiska w Sprawie Poziomów Niektórych Substancji w Powietrzu. Dz.U. 2021 poz. 845. Available online: https://isap.sejm.gov.pl/isap.nsf/DocDetails.xsp?id=WDU20210000845 (accessed on 24 July 2024).
- Sivertsen, B.; Bartonova, A. Air quality management planning (AQMP). Chem. Ind. Chem. Eng. Q. 2012, 18, 667–674. [Google Scholar] [CrossRef]
- Pullan, P.; Gautam, C.; Niranjan, V. Air Quality Management System. In Proceedings of the 2020 IEEE International Conference on Computing, Power and Communication Technologies (GUCON), Greater Noida, India, 2–4 October 2020. [Google Scholar] [CrossRef]
- Song, J.; Stettler, M.E.J. A novel multi-pollutant space-time learning network for air pollution inference. Sci. Total Environ. 2022, 811, 152254. [Google Scholar] [CrossRef]
- Zholdakova, Z.I.; Yudin, S.M.; Sinitsyna, O.O.; Budarina, O.V.; Dodina, N.S. Perspectives of organizational-legal and methodological measures improving environmental quality management. Hyg. Sanit. 2018, 97, 11. [Google Scholar] [CrossRef]
- ISO/IEC 17043:2023; Conformity Assessment—General Requirements for the Competence of Proficiency Testing Providers. International Organization for Standardization: Geneva, Switzerland, 2023.
- ISO Guide 34:2009; General Requirements for the Competence of Reference Material Producers. International Organization for Standardization: Geneva, Switzerland, 2009.
- Dehouck, P.; Koeber, R.; Scaravelli, E.; Emons, H. The integration of quality management systems in testing laboratories: A practitioner’s report. Accredit. Qual. Assur. 2018, 24, 151–156. [Google Scholar] [CrossRef]
- Martínez-Perales, S.; Ortiz-Marcos, I.; Ruiz, J.J. A proposal of model for a quality management system in research testing laboratories. Accredit. Qual. Assur. 2021, 26, 237–248. [Google Scholar] [CrossRef]
- Durgut, Y. Inter-laboratory comparisons and their roles in accreditation. Eur. J. Sci. Technol. 2021, 28, 402–406. [Google Scholar] [CrossRef]
- Aqidawati, E.F.; Sutopo, W.; Zakaria, R. Model to Measure the Readiness of University Testing Laboratories to Fulfill ISO/IEC 17025 Requirements (A Case Study). J. Open Innov. Technol. Mark. Complex 2019, 5, 2. [Google Scholar] [CrossRef]
- Barradas, J.; Sampaio, P. ISO 9001 and ISO/IEC 17025: Which is the best option for a laboratory of metrology? The Portuguese experience. Int. J. Qual. Reliab. Manag. 2017, 34, 406–417. [Google Scholar] [CrossRef]
- Belezia, L.C.; Ludovico de Almeida, M.F. Self-assessment model for testing and calibration laboratories based on ISO/IEC 17025:2017 requirements. J. Phys. Conf. Ser. 2021, 1826, 012026. [Google Scholar] [CrossRef]
- Mandre, M.; Rauk, J.; Poom, K.; Poor, M. Estimation of economical losses of forests and quality of agricultural plants on the territories affected by air pollution from cement plant in Kunda. In Economic Evaluation of Major Environmental Impacts from the Planned Investments at Kunda Nordic Cement Plant in Estonia; Kommonen, F., Estlander, A., Roto, P., Eds.; Report IFC, App. 1; Soil and Water Ltd.: Washington, DC, USA; Tampere Regional Institute of Occupational Health: Tampere, Finland; International Finance Corporation: Washington, DC, USA, 1995. [Google Scholar]
- Kozłowski, R.; Szwed, M. Utilisation of bio- and geoindicators for assessment of the state of natural environment in the south-western part of the Świętokrzyskie Mountains. In Infrastructure and Environment; Krakowiak-Bal, A., Vaverkova, M., Eds.; Springer: Cham, Switzelrand, 2019. [Google Scholar] [CrossRef]
- Szwed, M.; Kozłowski, R.; Żukowski, W. Assessment of Air Quality in the South-Western Part of the Świętokrzyskie Mountains Based on Selected Indicators. Forests 2020, 11, 499. [Google Scholar] [CrossRef]
- Tiitta, P.; Raunemaa, T.; Tissari, J.; Yli-Tuomi, T.; Leskinen, A.; Kukkonen, J.; Härkönen, J.; Karppinen, A. Measurements and modelling of PM2.5 concentrations near a major road in Kuopio, Finland. Atmos. Environ. 2002, 36, 4057–4068. [Google Scholar] [CrossRef]
- GIOŚ. Roczna Ocean Jakości Powietrza w Województwie Świętokrzyskim. Raport Wojewódzki za Rok 2022. 2023. Available online: https://powietrze.gios.gov.pl/pjp/rwms/content/show/10326 (accessed on 25 July 2024).
- Jóźwiak, M.; Jóźwiak, M. Influence of cement industry on accumulation of heavy metals in bioindicators. Ecol. Chem. Eng. S 2009, 16, 323–334. [Google Scholar]
- Szwed, M.; Żukowski, W.; Kozłowski, R. The Presence of Selected Elements in the Microscopic Image of Pine Needles as an Effect of Cement and Lime Pressure within the Region of Białe Zagłębie (Central Europe). Toxics 2021, 9, 15. [Google Scholar] [CrossRef] [PubMed]
- Szwed, M.; Żukowski, W.; Misztal, K.; Kozłowski, R. High-Energy Transformations of Fossil Fuels in the Cement Industry. Energies 2023, 16, 3634. [Google Scholar] [CrossRef]
- Świercz, A.; Smorzewska, E.; Bogdanowicz, M. State of Scots Pine needles’ epicuticular waxes and content of microelements in bioindication. Ecol. Chem. Eng. A 2014, 21, 367–375. [Google Scholar] [CrossRef]
- Maňkovská, B.; Godzik, B.; Badea, O.; Shparyk, Y.; Moravčík, P. Chemical and morphological characteristics of key tree species of the Carpathian Mountains. Environ. Pollut. 2004, 130, 41–54. [Google Scholar] [CrossRef]


| Parameter | Number of Valid Records | Mean | Uncertainty | Min. | Uncertainty | Max. | Uncertainty | SD | CV | Median |
|---|---|---|---|---|---|---|---|---|---|---|
| PM2.5 [µg/m3] | 93 | 9.6 | 1.1 | 4.6 | 0.5 | 20.1 | 2.6 | 3.4 | 35.6 | 8.9 |
| PM10 [µg/m3] | 93 | 19.6 | 1.4 | 8.5 | 0.6 | 93.5 | 10.3 | 13.0 | 66.4 | 15.7 |
| NO2 [µg/m3] | 93 | 9.4 | 1.4 | 3.7 | 0.5 | 30.7 | 4.6 | 4.3 | 45.8 | 8.6 |
| SO2 [µg/m3] | 93 | 4.4 | 0.7 | 1.3 | 0.2 | 9.4 | 1.4 | 2.0 | 46.2 | 4.0 |
| O3 [µg/m3] | 93 | 33.1 | 5.0 | 0.2 | 0.0 | 79.2 | 11.9 | 22.5 | 68.0 | 30.7 |
| RH [%] | 93 | 84.9 | 54.8 | 99.1 | 12.7 | 15.0 | 90.4 | |||
| AT [°C] | 93 | 14.1 | 3.8 | 19.7 | 3.6 | 25.2 | 14.9 | |||
| WD [°C] | 93 | 218.1 | 30.5 | 339.0 | 74.8 | 34.3 | 235.5 | |||
| WS [m/s] | 93 | 1.3 | 0.3 | 3.4 | 0.9 | 66.0 | 1.2 |
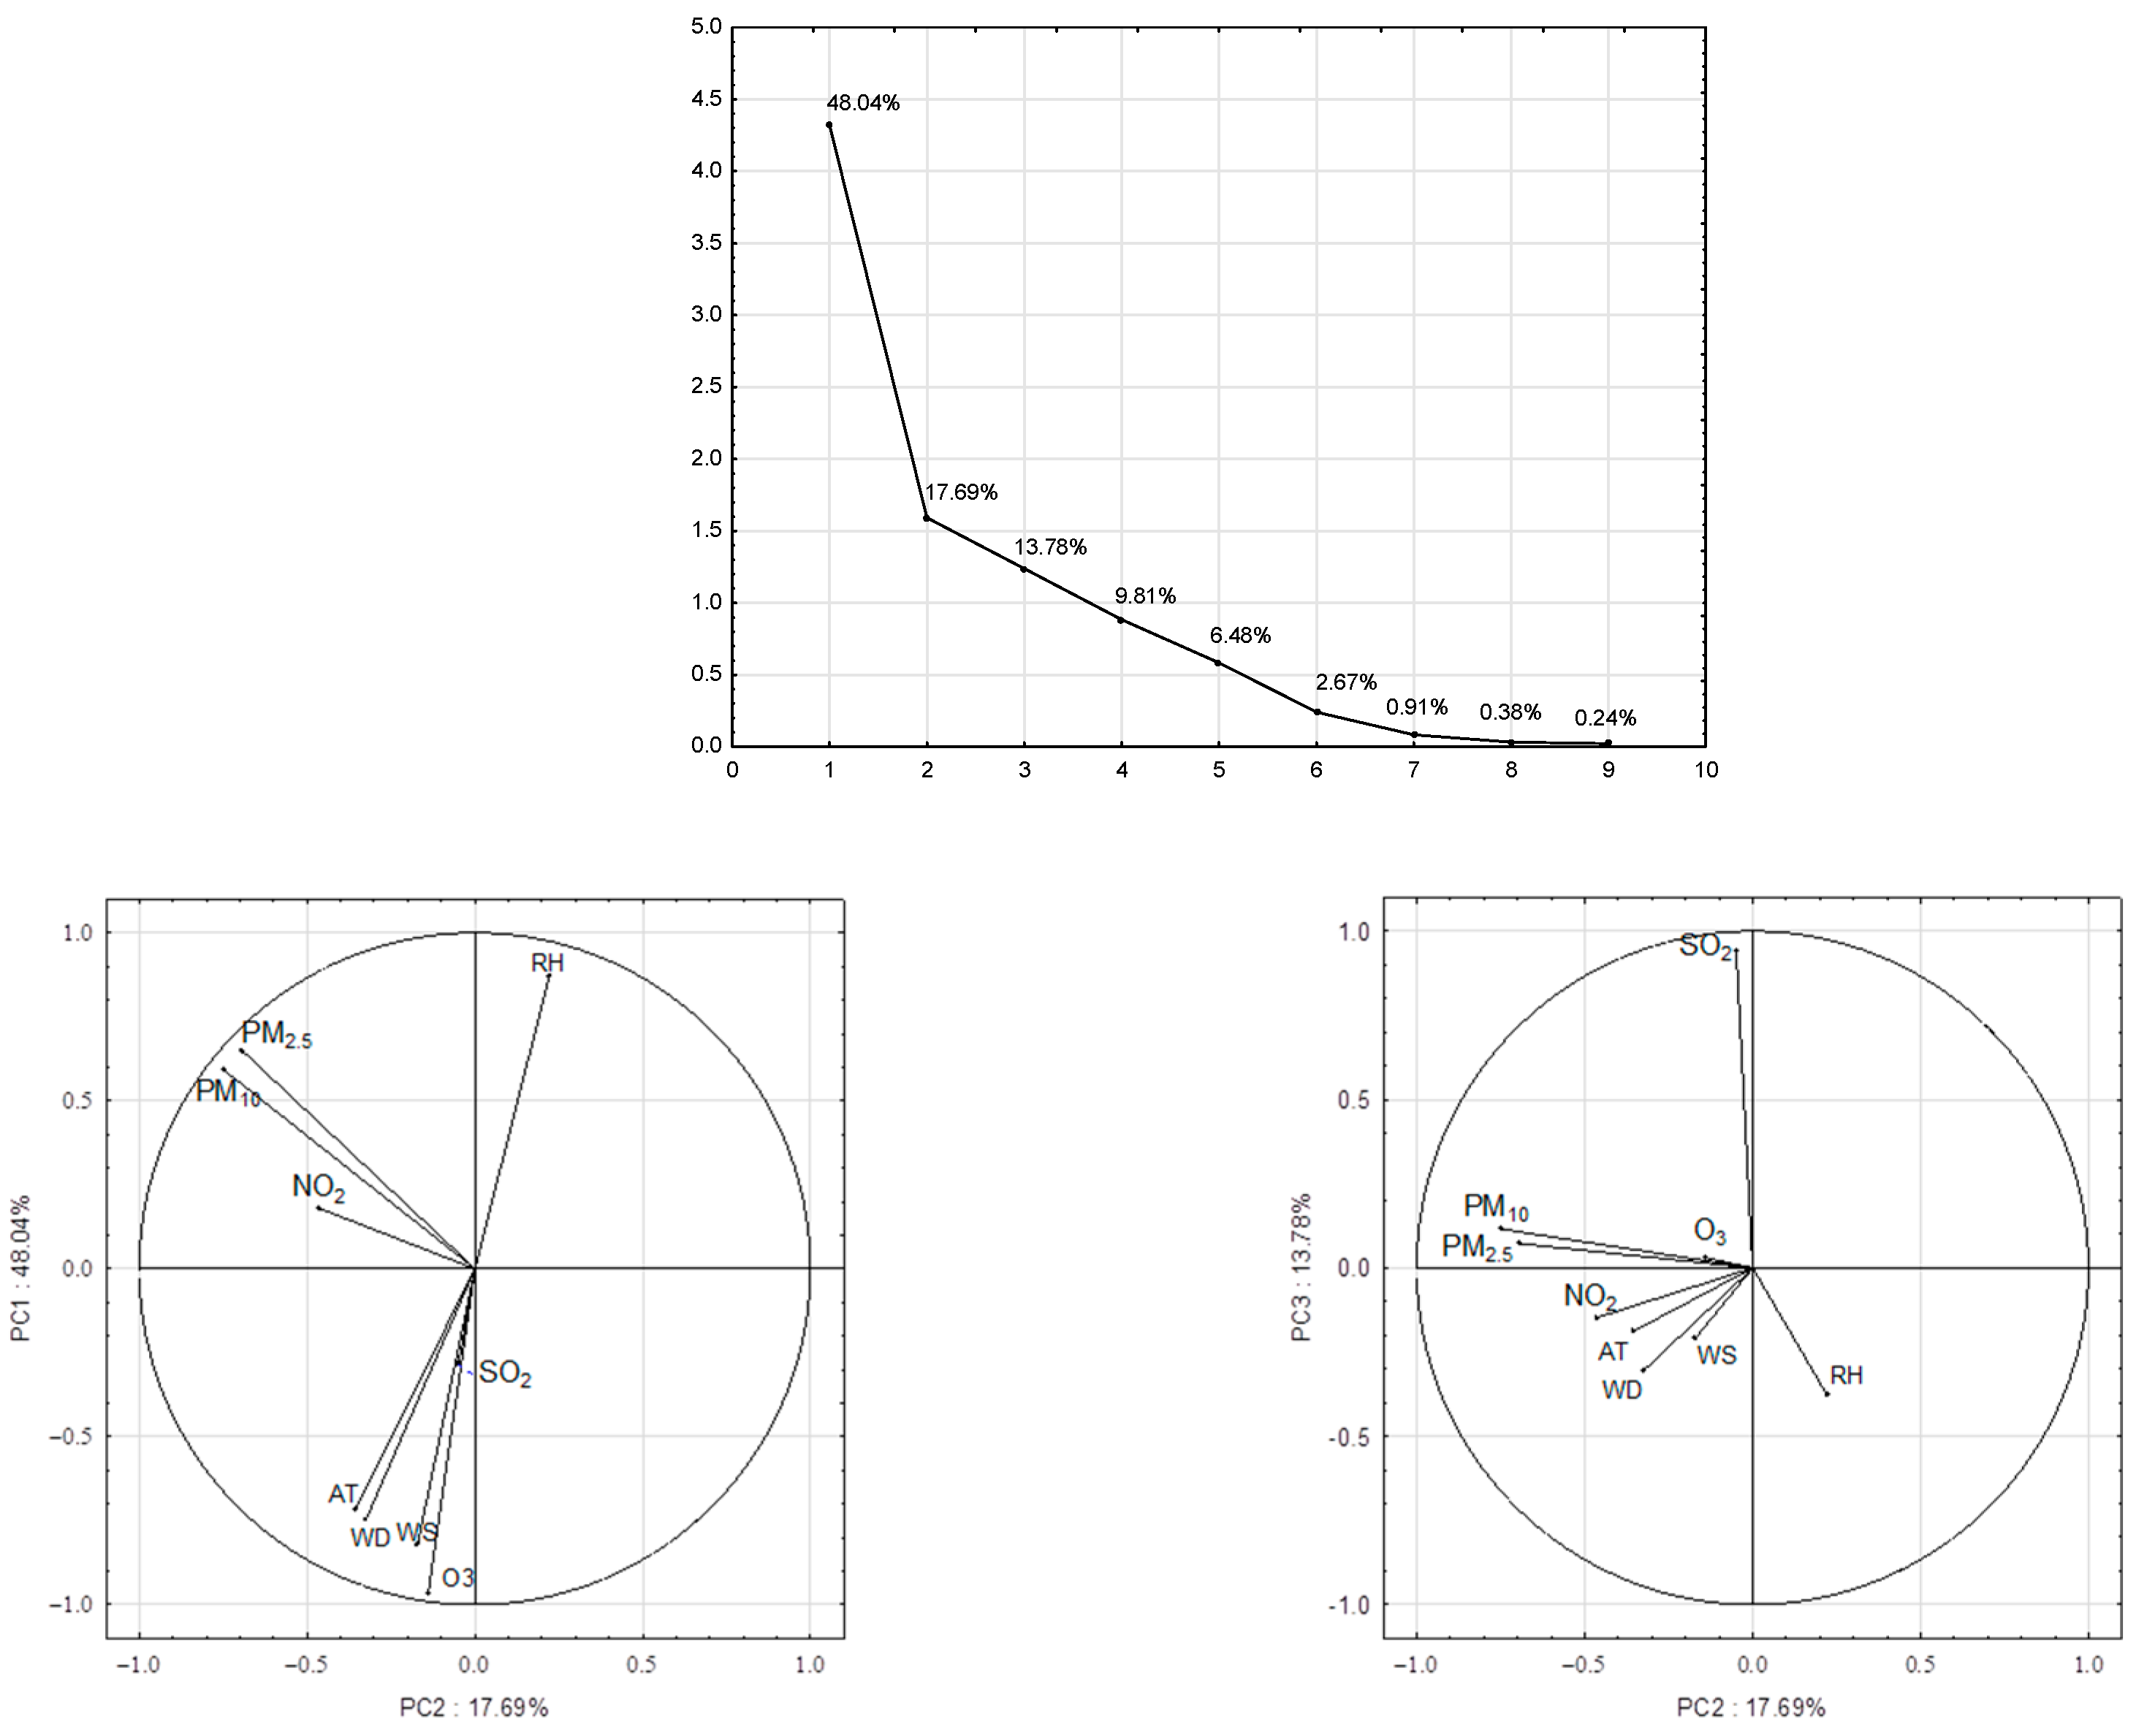
| Parameter | PC1 | PC2 | PC3 |
|---|---|---|---|
| PM2.5 | 0.6 | −0.70 * | 0.1 |
| PM10 | 0.6 | −0.75 * | 0.1 |
| NO2 | 0.2 | −0.5 | −0.2 |
| SO2 | −0.3 | −0.1 | 0.94 * |
| O3 | −0.97 * | −0.1 | 0.1 |
| RH | 0.87 * | −0.2 | −0.4 |
| AT | −0.72 * | 0.4 | −0.2 |
| WD | −0.75 * | 0.4 | −0.3 |
| WS | −0.82 * | 0.3 | −0.2 |
| Variance | 48% | 18% | 14% |
| Cumulative variance | 48% | 66% | 80% |
Disclaimer/Publisher’s Note: The statements, opinions and data contained in all publications are solely those of the individual author(s) and contributor(s) and not of MDPI and/or the editor(s). MDPI and/or the editor(s) disclaim responsibility for any injury to people or property resulting from any ideas, methods, instructions or products referred to in the content. |
© 2024 by the authors. Licensee MDPI, Basel, Switzerland. This article is an open access article distributed under the terms and conditions of the Creative Commons Attribution (CC BY) license (https://creativecommons.org/licenses/by/4.0/).
Share and Cite
Kozłowski, R.; Szwed, M.; Kozłowska, A.; Przybylska, J.; Mach, T. Quality Management System in Air Quality Measurements for Sustainable Development. Sustainability 2024, 16, 7537. https://doi.org/10.3390/su16177537
Kozłowski R, Szwed M, Kozłowska A, Przybylska J, Mach T. Quality Management System in Air Quality Measurements for Sustainable Development. Sustainability. 2024; 16(17):7537. https://doi.org/10.3390/su16177537
Chicago/Turabian StyleKozłowski, Rafał, Mirosław Szwed, Aneta Kozłowska, Joanna Przybylska, and Tomasz Mach. 2024. "Quality Management System in Air Quality Measurements for Sustainable Development" Sustainability 16, no. 17: 7537. https://doi.org/10.3390/su16177537
APA StyleKozłowski, R., Szwed, M., Kozłowska, A., Przybylska, J., & Mach, T. (2024). Quality Management System in Air Quality Measurements for Sustainable Development. Sustainability, 16(17), 7537. https://doi.org/10.3390/su16177537