
Evolution of Confinement Stress in Axially Loaded Concrete-Filled Steel Tube Stub Columns: Study on Enhancing Urban Building Efficiency
 ,
,  and
and
Abstract
:1. Introduction
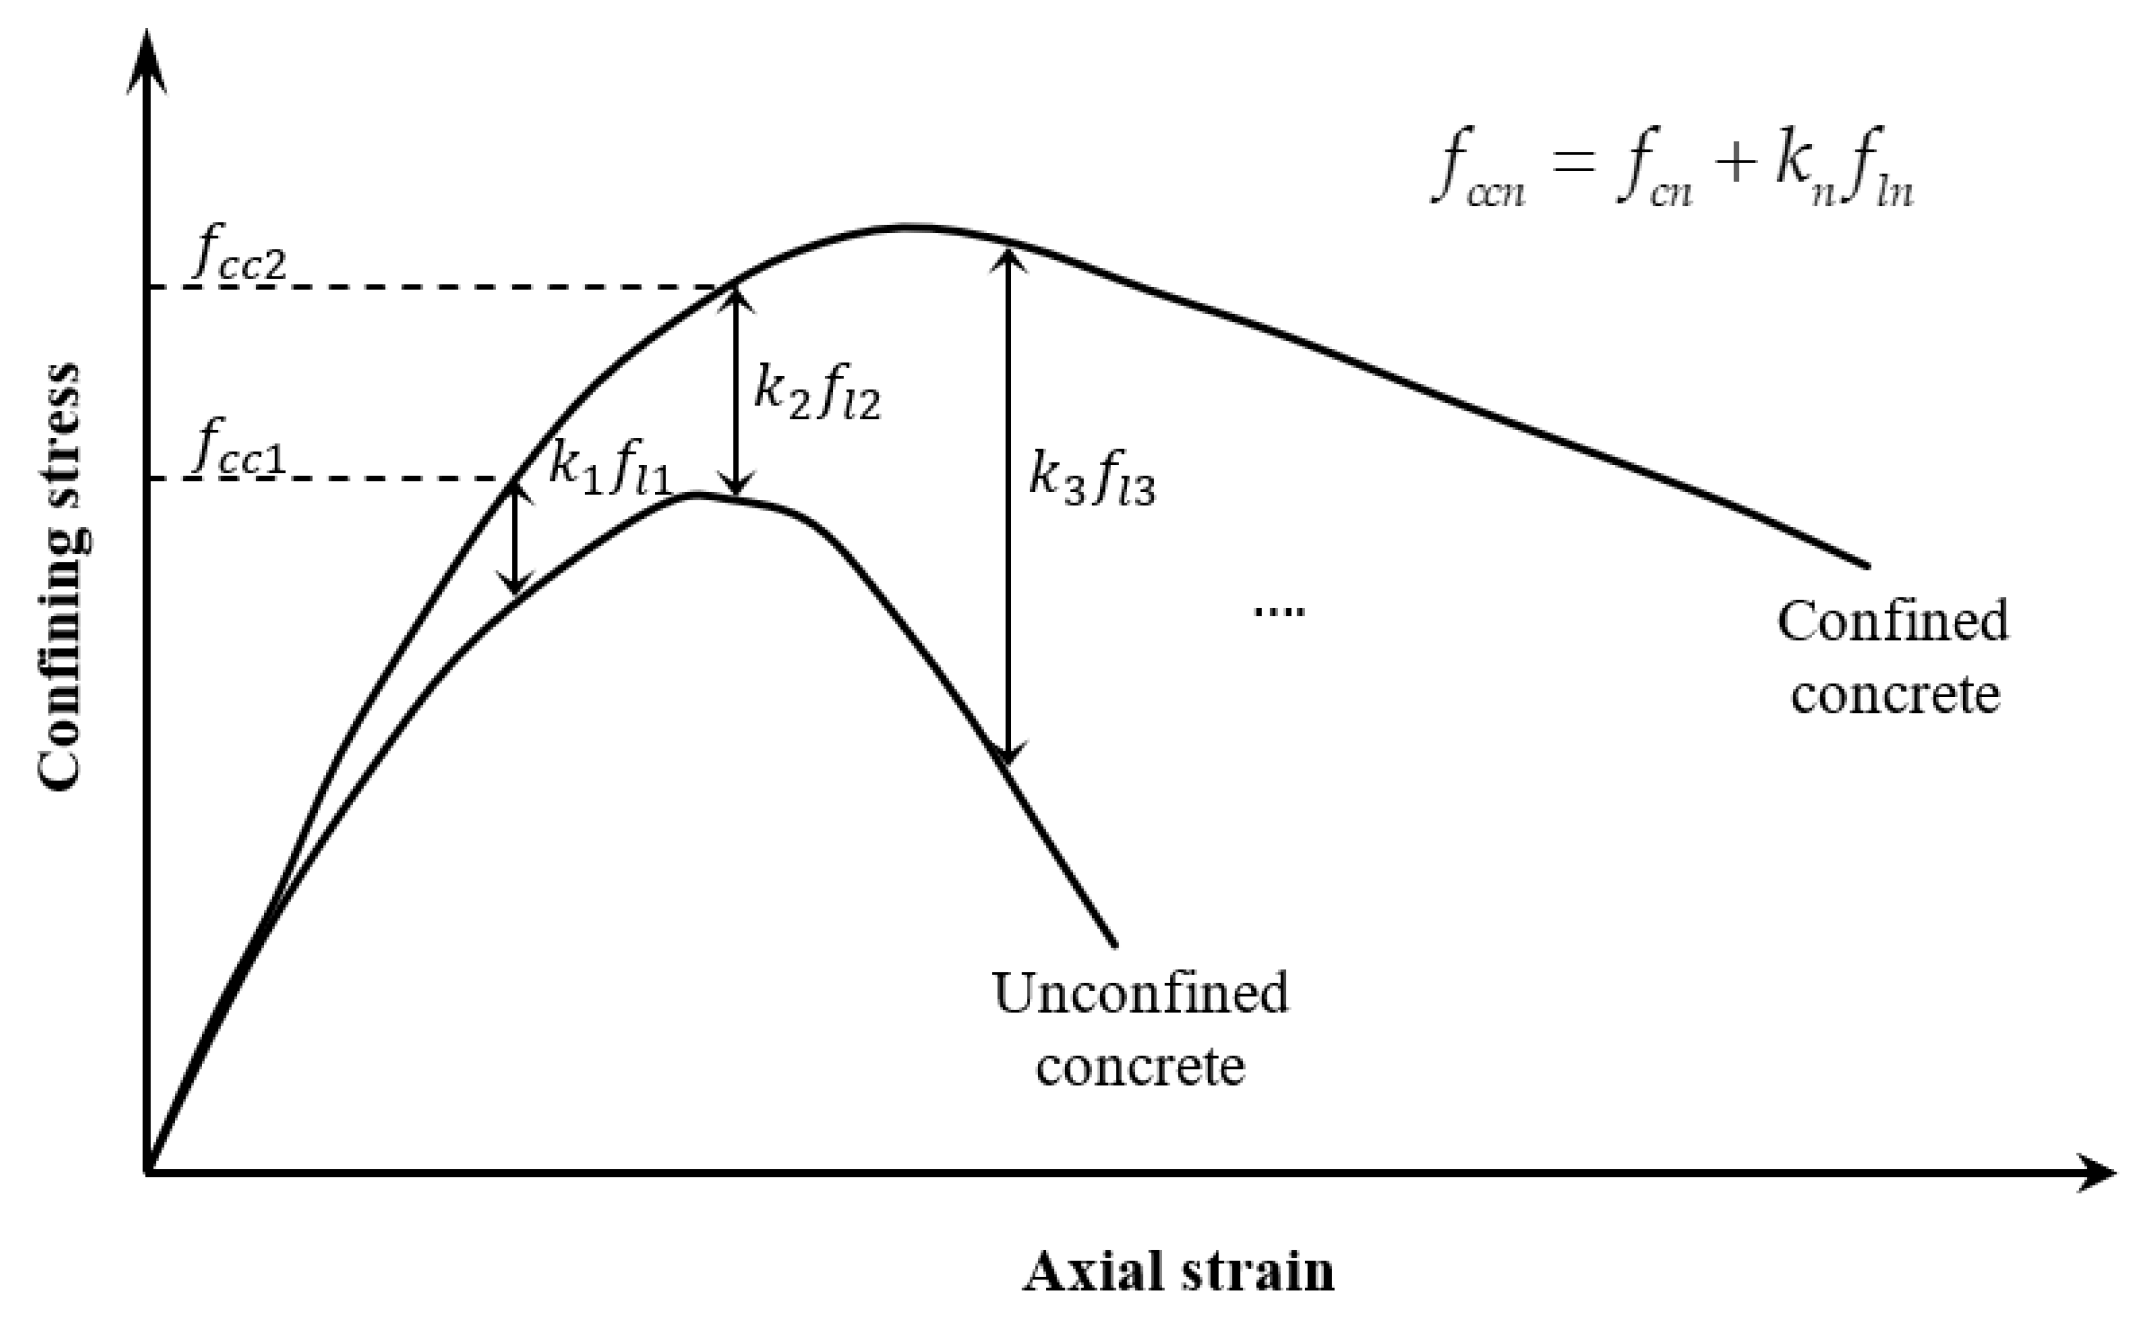
2. Confining Stress
2.1. Cross-Sectional Shape
2.2. The Ratio of
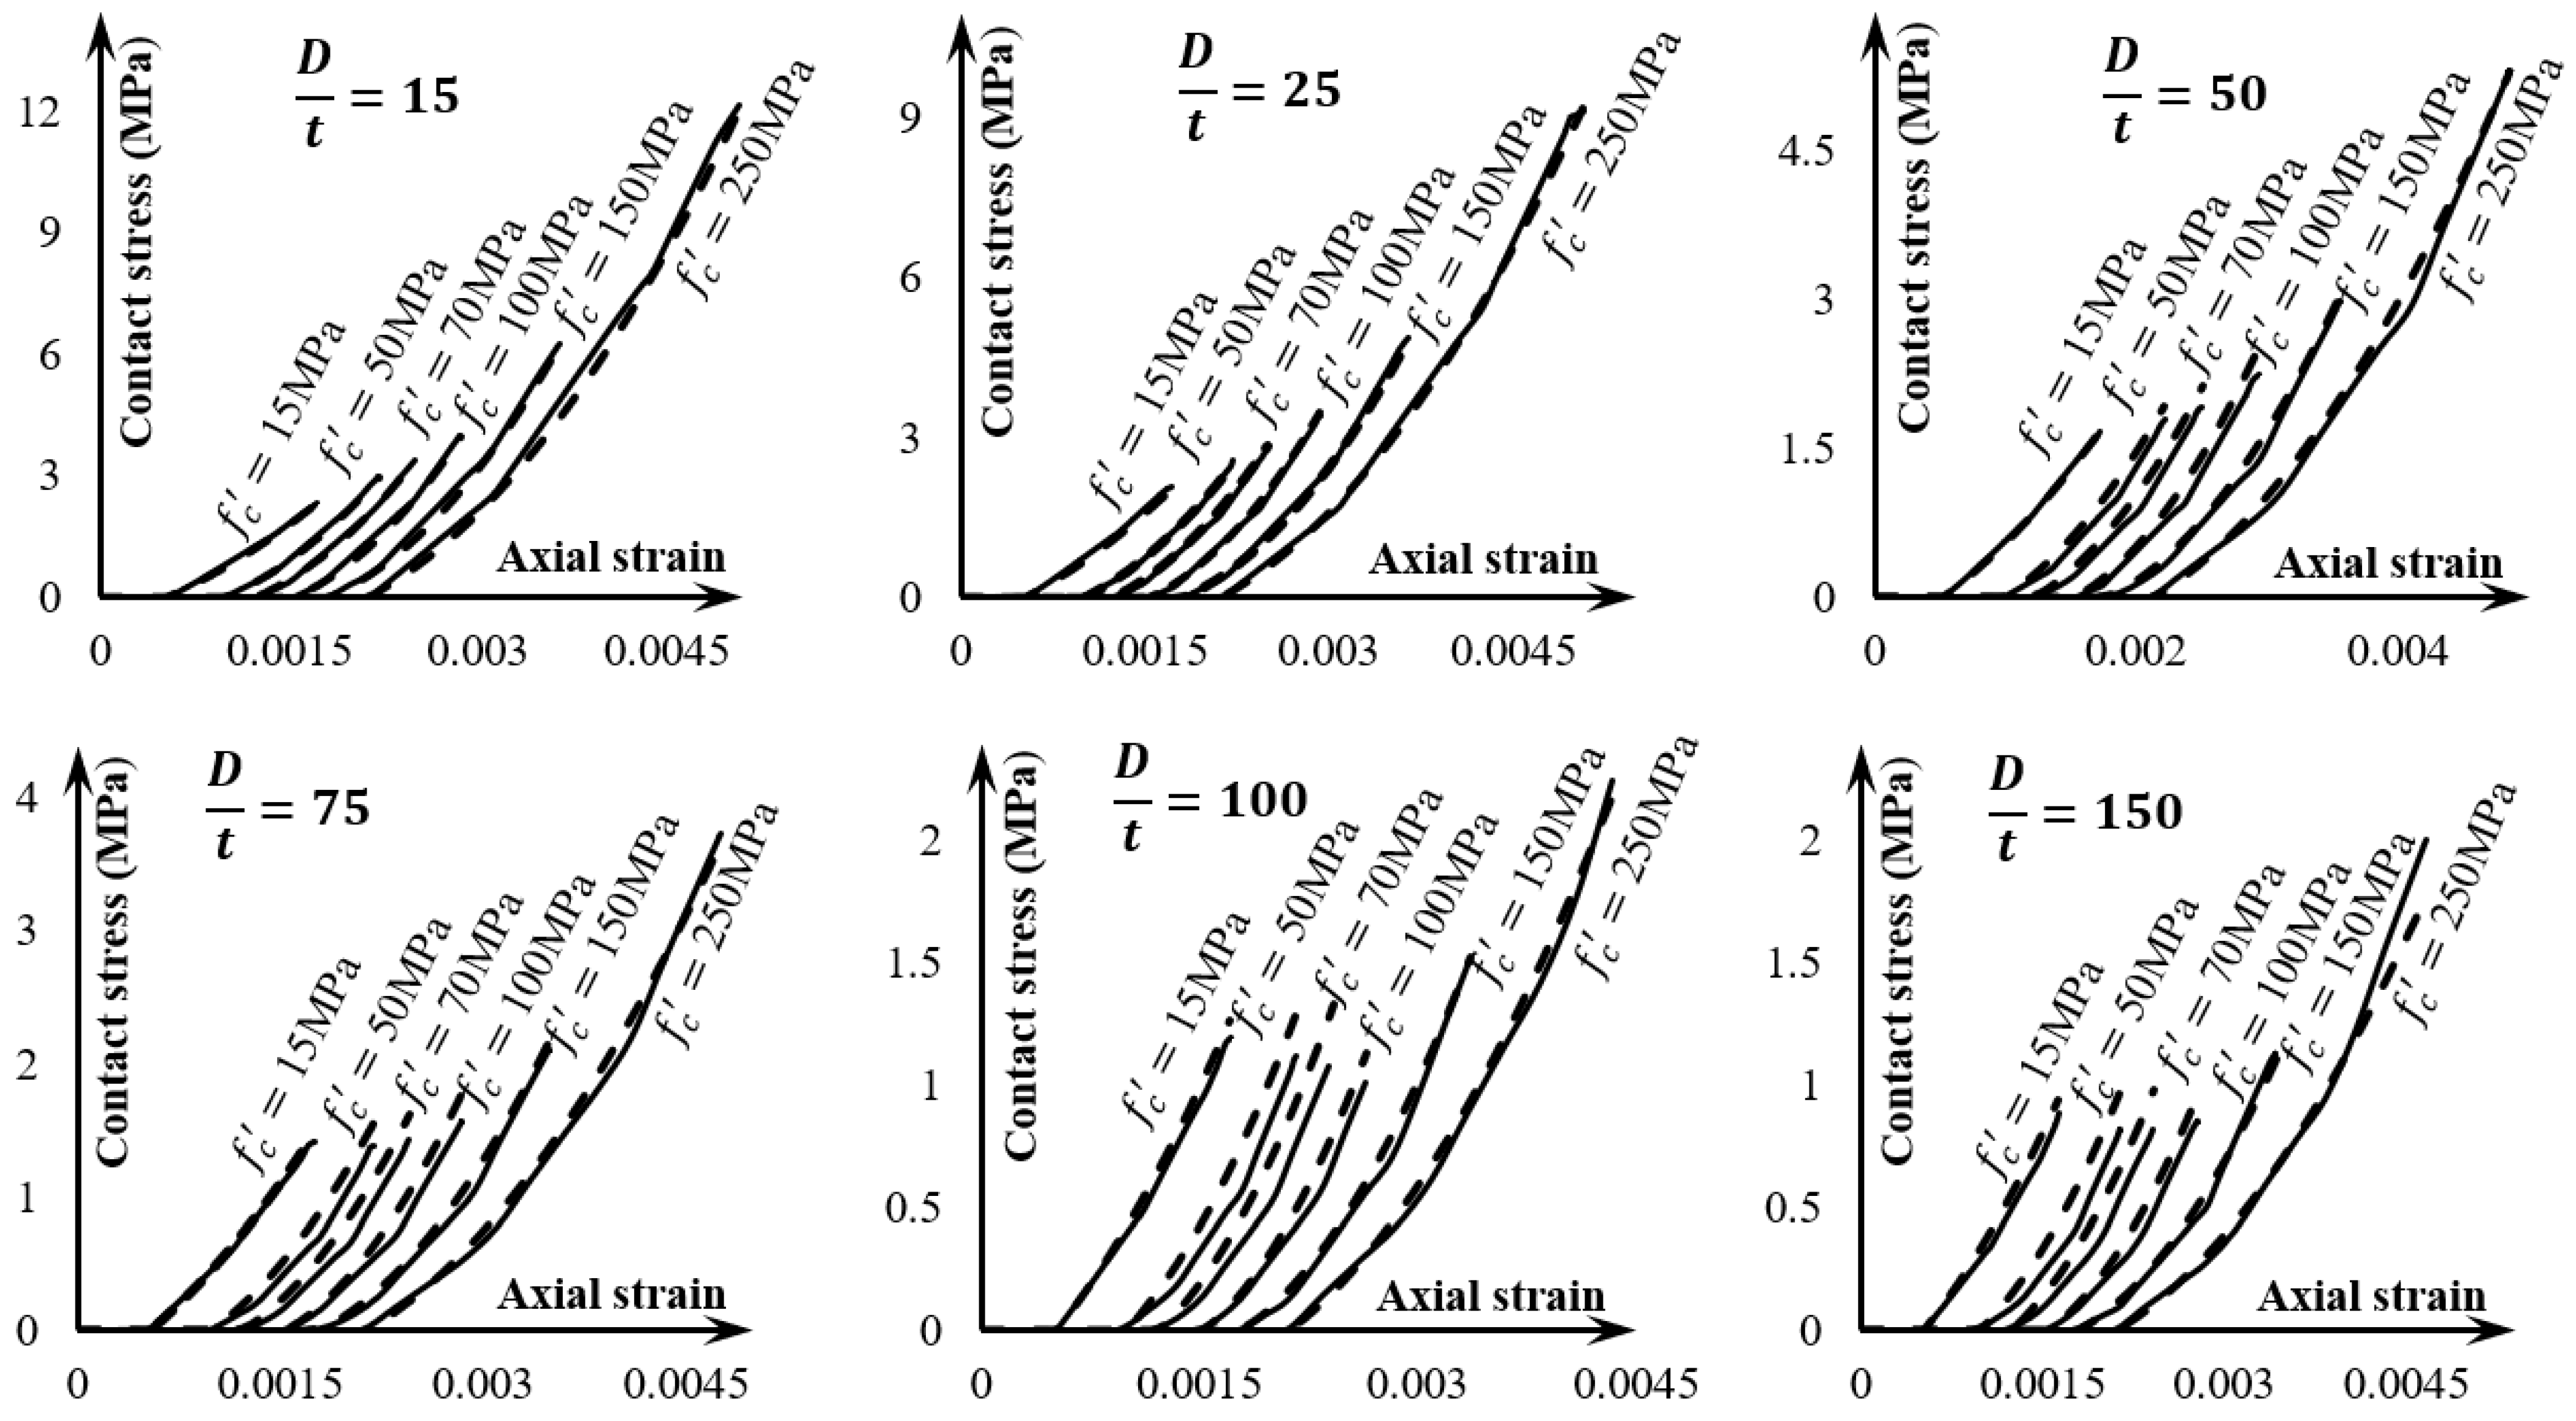
2.3. CS of Concrete Core
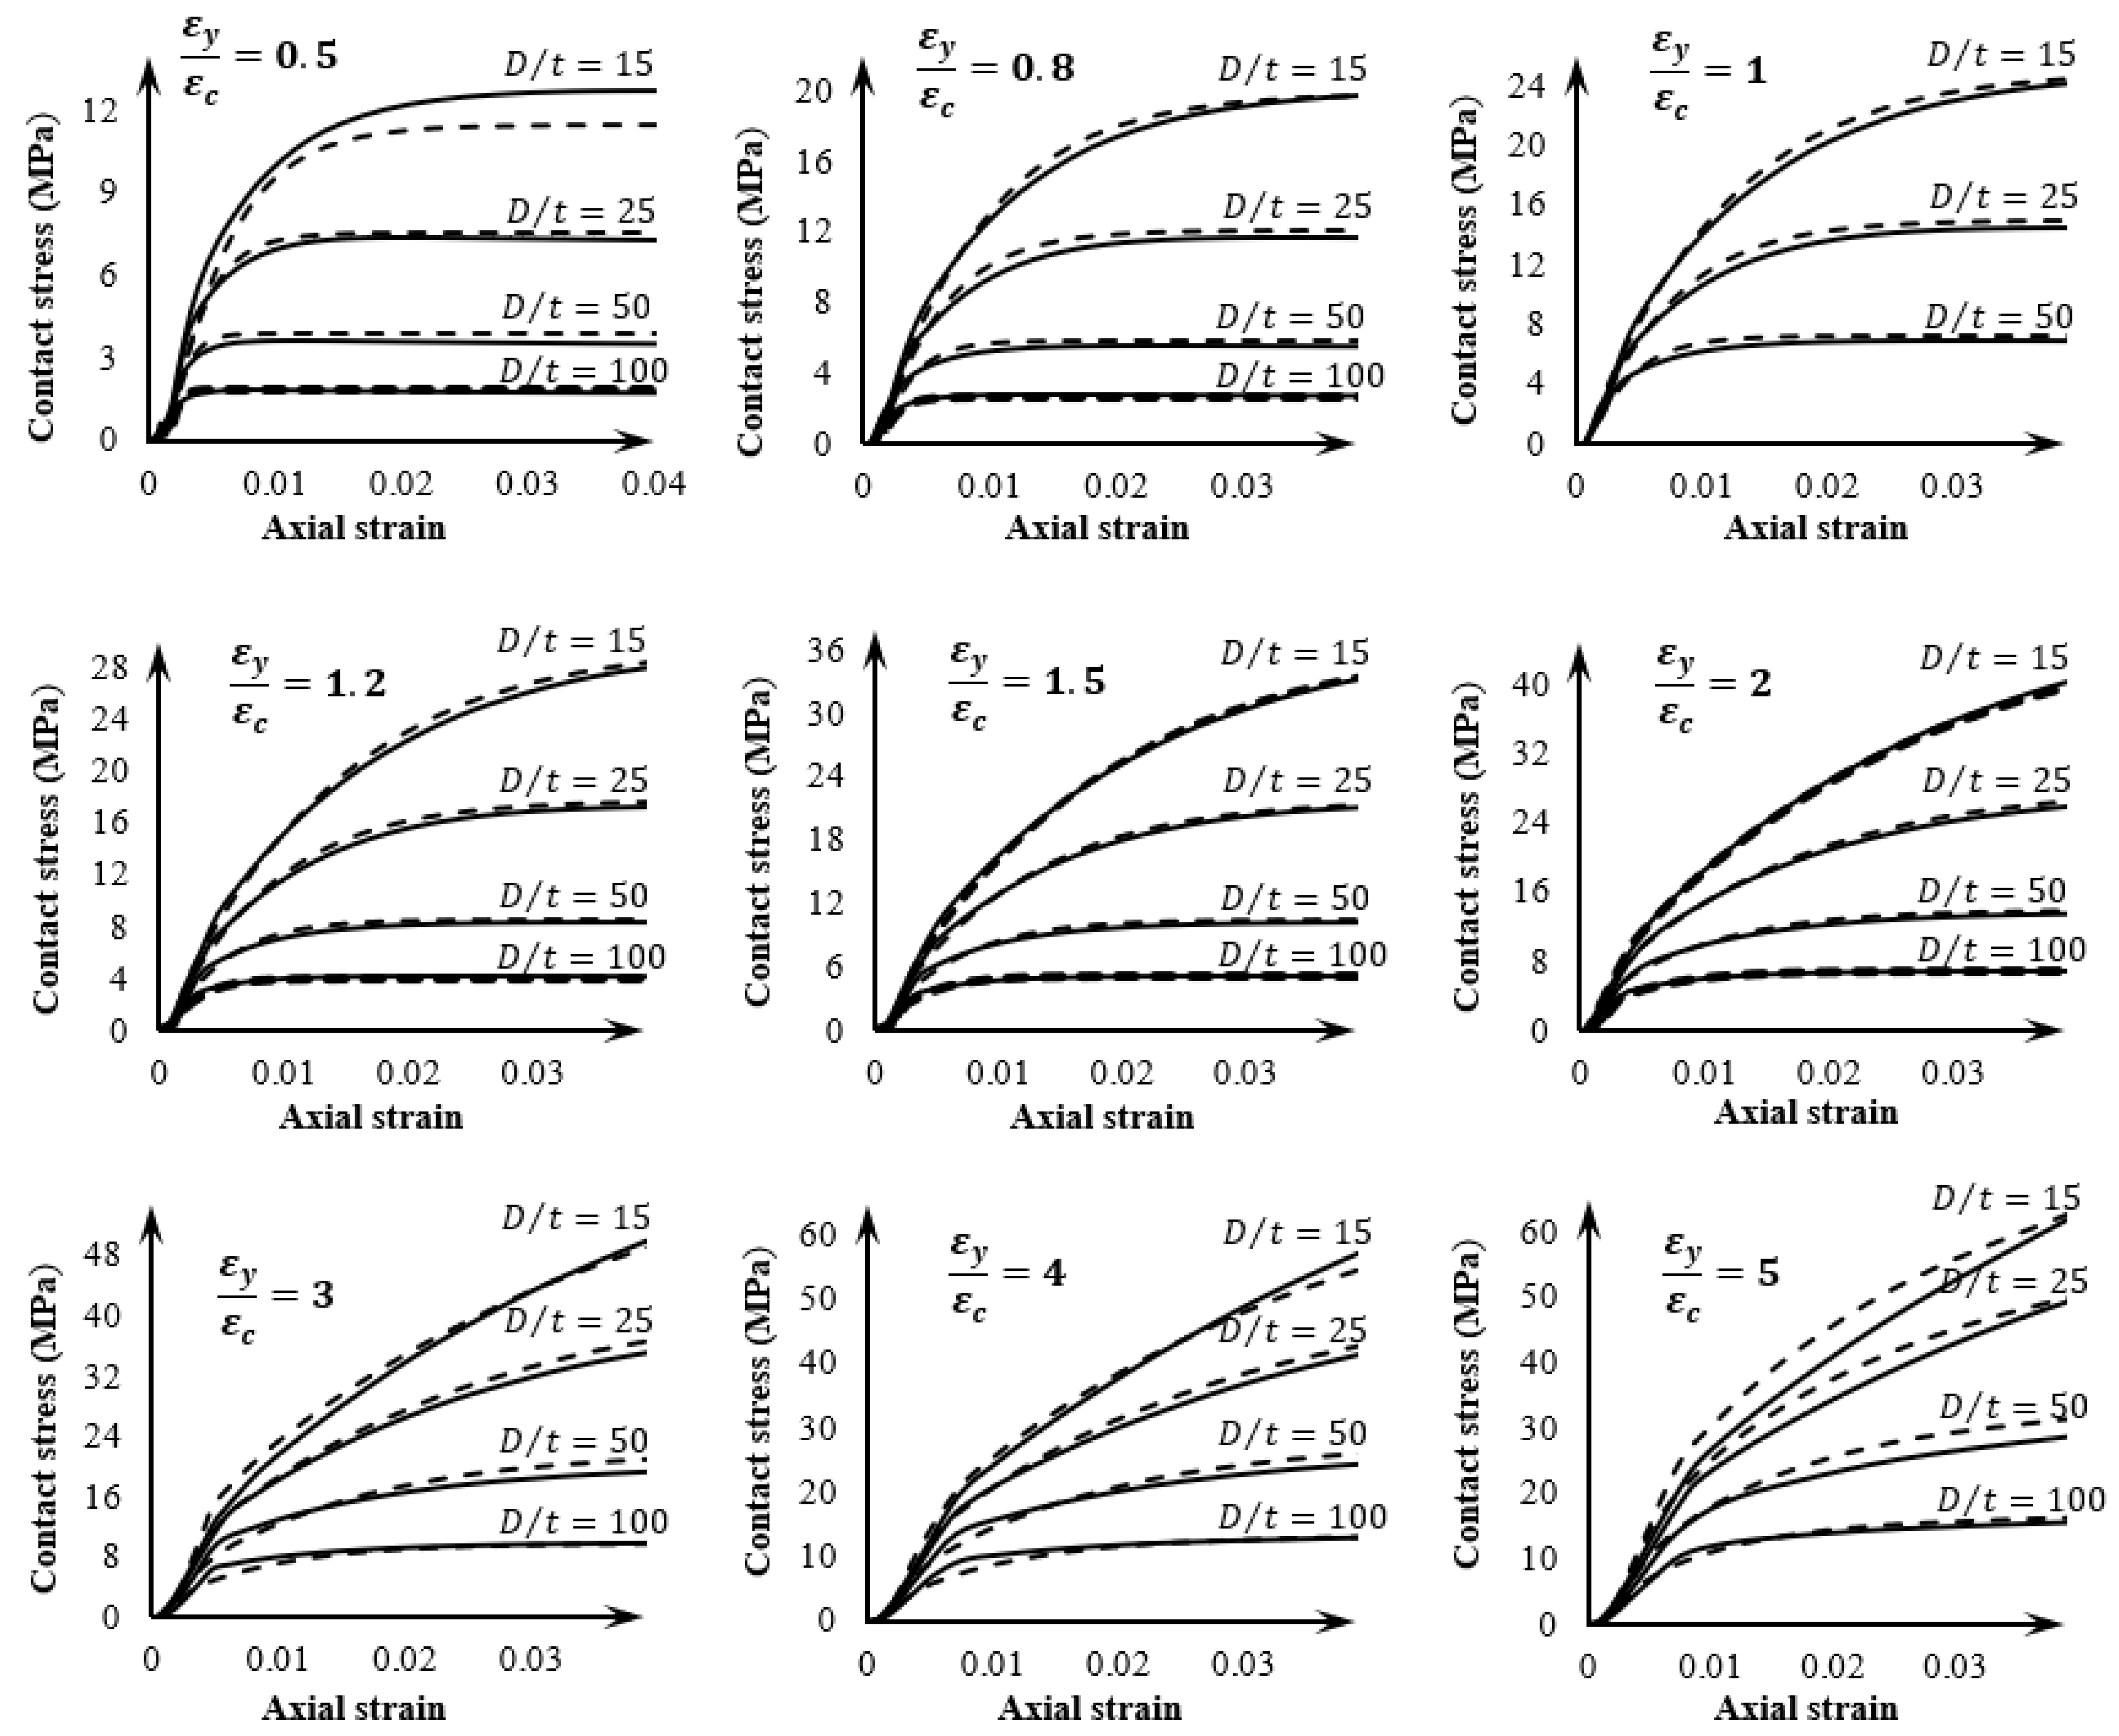
2.4. Depth-to-Thickness Ratio of ST (D/t)
3. Proposed Confining Stress–Axial Strain Model for Circular CFST Stub Columns
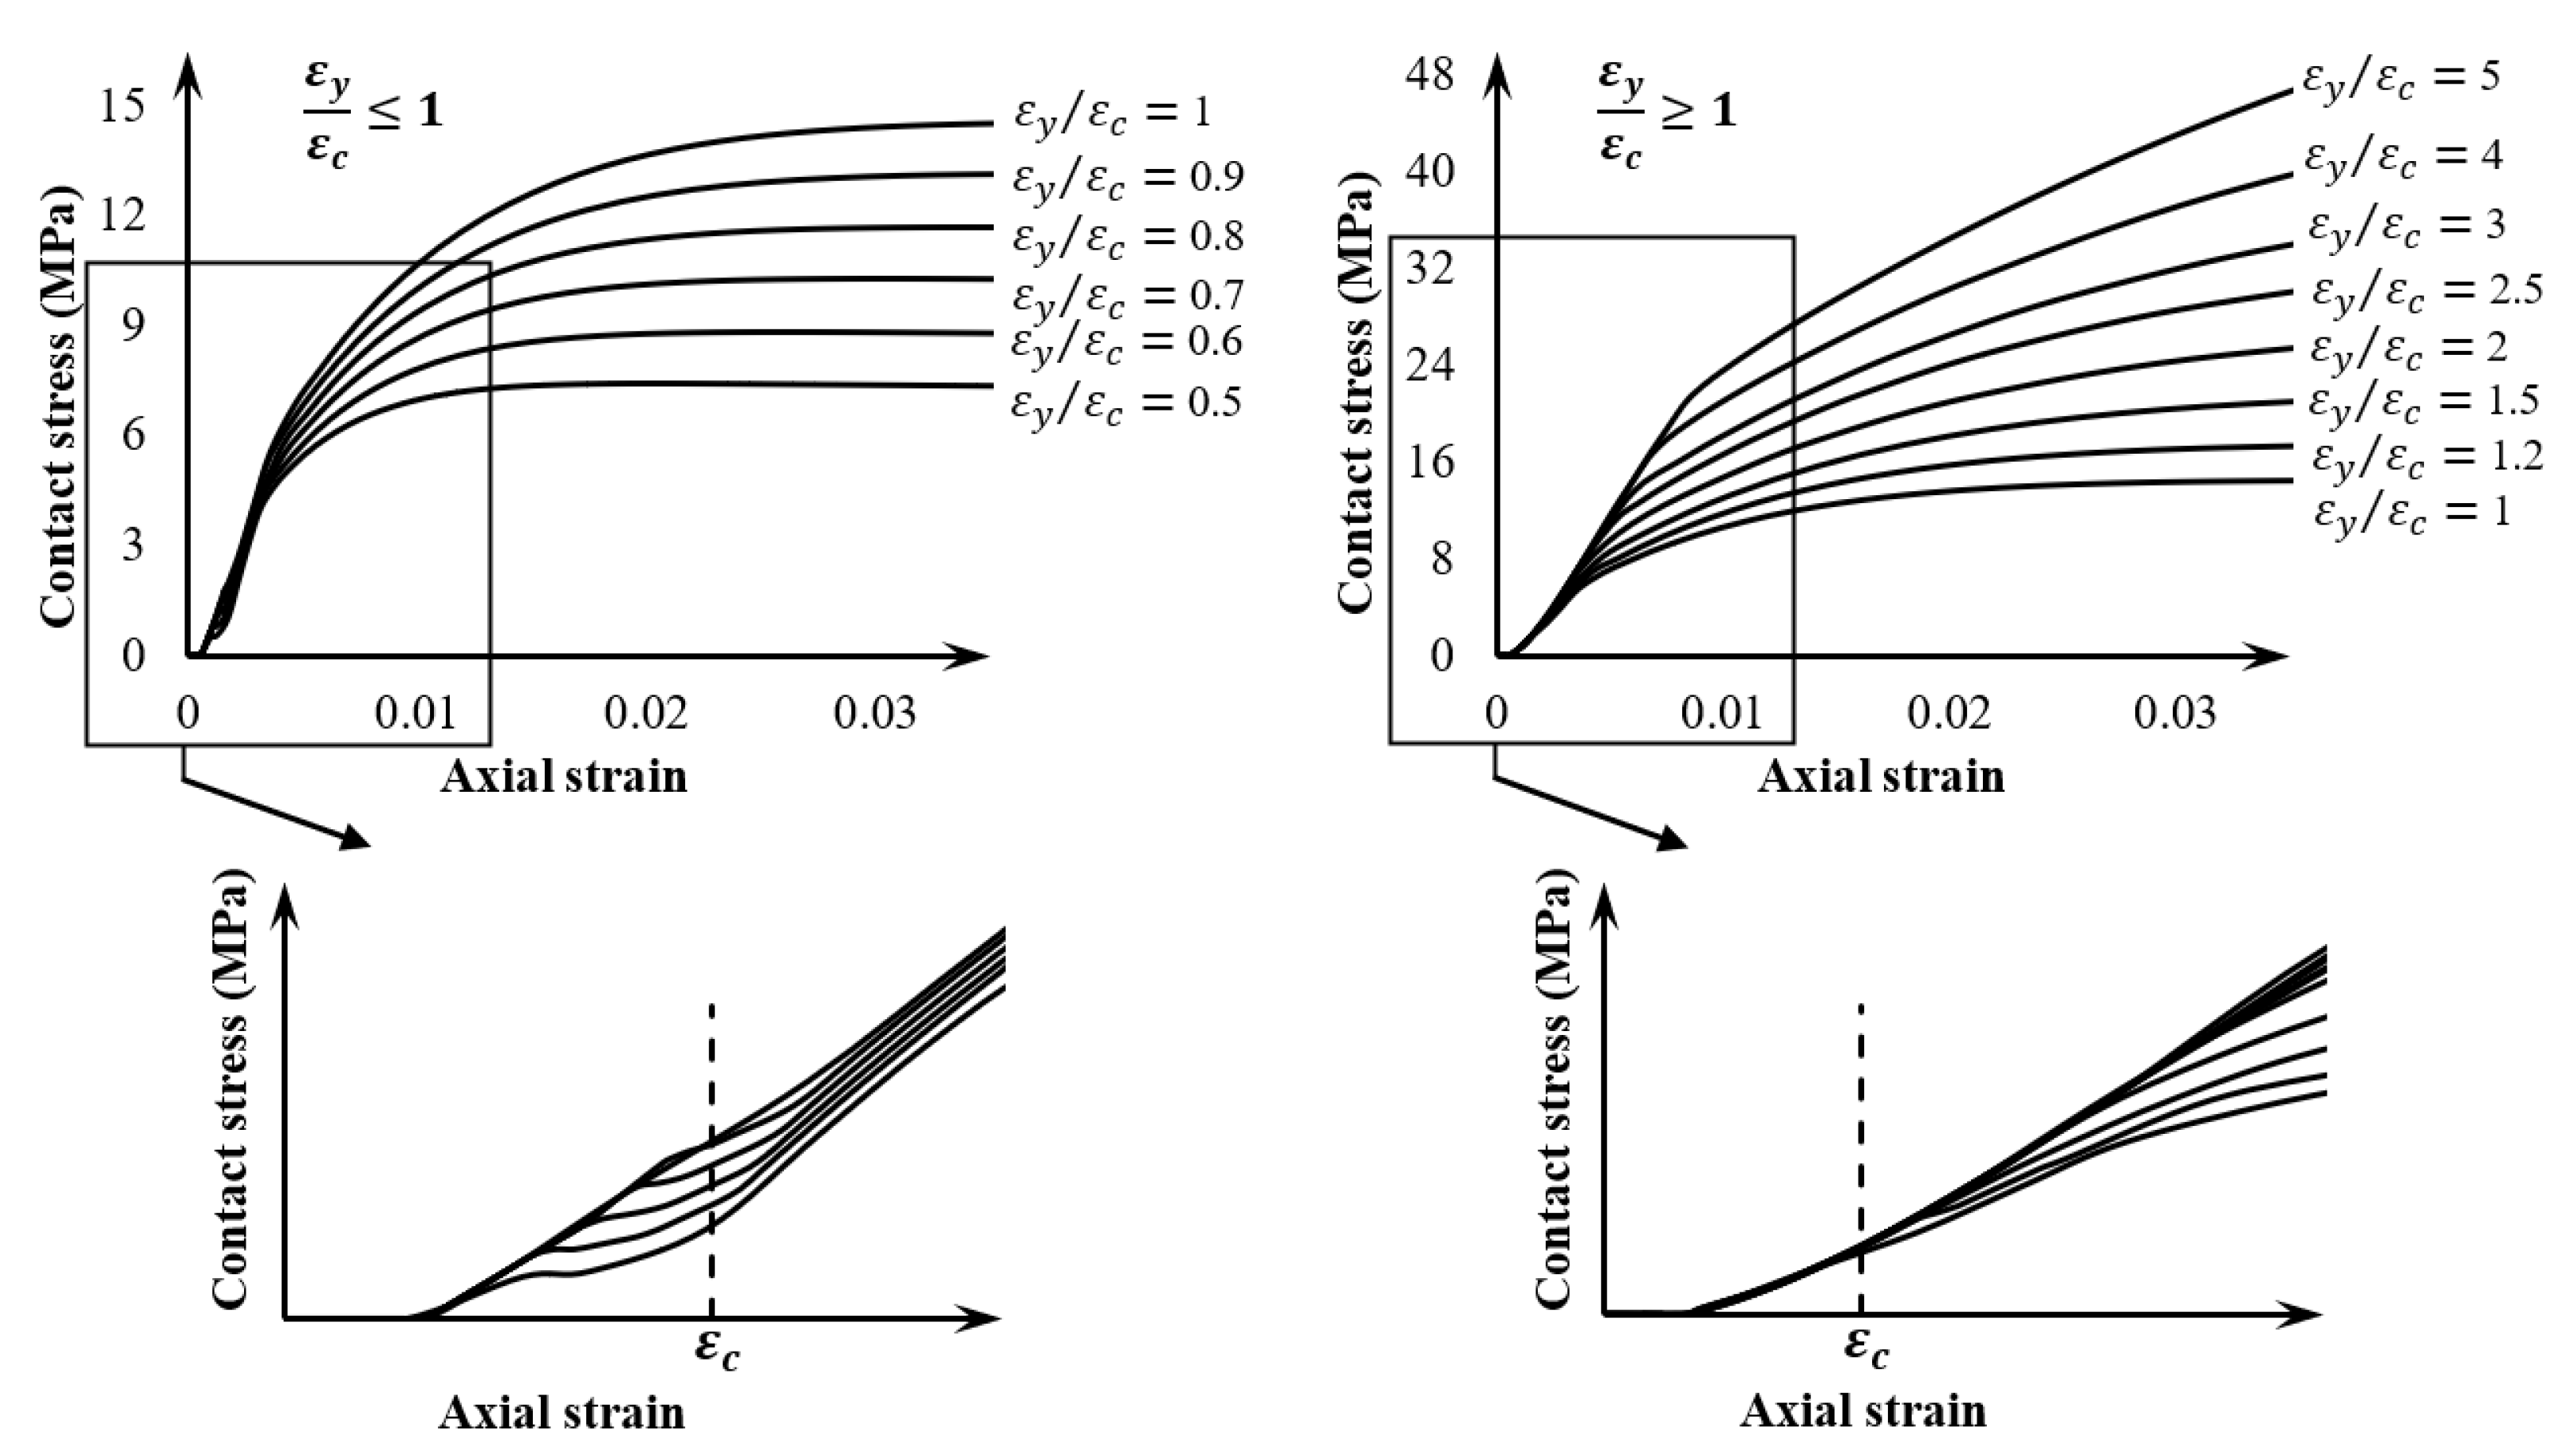
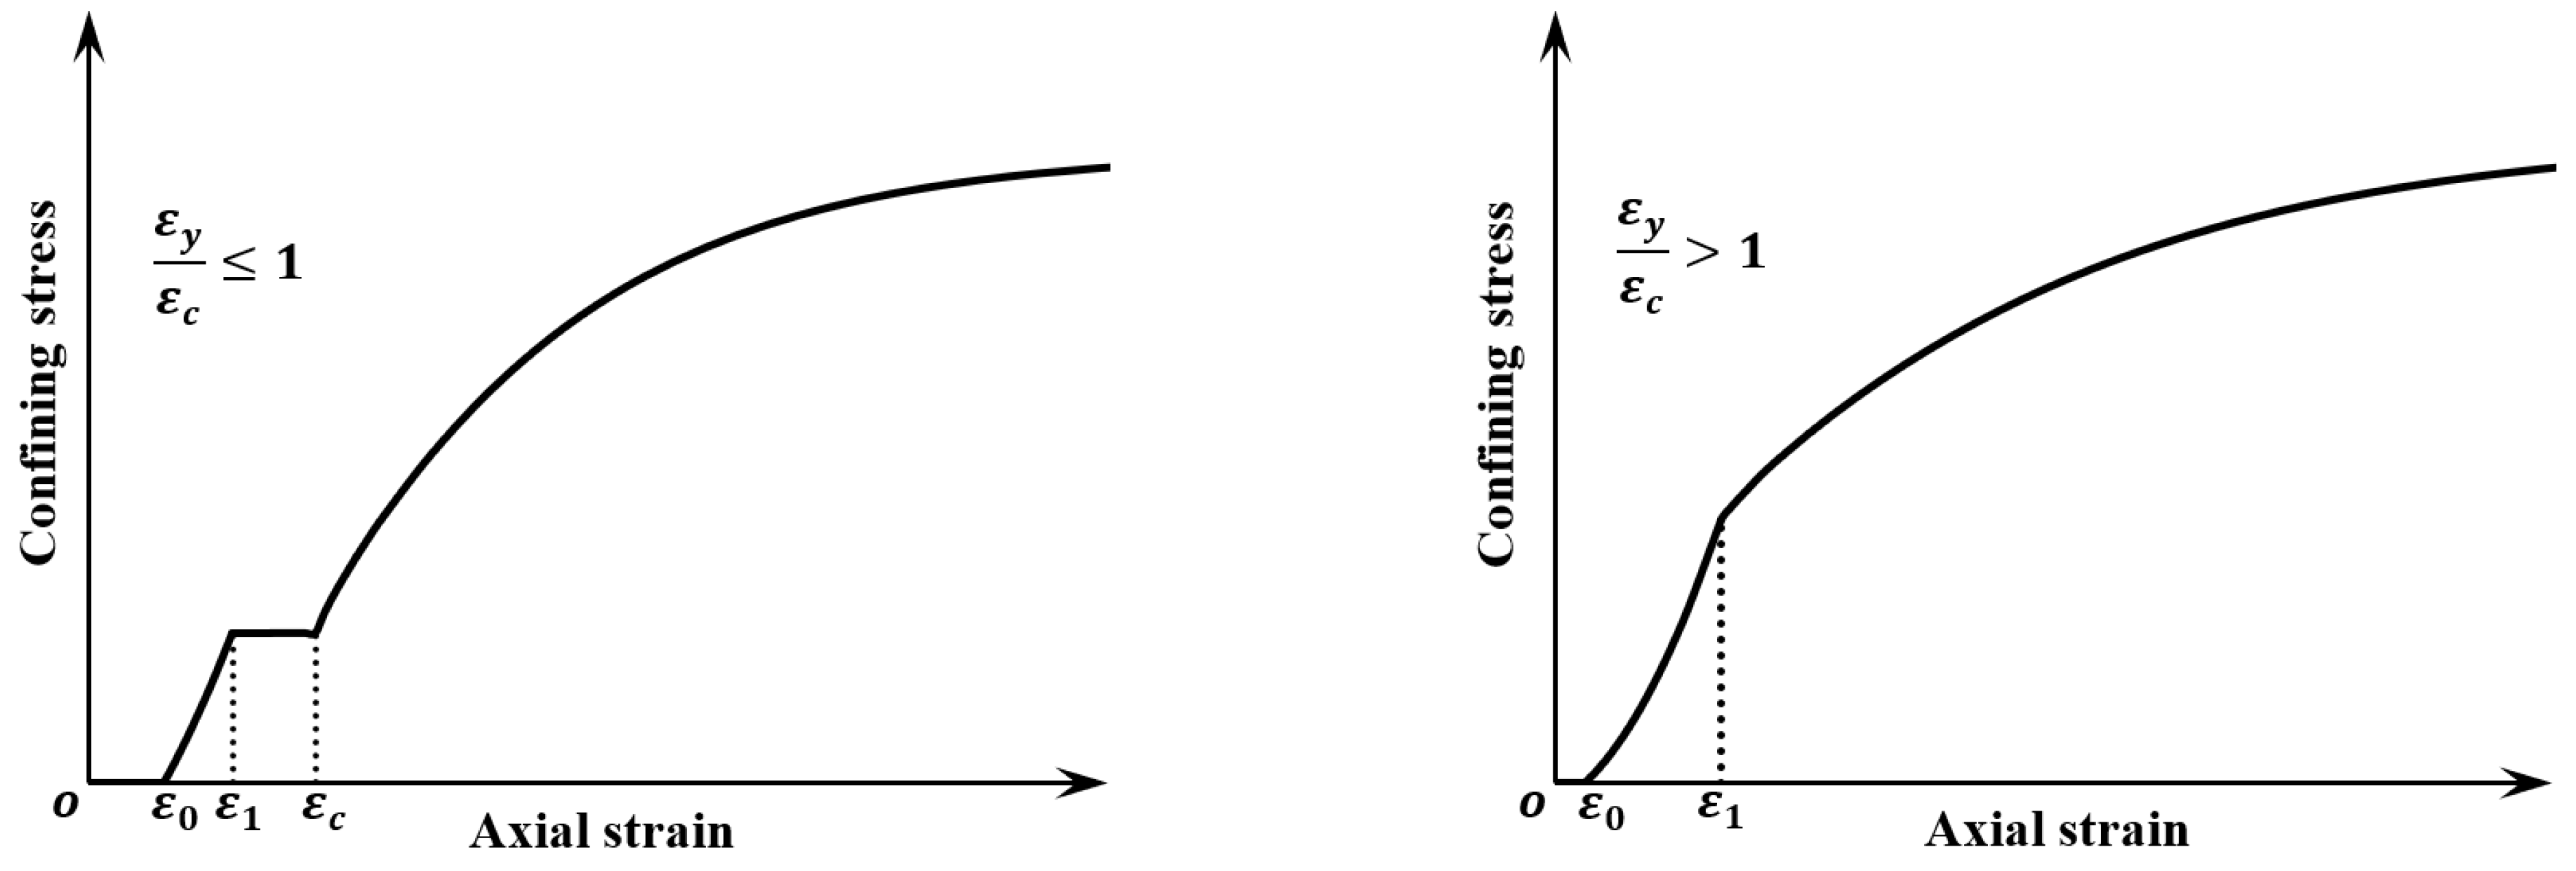
The Yield Strain of the ST ()
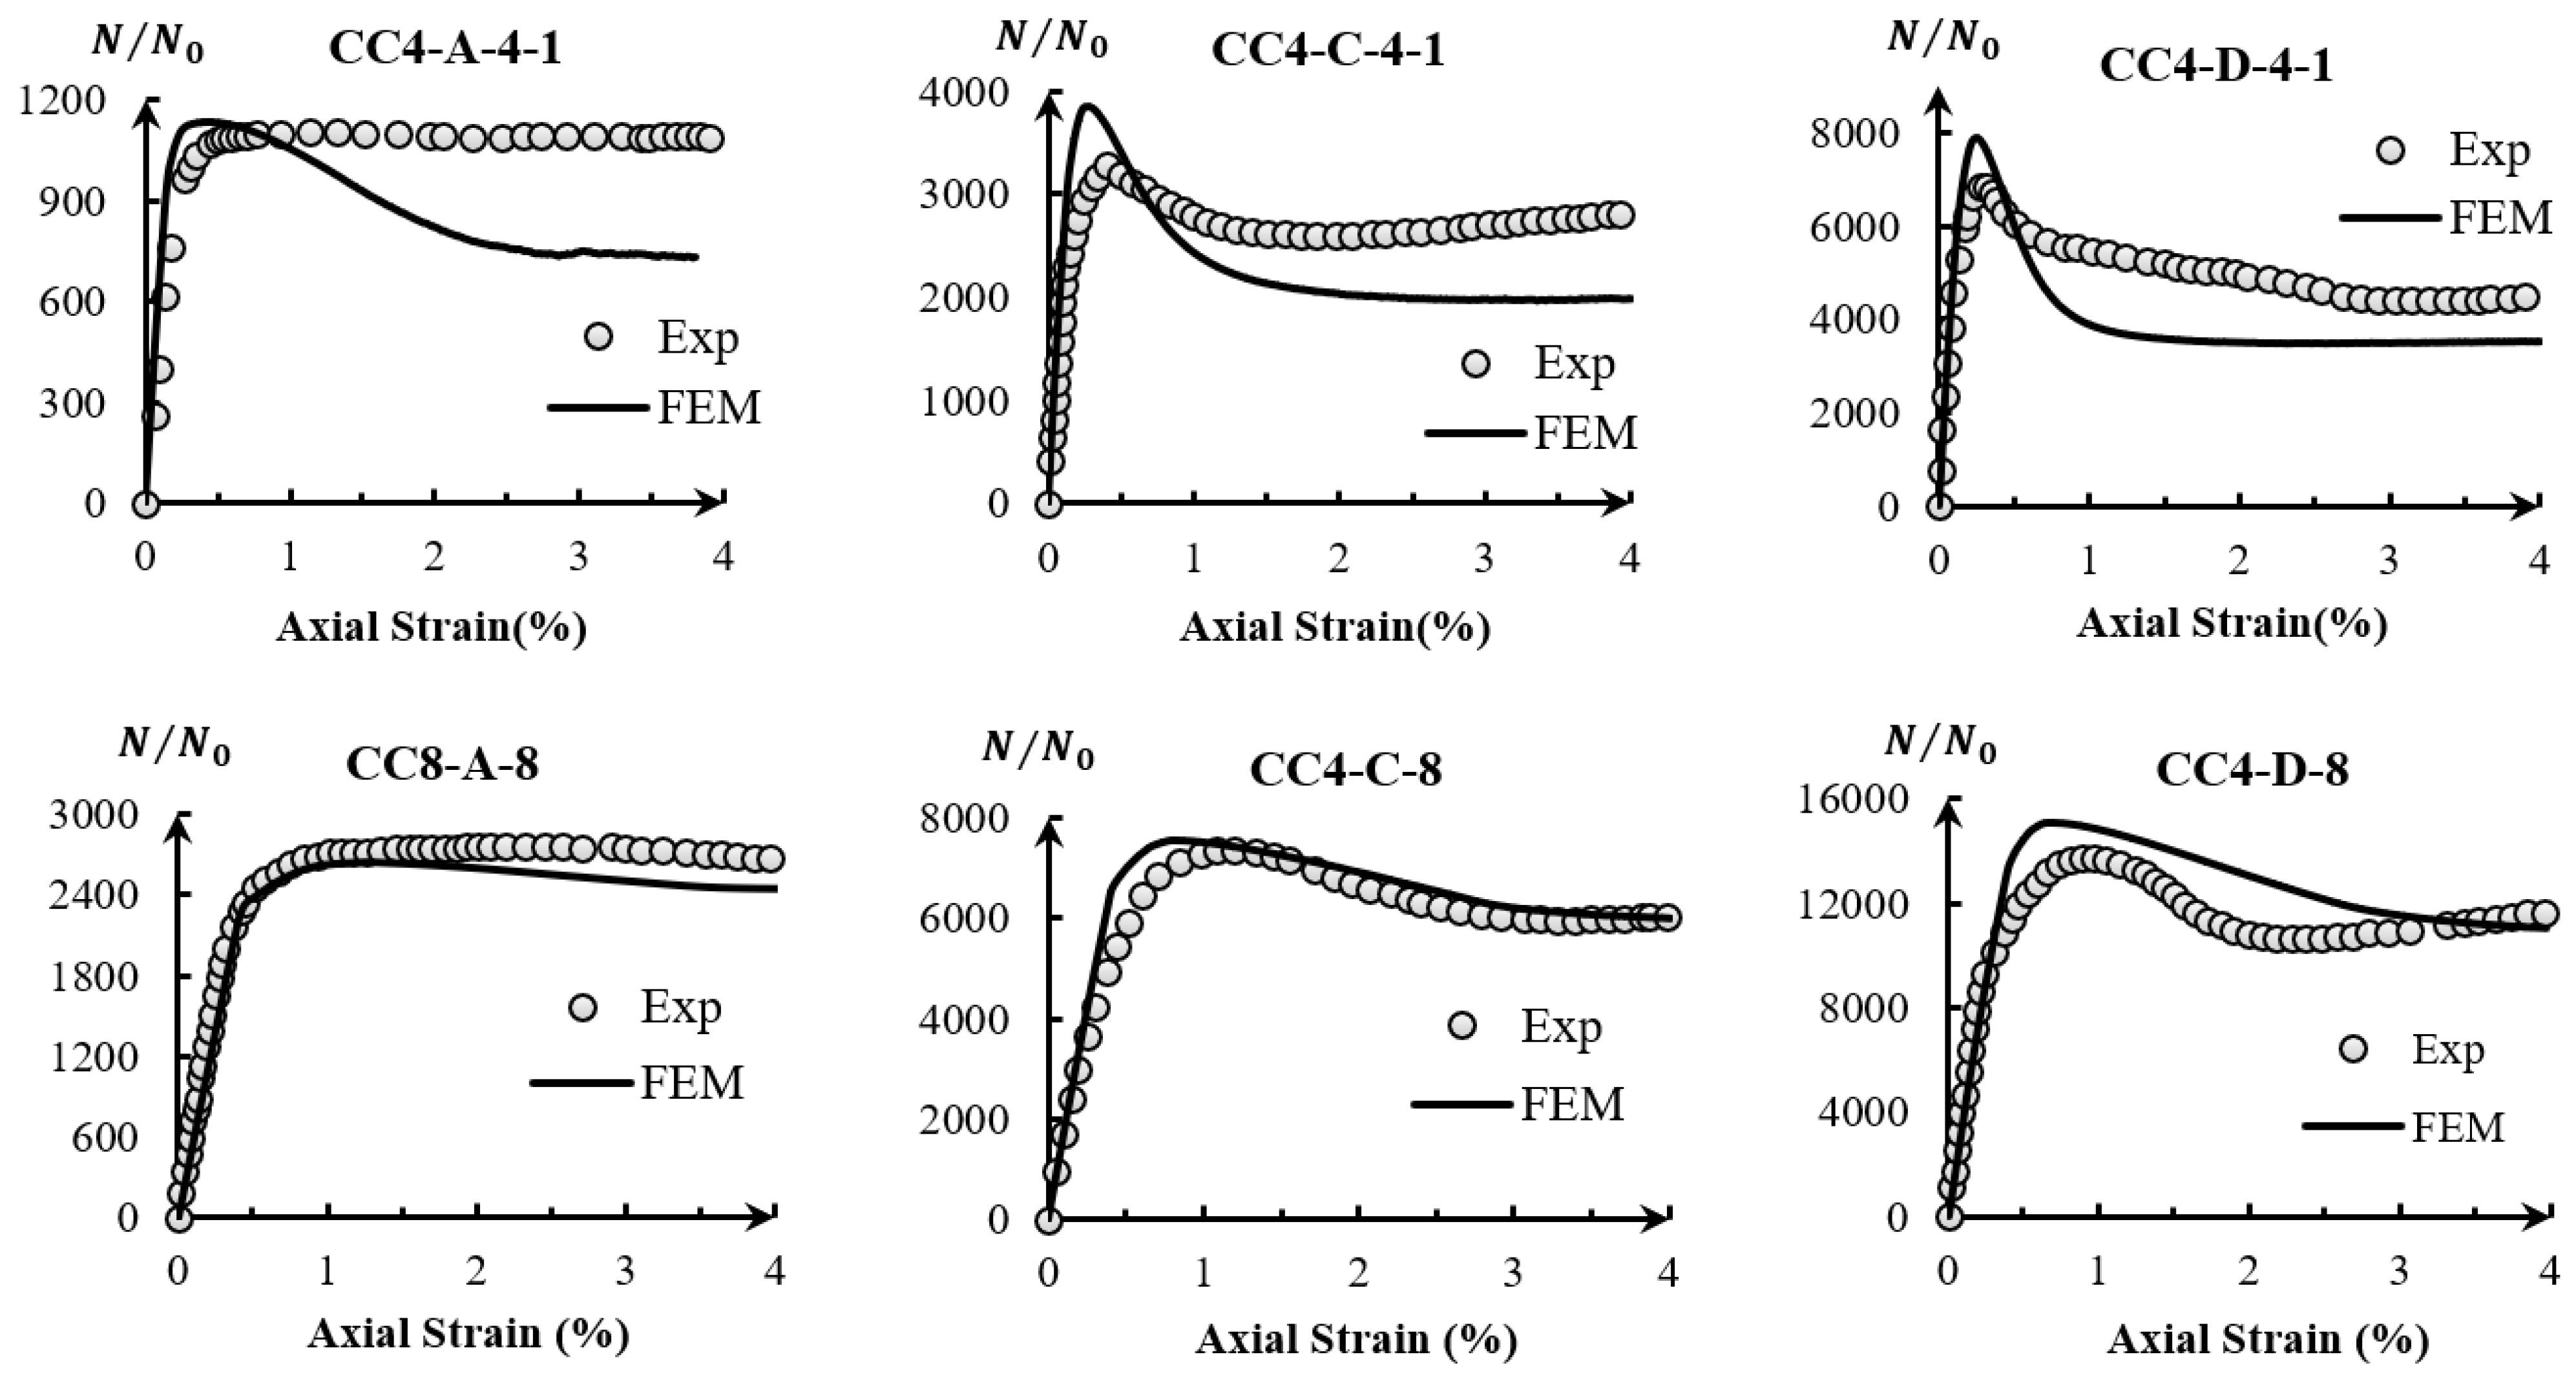
4. Finite Element Modeling
4.1. Element Type and Mesh
4.2. Interaction between the Concrete Core and the Steel Tube
4.3. Material Modeling
4.3.1. Steel Property
4.3.2. Concrete Property
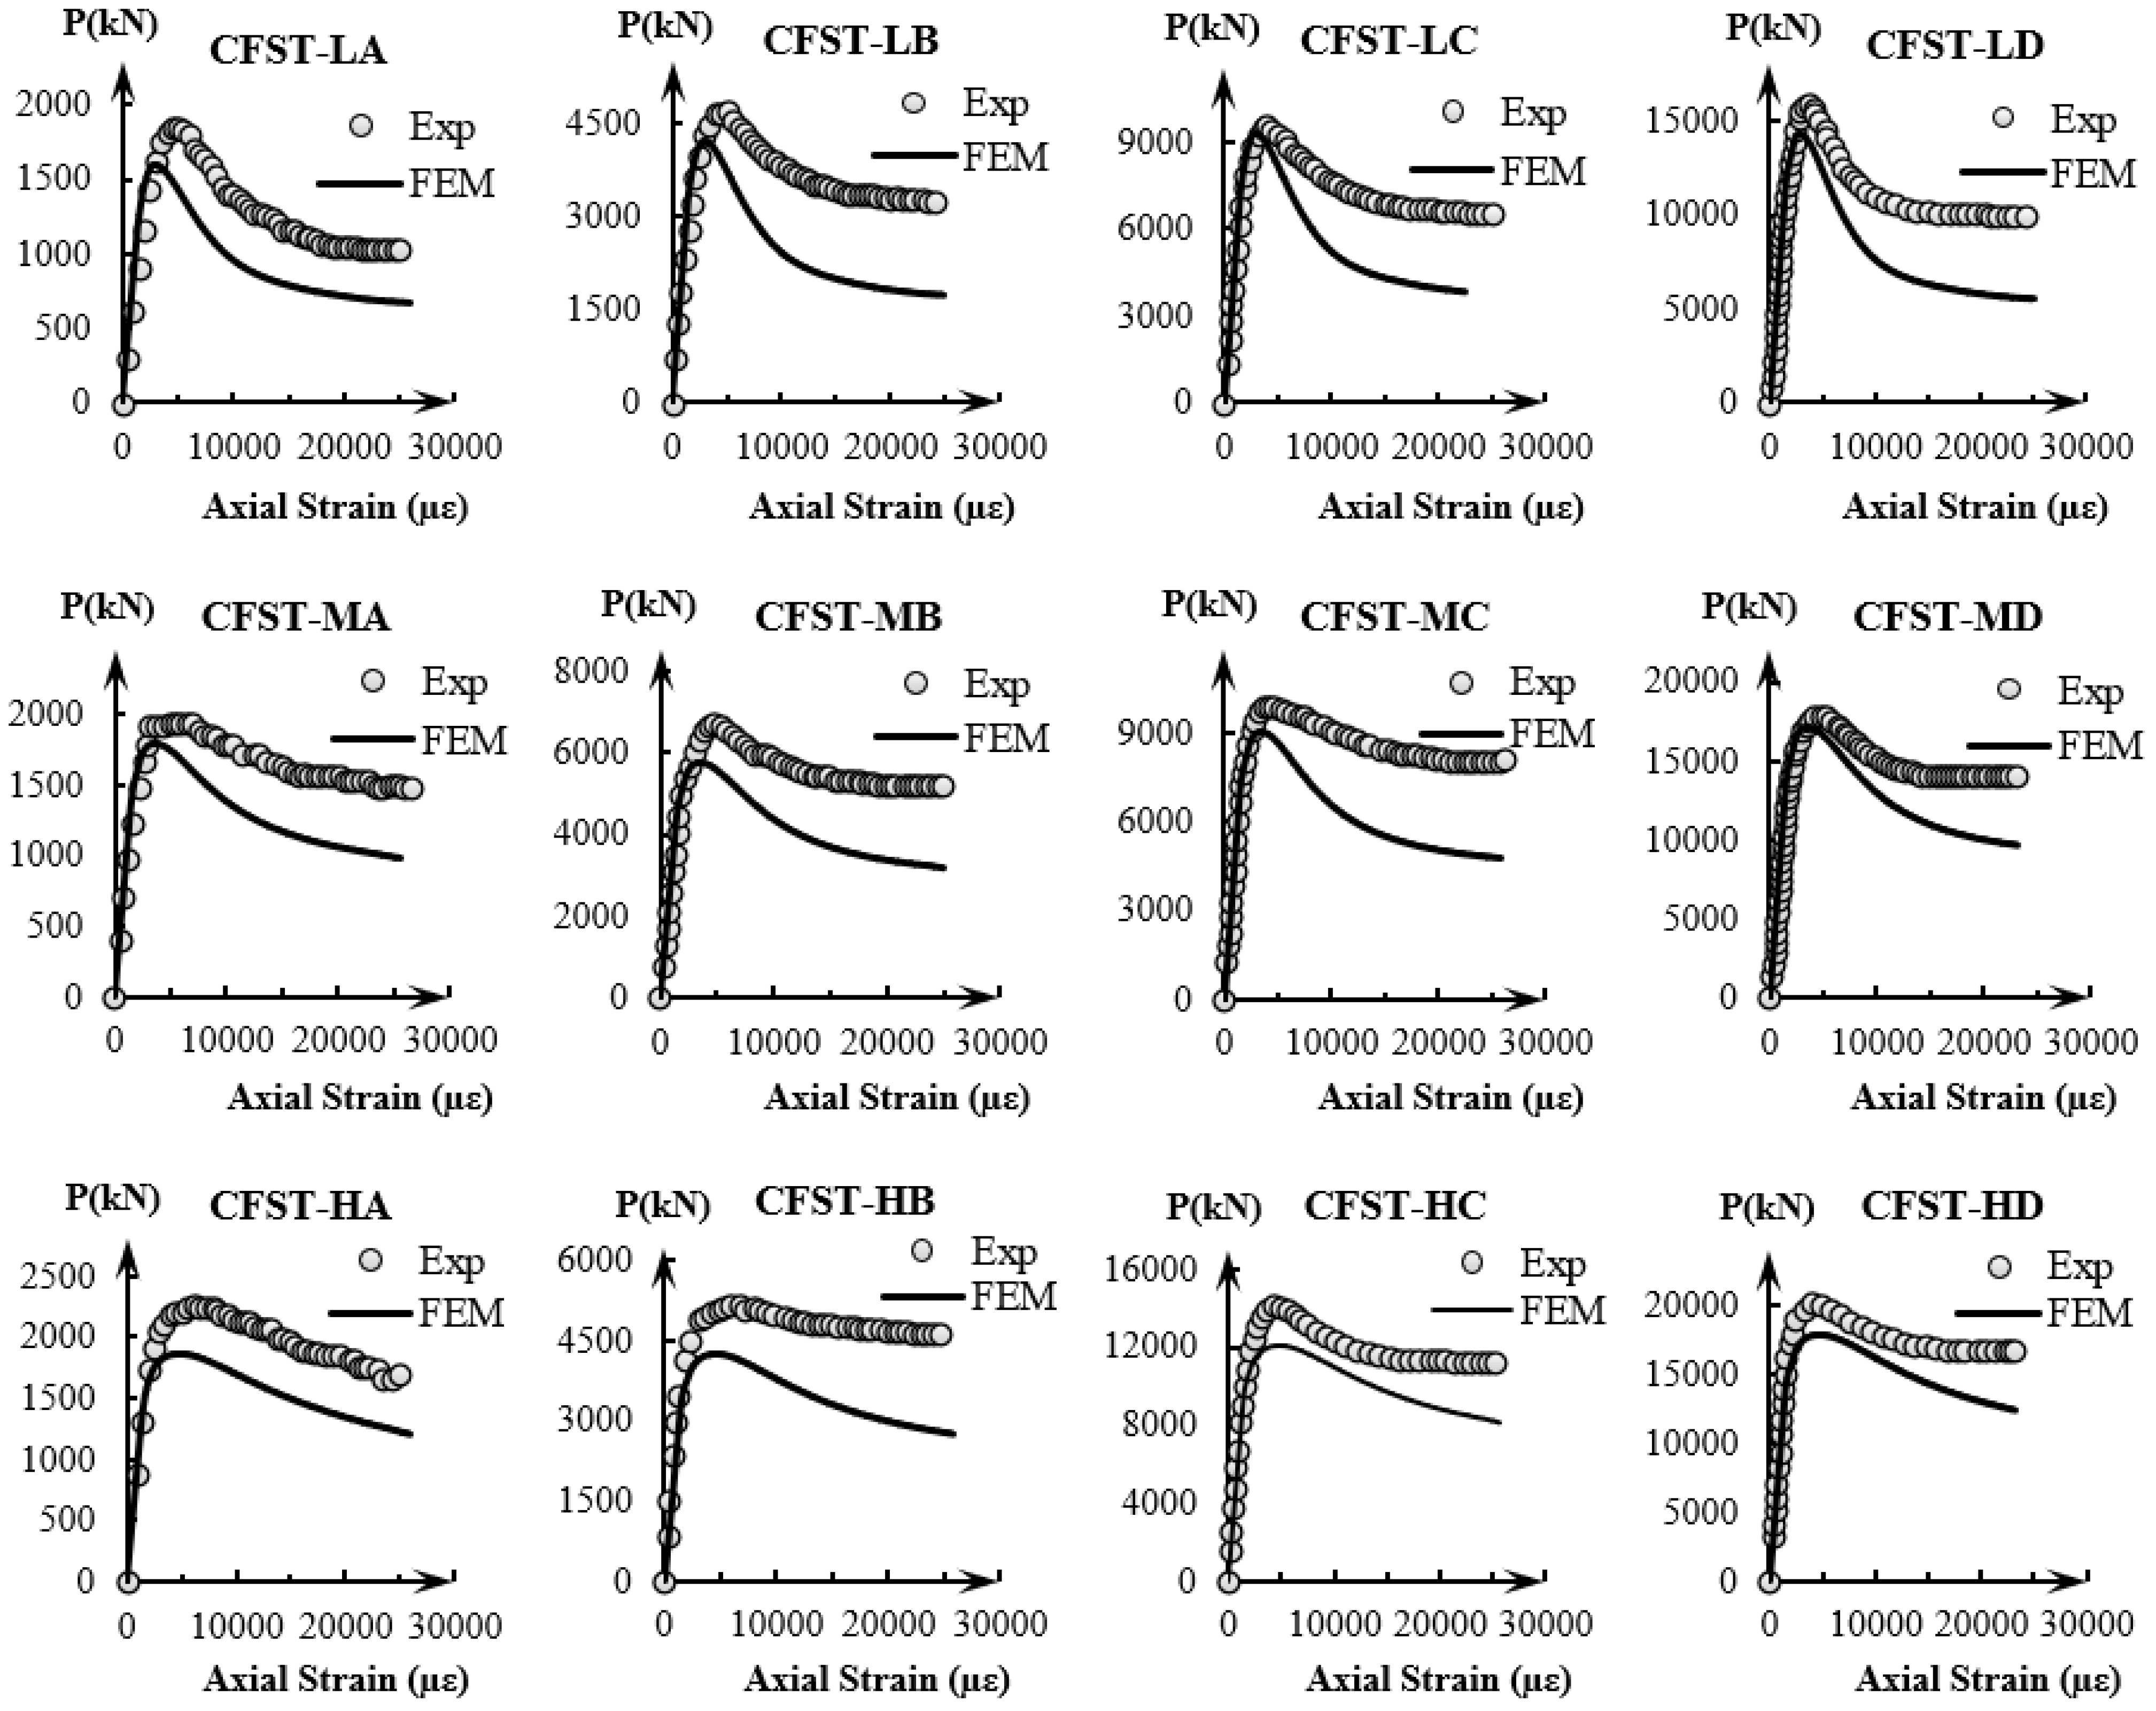
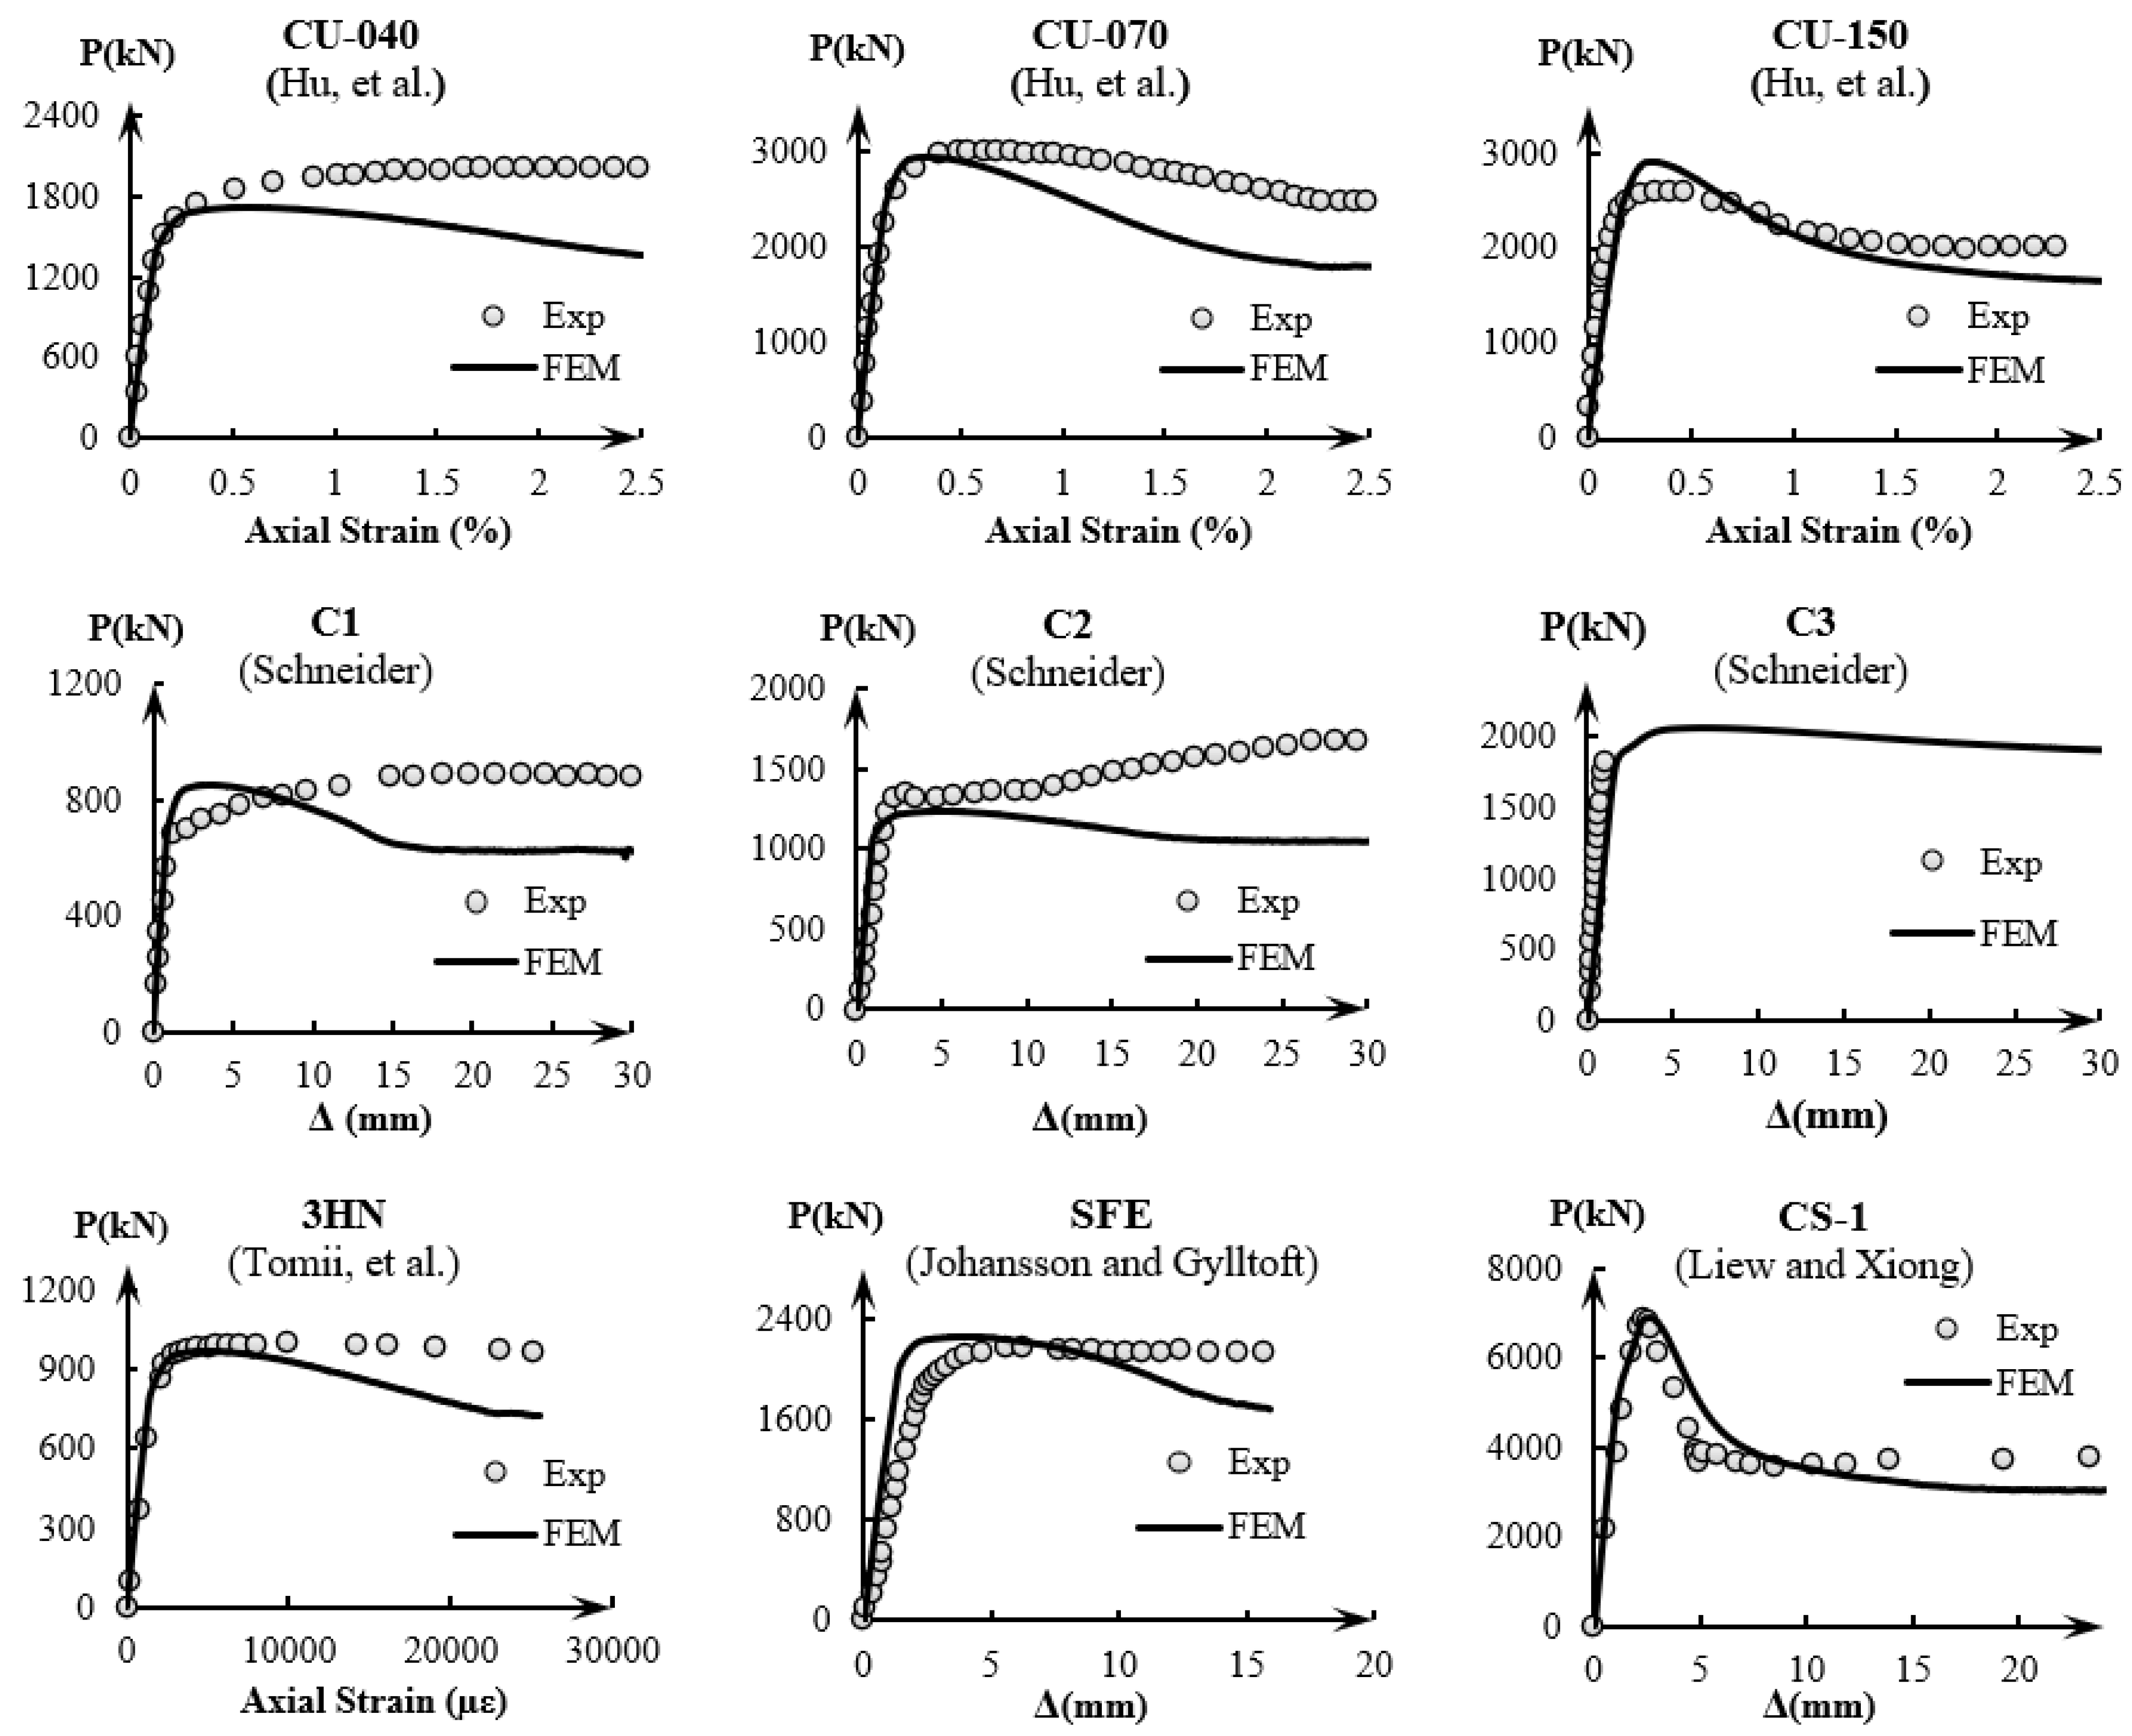
5. Results and Discussion
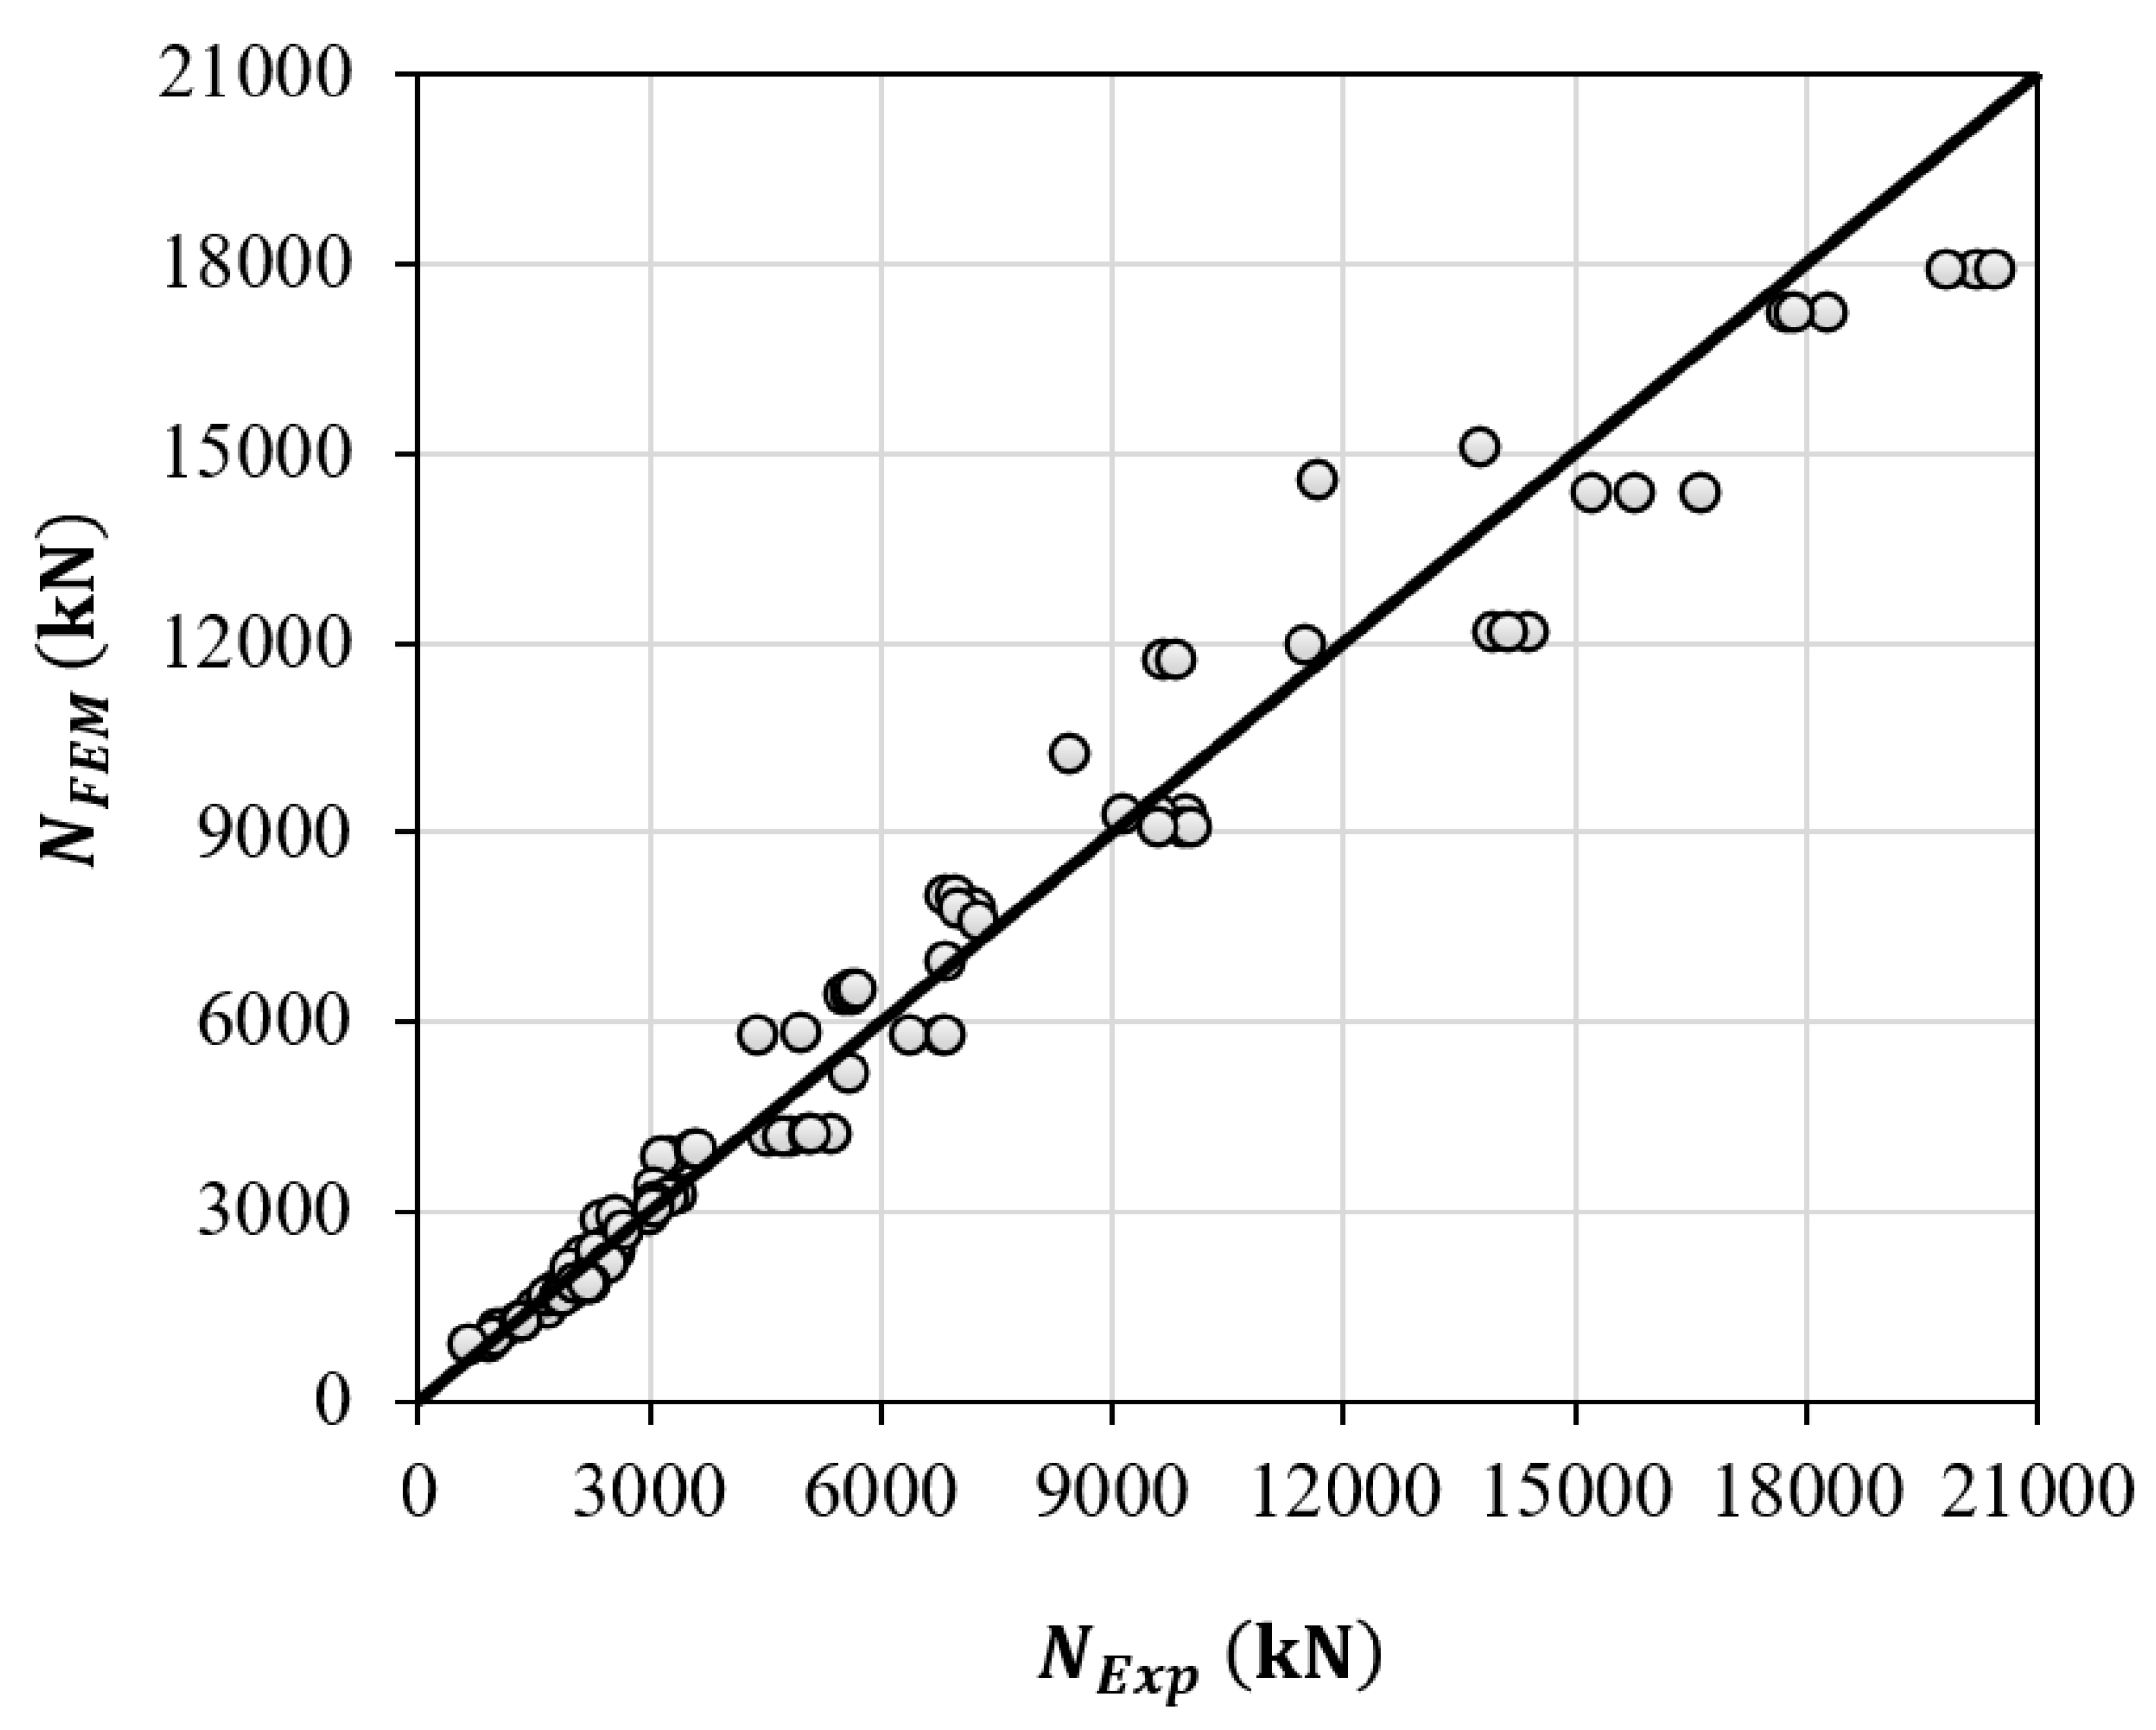
6. Comparison of the Results from Tests, Finite Element Model and Design Codes
7. Conclusions
Author Contributions
Funding
Data Availability Statement
Conflicts of Interest
Nomenclature
| Cross-sectional area of the concrete core | |
| Cross-sectional area of the steel tube | |
| Depth of the steel tube | |
| Depth of the concrete core | |
| Elastic modulus of concrete | |
| Elastic modulus of steel | |
| Compressive strength of unconfined concrete | |
| Compressive strength of confined concrete | |
| Confining stress | |
| Effective confining stress | |
| Residual stress of the concrete core | |
| The yield stress of steel | |
| Axial stress in the steel tube | |
| Hoop stress in the steel tube | |
| Confinement effectiveness coefficient | |
| Axial strain | |
| First axial strain at which the interaction between the concrete core and the steel tube occurs | |
| Strain at peak stress () of unconfined concrete | |
| Strain at peak stress () of confined concrete | |
| Axial strain at which the lateral strain of the concrete core is equal to | |
| Yield strain of steel | |
| Yield strain of the steel tube | |
| Lateral strain of the concrete core | |
| Lateral strain of the steel tube | |
| The cross-sectional deformation of the steel tube | |
| The cross-sectional deformation of the concrete core | |
| Poisson’s ratio of the concrete core | |
| Poisson’s ratio of the steel tube | |
| Coefficient of confinement |
References
- Wei, J.; Ying, H.; Yang, Y.; Zhang, W.; Yuan, H.; Zhou, J. Seismic performance of concrete-filled steel tubular composite columns with ultra high performance concrete plates. Eng. Struct. 2023, 278, 115500. [Google Scholar] [CrossRef]
- Shariati, M.; Grayeli, M.; Shariati, A.; Naghipour, M. Performance of composite frame consisting of steel beams and concrete filled tubes under fire loading. Steel Compos. Struct. Int. J. 2020, 36, 587–602. [Google Scholar]
- Khanouki, M.A.; Sulong, N.R.; Shariati, M.; Tahir, M.M. Investigation of through beam connection to concrete filled circular steel tube (CFCST) column. J. Constr. Steel Res. 2016, 121, 144–162. [Google Scholar] [CrossRef]
- Lu, D.; Wang, G.; Du, X.; Wang, Y. A nonlinear dynamic uniaxial strength criterion that considers the ultimate dynamic strength of concrete. Int. J. Impact Eng. 2017, 103, 124–137. [Google Scholar] [CrossRef]
- Hosseinpour, E.; Baharom, S.; Badaruzzaman, W.H.W.; Shariati, M.; Jalali, A. Direct shear behavior of concrete filled hollow steel tube shear connector for slim-floor steel beams. Steel Compos. Struct. Int. J. 2018, 26, 485–499. [Google Scholar]
- Shi, J.; Zhao, B.; He, J.; Lu, X. The optimization design for the journal-thrust couple bearing surface texture based on particle swarm algorithm. Tribol. Int. 2024, 198, 109874. [Google Scholar] [CrossRef]
- Song, X.; Wang, W.; Deng, Y.; Su, Y.; Jia, F.; Zaheer, Q.; Long, X. Data-driven modeling for residual velocity of projectile penetrating reinforced concrete slabs. Eng. Struct. 2024, 306, 117761. [Google Scholar] [CrossRef]
- Huang, H.; Guo, M.; Zhang, W.; Zeng, J.; Yang, K.; Bai, H. Numerical investigation on the bearing capacity of RC columns strengthened by HPFL-BSP under combined loadings. J. Build. Eng. 2021, 39, 102266. [Google Scholar] [CrossRef]
- Arabnejad Khanouki, M.; Ramli Sulong, N.; Shariati, M. Investigation of seismic behaviour of composite structures with concrete filled square steel tubular (CFSST) column by push-over and time-history analyses. In Proceedings of the 4th International Conference on Steel Composite Structures, Sydney, Australia, 21–23 July 2010. [Google Scholar]
- Naghipour, M.; Ahmadi, M.; Nematzadeh, M. Effect of concrete confinement level on load-bearing capacity of steel-reinforced concrete (SRC) columns under eccentric loading: Experiment and FEA model. Structures 2022, 35, 202–213. [Google Scholar] [CrossRef]
- Piccardo, C.; Steinik, C.; Caffè, S.; Argentoni, A.; Calderini, C. Primary Energy and Carbon Impacts of Structural Frames with Equivalent Design Criteria: Influence of Different Materials and Levels of Prefabrication. Sustainability 2024, 16, 4209. [Google Scholar] [CrossRef]
- Fărcean, I.; Proștean, G.; Ardelean, E.; Socalici, A.; Ardelean, M. Development of a Waste Management Strategy in a Steel Company. Sustainability 2024, 16, 4378. [Google Scholar] [CrossRef]
- Arjomandi, A.; Mousavi, R.; Tayebi, M.; Nematzadeh, M.; Gholampour, A.; Aminian, A.; Gencel, O. The effect of sulfuric acid attack on mechanical properties of steel fiber-reinforced concrete containing waste nylon aggregates: Experiments and RSM-based optimization. J. Build. Eng. 2023, 64, 105500. [Google Scholar] [CrossRef]
- Ren, Z.; Wang, D.; Li, P. Axial compressive behaviour and confinement effect of round-ended rectangular CFST with different central angles. Compos. Struct. 2022, 285, 115193. [Google Scholar] [CrossRef]
- Luo, H.; Aguiar, J.; Wan, X.; Wang, Y.; Cunha, S.; Jia, Z. Application of Aggregates from Construction and Demolition Wastes in Concrete: Review. Sustainability 2024, 16, 4277. [Google Scholar] [CrossRef]
- Shariati, M.; Kamyab, H.; Habibi, M.; Ahmadi, S.; Naghipour, M.; Gorjinezhad, F.; Aminian, A. Sulfuric acid resistance of concrete containing coal waste as a partial substitute for fine and coarse aggregates. Fuel 2023, 348, 128311. [Google Scholar] [CrossRef]
- Jin, L.; Fan, L.; Du, X. Meso-scale modeling of size effect in eccentrically-loaded squared CFST columns: Influence of eccentricity and confinement effect. Thin-Walled Struct. 2021, 169, 108455. [Google Scholar] [CrossRef]
- Hu, H.T.; Huang, C.S.; Wu, M.H.; Wu, Y.M. Nonlinear analysis of axially loaded concrete-filled tube columns with confinement effect. J. Struct. Eng. 2003, 129, 1322–1329. [Google Scholar] [CrossRef]
- Starossek, U.; Falah, N.; Lohning, T. Numerical analyses of the force transfer in concrete-filled steel tube columns. Struct. Eng. Mech. Int. J. 2010, 35, 241–256. [Google Scholar] [CrossRef]
- Tao, Z.; Wang, Z.-B.; Yu, Q. Finite element modelling of concrete-filled steel stub columns under axial compression. J. Constr. Steel Res. 2013, 89, 121–131. [Google Scholar] [CrossRef]
- Thai, H.-T.; Uy, B.; Khan, M.; Tao, Z.; Mashiri, F. Numerical modelling of concrete-filled steel box columns incorporating high strength materials. J. Constr. Steel Res. 2014, 102, 256–265. [Google Scholar] [CrossRef]
- Lai, M.H.; Ho, J.C.M. An analysis-based model for axially loaded circular CFST columns. Thin-Walled Struct. 2017, 119, 770–781. [Google Scholar] [CrossRef]
- Karthik, M.M.; Mander, J.B. Stress-block parameters for unconfined and confined concrete based on a unified stress-strain model. J. Struct. Eng. 2011, 137, 270–273. [Google Scholar] [CrossRef]
- Sheikh, S.A.; Uzumeri, S.M. Strength and ductility of tied concrete columns. J. Struct. Div. 1980, 106, 1079–1102. [Google Scholar] [CrossRef]
- Mander, J.B.; Priestley, M.J.; Park, R. Theoretical stress-strain model for confined concrete. J. Struct. Eng. 1988, 114, 1804–1826. [Google Scholar] [CrossRef]
- Haghinejada, A.; Nematzadeh, M. Three-dimensional finite element analysis of compressive behavior of circular steel tube-confined concrete stub columns by new confinement relationships. Lat. Am. J. Solids Struct. 2016, 13, 916–944. [Google Scholar] [CrossRef]
- Rabbat, B.G.; Russell, H. Friction coefficient of steel on concrete or grout. J. Struct. Eng. 1985, 111, 505–515. [Google Scholar] [CrossRef]
- Shariati, M.; Raeispour, M.; Naghipour, M.; Kamyab, H.; Memarzadeh, A.; Nematzadeh, M.; Toghroli, A. Flexural behavior analysis of double honeycomb steel composite encased concrete beams: An integrated experimental and finite element study. Case Stud. Constr. Mater. 2024, 20, e03299. [Google Scholar] [CrossRef]
- Mohammad-Ebrahimzadeh-Sepasgozar, S.; Naghipour, M.; Nematzadeh, M. Experimental hysteretic behavior of CFST column-foundation connections with novel detailing in embedded region. Structures 2024, 59, 105711. [Google Scholar] [CrossRef]
- Papanikolaou, V.K.; Kappos, A.J. Confinement-sensitive plasticity constitutive model for concrete in triaxial compression. Int. J. Solids Struct. 2007, 44, 7021–7048. [Google Scholar] [CrossRef]
- Han, L.-H.; Yao, G.-H.; Tao, Z. Performance of concrete-filled thin-walled steel tubes under pure torsion. Thin-Walled Struct. 2007, 45, 24–36. [Google Scholar] [CrossRef]
- Binici, B. An analytical model for stress–strain behavior of confined concrete. Eng. Struct. 2005, 27, 1040–1051. [Google Scholar] [CrossRef]
- Richart, F.E.; Brandtzæg, A.; Brown, R.L. A study of the failure of concrete under combined compressive stresses. Univ. Illinois. Eng. Exp. Station. Bull. 1928, 26, 185. [Google Scholar]
- Code, M. CEB-FIP Model Code 1990: Design Code; Thomas Telford Publishing: London, UK, 1993. [Google Scholar]
- Johansson, M.; Gylltoft, K. Mechanical behavior of circular steel–concrete composite stub columns. J. Struct. Eng. 2002, 128, 1073–1081. [Google Scholar] [CrossRef]
- Sakino, K.; Nakahara, H.; Morino, S.; Nishiyama, I. Behavior of centrally loaded concrete-filled steel-tube short columns. J. Struct. Eng. 2004, 130, 180–188. [Google Scholar] [CrossRef]
- Tomii, M. Experimental studies on concrete filled steel tubular stub columns under concentric loading. In Proceedings of the International Colloquium on Stability of Structures under Static and Dynamic Loads, SSRC/ASCE, Washington, DC, USA, 17–19 May 1977. [Google Scholar]
- Schneider, S.P. Axially loaded concrete-filled steel tubes. J. Struct. Eng. 1998, 124, 1125–1138. [Google Scholar] [CrossRef]
- Wang, Y.; Chen, P.; Liu, C.; Zhang, Y. Size effect of circular concrete-filled steel tubular short columns subjected to axial compression. Thin-Walled Struct. 2017, 120, 397–407. [Google Scholar] [CrossRef]
- Liew, J.Y.R.; Xiong, M.; Xiong, D. Design of concrete filled tubular beam-columns with high strength steel and concrete. Structures 2016, 8, 213–226. [Google Scholar] [CrossRef]
- AISC. Specification for Structural Steel Buildings; ANSI/AISC: Chicago, IN, USA, 2005. [Google Scholar]
- Architectural Institute of Japan. Standards for Structural Calculation of Steel Reinforced Concrete Structures; Architectural Institute of Japan: Tokyo, Japan, 2001. [Google Scholar]
- Beng, S.H.; Park, S. 1994-Eurocode 4: Design of Composite Steel and Concrete Structures; European Committee for Standardization: Brussels, Belgium, 2004; p. 2022. [Google Scholar]
- China Engineering Construction Association. Technical Specification for Concrete-Filled Steel Tubular Structures; China Planning Press: Beijing, China, 2012. [Google Scholar]
- O’Shea, M.D.; Bridge, R.Q. Design of circular thin-walled concrete filled steel tubes. J. Struct. Eng. 2000, 126, 1295–1303. [Google Scholar]


| R | R2 | RMSE | RRMSE | MAE | MAPE | |
|---|---|---|---|---|---|---|
| 0.98 | 0.97 | 0.069 | 0.19 | 0.045 | 17.29 | 0.09 |
| Specimen | D (mm) | t (mm) | (mm) | (MPa) | (MPa) | (kN) | |||||||
|---|---|---|---|---|---|---|---|---|---|---|---|---|---|
| CFST-LA-1 | 153 | 1.54 | 99.3 | 306 | 345 | 73.2 | 0.72 | 1823 | 0.69 | 0.93 | 0.99 | 0.78 | 0.88 |
| CFST-LA-2 | 1842 | 0.68 | 0.92 | 0.98 | 0.77 | 0.87 | |||||||
| CFST-LA-3 | 1872 | 0.67 | 0.91 | 0.96 | 0.76 | 0.86 | |||||||
| CFST-LB-1 | 250 | 2.48 | 100.8 | 500 | 326 | 73.2 | 0.67 | 4871 | 0.75 | 0.92 | 0.98 | 0.77 | 0.86 |
| CFST-LB-2 | 4528 | 0.81 | 0.99 | 1.05 | 0.82 | 0.92 | |||||||
| CFST-LB-3 | 4733 | 0.77 | 0.95 | 1.01 | 0.79 | 0.88 | |||||||
| CFST-LC-1 | 372 | 3.64 | 102.2 | 744 | 320 | 73.2 | 0.68 | 9163 | 0.85 | 1.07 | 1.15 | 0.9 | 1.01 |
| CFST-LC-2 | 9996 | 0.78 | 0.98 | 1.05 | 0.82 | 0.93 | |||||||
| CFST-LC-3 | 9604 | 0.81 | 1.02 | 1.09 | 0.86 | 0.96 | |||||||
| CFST-LD-1 | 469 | 4.66 | 100.6 | 938 | 291 | 73.2 | 0.61 | 15,827 | 0.85 | 0.97 | 1.04 | 0.81 | 0.91 |
| CFST-LD-2 | 16,670 | 0.8 | 0.92 | 0.99 | 0.77 | 0.86 | |||||||
| CFST-LD-3 | 15,239 | 0.88 | 1.01 | 1.08 | 0.84 | 0.94 | |||||||
| CFST-MA-1 | 157 | 2.48 | 63.3 | 314 | 326 | 73.2 | 0.67 | 2117 | 0.78 | 0.93 | 0.96 | 0.77 | 0.85 |
| CFST-MA-2 | 2058 | 0.8 | 0.96 | 0.99 | 0.79 | 0.87 | |||||||
| CFST-MA-3 | 2068 | 0.8 | 0.95 | 0.99 | 0.79 | 0.87 | |||||||
| CFST-MB-1 | 282 | 4.36 | 64.8 | 564 | 322 | 73.2 | 0.65 | 6811 | 0.78 | 0.92 | 0.96 | 0.76 | 0.84 |
| CFST-MB-2 | 6380 | 0.83 | 0.99 | 1.03 | 0.82 | 0.9 | |||||||
| CFST-MB-3 | 6860 | 0.77 | 0.92 | 0.95 | 0.76 | 0.84 | |||||||
| CFST-MC-1 | 358 | 5.66 | 63.2 | 716 | 290 | 73.2 | 0.62 | 9947 | 0.84 | 0.99 | 1.04 | 0.82 | 0.91 |
| CFST-MC-2 | 10,045 | 0.83 | 0.98 | 1.03 | 0.81 | 0.9 | |||||||
| CFST-MC-3 | 9609 | 0.87 | 1.03 | 1.08 | 0.85 | 0.94 | |||||||
| CFST-MD-1 | 474 | 7.42 | 63.9 | 948 | 317 | 73.2 | 0.64 | 17,787 | 0.84 | 1 | 1.04 | 0.83 | 0.96 |
| CFST-MD-2 | 18,306 | 0.82 | 0.97 | 1.01 | 0.8 | 0.94 | |||||||
| CFST-MD-3 | 17,885 | 0.84 | 0.99 | 1.03 | 0.82 | 0.96 | |||||||
| CFST-HA-1 | 153 | 3.64 | 42 | 306 | 320 | 73.2 | 0.68 | 2264 | 0.75 | 0.93 | 0.95 | 0.76 | 0.82 |
| CFST-HA-2 | 2274 | 0.75 | 0.93 | 0.94 | 0.76 | 0.82 | |||||||
| CFST-HA-3 | 2205 | 0.77 | 0.96 | 0.97 | 0.79 | 0.84 | |||||||
| CFST-HB-1 | 235 | 5.66 | 41.5 | 470 | 290 | 73.2 | 0.62 | 5390 | 0.73 | 0.89 | 0.92 | 0.73 | 0.79 |
| CFST-HB-2 | 5047 | 0.78 | 0.95 | 0.98 | 0.78 | 0.84 | |||||||
| CFST-HB-3 | 5096 | 0.77 | 0.94 | 0.97 | 0.77 | 0.83 | |||||||
| CFST-HC-1 | 393 | 9.38 | 41.9 | 786 | 312 | 73.2 | 0.63 | 13,936 | 0.8 | 0.99 | 1.01 | 0.81 | 0.87 |
| CFST-HC-2 | 14,406 | 0.78 | 0.96 | 0.98 | 0.79 | 0.84 | |||||||
| CFST-HC-3 | 14,161 | 0.79 | 0.97 | 0.99 | 0.8 | 0.86 | |||||||
| CFST-HD-1 | 477 | 11.36 | 42 | 954 | 310 | 73.2 | 0.63 | 20,237 | 0.81 | 1 | 1.02 | 0.82 | 0.88 |
| CFST-HD-2 | 20,462 | 0.8 | 0.99 | 1.01 | 0.81 | 0.87 | |||||||
| CFST-HD-3 | 19,854 | 0.83 | 1.02 | 1.04 | 0.84 | 0.9 |
| Specimen | D (mm) | t (mm) | (mm) | (MPa) | (MPa) | (kN) | |||||||
|---|---|---|---|---|---|---|---|---|---|---|---|---|---|
| CC4-A-2 | 149 | 2.96 | 50.4 | 3 | 308 | 25.4 | 0.83 | 941 | 0.86 | 1.14 | 1.03 | 0.93 | 0.98 |
| CC4-A-4-1 | 149 | 2.96 | 50.3 | 3 | 308 | 40.5 | 0.74 | 1064 | 0.97 | 1.23 | 1.19 | 1.02 | 1.07 |
| CC4-A-4-2 | 50.4 | 1080 | 0.96 | 1.21 | 1.17 | 1 | 1.06 | ||||||
| CC4-A-8 | 149 | 2.96 | 50.5 | 3 | 308 | 77 | 0.59 | 1781 | 0.9 | 1.05 | 1.12 | 0.89 | 0.97 |
| CC4-C-2 | 301 | 2.96 | 101.5 | 3 | 279 | 25.4 | 0.75 | 2382 | 1.02 | 1.25 | 1.21 | 1.03 | 1.2 |
| CC4-C-4-1 | 300 | 2.96 | 101.4 | 3 | 279 | 41.1 | 0.67 | 3277 | 1.04 | 1.22 | 1.26 | 1.02 | 1.17 |
| CC4-C-4-2 | 3152 | 1.09 | 1.27 | 1.31 | 1.06 | 1.22 | |||||||
| CC4-C-8 | 301 | 2.96 | 101.5 | 3 | 279 | 80.3 | 0.53 | 5540 | 1.08 | 1.2 | 1.32 | 1.02 | 1.15 |
| CC4-D-2 | 450 | 2.96 | 152 | 3 | 279 | 25.4 | 0.75 | 4415 | 0.88 | 1.31 | 1.32 | 1.09 | 1.31 |
| CC4-D-4-1 | 450 | 2.96 | 152 | 3 | 279 | 41.1 | 0.67 | 6870 | 0.81 | 1.19 | 1.26 | 1 | 1.15 |
| CC4-D-4-2 | 6985 | 0.8 | 1.17 | 1.24 | 0.99 | 1.13 | |||||||
| CC4-D-8 | 450 | 2.96 | 152 | 3 | 279 | 85.1 | 0.51 | 11,665 | 0.89 | 1.28 | 1.43 | 1.09 | 1.25 |
| CC6-A-2 | 122 | 4.54 | 26.9 | 3 | 576 | 25.4 | 1.55 | 1509 | 0.8 | 1.12 | 0.99 | 0.96 | 0.95 |
| CC6-A-4-1 | 122 | 4.54 | 26.8 | 3 | 576 | 40.5 | 1.39 | 1657 | 0.81 | 1.11 | 1.02 | 0.95 | 0.95 |
| CC6-A-4-2 | 1663 | 0.81 | 1.1 | 1.02 | 0.94 | 0.95 | |||||||
| CC6-A-8 | 122 | 4.54 | 26.8 | 3 | 576 | 77 | 1.11 | 2100 | 0.81 | 1.04 | 1.04 | 0.9 | 0.91 |
| CC6-C-2 | 239 | 4.54 | 52.5 | 3 | 507 | 25.4 | 1.36 | 3035 | 0.89 | 1.21 | 1.04 | 1 | 1.11 |
| CC6-C-4-1 | 238 | 4.54 | 52.5 | 3 | 507 | 40.5 | 1.22 | 3583 | 0.91 | 1.19 | 1.09 | 0.99 | 1.1 |
| CC6-C-4-2 | 52.4 | 3647 | 0.9 | 1.17 | 1.07 | 0.98 | 1.08 | ||||||
| CC6-C-8 | 238 | 4.54 | 52.4 | 3 | 507 | 77 | 0.98 | 5578 | 0.84 | 1.02 | 1.03 | 0.87 | 0.93 |
| CC6-D-2 | 361 | 4.54 | 79.4 | 3 | 525 | 25.4 | 1.41 | 5633 | 0.77 | 1.18 | 1.03 | 0.97 | 1.14 |
| CC6-D-4-1 | 361 | 4.54 | 79.4 | 3 | 525 | 41.1 | 1.26 | 7260 | 0.75 | 1.12 | 1.06 | 0.93 | 1.07 |
| CC6-D-4-2 | 360 | 79.3 | 7045 | 0.77 | 1.14 | 1.08 | 0.96 | 1.1 | |||||
| CC6-D-8 | 360 | 4.54 | 79.4 | 3 | 525 | 85.1 | 0.97 | 11,505 | 0.73 | 1.06 | 1.11 | 0.9 | 1.04 |
| CC8-A-2 | 108 | 6.47 | 16.7 | 3 | 853 | 25.4 | 2.29 | 2275 | 0.85 | 1.15 | 1.14 | 1.05 | 0.96 |
| CC8-A-4-1 | 109 | 6.47 | 16.8 | 3 | 853 | 40.5 | 2.05 | 2446 | 0.84 | 1.13 | 1.13 | 1.02 | 0.98 |
| CC8-A-4-2 | 108 | 16.7 | 2402 | 0.85 | 1.13 | 1.14 | 1.03 | 0.98 | |||||
| CC8-A-8 | 108 | 6.47 | 16.7 | 3 | 853 | 77 | 1.64 | 2713 | 0.84 | 1.09 | 1.15 | 1 | 0.97 |
| CC8-C-2 | 222 | 6.47 | 34.3 | 3 | 843 | 25.4 | 2.26 | 4964 | 0.91 | 1.27 | 1.08 | 1.09 | 1.18 |
| CC8-C-4-1 | 222 | 6.47 | 34.3 | 3 | 843 | 40.5 | 2.03 | 5638 | 0.89 | 1.2 | 1.07 | 1.04 | 1.14 |
| CC8-C-4-2 | 5714 | 0.88 | 1.19 | 1.06 | 1.03 | 1.13 | |||||||
| CC8-C-8 | 222 | 6.47 | 34.4 | 3 | 843 | 77 | 1.62 | 7304 | 0.85 | 1.09 | 1.05 | 0.95 | 1.04 |
| CC8-D-2 | 337 | 6.47 | 52.1 | 3 | 823 | 25.4 | 2.21 | 8475 | 0.81 | 1.22 | 1.02 | 1.04 | 1.2 |
| CC8-D-4-1 | 337 | 6.47 | 52 | 3 | 823 | 41.1 | 1.97 | 9668 | 0.81 | 1.2 | 1.06 | 1.02 | 1.21 |
| CC8-D-4-2 | 9835 | 0.79 | 1.18 | 1.05 | 1.01 | 1.19 | |||||||
| CC8-D-8 | 337 | 6.47 | 52 | 3 | 823 | 85.1 | 1.52 | 13,776 | 0.75 | 1.09 | 1.07 | 0.94 | 1.09 |
| Specimen | D (mm) | t (mm) | (mm) | (MPa) | (MPa) | (kN) | Ref. | |||||||
|---|---|---|---|---|---|---|---|---|---|---|---|---|---|---|
| CU-040 | 200 | 5 | 40 | 3 | 265.8 | 27.15 | 0.7 | 2013 | 0.77 | 1.1 | 1.06 | 0.84 | 0.86 | Hu, Huang [18] |
| CU-070 | 280 | 4 | 70 | 3 | 272.6 | 31.15 | 0.7 | 3025 | 0.88 | 1.11 | 1.1 | 0.91 | 0.97 | |
| CU-150 | 300 | 2 | 150 | 3 | 341.7 | 27.23 | 0.9 | 2608 | 0.73 | 1.12 | 1.04 | 0.92 | 1.12 | |
| C1 | 140.8 | 3 | 47 | 4.3 | 285 | 28.18 | 0.79 | 881 | 1.07 | 1.41 | 1.3 | 1.15 | 1.21 | Schneider [38] |
| C2 | 141.4 | 6.5 | 21.7 | 4.3 | 313 | 28.805 | 0.83 | 1825 | 0.89 | 1.27 | 1.16 | 1.05 | 0.96 | |
| C3 | 140 | 6.68 | 21 | 4.4 | 537 | 28.18 | 1.37 | 2715 | 0.92 | 1.28 | 1.18 | 1.1 | 1.03 | |
| 3HN | 150 | 3.2 | 46.9 | 450 | 287.4 | 28.7 | 0.75 | 1000 | 0.87 | 1.14 | 1.05 | 0.93 | 0.97 | Tomii [37] |
| CS-1 | 219 | 6.3 | 34.8 | 600 | 300 | 163 | 0.39 | 6880 | 0.94 | 1.06 | 1.23 | 0.91 | 1 | Liew, Xiong [40] |
| SFE | 159 | 4.8 | 33.1 | 650 | 433 | 64.5 | 4.09 | 2150 | 0.97 | 1.18 | 1.22 | 1.04 | 1.05 | Johansson and Gylltoft [35] |
| Specimen | D (mm) | t (mm) | (mm) | (MPa) | (MPa) | (kN) | |||||||
|---|---|---|---|---|---|---|---|---|---|---|---|---|---|
| S30CS50B | 165 | 2.82 | 58.5 | 580.5 | 363.3 | 48.3 | 0.83 | 1662 | 0.86 | 1.04 | 1.05 | 0.89 | 0.93 |
| S20CS50A | 190 | 1.94 | 97.9 | 663.5 | 256.4 | 41 | 0.6 | 1678 | 0.81 | 0.92 | 0.98 | 0.79 | 0.87 |
| S16CS50B | 190 | 1.52 | 125 | 664.5 | 306.1 | 48.3 | 0.67 | 1695 | 0.76 | 1.02 | 1.09 | 0.87 | 0.96 |
| S12CS50A | 190 | 1.13 | 168.1 | 664.5 | 185.7 | 41 | 0.5 | 1377 | 0.79 | 0.95 | 1.06 | 0.82 | 0.92 |
| S10CS50A | 190 | 0.86 | 220.9 | 659 | 210.7 | 41 | 0.57 | 1350 | 0.67 | 0.96 | 1.06 | 0.82 | 0.92 |
| S30CS80A | 165 | 2.82 | 58.5 | 580.5 | 363.3 | 80.2 | 0.68 | 2295 | 0.89 | 1.02 | 1.1 | 0.88 | 0.93 |
| S20CS80B | 190 | 1.94 | 97.9 | 663.5 | 256.4 | 74.7 | 0.49 | 2592 | 0.86 | 0.94 | 1.05 | 0.81 | 0.9 |
| S16CS80A | 190 | 1.52 | 125 | 663.5 | 306.1 | 80.2 | 0.56 | 2602 | 0.75 | 0.99 | 1.11 | 0.85 | 0.95 |
| S12CS80A | 190 | 1.13 | 168.1 | 662.5 | 185.7 | 80.2 | 0.39 | 2295 | 0.88 | 1.04 | 1.19 | 0.89 | 1.02 |
| S10CS80B | 190 | 0.86 | 220.9 | 663.5 | 210.7 | 74.7 | 0.46 | 2451 | 0.64 | 0.91 | 1.03 | 0.78 | 0.88 |
| S30CS10A | 165 | 2.82 | 58.5 | 577.5 | 363.3 | 108 | 0.6 | 2673 | 0.96 | 1.07 | 1.2 | 0.93 | 1 |
| S20CS10A | 190 | 1.94 | 97.9 | 660 | 256.4 | 108 | 0.41 | 3360 | 0.92 | 0.99 | 1.13 | 0.85 | 0.96 |
| S16CS10A | 190 | 1.52 | 125 | 661.5 | 306.1 | 108 | 0.49 | 3260 | 0.78 | 1.02 | 1.16 | 0.88 | 0.98 |
| S12CS10A | 190 | 1.13 | 168.1 | 660 | 185.7 | 108 | 0.34 | 3058 | 0.87 | 1.03 | 1.18 | 0.88 | 1.01 |
| S10CS10A | 190 | 0.86 | 220.9 | 662 | 210.7 | 108 | 0.39 | 3070 | 0.72 | 1.02 | 1.17 | 0.88 | 0.99 |
| Mean | 0.83 | 1.06 | 1.08 | 0.9 | 0.98 |
| Min | 1.09 | 1.41 | 1.43 | 1.15 | 1.31 |
| Max | 0.64 | 0.89 | 0.92 | 0.73 | 0.79 |
| STD | 0.085 | 0.116 | 0.098 | 0.103 | 0.117 |
Disclaimer/Publisher’s Note: The statements, opinions and data contained in all publications are solely those of the individual author(s) and contributor(s) and not of MDPI and/or the editor(s). MDPI and/or the editor(s) disclaim responsibility for any injury to people or property resulting from any ideas, methods, instructions or products referred to in the content. |
© 2024 by the authors. Licensee MDPI, Basel, Switzerland. This article is an open access article distributed under the terms and conditions of the Creative Commons Attribution (CC BY) license (https://creativecommons.org/licenses/by/4.0/).
Share and Cite
Shariati, M.; Pourteymuri, M.; Naghipour, M.; Toghroli, A.; Afrazi, M.; Shariati, M.; Aminian, A.; Nematzadeh, M. Evolution of Confinement Stress in Axially Loaded Concrete-Filled Steel Tube Stub Columns: Study on Enhancing Urban Building Efficiency. Sustainability 2024, 16, 7544. https://doi.org/10.3390/su16177544
Shariati M, Pourteymuri M, Naghipour M, Toghroli A, Afrazi M, Shariati M, Aminian A, Nematzadeh M. Evolution of Confinement Stress in Axially Loaded Concrete-Filled Steel Tube Stub Columns: Study on Enhancing Urban Building Efficiency. Sustainability. 2024; 16(17):7544. https://doi.org/10.3390/su16177544
Chicago/Turabian StyleShariati, Mahdi, Mahsa Pourteymuri, Morteza Naghipour, Ali Toghroli, Mohammad Afrazi, Morteza Shariati, Arman Aminian, and Mahdi Nematzadeh. 2024. "Evolution of Confinement Stress in Axially Loaded Concrete-Filled Steel Tube Stub Columns: Study on Enhancing Urban Building Efficiency" Sustainability 16, no. 17: 7544. https://doi.org/10.3390/su16177544