
Use of Indices Applied to Remote Sensing for Establishing Winter–Spring Cropping Areas in the Republic of Kazakhstan
 , ,
, ,  , ,
, ,
Abstract
1. Introduction
2. Materials and Methods
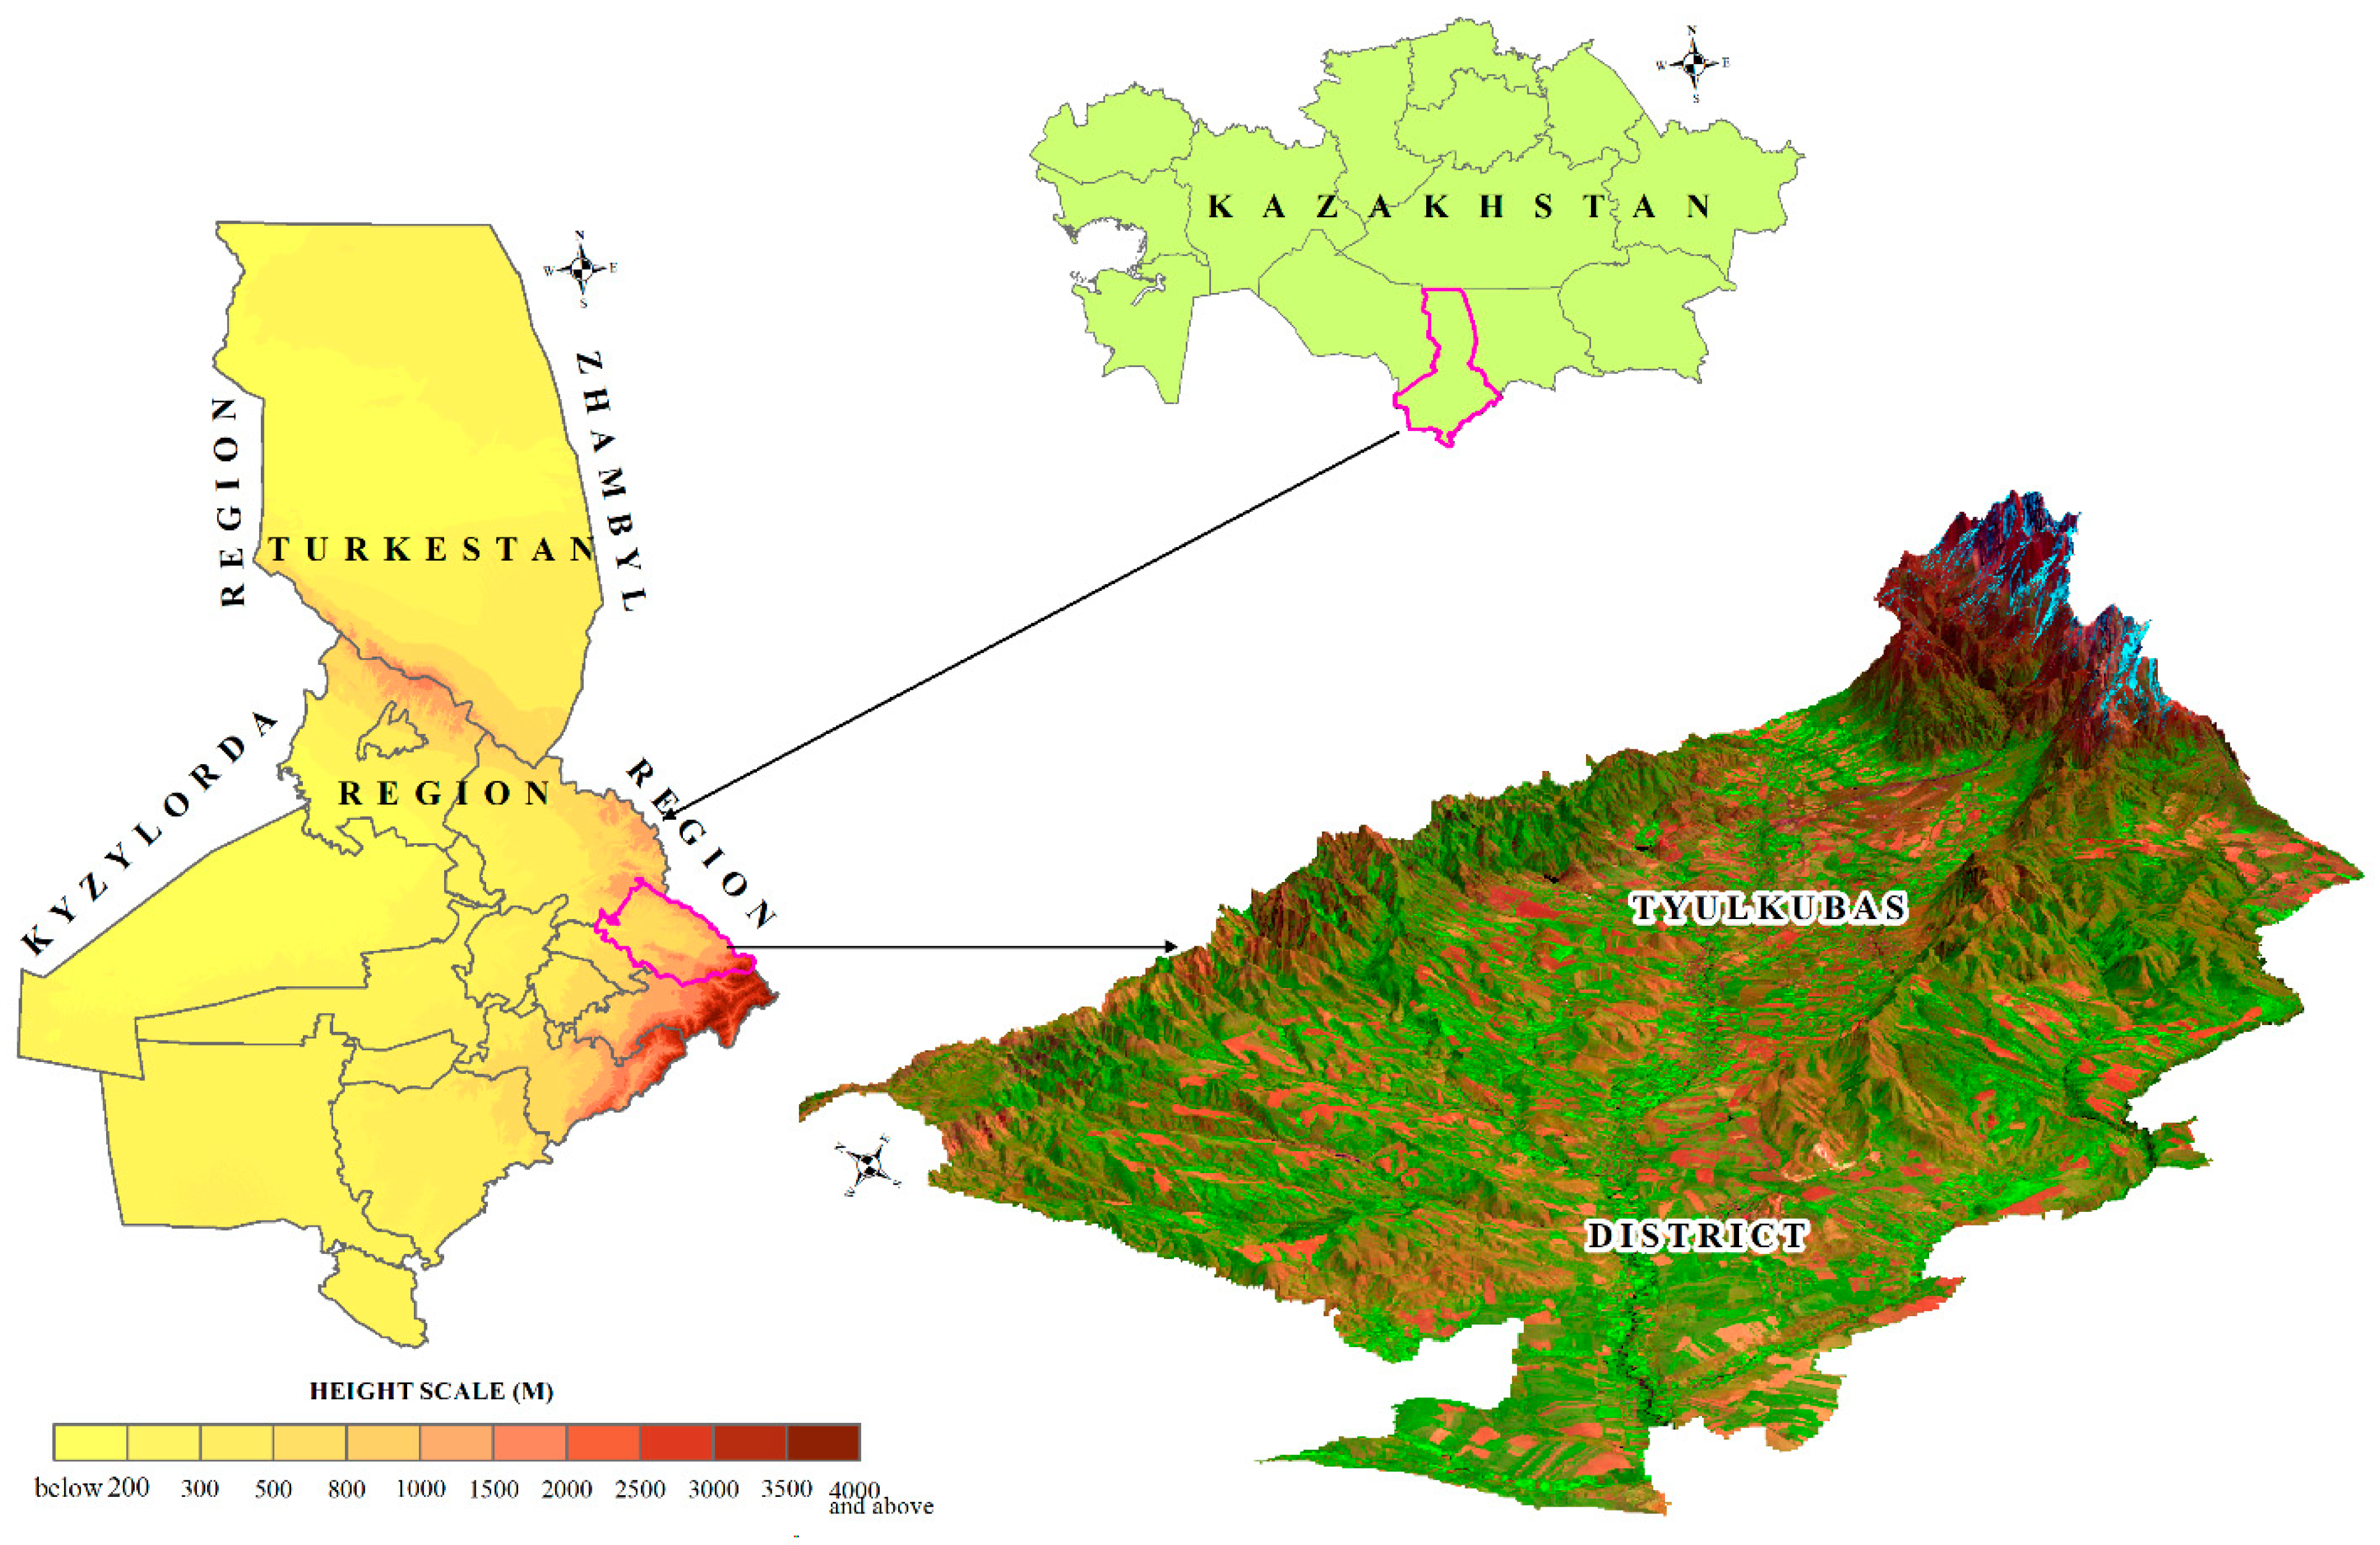
2.1. Study Area
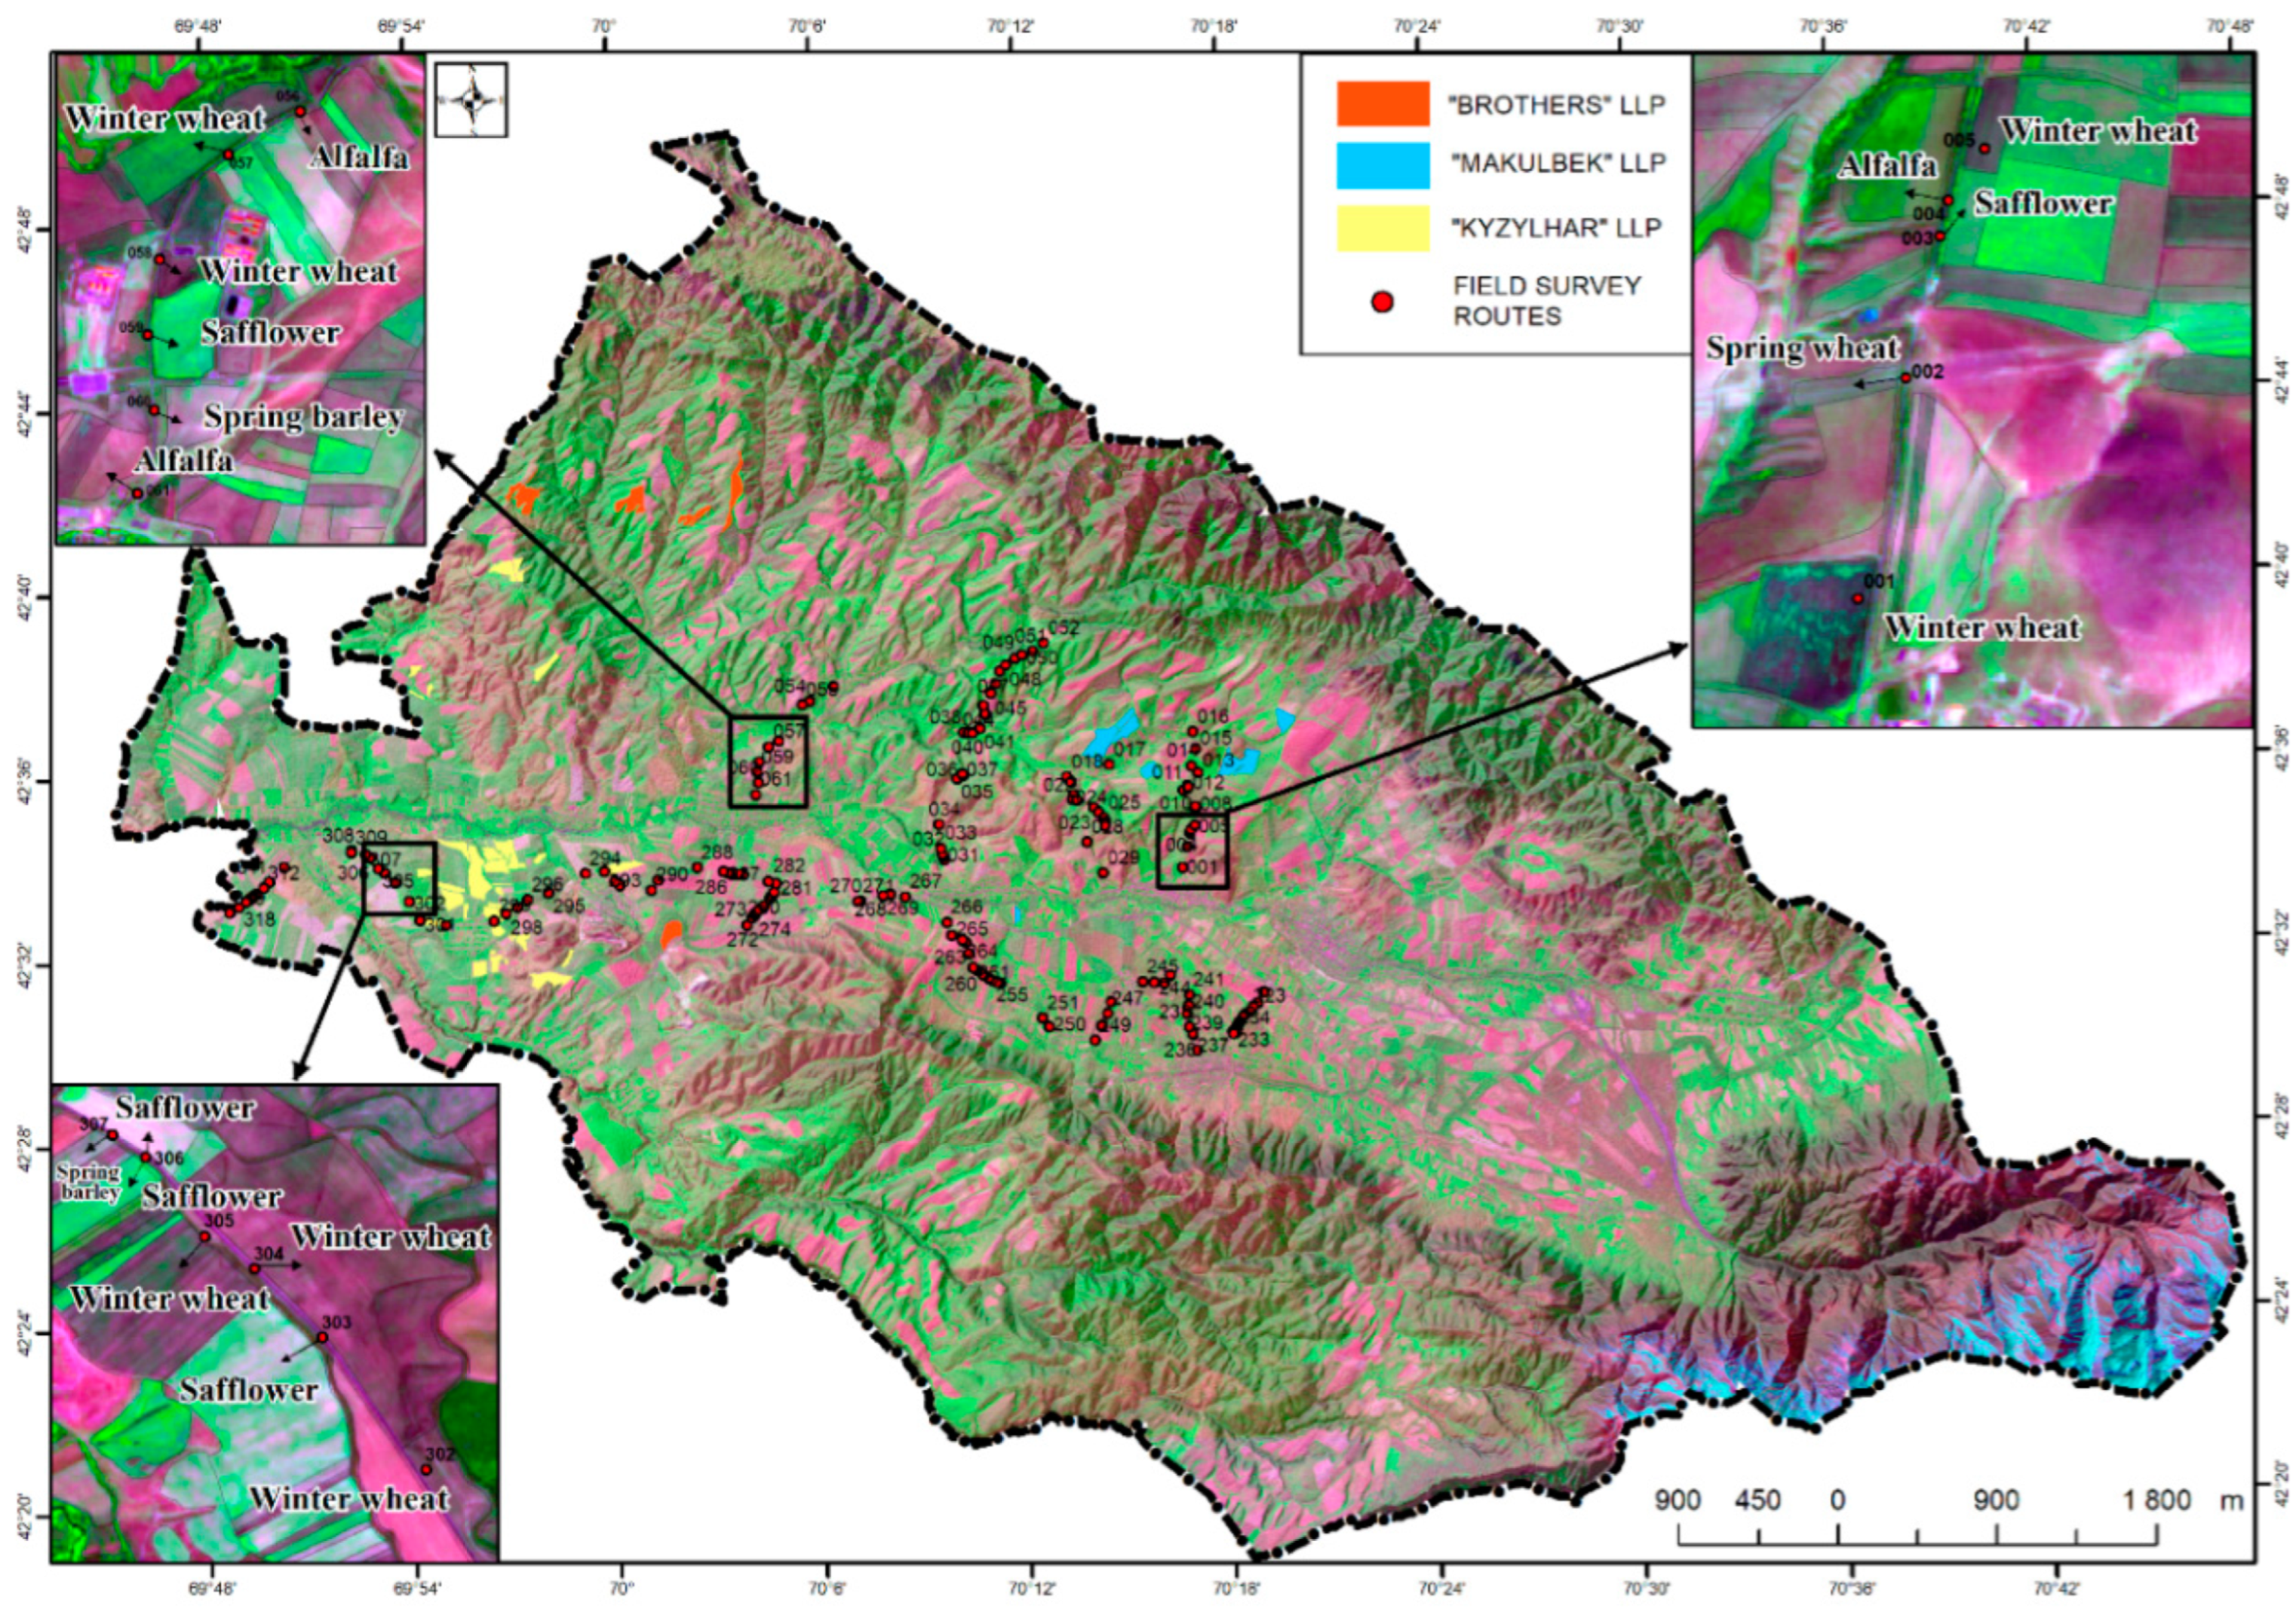
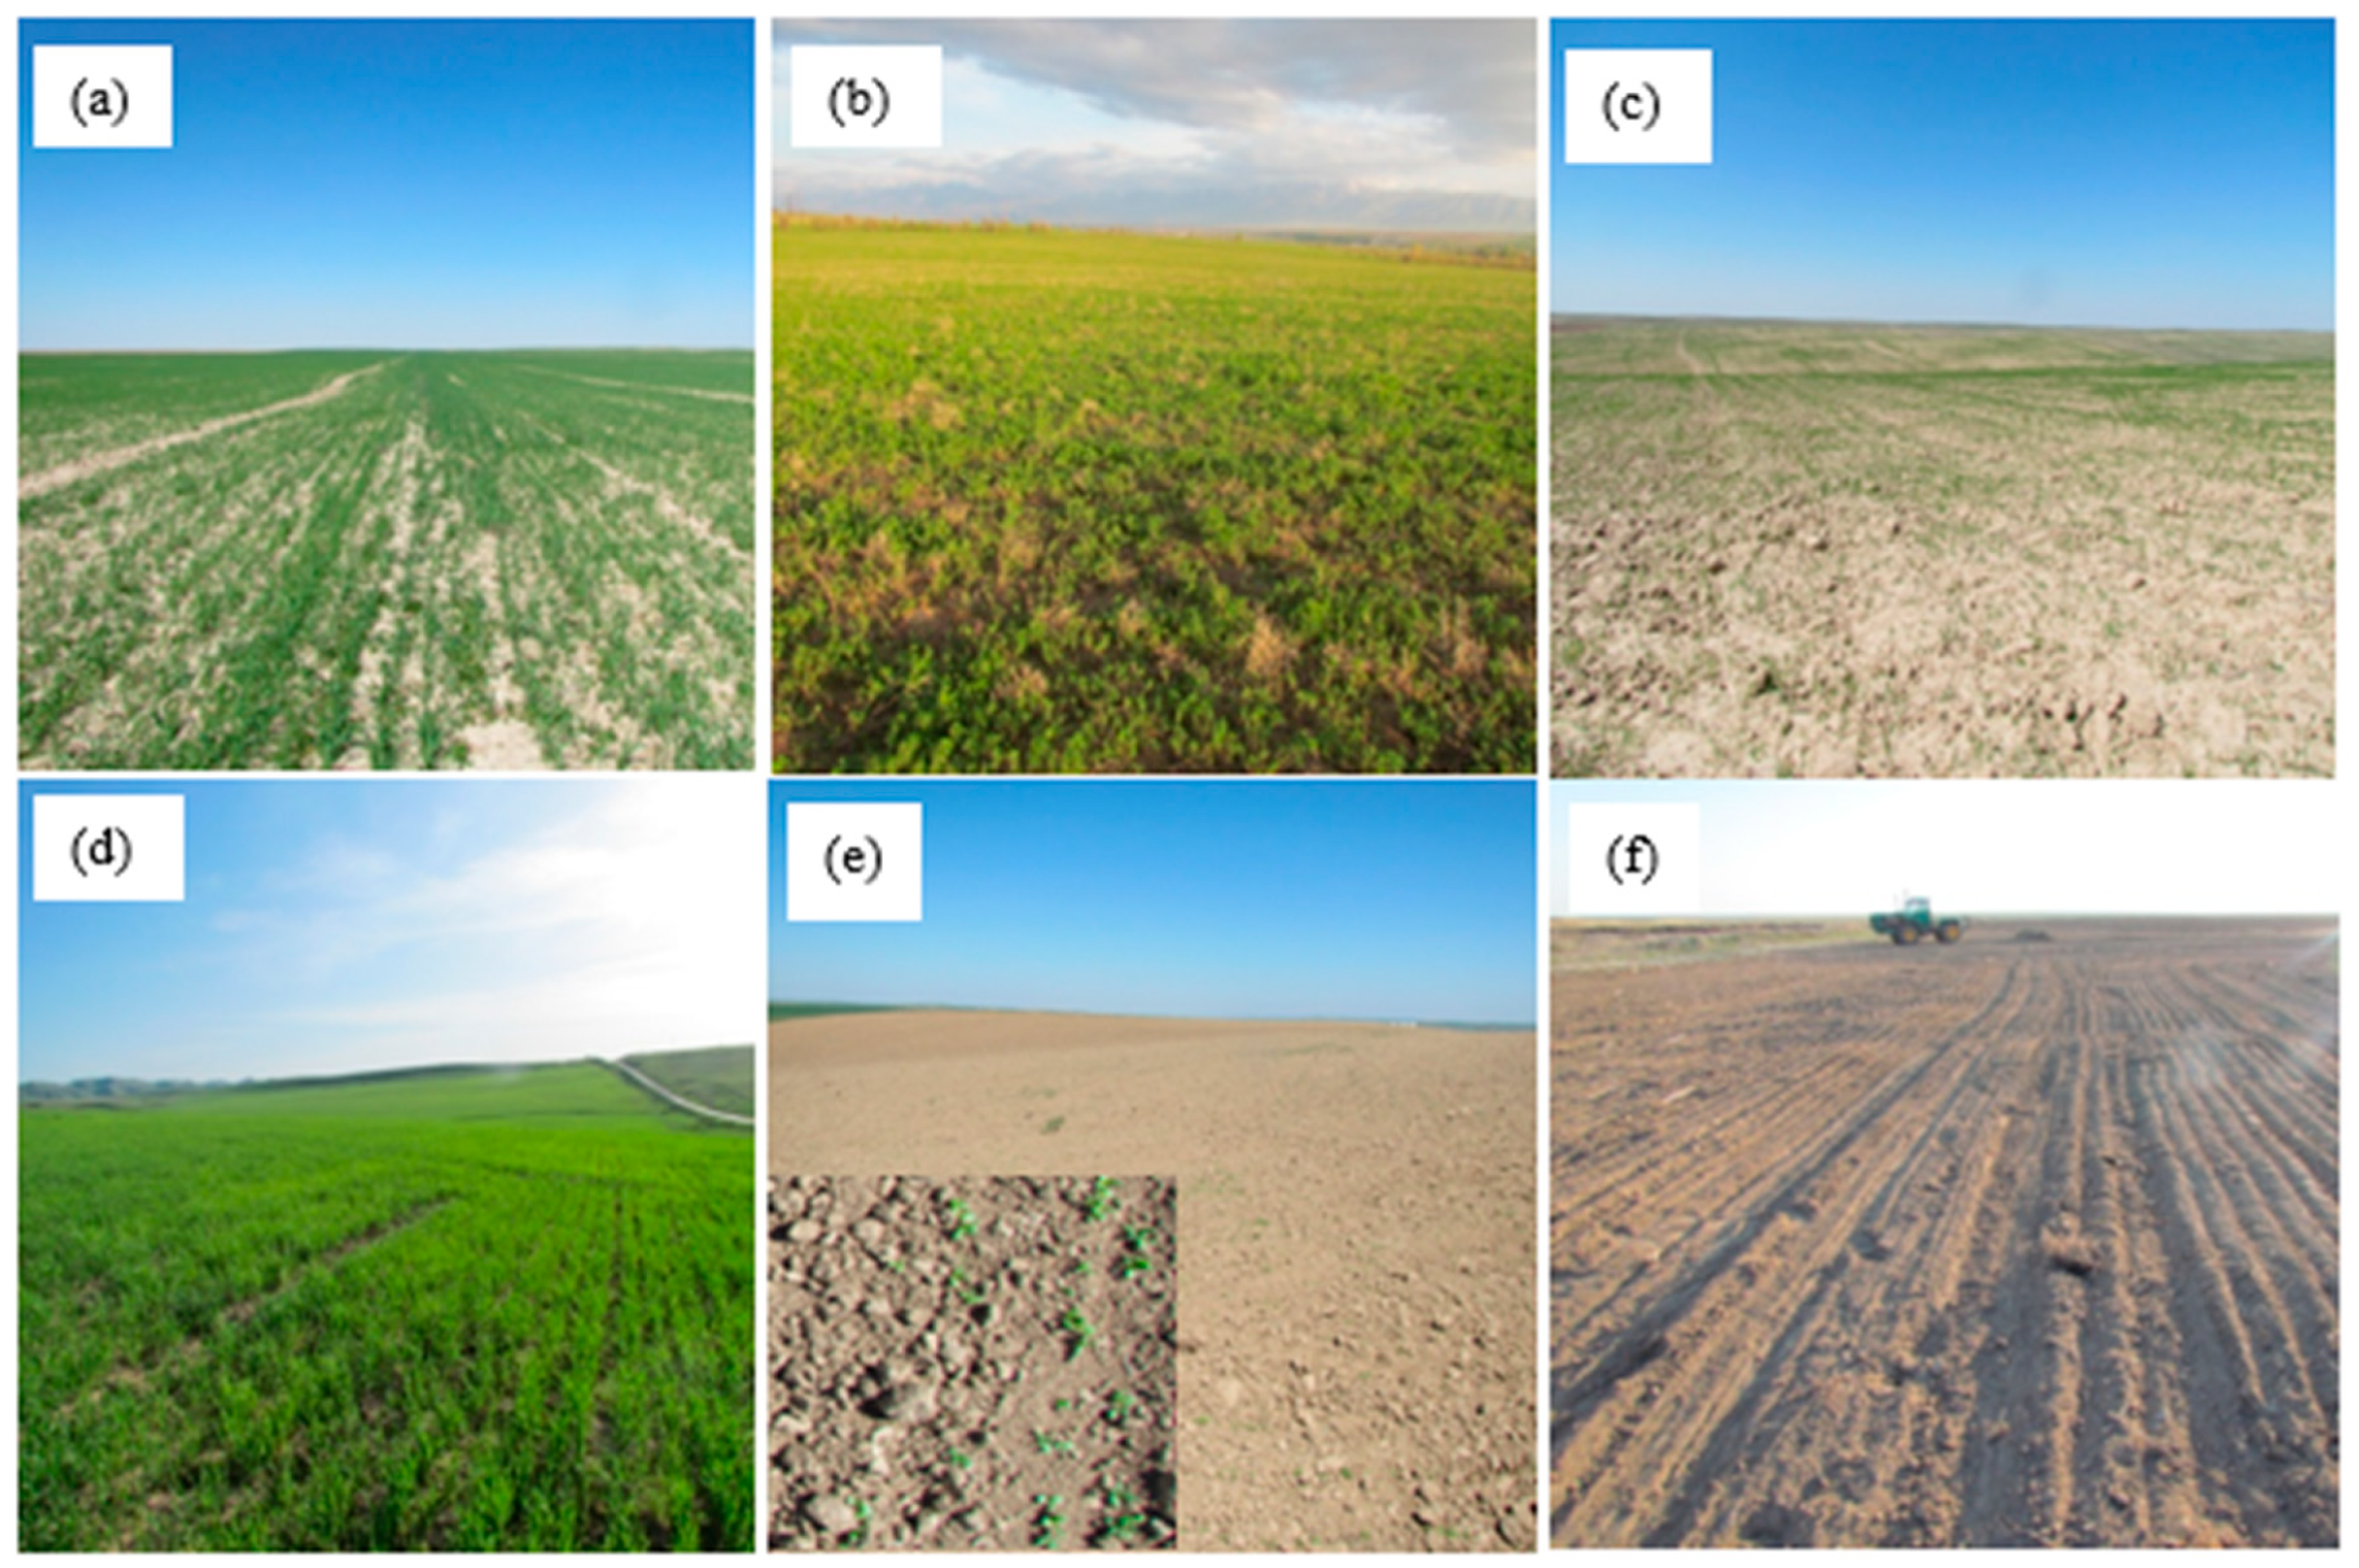
2.2. Satellite and Ground Data
2.3. Methods
- b2—is the blue band of the Sentinel-2 sensor;
- b3—is the green band;
- b4—is the red band;
- b8—is the near-infrared band;
- b11—is the shortwave infrared band 1;
- b12—is the shortwave infrared band 2.
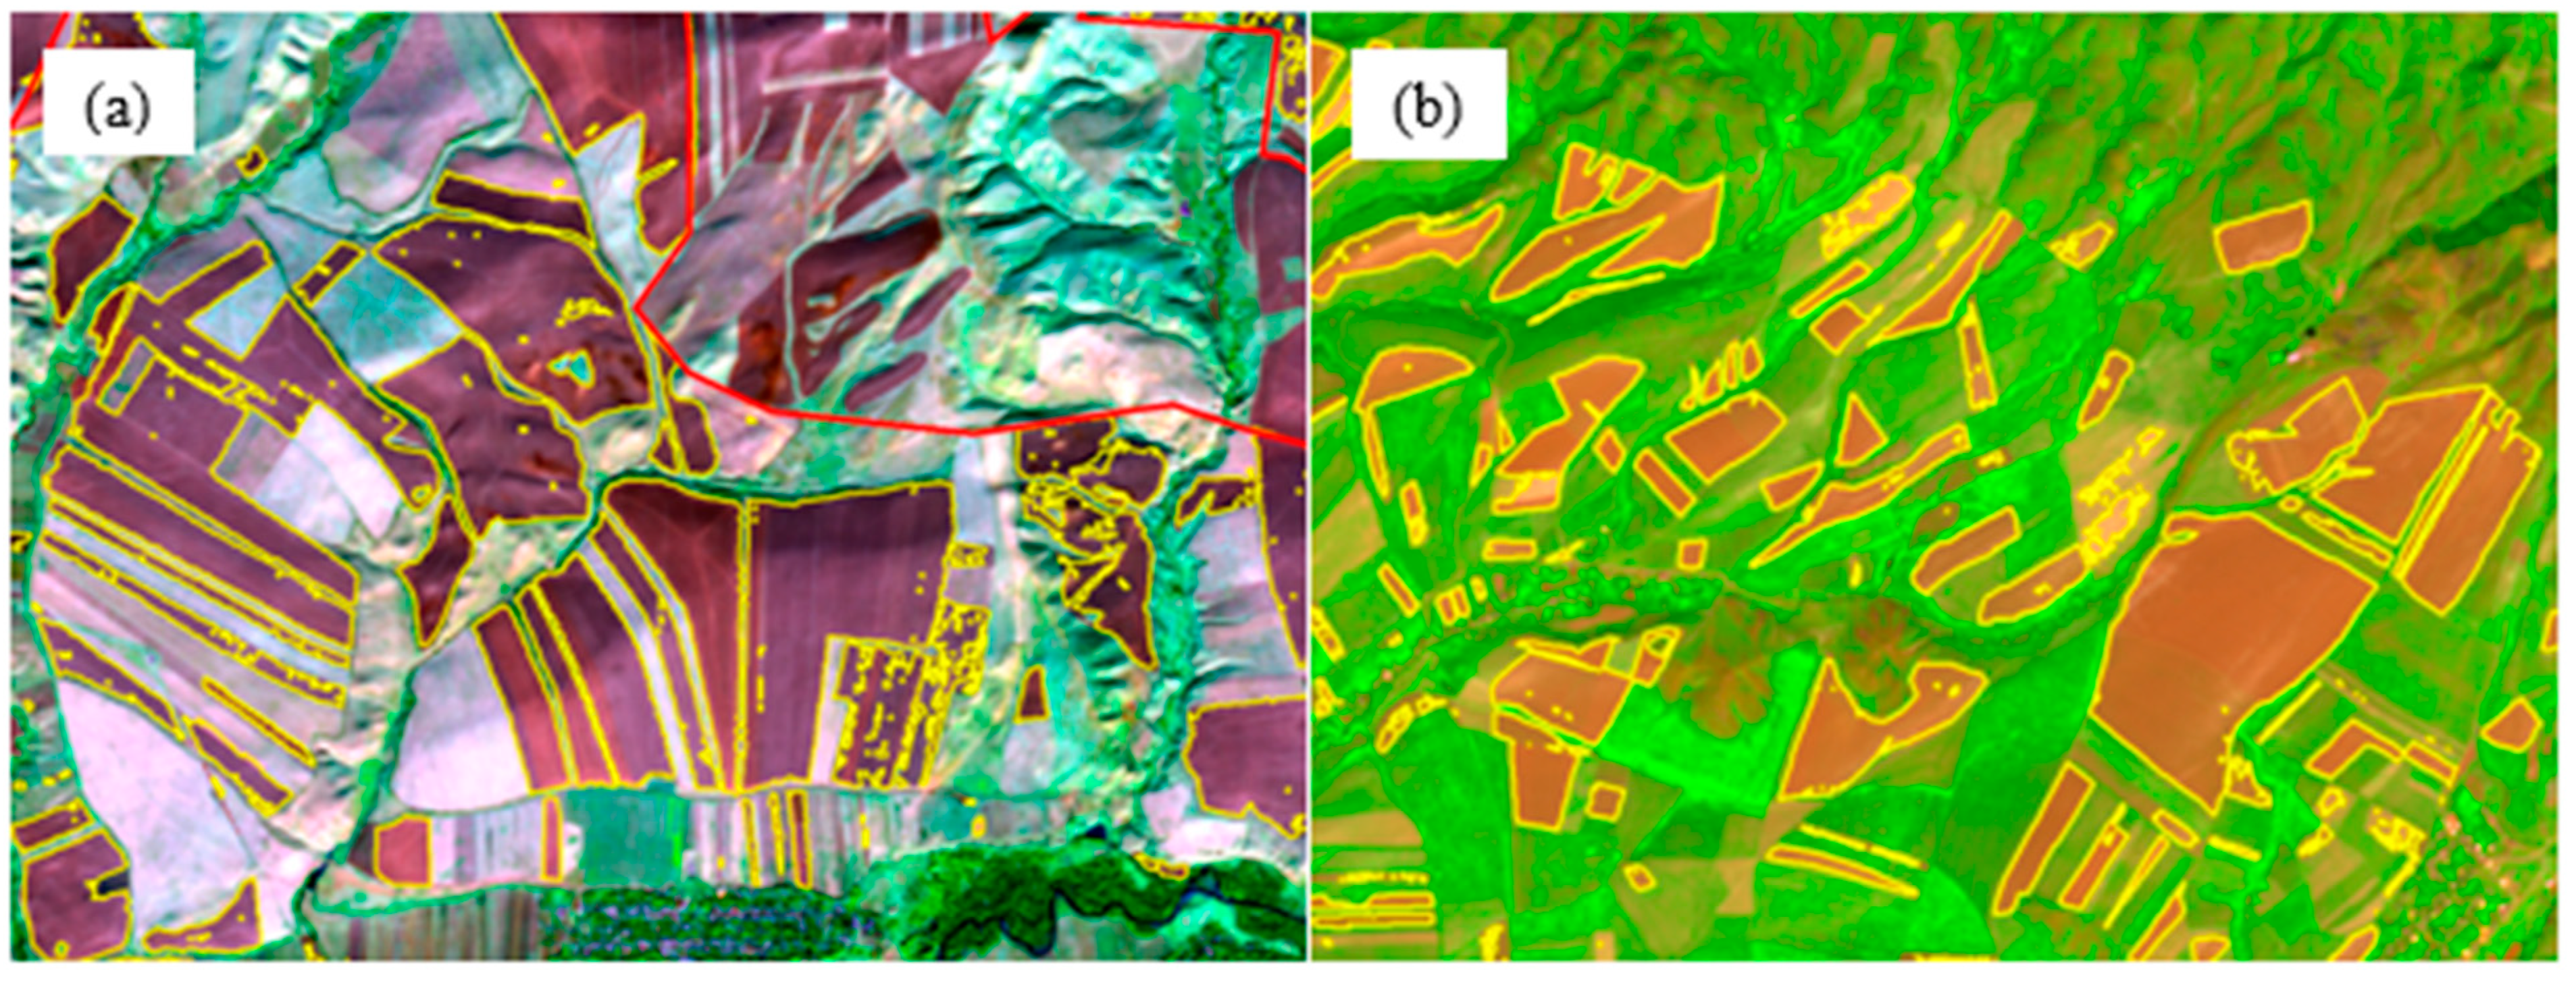
2.4. Methodology
3. Results
4. Discussion
5. Conclusions
Author Contributions
Funding
Institutional Review Board Statement
Informed Consent Statement
Data Availability Statement
Acknowledgments
Conflicts of Interest
References
- Doraiswamy, P.C.; Hatfield, J.L.; Jackson, T.J.; Akhmedov, B.; Prueger, J.; Stern, A. Crop condition and yield simulations using Landsat and MODIS. Remote Sens. Environ. 2004, 92, 548–559. [Google Scholar] [CrossRef]
- Peng, Y.; Nguy-Robertson, A.; Arkebauer, T.; Gitelson, A.A. Assessment of Canopy Chlorophyll Content Retrieval in Maize and Soybean: Implications of Hysteresis on the Development of Generic Algorithms. Remote Sens. 2017, 9, 226. [Google Scholar] [CrossRef]
- Atzberger, C. Advances in remote sensing of agriculture: Context description, existing operational monitoring systems and major information needs. Remote. Sens. 2013, 5, 949–981. [Google Scholar] [CrossRef]
- Immitzer, M.; Vuolo, F.; Atzberger, C. First Experience with Sentinel-2 Data for Crop and Tree Species Classifications in Central Europe. Remote Sens. 2016, 8, 166. [Google Scholar] [CrossRef]
- Panigrahy, S.; Sharma, S. Mapping of crop rotation using multidate Indian Remote Sensing Satellite digital data. ISPRS J. Photogramm. Remote Sens. 1997, 52, 85–91. [Google Scholar] [CrossRef]
- Yogita, Y.; Mohite, J.; Jagyasi, B. Crop classification based on multi-temporal satellite remote sensing data for agro-advisory services. In SPIE Asia-Pacific Remote Sensing; SPIE-The International Society for Optical Engineering: Bellingham, DC, USA, 2014; p. 926004. [Google Scholar] [CrossRef]
- Agilandeeswari, L.; Prabukumar, M.; Radhesyam, V.; Phaneendra, K.L.N.B.; Farhan, A. Crop Classification for Agricultural Applications in Hyperspectral Remote Sensing Images. Appl. Sci. 2021, 12, 1670. [Google Scholar] [CrossRef]
- Liu, H.; Yang, X.; Wang, N. Remote sensing-based estimation system for winter wheat yield in North China Plain. Chin. Geogr. Sci. 1999, 9, 40–48. [Google Scholar] [CrossRef]
- Zhang, L.; Zhang, Z.; Luo, Y.; Cao, J.; Tao, F. Combining Optical, Fluorescence, Thermal Satellite, and Environmental Data to Predict County-Level Maize Yield in China Using Machine Learning Approaches. Remote Sens. 2019, 12, 21. [Google Scholar] [CrossRef]
- Fu, Y.; Huang, J.; Shen, Y.; Liu, S.; Huang, Y.; Dong, J.; Han, W.; Ye, T.; Zhao, W.; Yuan, W. A Satellite-Based Method for National Winter Wheat Yield Estimating in China. Remote Sens. 2020, 13, 4680. [Google Scholar] [CrossRef]
- Numata, I.; Roberts, D.A.; Chadwick, O.A.; Schimel, J.P.; Galvão, L.S.; Soares, J.V. Evaluation of hyperspectral data for pasture estimate in the Brazilian Amazon using field and imaging spectrometers. Remote. Sens. Environ. 2008, 112, 1569–1583. [Google Scholar] [CrossRef]
- Kurtz, D.B.; Schellberg, J.; Braun, M. Ground and satellite-based assessment of rangeland management in sub-tropical Argentina. Appl. Geogr. 2010, 30, 210–220. [Google Scholar] [CrossRef]
- Potapov, P.; Turubanova, S.; Hansen, M.C. Regional-scale boreal forest cover and change mapping using Landsat data composites for European Russia. Remote. Sens. Environ. 2011, 115, 548–561. [Google Scholar] [CrossRef]
- Shabanov, N.V.; Egorov, V.A.; Miklashevich, T.S.; Stytsenko, E.A.; Bartalev, S.A. Utility of Leaf Area Index for Monitoring Phenology of Russian Forests. Remote. Sens. 2022, 15, 5419. [Google Scholar] [CrossRef]
- Graw, V.; Ghazaryan, G.; Dall, K.; Gómez, A.D.; Abdel-Hamid, A.; Jordaan, A.; Piroska, R.; Post, J.; Szarzynski, J.; Walz, Y.; et al. Drought Dynamics and Vegetation Productivity in Different LandManagement Systems of Eastern Cape, South Africa—A Remote Sensing Perspective. Sustainability 2017, 9, 1728. [Google Scholar] [CrossRef]
- Mukhawana, M.B.; Kanyerere, T.; Kahler, D. Review of In-Situ and Remote Sensing-Based Indices and Their Applicability for Integrated Drought Monitoring in South Africa. Water 2022, 15, 240. [Google Scholar] [CrossRef]
- Drusch, M.; Del Bello, U.; Carlier, S.; Colin, O.; Fernandez, V.; Gascon, F.; Hoersch, B.; Isola, C.; Laberinti, P.; Martimort, P.; et al. Sentinel-2: ESA’s Optical High-Resolution Mission for GMES Operational Services. Remote Sens. Environ. 2012, 120, 25–36. [Google Scholar] [CrossRef]
- Phiri, D.; Simwanda, M.; Salekin, S.; Nyirenda, V.R.; Murayama, Y.; Ranagalage, M. Sentinel-2 Data for Land Cover/Use Mapping: A Review. Remote Sens. 2019, 12, 2291. [Google Scholar] [CrossRef]
- Jiang, Y.; Lu, Z.; Li, S.; Lei, Y.; Chu, Q.; Yin, X.; Chen, F. Large-Scale and High-Resolution Crop Mapping in China Using Sentinel-2 Satellite Imagery. Agriculture 2020, 10, 433. [Google Scholar] [CrossRef]
- Lamqadem, A.A.; Saber, H.; Pradhan, B. Quantitative Assessment of Desertification in an Arid Oasis Using Remote Sensing Data and Spectral Index Techniques. Remote Sens. 2018, 10, 1862. [Google Scholar] [CrossRef]
- Shi, T.; Xu, H. Derivation of Tasseled Cap Transformation Coefficients for Sentinel-2 MSI At-Sensor Reflectance Data. IEEE J. Sel. Top. Appl. Earth Obs. Remote Sens. 2019, 12, 4038–4048. [Google Scholar] [CrossRef]
- Gidrometeoizdat, Agroclimatic Resources of the Chimkent Region of the Kazakh SSR; USSR State Committee for Hydrometeorology and Natural Environment Control, Administration of the Hydrometeorological Service of the Kazakh SSR; Alma-Ata Hydrometeorological Observatory. Gidrometeoizdat: Leningrad, Russia, 1979. (In Translation)
- Gringof, I.; Popova, V.; Strashny, V. Agrometeorology; Gidrometeoizdat: Moscow, Russia, 1987. [Google Scholar]
- European Space Agency (ESA). Sentinel-2 User Handbook, Revision 2, ESA Standard Document; European Space Agency (ESA): Paris, France, 2015. [Google Scholar]
- Hagolle, O.; Sylvander, S.; Huc, M.; Claverie, M.; Clesse, D.; Dechoz, C.; Lonjou, V.; Poulain, V. SPOT-4: Simulation of Sentinel-2 time series on 45 large sites. Remote. Sens. 2015, 7, 12242–12264. [Google Scholar] [CrossRef]
- Segl, K.; Guanter, L.; Gascon, F.; Kuester, T.; Rogass, C.; Mielke, C. S2eteS: An End-to-End Modeling Tool for the Simulation of Sentinel-2 Image Products. IEEE Trans. Geosci. Remote. Sens. 2015, 53, 5560–5571. [Google Scholar] [CrossRef]
- Kauth, R.; Thomas, G.S. The tasseled cap-a graphic description of the spectral-temporal development of agricultural crops as seen by Landsat. In Proceedings of the Symposium on Machine Processing of Remotely Sensed Data, West Lafayette, IN, USA, 29 June 29–1 July 1976; pp. 4B41–4B51. [Google Scholar]
- Baig, M.H.A.; Zhang, L.; Shuai, T.; Tong, Q. Derivation of a Tasselled Cap Transformation Based on Landsat 8 At-Satellite Reflectance. Remote Sens. Lett. 2014, 5, 423–431. [Google Scholar] [CrossRef]
- Zhang, X.; Schaaf, C.; Friedl, M.; Strahler, A.; Gao, F.; Hodges, J. MODIS Tasseled Cap Transformation and Its Utility. In Proceedings of the IEEE International Geoscience and Remote Sensing Symposium, Toronto, ON, Canada, 24–28 June 2002. [Google Scholar]
- Qiu, B.; Liu, Z.; Tang, Z.; Chen, C. Developing Indices of Temporal Dispersion and Continuity to Map Natural Vegetation. Ecol. Indic. 2016, 64, 335–342. [Google Scholar] [CrossRef]
- Crist, E.P.; Cicone, R.C. A Physically Based Transformation of Thematic Mapper Data-The TM Tasseled Cap. IEEE Trans. Geosci. Remote Sens. 1984, 3, 256–263. [Google Scholar] [CrossRef]
- Kalisa, W.; Igbawua, T.; Henchiri, M.; Ali, S.; Zhang, S.; Bai, Y.; Zhang, J. Assessment of climate impact on vegetation dynamics over East Africa from 1982 to 2015. Sci. Rep. 2019, 9, 16865. [Google Scholar] [CrossRef] [PubMed]
- Measho, S.; Chen, B.; Pellikka, P.; Guo, L.; Zhang, H.; Cai, D.; Sun, S.; Kayiranga, A.; Sun, X.; Ge, M. Assessment of vegetation dynamics and ecosystem resilience in the context of climate change and drought in the horn of Africa. Remote Sens. 2021, 13, 1668. [Google Scholar] [CrossRef]
- Qarallah, B.; Othman, Y.A.; Al-Ajlouni, M.; Alheyari, H.A.; Qoqazeh, B.A. Assessment of Small-Extent Forest Fires in Semi-Arid Environment in Jordan Using Sentinel-2 and Landsat Sensors Data. Forests 2022, 14, 41. [Google Scholar] [CrossRef]
- Sawalhah, M.N.; Al-Kofahi, S.D.; Othman, Y.A.; Cibils, A.F. Assessing rangeland cover conversion in Jordan after the Arab spring using a remote sensing approach. J. Arid Environ. 2018, 157, 97–102. [Google Scholar] [CrossRef]
- Sydykov, M.A. Direct sowing of winter wheat on rainfed lands of southern Kazakhstan. In Proceedings of the International Congress, Global Climate Change and Biodiversity, Almaty, Kazakhstan, 5–6 November 2015; pp. 177–182. [Google Scholar]
- Karabkina, N. Operational Solution of Space Monitoring of Grain Crops in South Kazakhstan Based on Data of Sentinel-2, Landsat-8, PlanetScope. In Proceedings of the 16th All-Russia Open Conference on Current Problems in Remote Sensing of the Earth from Space, Moscow, Russia, 12–16 November 2018; pp. 321–328. [Google Scholar] [CrossRef]
- Adenova, D.; Sarsekova, D.; Absametov, M.; Murtazin, Y.; Sagin, J.; Trushel, L.; Miroshnichenko, O. The Study of Groundwater in the Zhambyl Region, Southern Kazakhstan, to Improve Sustainability. Sustainability 2024, 16, 4597. [Google Scholar] [CrossRef]
- Adenova, D.; Tazhiyev, S.; Sagin, J.; Absametov, M.; Murtazin, Y.; Trushel, L.; Miroshnichenko, O.; Zaryab, A. Groundwater Quality and Potential Health Risk in Zhambyl Region, Kazakhstan. Water 2023, 15, 482. [Google Scholar] [CrossRef]
- Kyrgyzbay, K.; Kakimzhanov, Y.; Sagin, J. Climate data verification for assessing climate change in Almaty region of the Republic of Kazakhstan. Clim. Serv. 2023, 32, 100423. [Google Scholar] [CrossRef]


| Date | The Sentinel-2 Satellite Data Used in 2021–2022 | ||
|---|---|---|---|
| WN Scene | XN Scene | XM Scene | |
| 13.9–18.9 | T42TWN_20210913 | T42TXN_20210913 | T42TXM_20210918 |
| 26.9–28.9. | T42TWN_20210926 | T42TXN_20210928 | |
| 11–13.10 | T42TWN_20211011 | T42TXN_20211013 | |
| 16–18.10 | T42TWN_20211016 | T42TXN_20211018 | T42TXM_20211018 |
| 31.10 | T42TWN_20211031 | ||
| 02.11 | T42TWN_20211102 | T42TXN_20211102 | |
| 05.11–07.11 | T42TWN_20211105 | T42TXN_20211107 | T42TXM_20211107 |
| 27.11 | T42TWN_20211127 | T42TXN_20211217 | |
| 04.04–06.04 | T42TWN_20220404 | T42TXN_20220406 | |
| 09.04 | T42TWN_20220409 | ||
| 14.04 | T42TWN_20220414 | ||
| 21.04 | T42TWN_20220421 | ||
| 26.04 | T42TWN_20220426 | T42TXN_20220426 | T42TXM_20220426 |
| 01.05 | T42TWN_20220501 | T42TXN_20220501 | T42TXM_20220501 |
| 16.05 | T42TWN_20220516 | T42TXN_20220516 | |
| 24.05–26.05 | T42TWN_20220524 | T42TXN_20220526 | |
| 31.05–08.06 | T42TWN_20220608 | T42TXN_20220531 | |
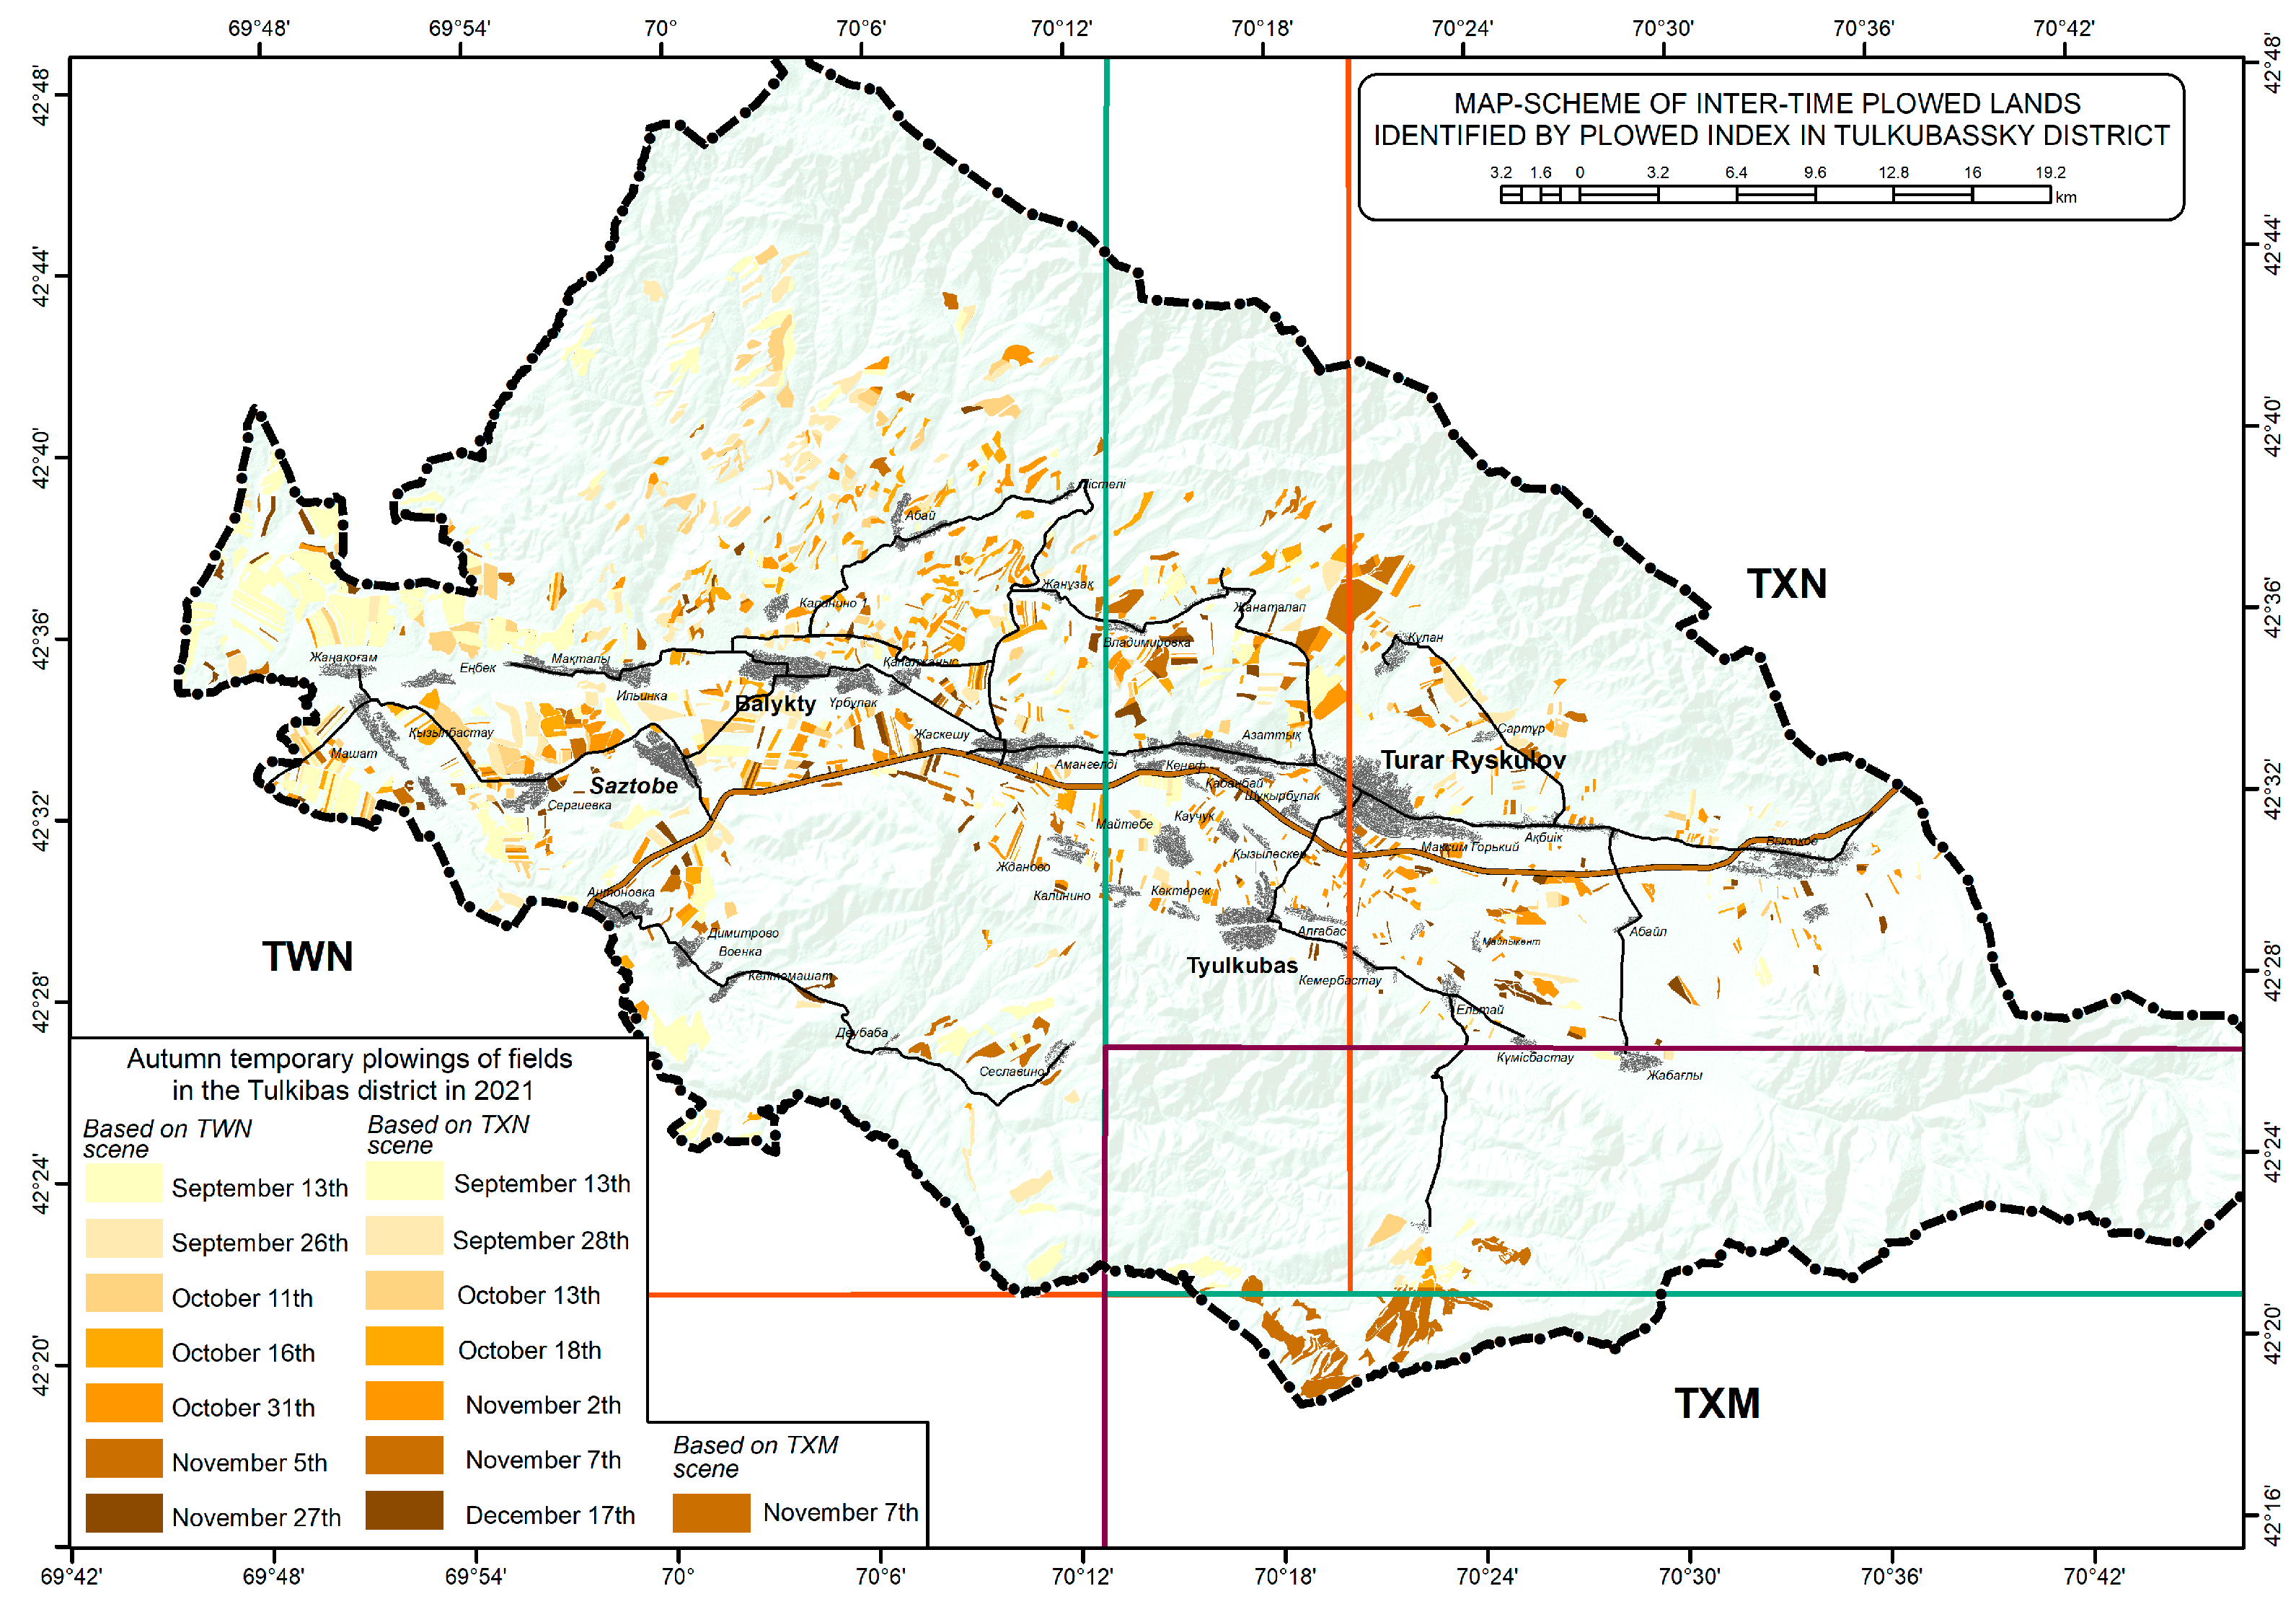
| Observation Period | The Area of Autumn Tillage of Fields in 2021 (ha): | The Total Area across 3 Scenes (ha): | The Total Area across 3 Scenes (%): | ||
|---|---|---|---|---|---|
| TWN Scene | TXN Scene | TXM Scene | |||
| 05.09–13.09.2021 | 6159.52 | 272.5 | 6432.02 | 29 | |
| 14.09–26.09.2021 | 2768 | 298.7 | 3066.7 | 14 | |
| 27.09–13.10.2021 | 2374 | 260.1 | 2634.1 | 12 | |
| 14.10–18.10.2021 | 1821.2 | 95.2 | 1916.4 | 9 | |
| 19.10–31.10.2021 | 2475.6 | 2475.6 | 11 | ||
| 01.11–10.11.2021 | 1804.5 | 775.3 | 1571.43 | 4151.23 | 19 |
| 11.11–27.11.2021 | 923.9 | 923.9 | 4 | ||
| 01.12–17.12.2021 | 508.3 | 508.3 | 2 | ||
| Total for the season (ha) | 18,326.7 | 272.5 | 1571.43 | 22,108.3 | 100 |
Disclaimer/Publisher’s Note: The statements, opinions and data contained in all publications are solely those of the individual author(s) and contributor(s) and not of MDPI and/or the editor(s). MDPI and/or the editor(s) disclaim responsibility for any injury to people or property resulting from any ideas, methods, instructions or products referred to in the content. |
© 2024 by the authors. Licensee MDPI, Basel, Switzerland. This article is an open access article distributed under the terms and conditions of the Creative Commons Attribution (CC BY) license (https://creativecommons.org/licenses/by/4.0/).
Share and Cite
Arystanov, A.; Karabkina, N.; Sagin, J.; Nurguzhin, M.; King, R.; Bekseitova, R. Use of Indices Applied to Remote Sensing for Establishing Winter–Spring Cropping Areas in the Republic of Kazakhstan. Sustainability 2024, 16, 7548. https://doi.org/10.3390/su16177548
Arystanov A, Karabkina N, Sagin J, Nurguzhin M, King R, Bekseitova R. Use of Indices Applied to Remote Sensing for Establishing Winter–Spring Cropping Areas in the Republic of Kazakhstan. Sustainability. 2024; 16(17):7548. https://doi.org/10.3390/su16177548
Chicago/Turabian StyleArystanov, Asset, Natalya Karabkina, Janay Sagin, Marat Nurguzhin, Rebecca King, and Roza Bekseitova. 2024. "Use of Indices Applied to Remote Sensing for Establishing Winter–Spring Cropping Areas in the Republic of Kazakhstan" Sustainability 16, no. 17: 7548. https://doi.org/10.3390/su16177548
APA StyleArystanov, A., Karabkina, N., Sagin, J., Nurguzhin, M., King, R., & Bekseitova, R. (2024). Use of Indices Applied to Remote Sensing for Establishing Winter–Spring Cropping Areas in the Republic of Kazakhstan. Sustainability, 16(17), 7548. https://doi.org/10.3390/su16177548