Abstract
The present study evaluates selected morphometric characteristics of 39 direct tributaries of the Buzău River (area of 4112 km2) to prioritize development actions in these sub-watersheds, which are distributed in three geographical regions within the full Buzău River watershed: the Carpathian, Subcarpathian, and plains regions. By combining a variable number of morphometric parameters, using various mathematical models, we can evaluate the state of balance or imbalance in a watershed and identify sub-watersheds vulnerable to natural processes. Prioritization was achieved using composite (Cp) values by comparing two scenarios. In the first scenario, 11 derived morphometric parameters were used, and in the second scenario, another 7 parameters were added. The obtained values were grouped into five classes (very high, high, medium, low, and very low). Due to the heterogeneity of relief units among geographical regions, there are classification differences for sub-watersheds among those regions. Watersheds classed as very high priority for intervention actions are located in the Carpathian (SW1, SW2, SW15, SW16) and Subcarpathian areas (SW24, SW30), which are characterized by high relief energy and pronounced slope instability, which leads to an increase in the risk of flooding and land degradation. For comparison, all sub-watersheds in the plains region, are classified as very low or low priority. Since the arithmetic mean is sensitive to extreme values, its use in the calculation of composite (Cp) values causes the values to be “eclipsed” and the sub-watersheds to be placed in different prioritization classes (SW18 and SW34), depending on the analyzed scenario, due to the large number of parameters and classified sub-watersheds.
1. Introduction
The increase in the global demand for water and its intensive use in the context of climate change [1,2] means that comprehensive knowledge of the detailed morphometric characteristics of watersheds and their drainage networks is required to effectively manage existing limited resources [3,4,5,6], and to anticipate and prevent damage caused by floods [7,8,9,10] or land degradation [11,12,13,14,15]. The evaluation of geometric features of relief is possible through the quantitative analysis of morphometric parameters. Such evaluations allow interpretation of the origin, evolution, and functioning of the watersheds as open systems [16].
Watersheds are complex hierarchical geographical entities made up of a nested set of sub-watersheds. Watersheds are dynamic because of the continuous exchange of matter and energy with the surrounding environment [17]. Watersheds’ principal input is precipitation. This input can be stored within the watershed by infiltration into the soil, accumulation in the water table [18], or storage in reservoirs [19]; alternatively, inputs leave the system through evaporation [20,21], flow, or transfer to other watersheds or due to human interventions [22,23]. The amount and proportion of precipitation that enters each of these storages, and the rates at which it passes through storage and ultimately out of the watershed, are key features of the structure and functioning of individual watersheds and interact with environmental factors and anthropogenic activities to create distinct watersheds, the character of which can be described by the watersheds’ geometry and spatial configuration. The measurement and determination of morphometric parameters (i.e., drainage density, watercourse length ratio, or bifurcation ratio) allow the analysis of fluvial processes, as well as the dynamics of the watershed [24,25,26,27,28,29,30]. With this knowledge, our capacity to manage the natural resources of watersheds can be substantially enhanced [31,32,33,34,35].
Knowing the morphometric characteristics of watersheds (i.e., their surface, slope, and shape of the watersheds) helps to understand their formation as well as the dynamics and volumes of runoff, including seasonal variation and flash flooding probabilities [36,37,38]. When morphometric characteristics are combined with parameters related to degradation (soil erosion, landslides, muddy flows) [39], vulnerable areas within the watershed can be identified and suitable intervention and development actions prioritized [40,41,42]. Prioritizing intervention actions in sub-watersheds is possible by calculating some morphometric parameters [24,31,43,44]. This is a mathematical procedure to analyze watersheds and their drainage networks to determine features relating to the shape of the watershed, slopes, and the geomorphological evolution of the area [45]. Numerous works have studied the watersheds prioritization’s effectiveness in Geographic Information Systems (GIS) [13,46,47]. In the assessment of morphometry and the control of natural hazards [48,49,50,51], special attention must be paid to how sub-watersheds are delimited and to the number of parameters introduced in the final calculation of composite (Cp) values.
Establishing an optimal number of parameters is very important, especially when a large number of sub-basins are being examined, because the phenomenon of eclipsing may occur. Eclipsing refers to a situation where the influence on the final classification of very high ranks for one or more parameters is minimized or “eclipsed” by lower ranks in numerous other parameters, resulting in a different final prioritization class.
Regardless of the method for determining the rank given to each parameter or the method of selecting them (PCA, multi-criteria analytical hierarchical process, fuzzy analytical hierarchical process, etc.) [5,52,53,54,55,56], the use of a large number of parameters makes eclipsing more likely.
In Romania, numerous studies have analyzed the morphometric parameters of watersheds. These studies have covered a range of lithological, land use, and topographic settings [57,58].
Zăvoianu [17,22,59], for example, evaluated the relationship between the environmental factors and the morphometric characteristics of fluvial relief [60,61,62] and used these relationships to develop various morphometric models (a morphometric model of drainage, a morphometric model of surfaces, a morphometric model of perimeters) [17]. These models were subsequently applied to highlight the evolution of various watersheds [63,64], including the Buzău River Basin, but mainly in the Subcarpathian region [17,34]. Other studies have also evaluated the morphometric characteristics of the relief in the Buzău River Basin [57,65]. However, these studies did not use these analyses to prioritize intervention actions within the sub-watersheds, starting only from the morphometric characteristics of the watershed and the hydrographic network.
The current work aims to (a) evaluate the basic morphometric characteristics of the sub-watersheds of tributaries of the Buzău River; (b) identify derived morphometric properties that can be used to prioritize intervention actions; (c) make prioritization maps and identify the required level of intervention; (d) compare the effectiveness of prioritization methods, depending on the number of parameters, by comparing two scenarios; and (e) present the advantages, the risk of eclipsing the values, and the limits of the proposed methodology.
2. Materials and Methods
2.1. Study Area
The Buzău watershed is located in the southeastern part of Romania, and is part of the larger Siret watershed (Figure 1). It covers a total area of 5264 km2, which constitutes 2.2% of the land area of Romania. The Buzău River has a total length of 302 km. The stream network of the Buzău River is distinctive in that substantially more tributaries (26) join the river from left bank (Eastern side) than the right bank (13). The altitude of the river ranges from 1250 m upstream to 8 m downstream, and the average slope is 4‰.
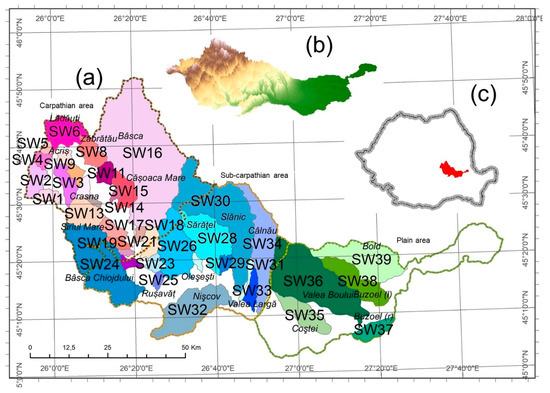
Figure 1.
The geographical position of the sub-watersheds in the study area (a); a 3D model of the terrain (b); the position of the Buzau watershed within Romania (c).
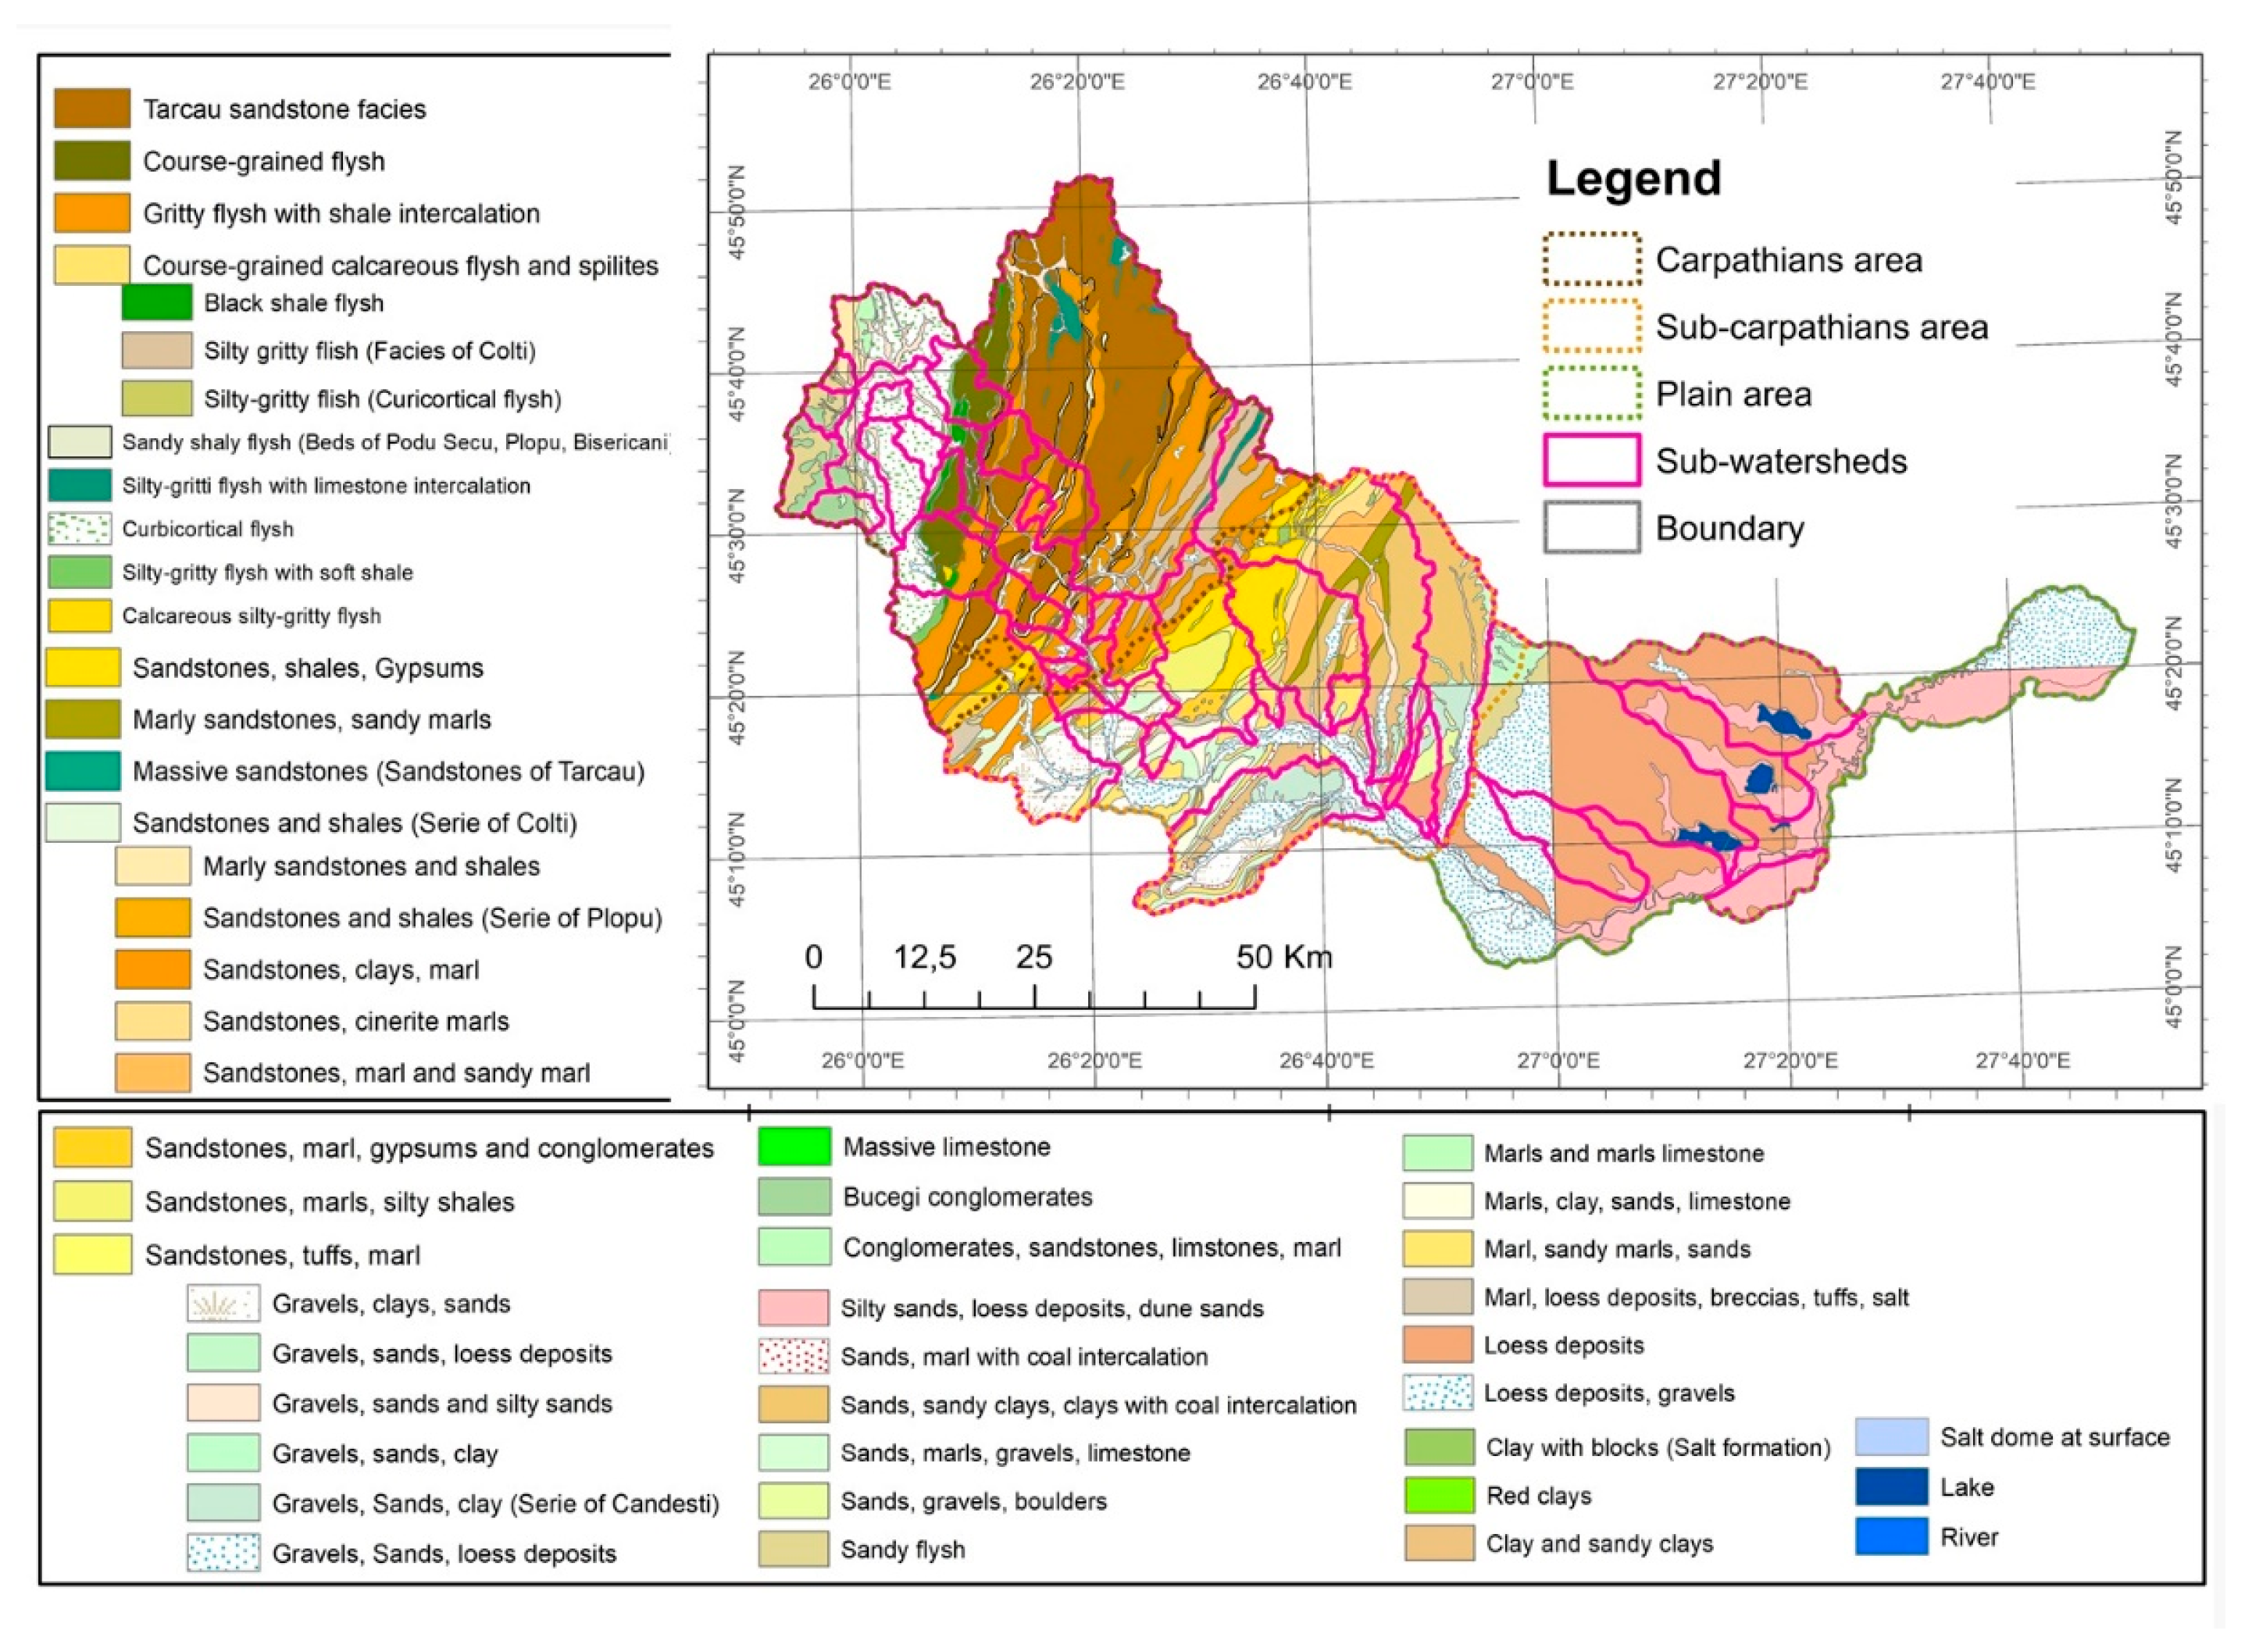
From a geomorphological point of view, the watershed overlaps over two morphostructural units, namely the orogen unit represented by the supper and middle sectors and the platform unit characterized by the lower sector. From a geological point of view, the mountain sector has the greatest development in the area of the curbicortical flysch formed between the Cretaceous and the Paleogene, to which the calcareous conglomerates are added from the catchment area of Buzău, including sedimentary deposits of sandstones, marls, and micro-conglomerates arranged in the Intorsura synclinal area—Aninoasa (Figure 2) [46,66].

Figure 2.
Geological map of the sub-watersheds in the study area.
The Subcarpathian sector consists of molasse deposits of Neogene age raised from the Pericarpathian avanfossa, and the lower sector includes predominantly loessoidal deposits formed between the Paleozoic and Neozoic [67].
The Buzău watershed is located at the junction of 3 biogeographical regions, namely the alpine, continental, and steppe regions. In the mountain sector, coniferous forests of pine (Pinus sylvatica) and spruce (Picea abies) predominate above 1400–1600 m or at altitudes below 800 m in depression areas as a result of thermal inversion. At altitudes below 1400 m, in the Subcarpathians, deciduous forests of beech (Fagus sylvatica) and Sessile Oak (Quercus petraea) are widely distributed. In the steppe region of the lower sector, the vegetation corresponding to the steppe has been replaced by crops (Figure 3).

Figure 3.
Land use of the sub-watersheds in the study area.
To mitigate floods, two reservoirs have been built, namely the Siriu Lake, 10 km upstream from Nehoiu, with an area of 2.6 km2 and an average depth of 45 m, and the Cândești reservoir, 19 km away from the city of Buzău. The reservoirs have total volumes of 155 million m3 and 3.7 million m3 of water, respectively. Also, to avoid the destructive effects of high floods, dams have been built on the Buzău River in the area of Buzău municipality and Viperești, the Blăjeanca River in the village of Sapoca and the Valea Largă and Câlnău rivers in the village of Mărăcineni. Finally, a dam and control structures have been constructed on the Bălăneasa river on the perimeter the village of Pârscov.
2.2. Methodology
To determine the morphometric parameters of the watersheds, the Digital Terrain Model (DEM) was used from the Shuttle Radar Topographic Mission (SRTM) (https://earthexplorer.usgs.gov/ (accessed on 1 December 2023) with a resolution of 1:30 m combined with 1:25,000 topographic maps (Stereo 70 map projection). The data were processed to be adapted to the same projection system. The automatic delimitation of the watersheds and the identification of stream networks were carried out using ArcGis 10.8. The criteria that were the basis of the delimitation of the 39 sub-watersheds were that sub-watersheds must include tributaries of the Buzau River; have a permanent course; cover an area ≥10 km2; and include a main watercourse >5 km. Inter-watershed areas in between sub-watersheds fulfilling these criteria were not considered for prioritization.
Furthermore, as a result of the construction of the Siriu reservoir, SW12, a tributary of SW13, discharges into the reservoir and is considered a self-sustainable sub-watershed.
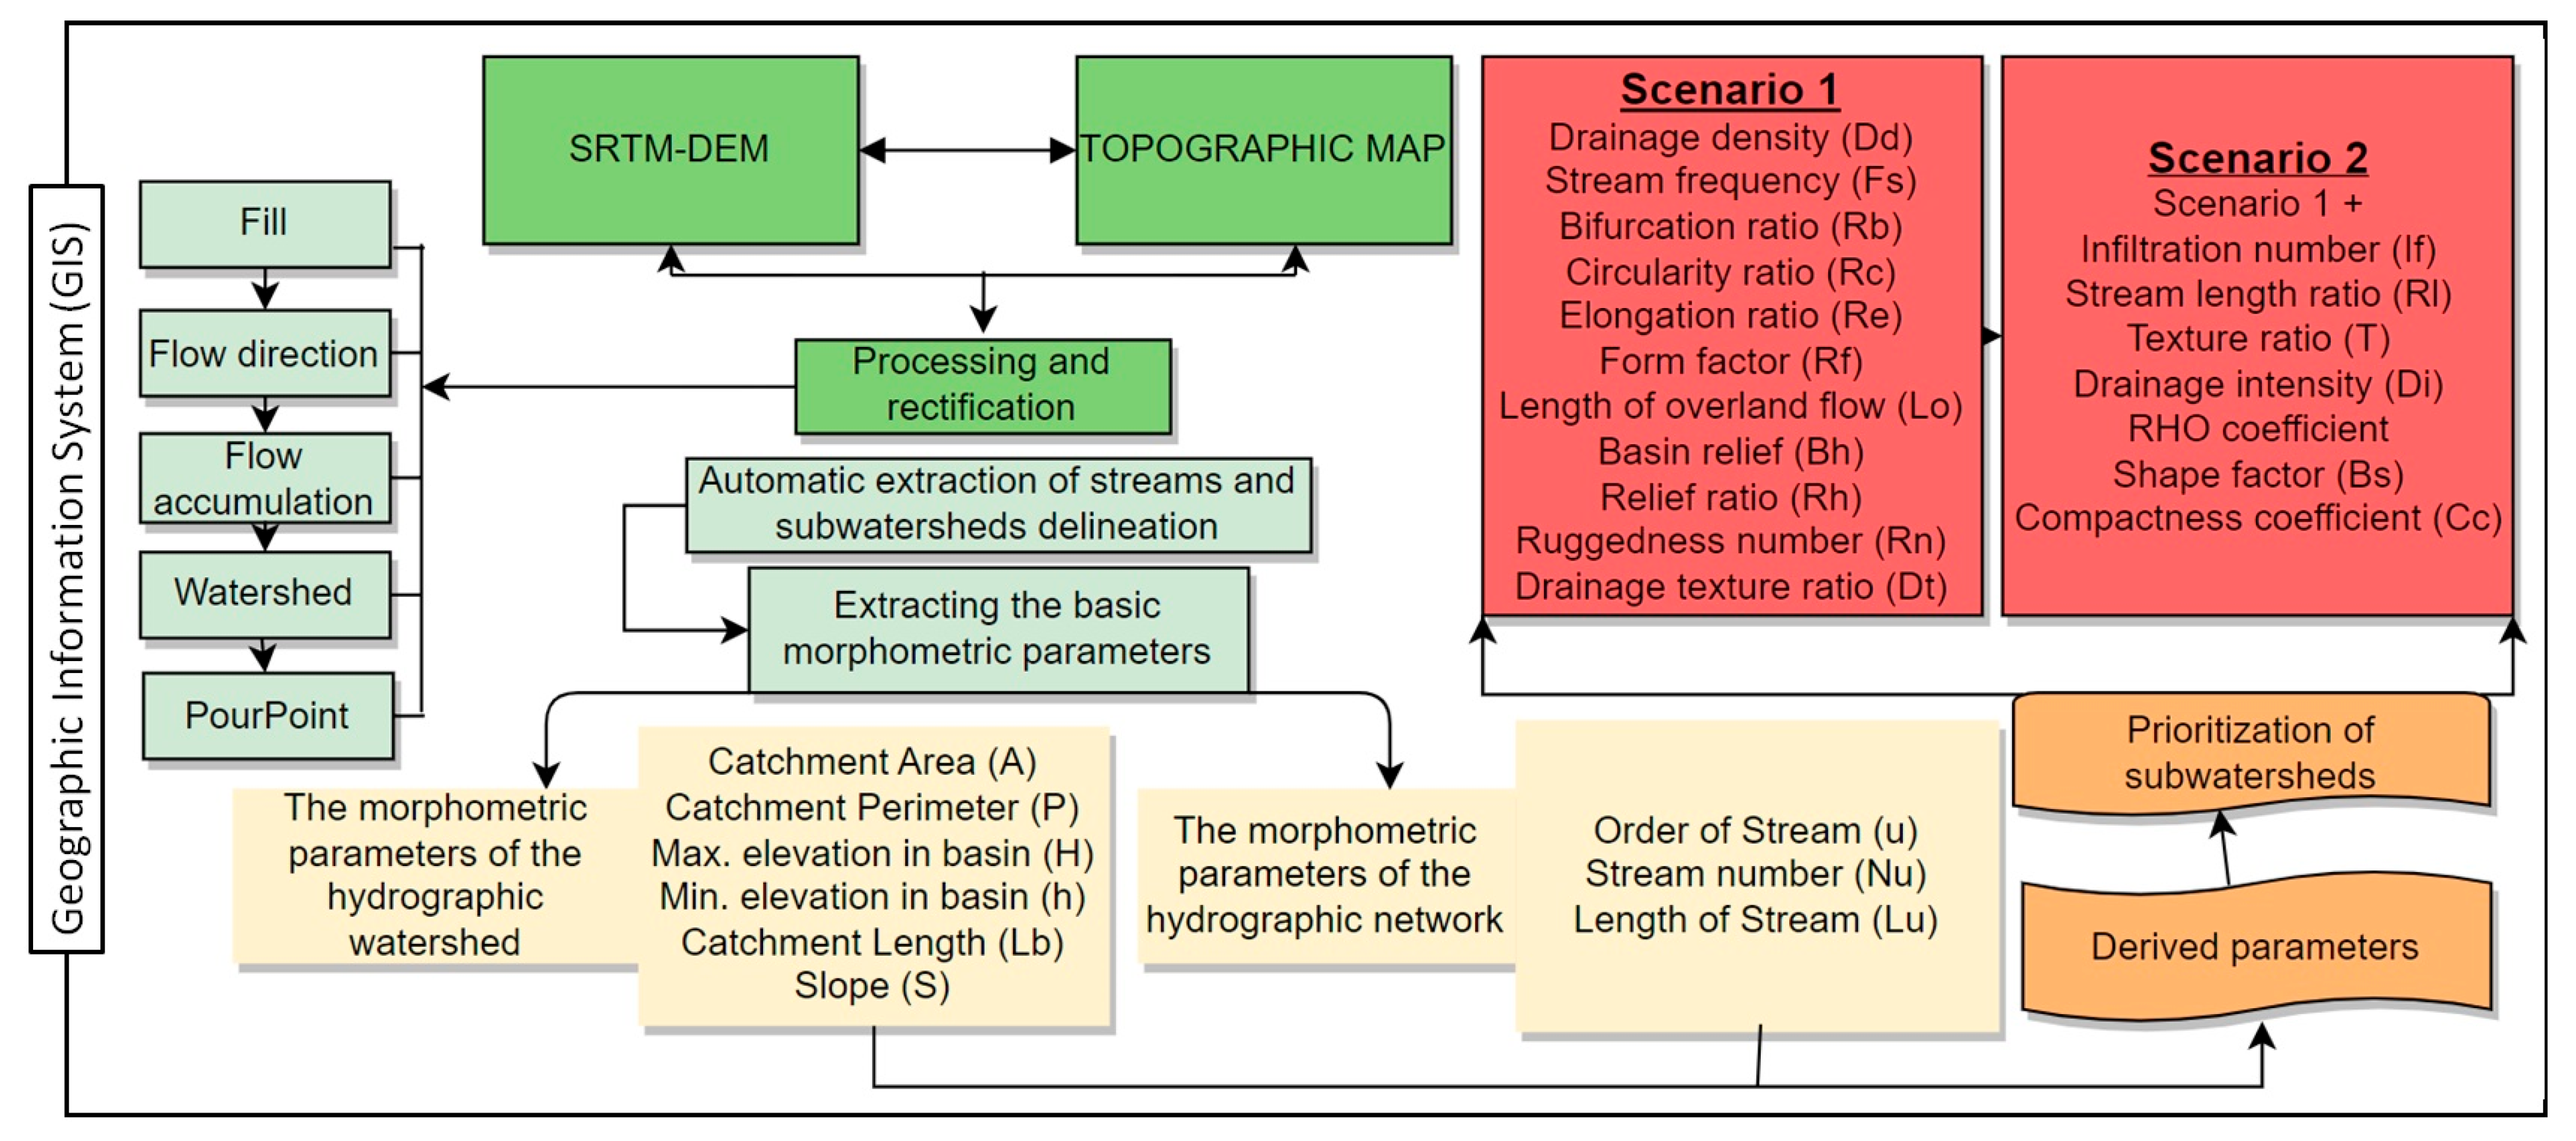
The data obtained automatically in ArcGIS were validated based on 1:25,000 topographic maps (see the flowchart in Figure 4).
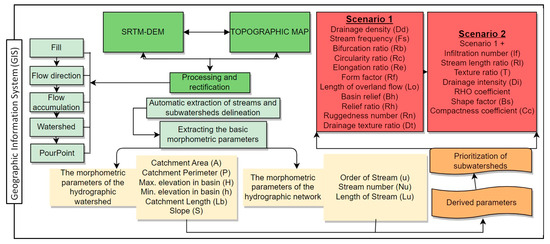
Figure 4.
Flowchart of the methodological steps.
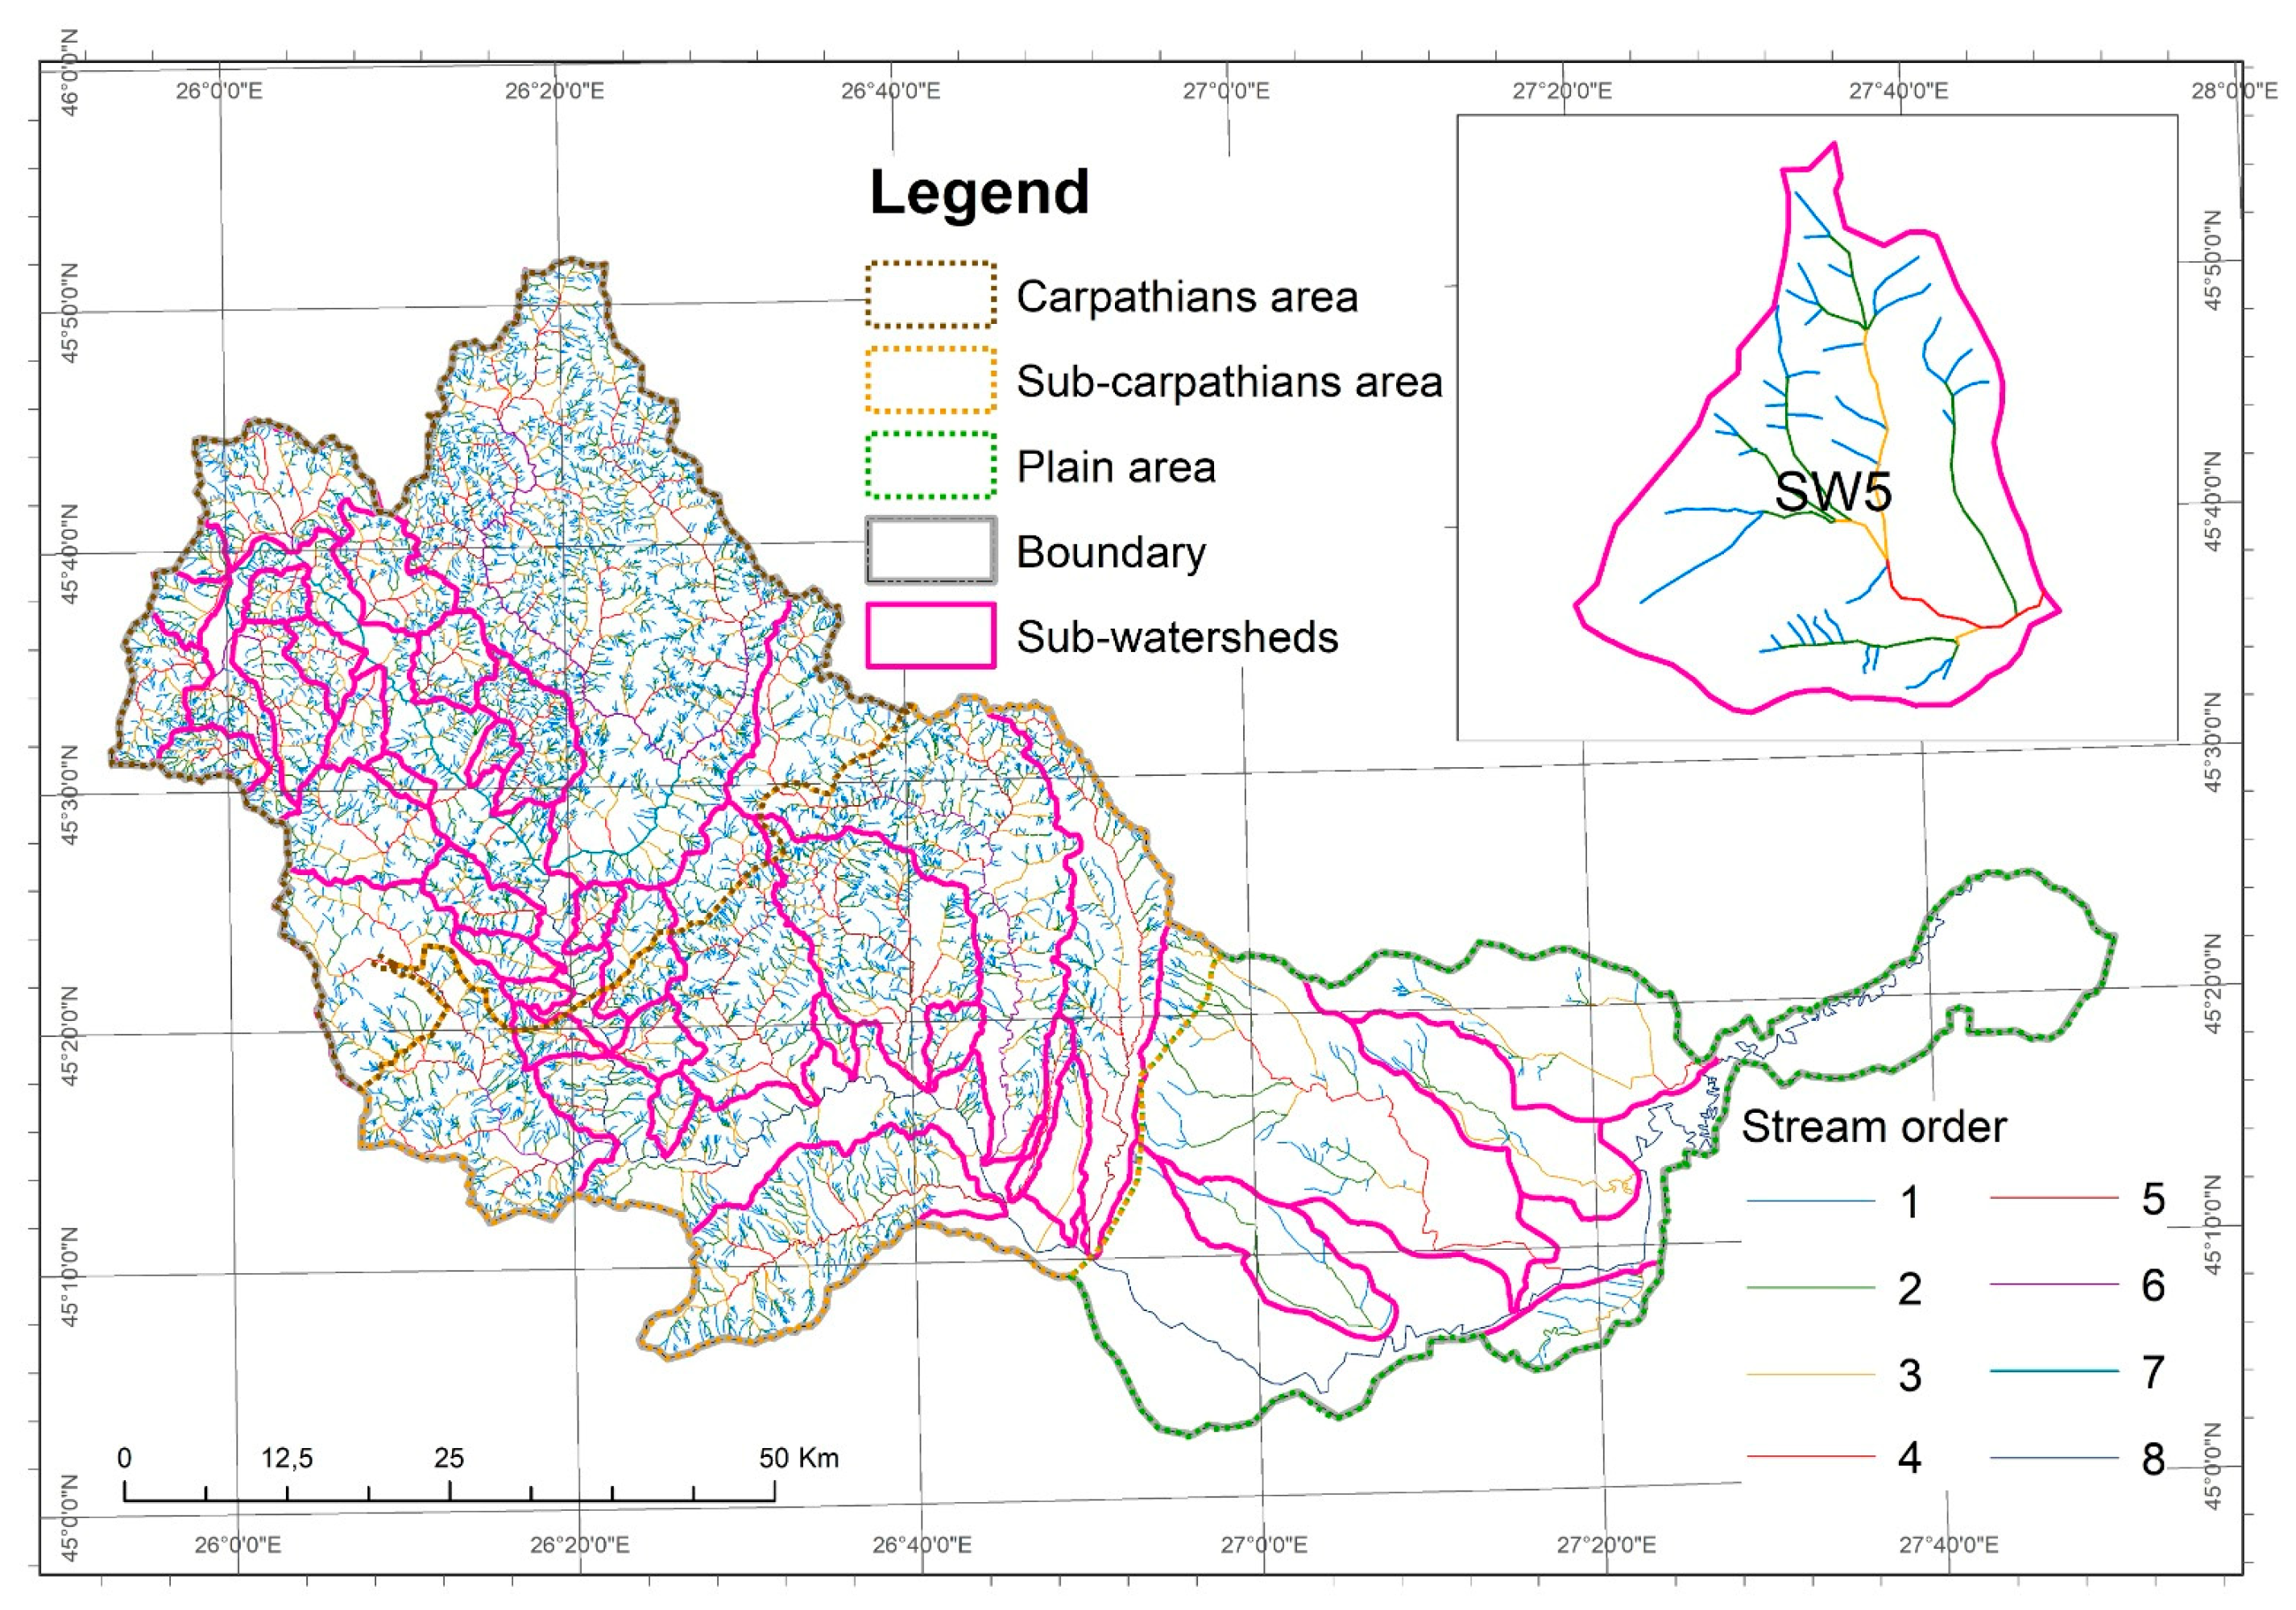
The classification of the hydrographic network was carried out using the system of classification of the drainage network proposed by Horton in 1945 and developed by Strahler in 1952 as a model. Thus, the hydrographic networks of the tributaries of the Buzău River (Figure 5) were arranged in ascending order from upstream to downstream, the order of size changing at the confluence of two watercourses that have the same order (Zăvoianu et al., 2011) [59]. The extraction and quantification of data was aimed at determining the morphometric parameters of the watershed (n = 6) and of the drainage network (n = 3), as well as the calculation of the derived parameters (n = 18), used in the prioritization of the sub-watersheds (Table 1) [68].
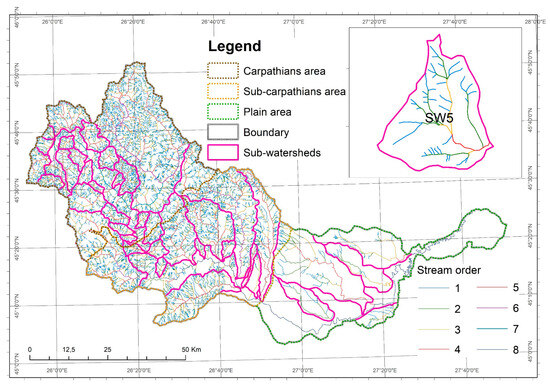
Figure 5.
Stream order map.

Table 1.
Morphometric parameters of network and watershed.
To prioritize the 18 parameters derived within the sub-watersheds of the Buzau River Basin, ranks from 1 to 39 were given to each sub-watershed; these were arranged in ascending (Rc, Re, Rf, and Bs) and descending order (Rb, RL, RHO, Dd, Fs, DT, T, If, Di, Lo, Bh, Rh, Rn, and Cc) according to the lowest/highest value. To calculate the composite (Cp) values and establish the prioritization class, the sum of the ordered values was averaged and the obtained values were divided into 5 classes (very high, high, medium, low, and very low) from low to high using the natural breaks methods from ArcGIS 10.8. This method of classifying the values was chosen because the relief units in which the sub-watersheds develop are non-homogeneous (Carpathian, Subcarpathian, and plains areas) and there may be significant differences between values for this reason. Natural breaks group similar values, identify large statistical differences between pairs of values, and sort them without taking into account the location, thus avoiding the situation, if equal intervals are used, whereby there are intervals in which no sub-watersheds can be found. Natural breaks’ classes are based on natural groupings inherent in the data. Class breaks are identified considering that the best group has similar values and in a manner that maximizes the differences between classes [68]. The features are divided into classes whose boundaries are set where there are relatively big differences in the data values.
3. Results
3.1. Morphometry of Watersheds
The surface of the watershed represents the water collection area and has a special role in the production and evolution of hydrological phenomena. In the case of small watersheds, the hydrological regime is directly influenced by the amount and regime of precipitation; in contrast, as the watershed area increases, the storage capacity of the watershed increases, buffering the rainfall–runoff relationship and reducing the ratio between the maximum and minimum runoff [70].
The total area of the Buzău watershed is 5264 km2 in this area. We analyzed the 39 sub-watersheds that cover a total surface of 4112 km2. The difference is made up of the inter-watersheds not included in this study. The average area of the sub-watersheds is 106 km2; however, there is a trend of increasing sub-watershed area from upstream to downstream. Thus, in the Carpathian area, the average area of sub-watersheds is 72 km2, which increases to 132 km2 in the Subcarpathian area and reaches 175 km2 in the plains area. Upstream–downstream trends are also evident for sub-watershed length, which increases (11.7 km, 18.1 km, and 23.2 km for the Carpathian, Subcarpathian, and plains areas, respectively), and slope, which decreases downstream (49.14‰, 29.6‰, and 2.75‰ in the Carpathian, Subcarpathian, and plains areas, respectively).
Although the smallest areas of the sub-watersheds are located in the Carpathian area, (SW12 and SW14) being only 10 km2, the largest sub-watershed in the whole study area is SW16, with an area of 783 km2, which is also within the Carpathian area. The largest sub-watersheds in the other two areas are similar, at 425 km2 for SW30 (Subcarpathian area) and 420 km2 (plains) for SW36 (Supplementary Table S1).
As the Buzău River advances downstream, in the plains sector, the low slopes and altitudes of only 57.6 m, combined with the friable rocks made up of loessoid deposits, favor the expansion of sub-watershed area and the intensification of the phenomena of meandering and unbundling of the water courses. The length of the watershed is influenced by the distance traveled by the water from the highest to the lowest elevations. Thus, there is a general trend of the length of the watershed increasing from upstream to downstream, from the average value of 12 km in the Carpathian sector to 23.1 km in the lower, plains sector, against the background of average altitudes that range between 968.14 m and 124 m.
3.2. Morphometry of the Hydrographic Network
Stream order (μ) is a morphometric parameter that can be used to quantify drainage networks. According to Strahler [44], a course takes on a higher order of magnitude at the confluence of two streams of the same order, for which the order of magnitude increases from upstream to downstream. Tributaries to the Buzău river are generally classified in orders 4, 5, and 6, with only SW16 supporting a stream network reaching a stream order of 7. The rapid branching of the hydrographic arteries and the increase in the number of segments of lower order causes the orders of 5 to be reached even in the river watershed area of the Buzău River (SW1, SW2). Where the networks of SW1 and SW2 meet the Buzău River becomes the sixth-order river, and after the confluence with SW3 (of order 6), the main river reaches order 7, which is maintained until the confluence with SW16 (Supplementary Table S1), below which it reaches order 8.
In the Subcarpathian sector, although the average number of segments of different orders is higher (278 segments/sub-watershed) compared to the Carpathian area (252 segments/sub-watershed), the largest orders of magnitude remain 6, while in the plains sector, the low slope (on average just 2.2‰) and the friable loessoid rocks results in the sub-watershed networks reaching a maximum of order 4. The total length of the segments is similar within the Carpathian and Subcarpathian area (165 km and 153 respectively), while the total length in the plains area is substantially less (79 km). However, the average segment lengths are higher in the plains area (2.8 km/segment) than the Carpathian area (0.89 km/segment)
SW16-Basca is the only sub-watershed with a hydrographic network that reaches a seventh-order stream. This pattern reflects the sub-watershed’s large area of 783 km2 and the high hardness of the underlying geology, which both favor the development of a larger stream network. Networks reaching order 6 were found in sub-watersheds such as SW3 and SW6. Although the maximum stream order in SW3 and SW6 was only 6, these sub-watersheds reached order 6 from only 178 and 329 segments, respectively, while for SW16, 2918 segments were needed to reach order 7 (Figure 5). This pattern can be explained by the presence of the curbicortical flysch, a relatively soft rock, in SW3 and SW6.
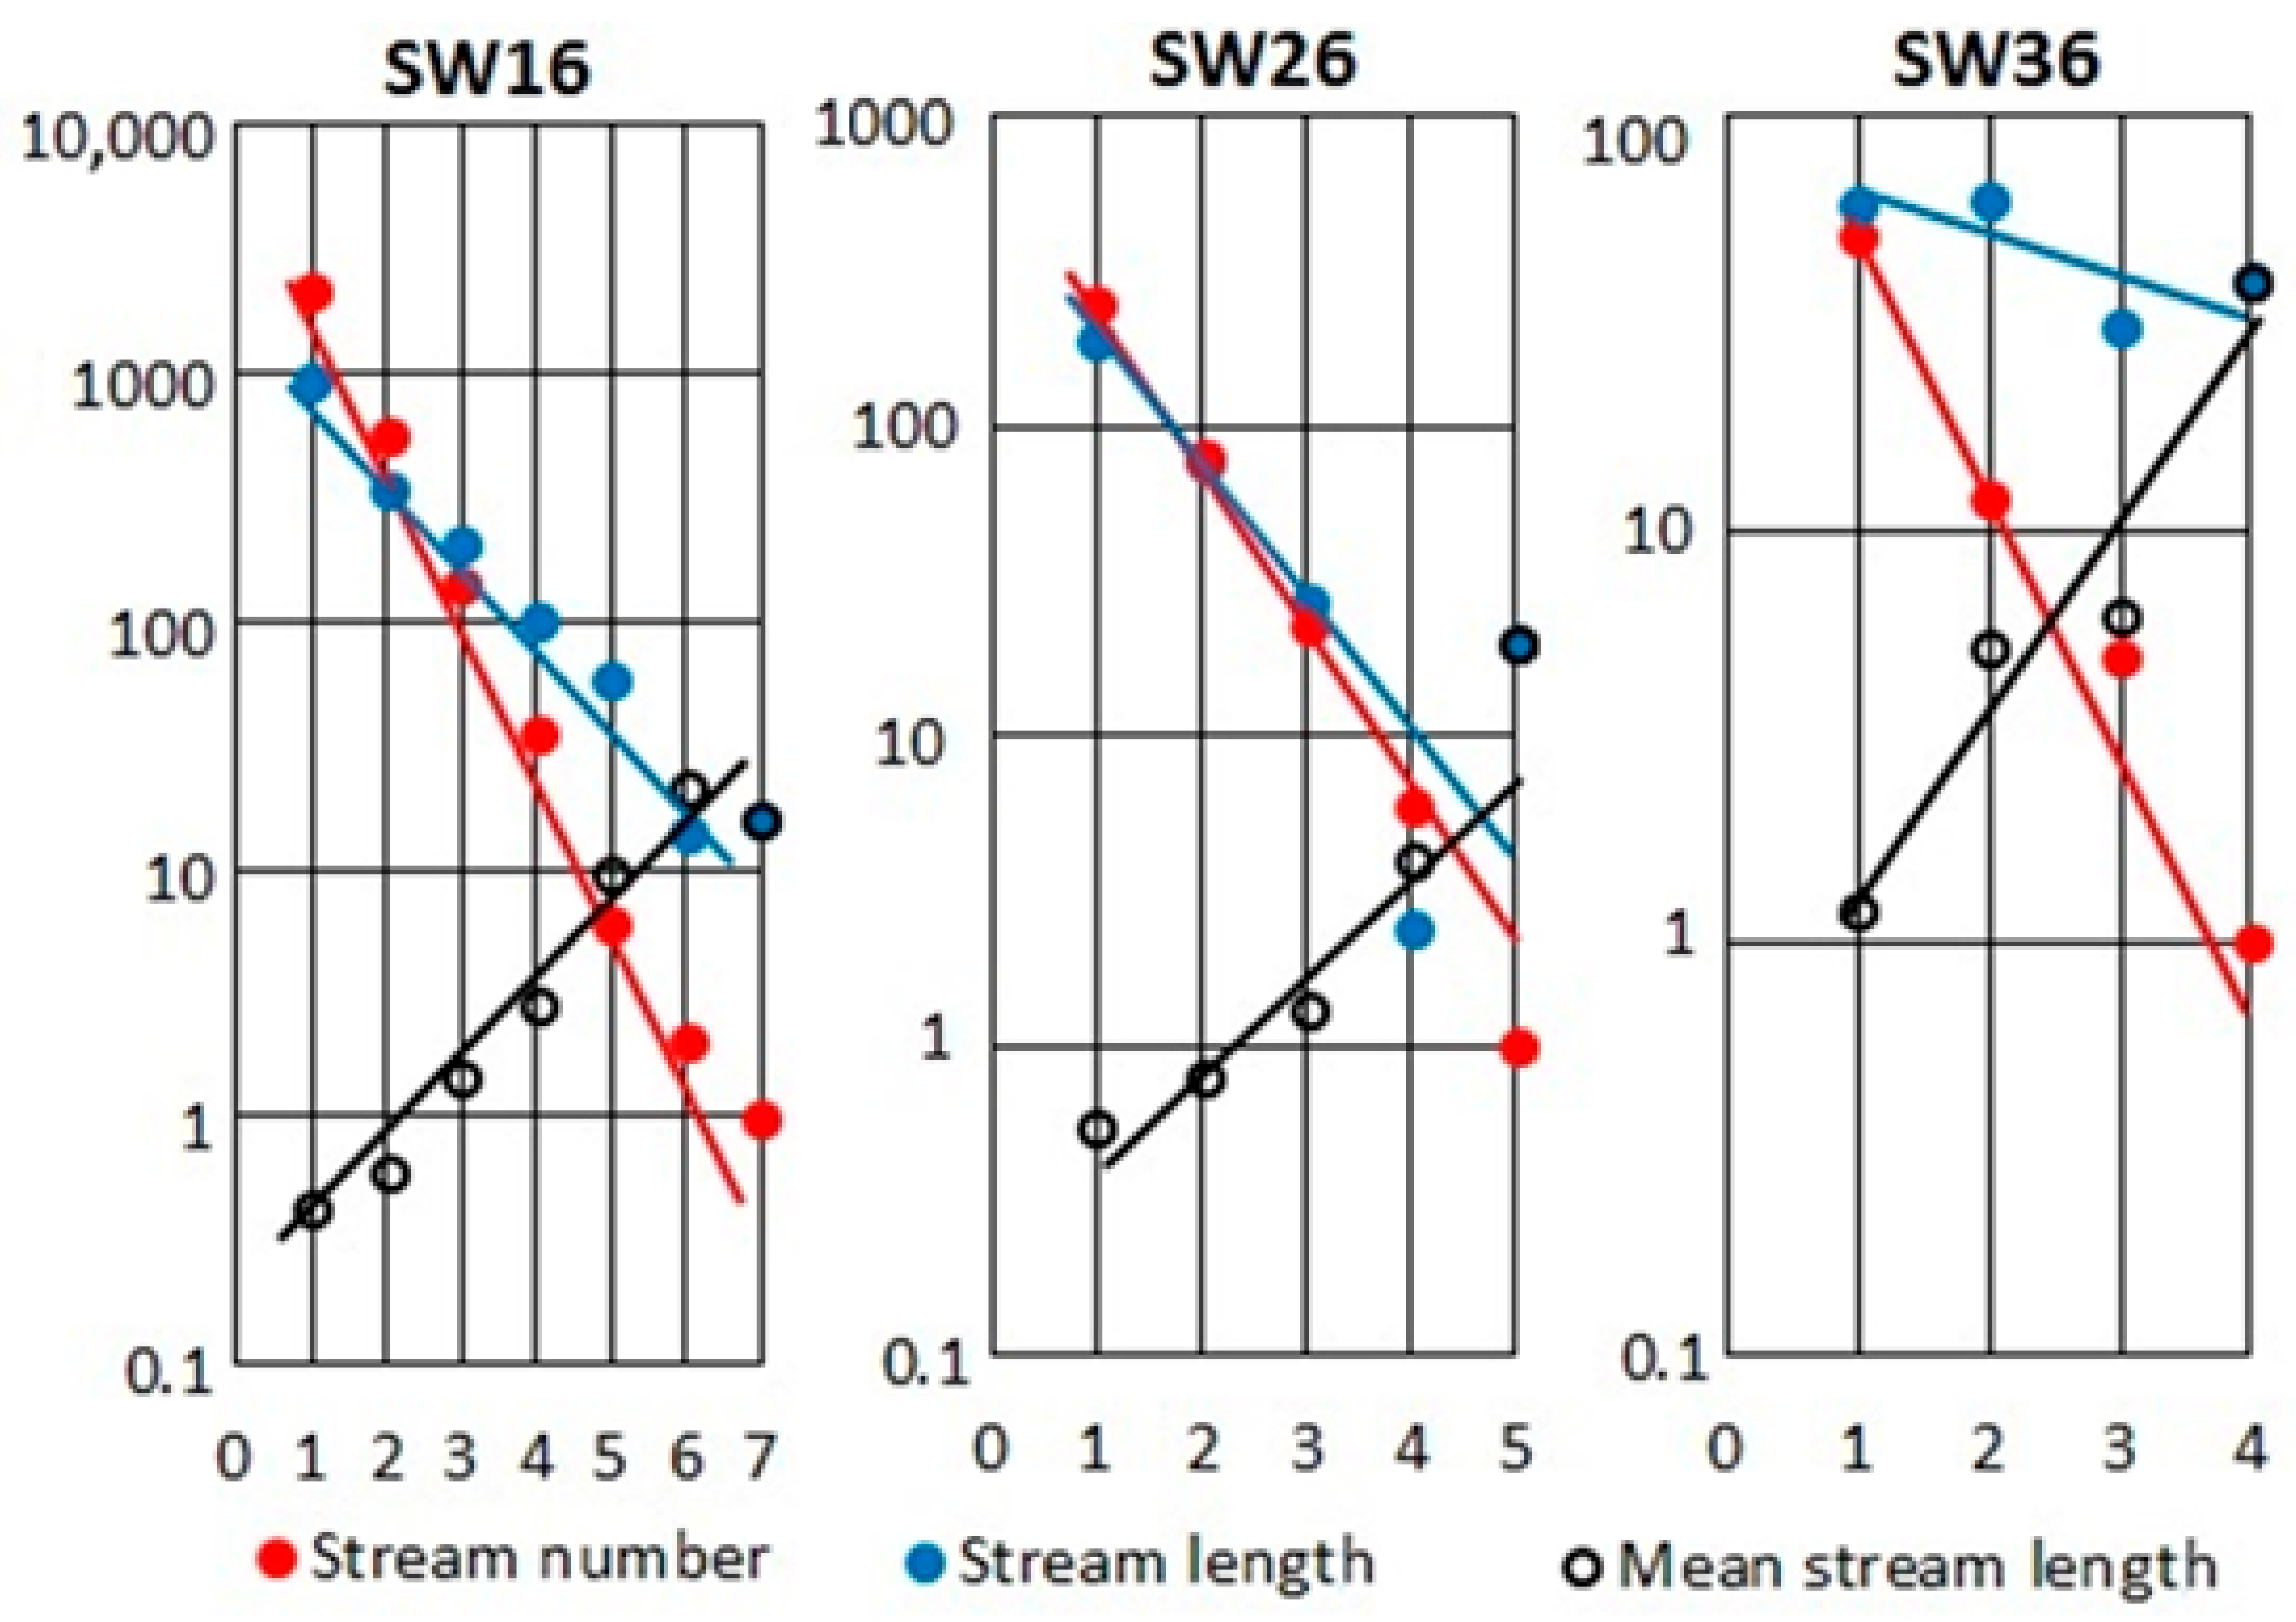
The increase in the number of segments of a lower order, and of the total and average lengths, determines, in the Subcarpathian sector, a degree of fulfillment of the supra-unitary course, on average 108%, compared to the Carpathian and plains area, which is slightly unfulfilled <85%, which will determine the increase in the number of lower-order segments in the future. However, in the Subcarpathian sector, in the sub-watersheds with a large area, the degree of fulfillment of the higher order of magnitude is very high, reaching 211% (SW26), 185% (SW28), and 155% (SW32), which indicates major imbalances in these areas. Thus, the ratio of the total lengths and the total number of segments in each sub-watershed forms a decreasing geometric progression, while the average length of the segments forms a geometric progression (Figure 6).

Figure 6.
The morphometric model of the drainage in SW16, SW26 and SW36.
The high degree of fulfillment of the higher-order course also indicates a tendency toward the internal branching of lower-order stream segments and high drainage density, and therefore, a high risk of degradation of the drains.
In the plains area, the stream network within sub-watersheds does not exceed the 4th order and generally includes relatively few (only 10 in the case of SW35), reflecting the slope of only 3%.
3.3. Derived Properties of the Watershed and Hydrographic Network
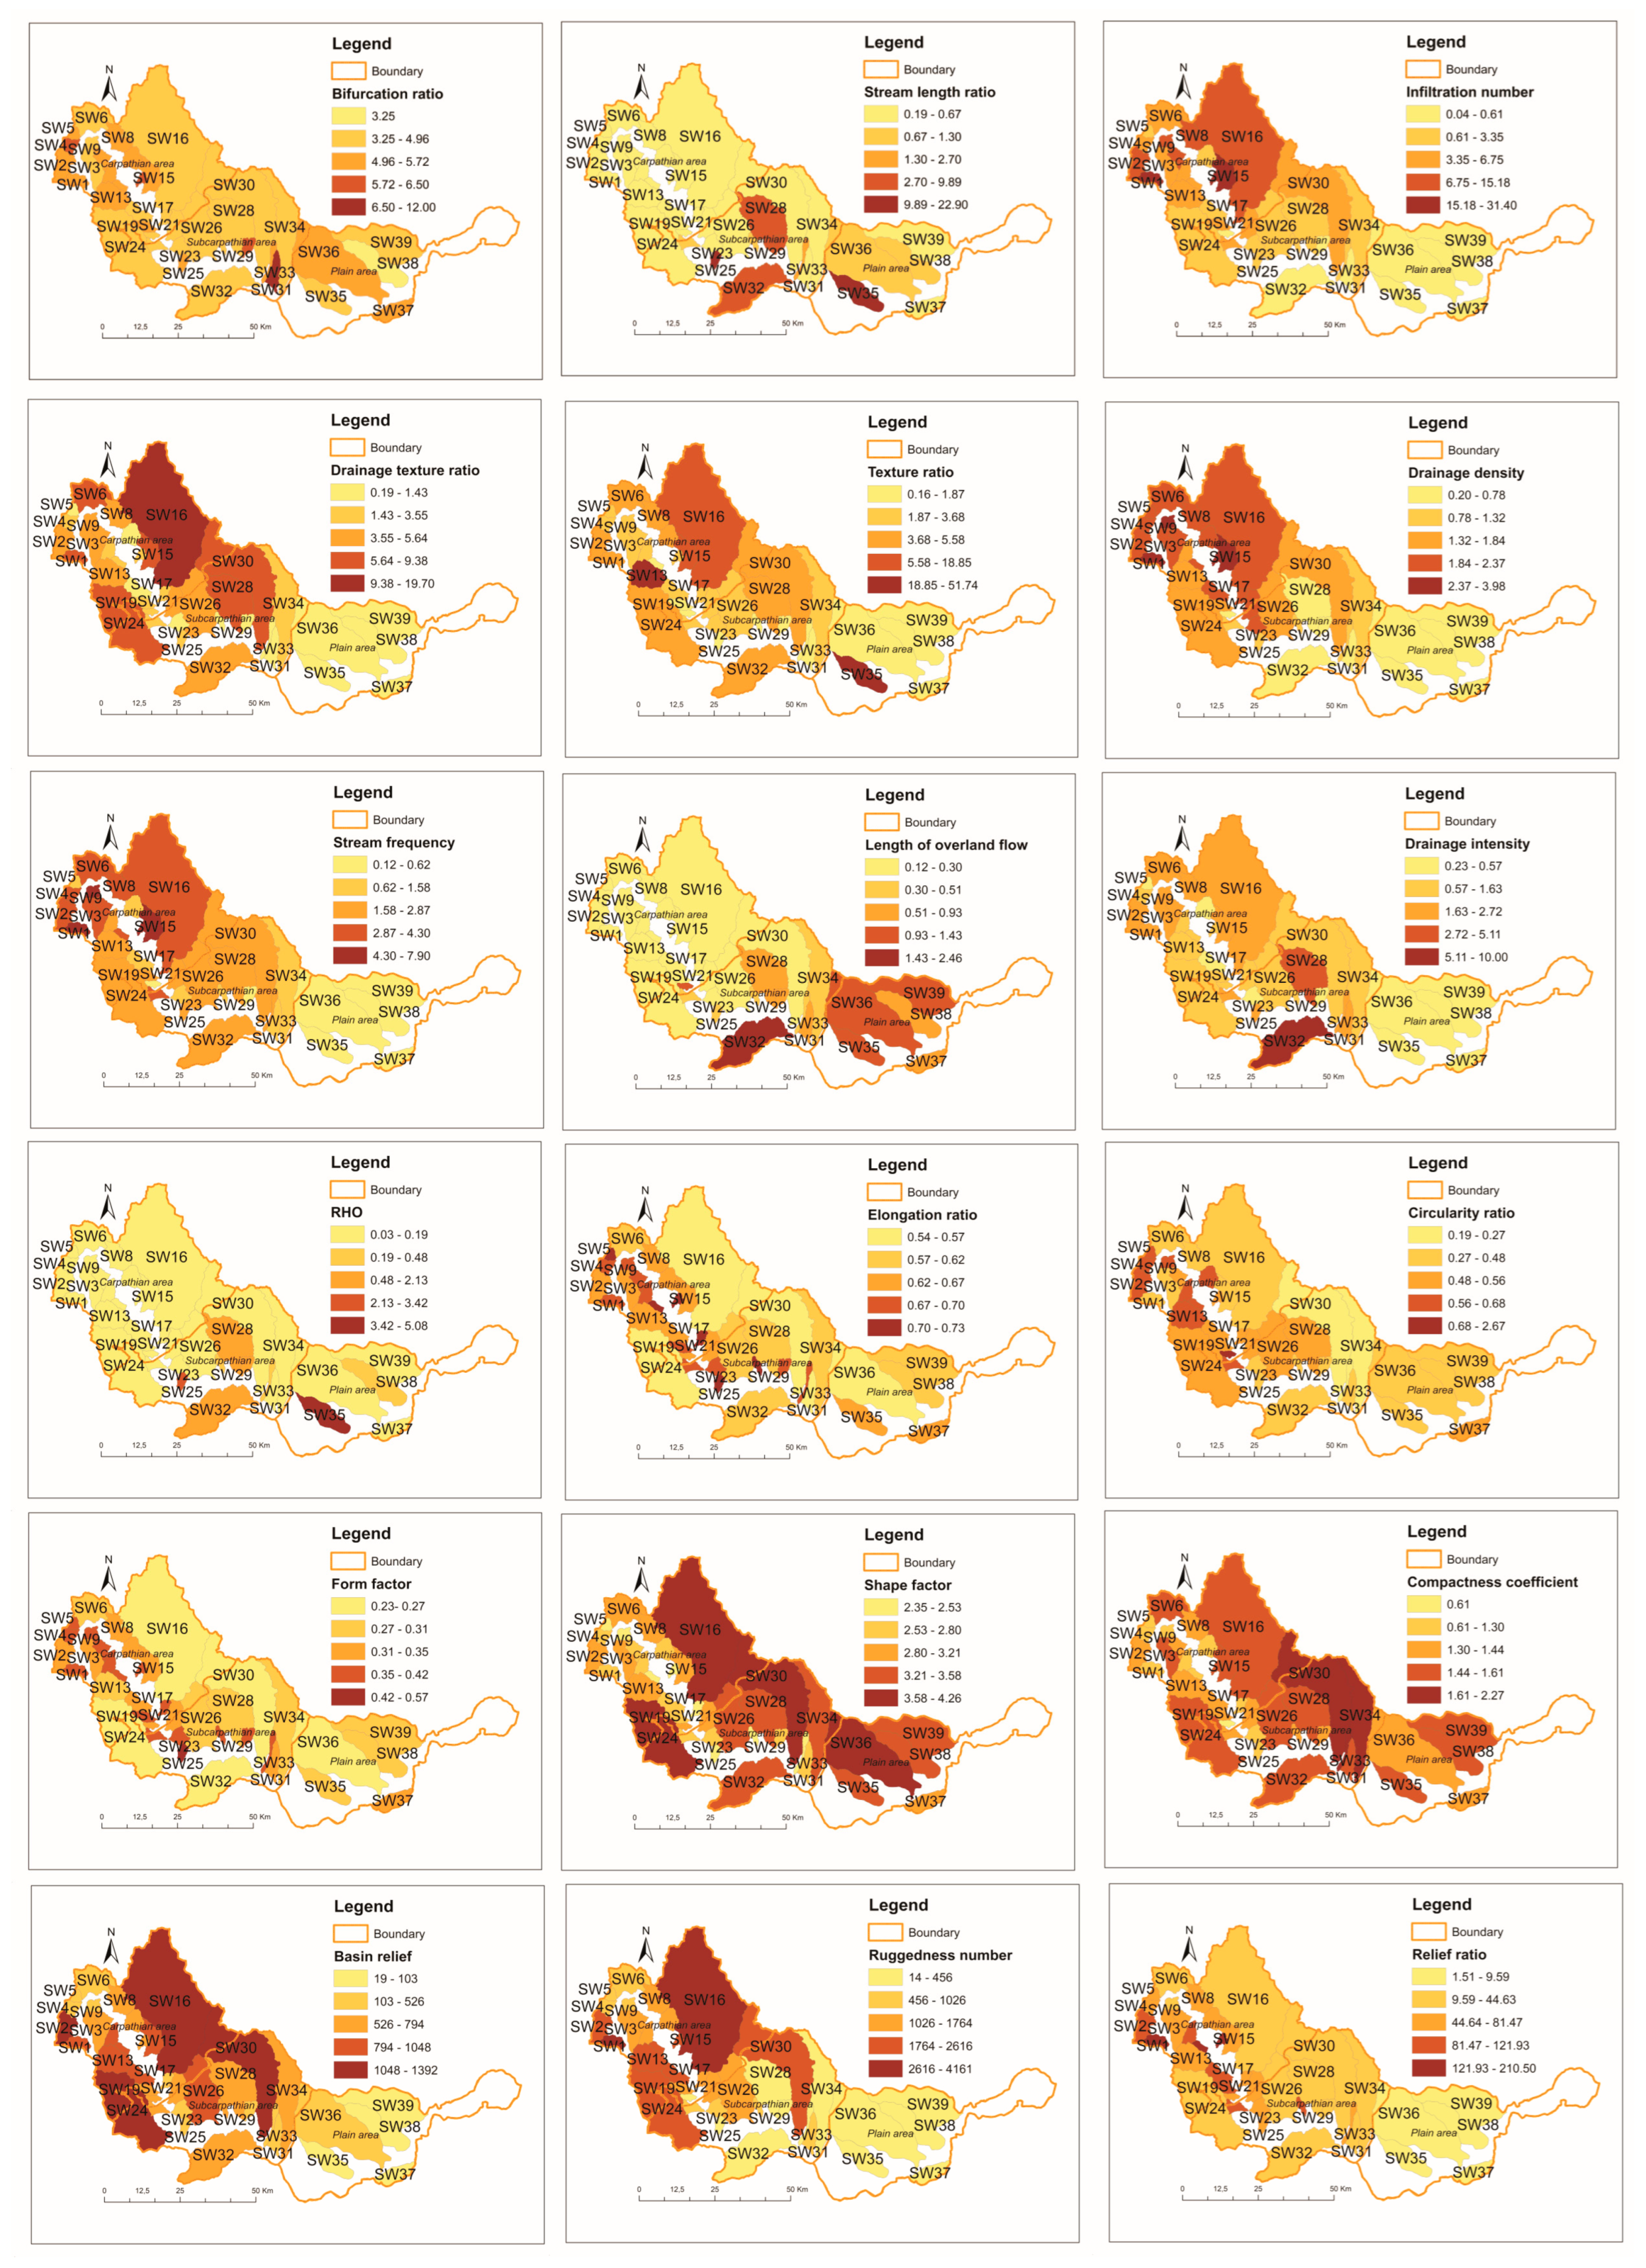
The bifurcation ratio (Rb) is a morphometric parameter calculated as the ratio of the number of segments of a stream order and the number of segments of the next highest order [31]. Most sub-watersheds in the study area have a high bifurcation ratio, especially those in the Carpathian sector (Supplementary Table S2; Figure 7). Sub-watersheds with bifurcation ratio values between 3.0 and 5.0 are considered to be morphodynamically stable [71]. However, both in the Carpathian and Subcarpathian sectors, the average value of the bifurcation ratio is over 5.0. This high value is due to the low permeability of the soil, which increases surface runoff and thus the occurrence of flash floods. The highest bifurcation ratio in the Carpathian sector is 6.5, above the sector average of 5.19, which was found for SW4, with the circular shape of the watershed contributing to the high value. The lowest bifurcation ratio (3.25) was found for SW38 in the lowland sector, indicating a low degree of soil permeability and potential for bed meandering.

Figure 7.
Derived properties of the watershed and hydrographic network.
The stream-length ratio (Rl) is the ratio of the length of streams of the same order to the length of streams of lower order [24]. The highest length ratio is 22.90, held by SW35 and the lowest value is 0.19, measured in SW14. All sub-watersheds in the mountain sector have length ratios below 1, with an average of 0.14. Further downstream, the lengths of the stream segments increase as a result of sediment deposition and reduced stream power.
The length of overland flow (Lo) is defined as being inversely proportional to the average slope of the drain [24]. It varies among the 39 sub-watersheds between 0.12 and 2, generally increasing from upstream to downstream. SW 32-Nișcov has a slope of 9%, well below the average of the Subcarpathian sector of 29.61%. This SW has high forest cover; forest vegetation tends to increase infiltration and reduce runoff, resulting in low sediment loads in the river channel.
The RHO coefficient is calculated as the ratio between the length of overland flow and the bifurcation ratio. It is influenced by a series of physical geographic factors that shape the relief of the land, and by human activities. Within the studied sub-watersheds, this parameter ranged between 0.03 and 5.08, where a value lower than 0.6 indicates a lack of water storage during floods. Most sub-watersheds falling into this class, especially those from mountain regions, developed on flyschoid rocks and are resistant to erosion and infiltration.
Drainage density (Dd) is the ratio of the total length of the hydrographic network to the area of the watershed [70]. The average density of the Buzău watershed is 1.65 km/km2, but Dd varies among sectors and among sub-watersheds. Thus, Dd averages 2.24 km/km2 in the mountain region, but is reduced to 0.34 km/km2 in the plains sector. The highest Dd among sub-watersheds was recorded for SW1, where the Dd is 7.90 km/km2. The pattern of higher Dd at higher altitudes reflects higher runoff driven by steep slopes and high precipitation. In combination, these characteristics lead to the development of a dense hydrographic network. In contrast, downstream of the Carpathian sector, the friable rocks and reduced slope encourage infiltration and reduce surface runoff, allowing the drainage density to be reduced.
The drainage texture ratio (Dt) is the ratio of the total number of segments to the watershed perimeter. Overall, the Buzău River Basin is classed as having a coarse Dt, with an average value of 3.75. At the sector level, the Carpathian sector falls into the intermediate texture type, with the highest values at the sub-watershed level being 19.71 for SW16-Bâsca. According to Horton, (1945) [24], values greater than 15 are associated with ultrafine sedimentary materials. According to Chendeș (2008) [32], the highest flows in Romania occurred in the Subcarpathian sector of the Buzău River Basin. The receiving surface of SW16 allows the collection of a high volume of sediments, which are transported in suspension. On the other hand, in the plains sector, the average value of the drainage texture rate is, on average, 0.40 on the background of the coarse material represented by the friable, sandy rocks.
The texture ratio (T) is calculated as the ratio between the number of first-order arteries and the watershed perimeter. It is influenced by climatic conditions, rock, and the bio-pedo-geographical cover. High values indicate soft rocks that do not resist erosion. Soil texture has an impact on deep erosion, which can contribute to the formation of new arteries. It is noted that the highest T values were calculated for SW 35, which has a lithology rich in fine gravel and sand deposits. Interestingly, two neighboring sub-watersheds, SW11 and SW13, were calculated to have very different texture ratios, with SW11 having a T of 4.56, and SW13 a T of 39.48. This difference is explained by the fluctuations in the water level of Lake Siriu, where the two arteries discharge, as well as the higher slope (61%) in SW11, which causes extensive erosion processes on the lower-order segments, which, in turn, results in a higher-density hydrographic network.
Drainage intensity (Di) is an important parameter as it quantifies the water collected and discharged from a sub-watershed by the drainage network. SW28 and SW32 in the Subcarpathian region have values above the regional average, although the drainage density is low. According to Chendeș (2008) [32], the sub-watersheds in the Subcarpathian Curvature sector are the most affected by increases in discharges and floods, with the Nișcov sub-watershed recording the most floods over time. For example, from a preliminary flood risk assessment, ABA Buzău-Ialomița claimed that on 11 October 2016, at 23:00, the danger level was exceeded by 42 cm at the Izvoru hydrometric station on the Nișcov River (Figure 7).
Stream frequency (Fs) is a parameter defined as the total number of segments relative to the watershed surface [24]. The frequency of the drainage flow at the overall level is 2.49, which indicates high soil permeability. In mountainous areas, hard rocks prevent the infiltration of water into the soil, which results in higher Fs values. For example, SW1’s Fs is 7.90, due to the geological substrate consisting of conglomerates. The lithology, together with the accentuated slopes, played a key role in creating a dense hydrographic network in this area; thus, there is a correlation between Fs and Dd.
Infiltration number (If) is calculated by multiplying the drainage density by the drainage frequency. In the plains sector, an averaged If of 0.09 indicates good infiltration of water, while the average If values for the Carpathian and Subcarpathian sectors are 8.64 and 2.18, respectively. Thus, this parameter is influenced by altitude, rock type, and land use.
The circulatory ratio (Rc) [26] is the ratio between the area of the watershed and the area of the circle, with a circumference equal to the limit length of the watershed. Watersheds with Rc values closer to 0 are more elongated and are considered young, while watersheds with Rc values closer to 1 are more circular and are considered old. Watersheds with intermediate values are considered mature. With respect to regional patterns, sub-watersheds in the Subcarpathian middle and lower sectors have elongated shapes, while those of the Carpathian sector approach a circular shape, with an average value 0.64. Overall, within the Buzău watershed, the values of the circularity ratio are between 0.19 and 2.67.
Half of the sub-watersheds have values below 0.5, indicating an elongated shape and young sub-watersheds, where the fluvial modification is active. The remaining 19 sub-watersheds have values above 0.5. These higher Rc sub-watersheds are old, meaning that their drainage networks are largely stable, with the highest Rc being 2.67 for SW20. Being located in the Subcarpathian sector, the degree of fulfillment of the upper course of this sub-watershed is overachieved by 131%, which is a parameter that supports this result. The elongation ratio (Re) [71] is another measure of watershed shape: below 0.7 indicates watersheds with an elongated shape; above 0.9 indicate watersheds with a circular shape; and intermediate characterizes slightly elongated watersheds. Five sub-watersheds have shapes that tend to be circular. These watersheds are located in high regions, where steep slopes and short distances to drainages lines means they are characterized by short response times to floods; moreover, the circular shape means flood waves arrive synchronously at the point of confluence, resulting in higher flood peaks. In comparison, in more elongated sub-watersheds such as SW16, SE30, SW24, or SW36, flood waves propagate at several confluence points and the discharge strength decreases due to the longer transit length.
The form factor (Rf) is calculated by relating the watershed area to the square root of the watershed length; this parameter determines the shape of the watershed by falling between the values 0 and 1, where the watershed is considered circular if Rf has values close to 1 and elongated if Rf is close to 0 [43]. This parameter can be correlated with the eongation ratio, with the difference that only one sub-watershed—SW25—is included in the largest class, having the maximum value of 0.57, while the elongation ratio showed that six sub-watersheds are close to the circular shape, having values between 0.70 and 0.73.
The shape factor (Bs) is the ratio between the length of the catchment raised to the power of 2 and the area of the watershed, being inversely proportional to the shape factor. Thus, SW16 from the mountain sector, SW24 and SW30 from the Subcarpathian region, and SW36 from the plains area have high values, while the elongation ratio and the form factor placed these sub-watersheds in the small classes.
The compactness coefficient (Cc) is a parameter that expresses the capture elongation. Although the Buzău watershed has a value of 1.43, at the sub-watershed level, the values are between 0.61 in the case of SW20 and 2.27 in the case of SW31. It should be noted that the higher values indicate a higher susceptibility to risk factors, especially to erosion.
Basin relief (Bh) is a parameter calculated by subtracting the maximum elevation from the minimum elevation. The results show great heterogeneity within the Buzău watershed, the high relief influencing denudation, and the accentuated transport of sediments from the Subcarpathian region, with the highest values being recorded for SW16, SW24, and SW30.
The relief ratio (Rh) is a morphometric parameter calculated as a ratio of the total relief to the length of the watershed. The force of the erosion process is closely related to this parameter and measures the steepness of the watershed relief ratio (Rh) values recorded in the sub-watersheds of the Buzău range between 1.51 (SW37) and 210.50 (SW12). A trend of declining Rh values in a NW to SE direction, or from high to lower altitudes, is apparent across the full Buzău watershed, with the values lowest in the plains sector (between 1.51 and 9.59; Figure 7). SW1 has the highest Rh value, which reflects the combination of high relief and small surface area. In contrast, SW16, which has the highest actual relief, has an Rh of only 24.1 due to its large area. Thus, a larger area determines greater topographical variety, a fact that is also reflected in the way that water drains and accumulates in the watershed.
The ruggedness number (Rn) is a morphometric parameter expressed by multiplying Dd by Bh, with high values indicating the presence of mountainous terrain, and low values indicating lowlands. Although they have considerably different surfaces, the SW1 and SW16 values reflect the length and steepness of the slopes.
3.4. Prioritization of Intervention Measures in the Sub-Watersheds of the Buzau River Basin
The detailed analysis of the prioritization of the 39 hydrographic sub-watersheds considered two distinct weighting scenarios of the morphometric parameters. The first scenario included 11 parameters, while the second scenario extended the analysis to 18 parameters. Composite (Cp) values were calculated for each sub-watershed in both scenarios. Thus, the composite value for each morphometric parameter was determined through an ordering process; parameters related to the shape of the watershed, such as the circularity ratio, elongation ratio, form factor, and compactness coefficient, were arranged in ascending order. The remaining parameters were ordered in descending order. This approach is based on the understanding that the risk associated with a sub-watershed is increased when the values of parameters, such as drainage density, stream frequency, or bifurcation ratio (Figure 7), are high. Thus, these high values contribute to a lower value of Cp, indicative of higher vulnerability to erosion or other associated phenomena, and thus, the need for more urgent and appropriate interventions in hydrological or geomorphological risk management. The final prioritization divided the 39 sub-watersheds into 5 priority classes, from very high to very low, where the lower rank values indicated higher priority and greater vulnerability (Table 2).
Table 2.
Prioritization of intervention measures in sub-watersheds from Buzau River Basin.
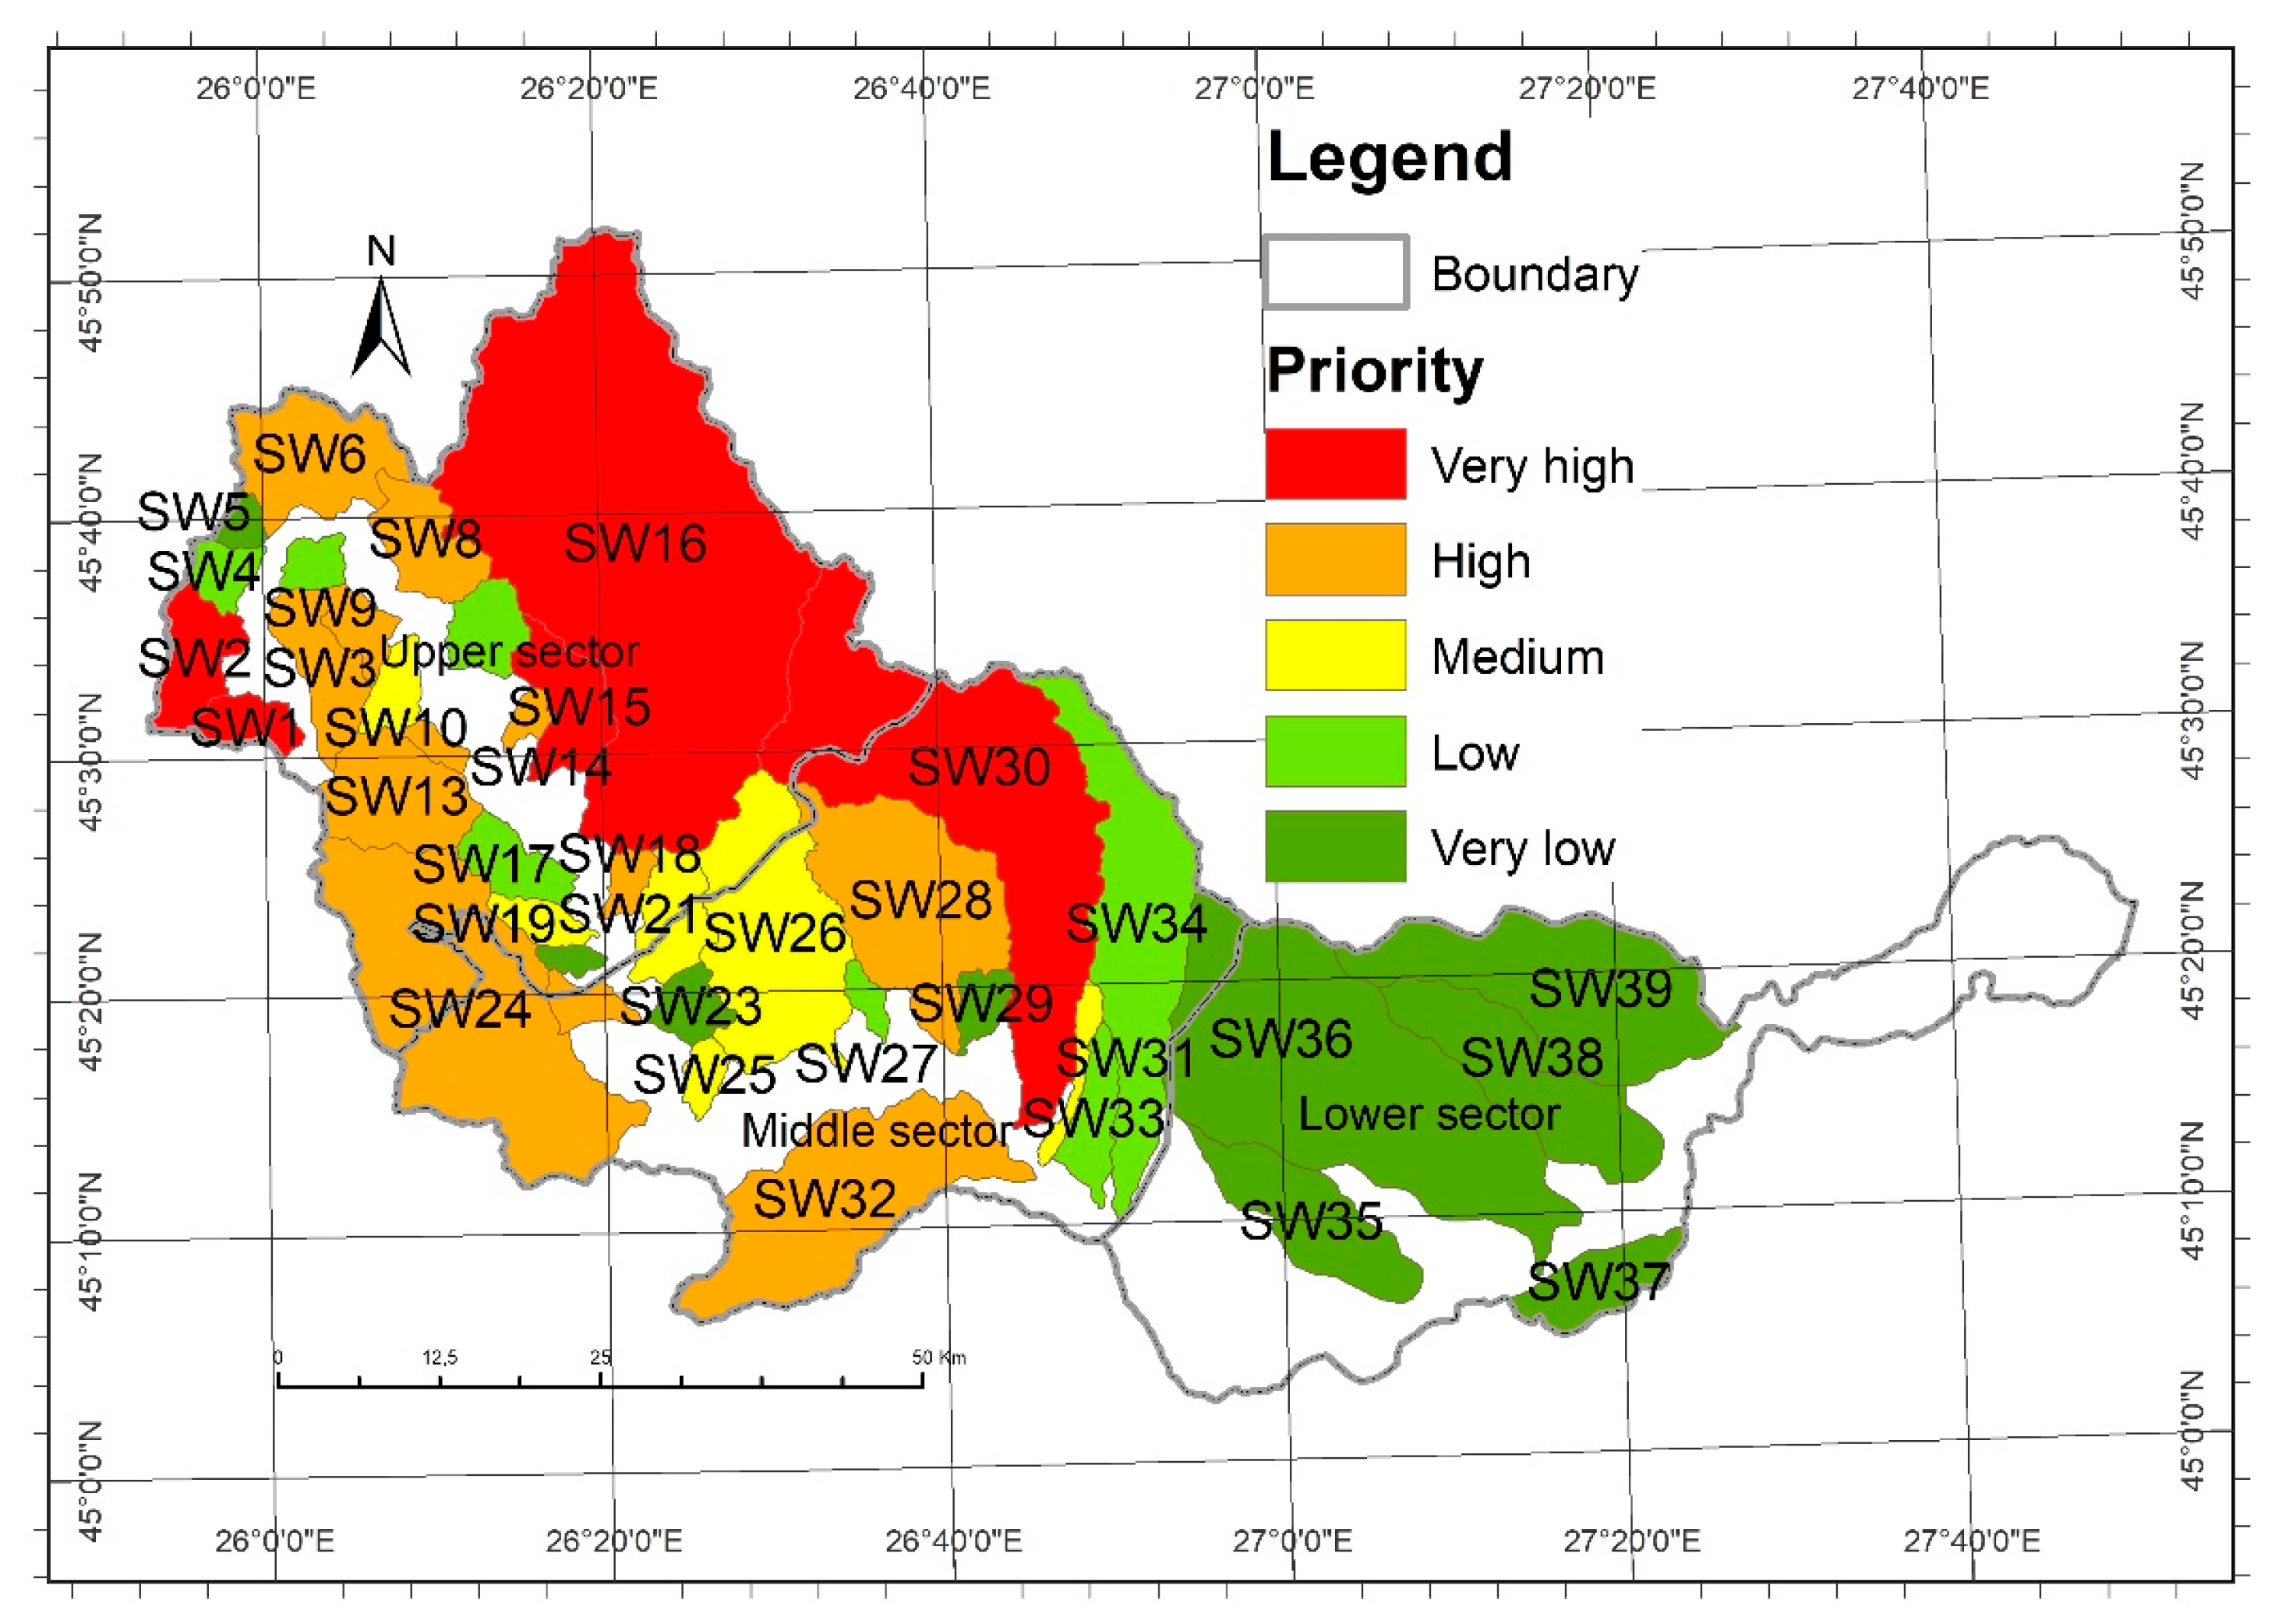
In our analysis, we found that 25 of the 39 sub-watersheds were assigned to the same priority class in both scenarios. However, 14 sub-watersheds were assigned to different priority classes, and this variation was mainly observed in the Carpathian and Subcarpathian regions, due to the heterogeneity of the terrain (see Figure 8 and Figure 9).
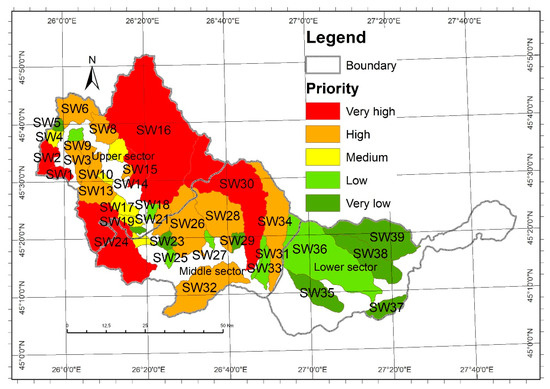
Figure 8.
Prioritization of sub-watersheds, Scenario 1.
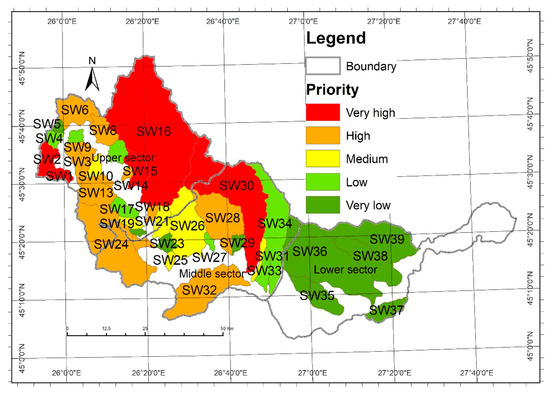
Figure 9.
Prioritization of sub-watersheds, Scenario 2.
The heterogeneity of the relief and the type of land use at the level of the three physical geographical units has a decisive impact on the Cp value and, hence, the priority class. As such, in the first (11-parameter) scenario, it was found that six sub-watersheds fell into the very high category, underlining the imperative need to adopt specific management measures regarding the regularization of the riverbed or hydrotechnical facilities to prevent the risk of slope degradation and the accentuation of the phenomenon of torrentiality. In the second (18-parameter) scenario, only five sub-watersheds were included in the very high category, with SW 24 shifting to the high category.
In the Carpathian region, among the sub-watersheds that shifted priority category, most moved to a lower priority under the second scenario, (SW4, SW10, SW11, SW17, and SW21), while only two (SW12 and SW18) shifted to a higher priority category under the second scenario (Table 2).
Of the 12 sub-watersheds in the Subcarpathian region, 6 maintained the same classification category under both scenarios. The remaining six sub-watersheds shifted to a new category. Of these, SW22, SW25, and SW31 shifted to a higher priority category, while SW23, SW26, and SW34 shifted to a lower priority category, with SW34 actually shifting two categories lower (Table 2).
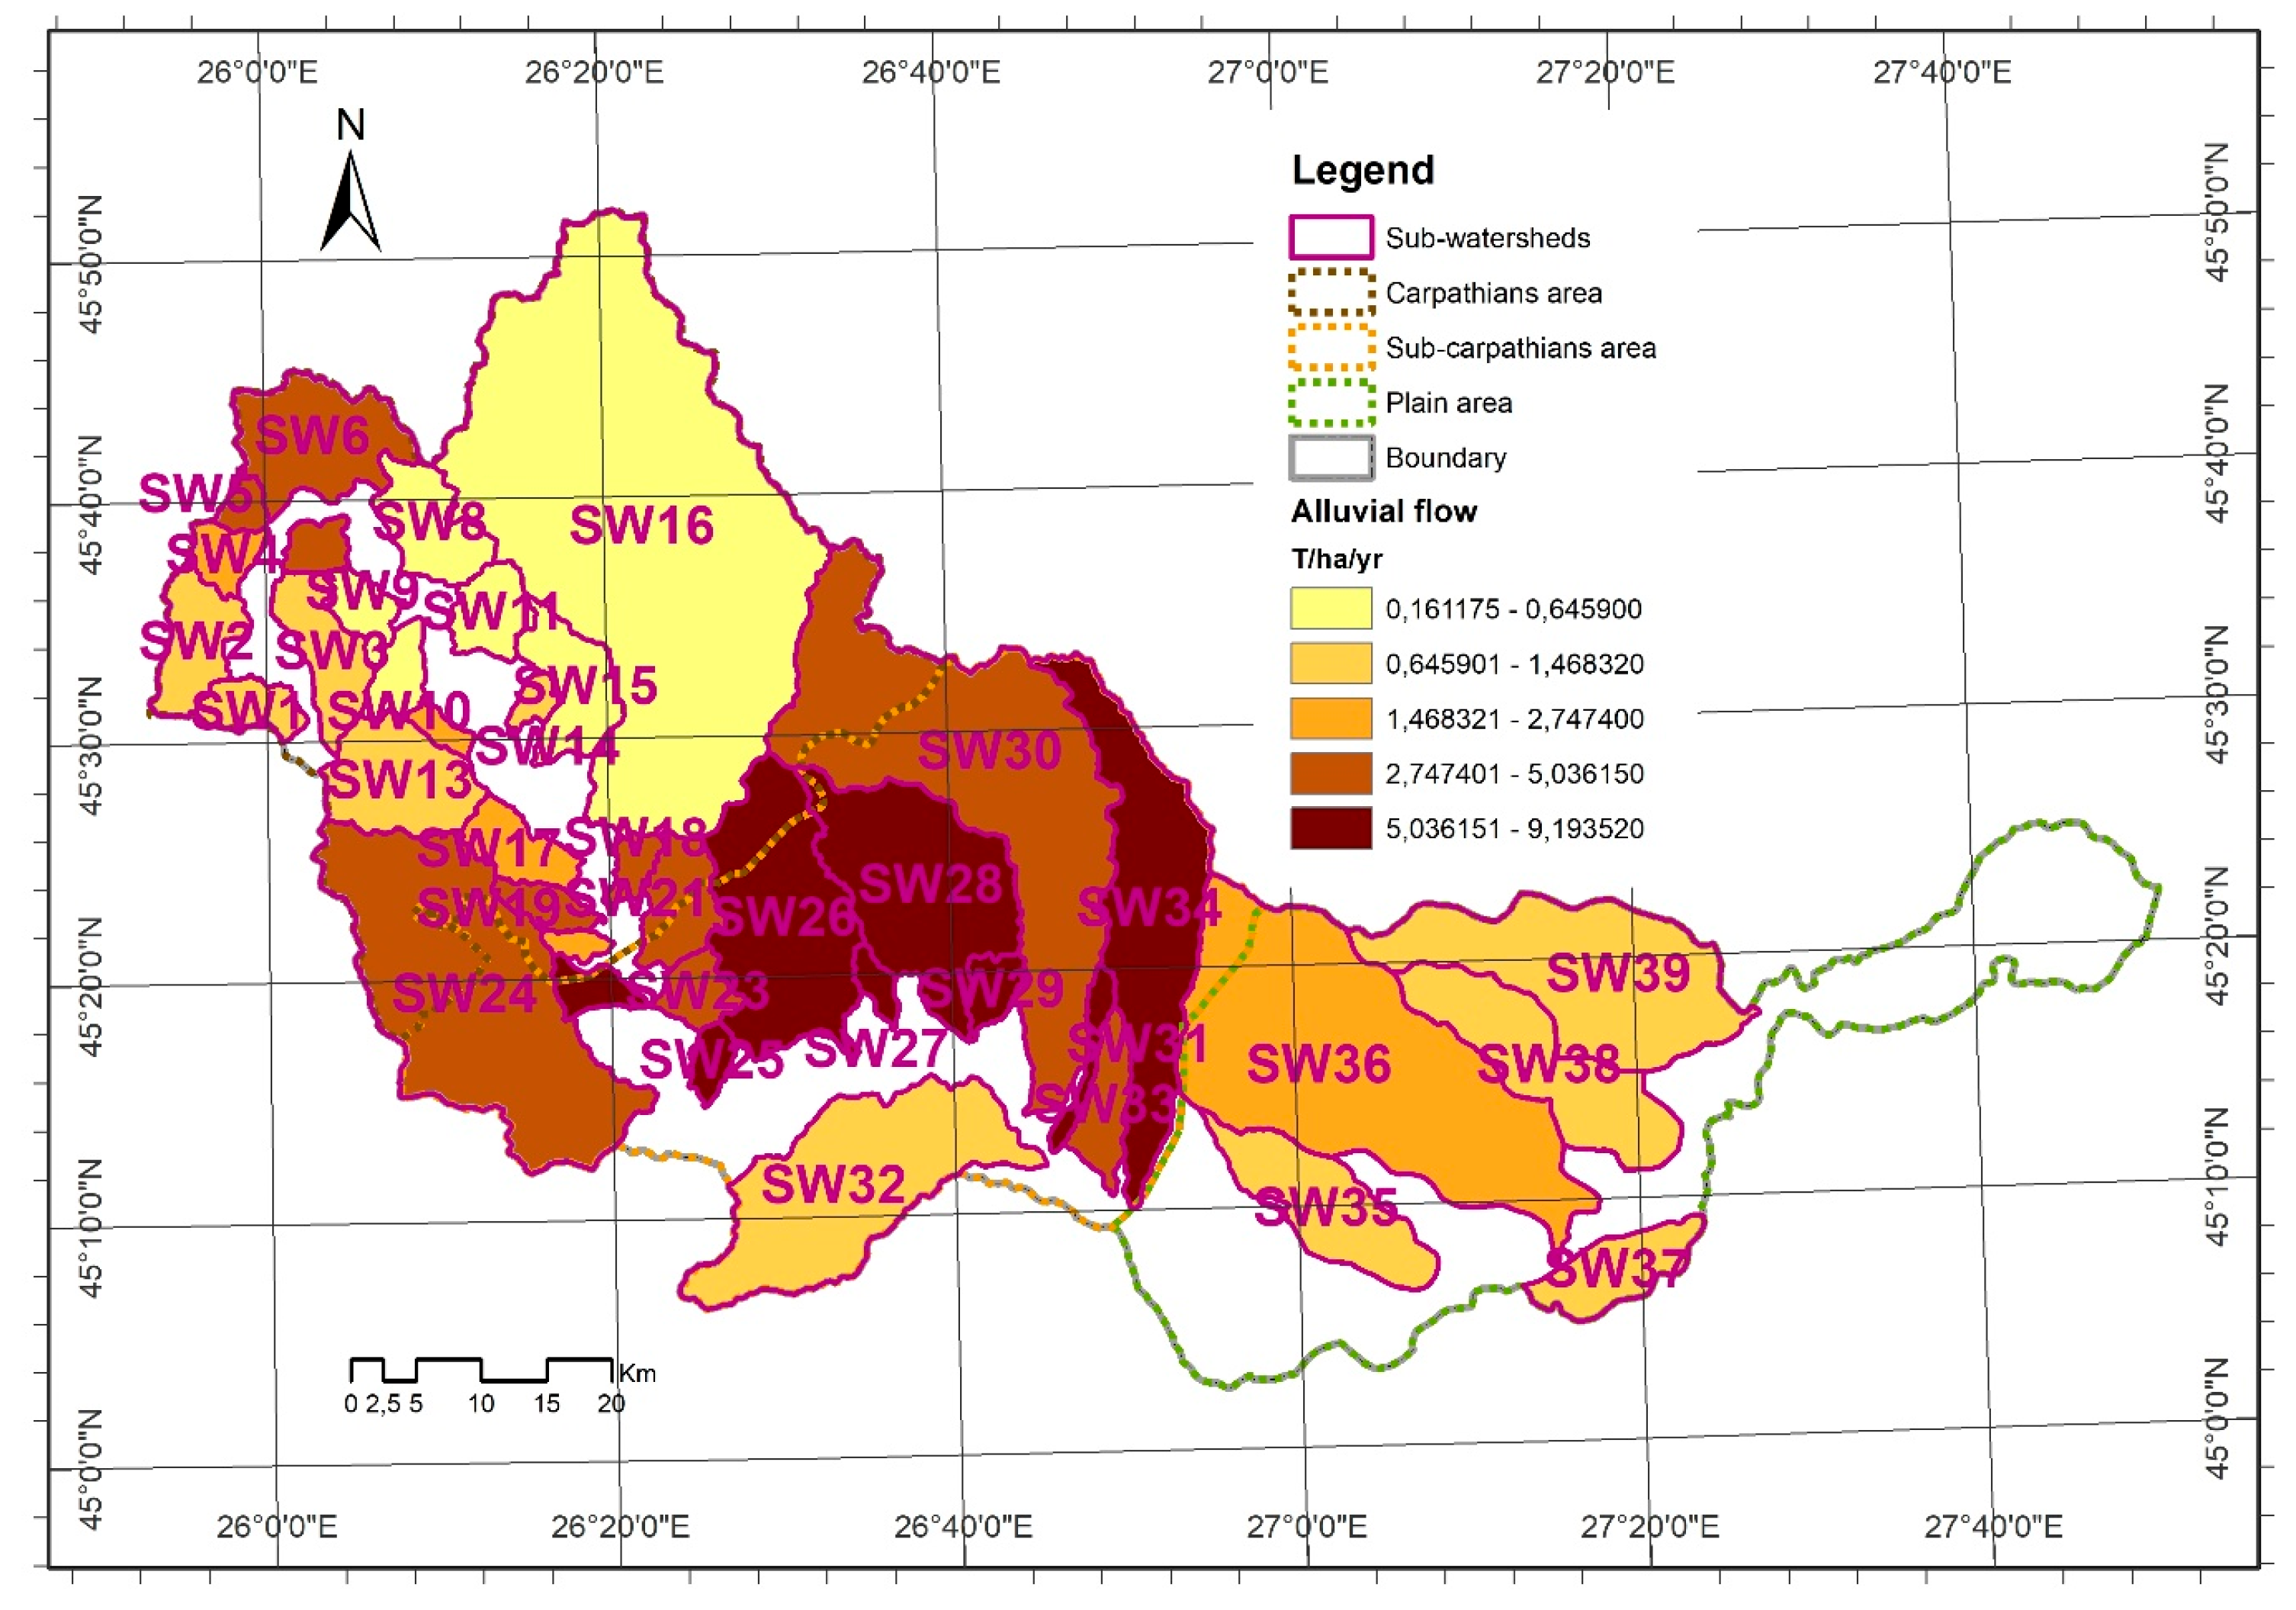
This differentiation between the scenarios can be attributed to the different influence of the morphometric parameters on the composite (Cp) values. An aspect that must be taken into consideration is that, as we add more parameters to the analysis, the eclipsing phenomenon can occur. Eclipsing occurs when parameters with a high rank can reduce the impact of several other parameters because the arithmetic mean is sensitive to extreme values, thus generating significant changes in the prioritization class (Figure 9 and Figure 10). The analysis of a large number of sub-watersheds (n = 39) showed the high degree of variability (CV) in the rank values on which the establishment of priority classes depends.

Figure 10.
Alluvial flow in Buzau River Basin and sub-watersheds (adaptation from Corine—Soil erosion by water 2016).
In general, both scenarios highlighted the fact that the vulnerability to natural hazards is lower in the plains region, where all five sub-watersheds were included in the low and very low priority classes. In the first scenario, SW36 fell into the low category, and in the second scenario, it fell into the very low category; thus, all sub-watersheds in the lowland region do not require immediate anthropogenic interventions, as the priority level is considered very low.
4. Discussion
Combining a variable number of morphometric parameters to characterize a watershed and its hydrographic network, using various mathematical models, allows the watershed to be evaluated with respect to the degree to which its state is in equilibrium or imbalance and, thus, if a watershed is vulnerable to natural processes.
This study found prioritization differences for sub-watersheds depending on the number of parameters used in the assessment. Of the 39 sub-watersheds analyzed, 14 sub-watersheds were classified into different categories depending on the number of parameters used.
The importance of each parameter is evident in the discrepancies in the results, and the correct identification of the interactions between these parameters becomes vital for an accurate assessment of the risks to which the sub-watersheds are exposed. This aspect highlights the complexity of the morphometric analysis process and the need for a balanced approach in the selection and weighting of parameters for the most reliable evaluation of priorities in the management of risks and vulnerabilities.
The increase or decrease in the coefficient of variation of the ranks given to the various parameters determines, in the case of 14 sub-watersheds, their inclusion in a higher or lower class. Although most studies [35,48,49,51] use the arithmetic mean in composing the prioritization value and a variable number of parameters, we consider that it is prudent to use a method for selecting an optimal number of parameters, for example, PCA [5,52], an fuzzy analytical hierarchical process [53,54], a multi-criteria analytical hierarchical process [55], or the calculation of weights based on pairwise comparisons [50]. Otherwise, there is a risk of “eclipsing” extreme values.
Special attention must also be paid to the delimitation of the sub-watersheds, so that they constitute correctly defined drainage units, following the morphology of the relief. Otherwise, the derived parameter values for sub-watersheds will not accurately reflect the catchment processes arising from the exchange of matter and energy in those open systems that the values are supposed to represent.
Given the discontinuity of the relief in the study area, especially in the Subcarpathian area, in which slopes with high inclinations, depressions, diverse lithological substrata, and different land uses are interspersed, the sub-watersheds in this area tend to self-destruct by increasing the number of river segments of lower order and their excessive branching.
Under these conditions, in the Subcarpathian area, where a lithological substrate of marls or clays interspersed with sands, gravels, or sandstones predominates, land degradation processes are very active. These processes result in numerous gullies, ravines, and landslides that lead to very high transport of alluvium in the main riverbeds (Figure 10).
Overall, the prioritization of sub-watersheds using the morphometric parameters of the watershed and the hydrographic network is similar in the Subcarpathian and Carpathian mountain areas, with most sub-watersheds in both areas included in the very high and high priority categories. In these circumstances, in the future, it will be necessary to find new ways to select and quantify the importance of each parameter introduced in the prioritization calculation, and to identify areas vulnerable to land degradation and the variables related to the rainfall regime, lithology, vegetation, and land use to increase the accuracy of forecasts. Moreover, previous studies have shown that the morphometric parameters used in various morphometric models tend to be related to each other and less to the watershed [72], although there have been situations where there were correlations with geological conditions [17,47] or elevation [73], but without always being related to the maximum discharge [74]. Thus, geological conditions influence network architecture, and the system tends to work towards the formation of a dendritic network irrespective of the underlying geology [75]. Also, there is a tendency for erosion processes to form an arborescent network that does not always correlate very well with local factors [76].
5. Conclusions
The quantitative evaluation of the morphometric characteristics from the Buzău River Basin allowed the prioritization of intervention measures at the level of 39 hydrographic sub-watersheds, with a total area of 4112 km2.
The prioritization was conducted using two comparative scenarios; in the first scenario, 11 derived morphometric parameters were used, and in the second scenario, 7 more morphometric parameters were added. Of the 39 sub-watersheds, 25 are in the same priority class in both analyzed scenarios, and 14 are classified in different categories. From the category of sub-watersheds that were classified differently, seven are in the Carpathian area (SW4, SW10, SW11, SW12, SW17, SW18, SW21), six in the Subcarpathian area (SW22, SW24, SW25, SW26, SW31 and SW34) and only one sub-watershed is in the plains area (SW36). The addition of the parameters in the second scenario led to a decrease in the prioritization class in nine sub-watersheds (five in the Carpathian sector, three in the Subcarpathian sector, and two in the plains sector) and an increase in prioritization class in five sub-watersheds (two in the Carpathian sector and three in the Subcarpathian sector).
Of the 39 sub-watersheds, 5 are classified as very high-priority sub-watersheds, and of these, four are located in the Carpathian region (SW1, SW2, SW5, SW6), and one (SW30) in the Subcarpathian region. All five sub-watersheds in the plains region are classified as very low priority in the second scenario, with SW36 being the only sub-watershed classed as low priority in the first scenario.
The calculation of different prioritization classes for the same sub-watersheds, dependent on the number of parameters used, likely illustrates the phenomenon of the eclipsing of extreme values. Thus, although the Subcarpathian region presents the highest degree of erosion and sediment transport at the level of the Buzău River Basin, some sub-watersheds in this area are included in the medium intervention class. This fact highlights the need to re-evaluate the intervention measures by establishing an optimal number of morphometric parameters that will be taken into account to establish the priority for intervention and improve the methods to establish the “relative weight/ranks” in the final classification.
The current study represents a useful tool for the research of sub-watersheds located in heterogeneous geographical units. This approach can be used successfully by local authorities and environmental agencies that manage land utilization and the conservation of soil and water resources.
Supplementary Materials
The following supporting information can be downloaded at: https://www.mdpi.com/article/10.3390/su16177567/s1, Table S1: Morphometry of the watershed and the hydrographic network; Tabel S2: Derived properties of the watershed and hydrographic network.
Author Contributions
All authors have equal contribution to the preparation of this scientific paper. All authors have read and agreed to the published version of the manuscript.
Funding
This research received no external funding.
Data Availability Statement
The original contributions presented in the study are included in the article/supplementary material, further inquiries can be directed to the corresponding author/s.
Acknowledgments
The authors want to thank the editor and the four anonymous reviewers whose comments have contributed to the improvement of the original manuscript, and Michael Reid from the University of New England (Australia) for the English language proofing and useful suggestions.
Conflicts of Interest
The authors declare no conflicts of interest.
References
- Ha, M.C.; Vu, P.L.; Nguyen, H.D.; Hoang, T.P.; Dang, D.D.; Dinh, T.B.H.; Şerban, G.; Rus, I.; Brețcan, P. Machine Learning and Remote Sensing Application for Extreme Climate Evaluation: Example of Flood Susceptibility in the Hue Province, Central Vietnam Region. Water 2022, 14, 1617. [Google Scholar] [CrossRef]
- Sabӑu, D.A.; Şerban, G.; Breţcan, P.; Dunea, D.; Petrea, D.; Rus, I.; Tanislav, D. Combining radar quantitative precipitation estimates (QPEs) with distributed hydrological model for controlling transit of flash-flood upstream of crowded human habitats in Romania. Nat. Hazards 2023, 116, 1209–1238. [Google Scholar] [CrossRef]
- Şerban, G.; Rus, I.; Vele, D.; Breţcan, P.; Alexe, M.; Petrea, D. Flood-prone area delimitation using UAV technology, in the areas hard-to-reach for classic aircrafts: Case study in the north-east of Apuseni Mountains, Transylvania. Nat. Hazards 2016, 82, 1817–1832. [Google Scholar] [CrossRef]
- Şerban, G.; Sabӑu, D.; Bătinaș, R.; Brețcan, P.; Ignat, E.; Nacu, S. Water Resources from Romanian Upper Tisa Basin. In Water Resources Management in Romania; Springer International Publishing: Cham, Switzerland, 2020; pp. 393–434, Print ISBN 978-3-030-22319-9 Online ISBN978-3-030-22320-5. [Google Scholar] [CrossRef]
- Pathare, J.A.; Pathare, A.R. Watershed prioritization for soil and water conservation in Darna River basin: A PCA approach. Sustain. Water Resour. Manag. 2021, 7, 49. [Google Scholar] [CrossRef]
- Khan, M.Y.A.; ElKashouty, M. Watershed prioritization and hydro-morphometric analysis for the potential development of Tabuk Basin, Saudi Arabia using multivariate statistical analysis and coupled RS-GIS approach. Ecol. Indic. 2023, 154, 110766. [Google Scholar] [CrossRef]
- Gâștescu, P.; Murărescu, O.; Brețcan, P.; Dinu, I. Hidrologie Generală-Lucrări Practice; Transversal: Târgoviște, Romania, 2006. [Google Scholar]
- Syed, N.H.; Rehman, A.A.; Hussain, D.; Ishaq, S.; Khan, A.A. Morphometric analysis to prioritize sub-watershed for flood risk assessment in Central Karakoram National Park using GIS/RS approach. In ISPRS Annals of the Photogrammetry, Remote Sensing and Spatial Information Sciences; Copernicus GmbH: Göttingen, Germany, 2017; Volume 4, pp. 367–371. [Google Scholar] [CrossRef]
- Cîmpianu, C.I.; Mihu-Pintilie, A.; Stoleriu, C.C.; Urzică, A.; Huţanu, E. Managing Flood Hazard in a Complex Cross-Border Region Using Sentinel-1 SAR and Sentinel-2 Optical Data: A Case Study from Prut River Basin (NE Romania). Remote Sens. 2021, 13, 4934. [Google Scholar] [CrossRef]
- Nguyen, H.D.; Nguyen, T.H.T.; Nguyen, Q.H.; Nguyen, T.G.; Dang, S.K.; Nguyen, N.; Bui, T.H.; Nguyen, N.D.; Bui, Q.-T.; Bretcan, P.; et al. Bottom-up approach for flood-risk management in developing countries: A case study in the Gianh River watershed of Vietnam. Nat. Hazards 2023, 118, 1933–1959. [Google Scholar] [CrossRef]
- Vespremeanu-Stroe, A.; Micu, M.; Cruceru, N. The 3D analysis of Valea Viei mudflow morphodynamic, Buzău Subcarpathians. Rev. Geomorfol. 2006, 8, 95–108. [Google Scholar]
- Moisa, M.B.; Dejene, I.N.; Merga, B.B.; Gemeda, D.O. Soil loss estimation and prioritization using geographic information systems and the RUSLE model: A case study of the Anger River sub-basin, Western Ethiopia. J. Water Clim. Change 2022, 13, 1170–1184. [Google Scholar] [CrossRef]
- Benzougagh, B.; Meshram, S.G.; Dridri, A.; Boudad, L.; Baamar, B.; Sadkaoui, D.; Khedher, K.M. Identification of critical watershed at risk of soil erosion using morphometric and geographic information system analysis. Appl. Water Sci. 2022, 12, 8. [Google Scholar] [CrossRef]
- Sharma, N.; Kaushal, A.; Yousuf, A.; Kaur, S.; Sharda, R.; Singh, S.P.; Gupta, O.P.; Sood, A. Prioritization of erosion susceptible watersheds using morphometric analysis and PCA approach: A case study of lower Sutlej River basin of Indian Punjab. Watershed Ecol. Environ. 2023, 5, 209–224. [Google Scholar] [CrossRef]
- Ojha, S.; Puri, L.; Bist, S.P.; Bastola, A.P.; Acharya, B. Watershed prioritization of Kailali district through morphometric parameters and landuse/landcover datasets using GIS. Heliyon 2023, 9, e16489. [Google Scholar] [CrossRef] [PubMed]
- Zaharia, L. Tendances dans l’évolution des transferts de matières en suspension, dans l’arc des Subcarpates, en relation avec les modifications du milieu. Géomorphol. Relief Process. Environ. 1998, 4, 3–15. [Google Scholar] [CrossRef]
- Zăvoianu, I. Morfometria Bazinelor Hidrografice; Academiei: Bucharest, Romania, 1978. [Google Scholar]
- Bretcan, P.; Tanislav, D.; Radulescu, C.; Serban, G.; Danielescu, S.; Reid, M.; Dunea, D. Evaluation of Shallow Groundwater Quality at Regional Scales Using Adaptive Water Quality Indices. Int. J. Environ. Res. Public Health 2022, 19, 10637. [Google Scholar] [CrossRef] [PubMed]
- Rus, I.; Șerban, G.; Brețcan, P.; Dunea, D.; Sabău, D. Identification of Vegetation Surfaces and Volumes by Height Levels in Reservoir Deltas Using UAS Techniques—Case Study at Gilău Reservoir, Transylvania, Romania. Sustainability 2024, 16, 648. [Google Scholar] [CrossRef]
- Dunea, D.; Bretcan, P.; Tanislav, D.; Serban, G.; Teodorescu, R.; Iordache, S.; Petrescu, N.; Tuchiu, E. Evaluation of Water Quality in Ialomita River Basin in Relationship with Land Cover Patterns. Water 2020, 12, 735. [Google Scholar] [CrossRef]
- Dunea, D.; Bretcan, P.; Purcoi, L.; Tanislav, D.; Serban, G.; Neagoe, A.; Iordache, V.; Iordache, Ș. Effects of riparian vegetation on evapotranspiration processes and water quality of small plain streams. Ecohydrol. Hydrobiol. 2021, 21, 629–640. [Google Scholar] [CrossRef]
- Zăvoianu, I. Morphometrical model of average mean channel slope in the Buzău Subcarpathians. Rev. Roum. Geol. Geophys. Geogr. Série Geogr. 1988, 32, 37–42. [Google Scholar]
- Bretcan, P.; Dunea, D.; Vintescu, G.; Tanislav, D.; Zelenakova, M.; Predescu, L.; Șerban, G.; Borowiak, D.; Rus, I.; Sabău, D.A.; et al. Automated versus Manual Mapping of Gravel Pit Lakes from South-Eastern Romania for Detailed Morphometry and Vegetation. Water 2022, 14, 1858. [Google Scholar] [CrossRef]
- Horton, R.E. Erosional development of streams and their drainage basin; hydrophysical approach to quantitative morphology. Geol. Soc. Am. Bull. 1945, 56, 151–180. [Google Scholar] [CrossRef]
- Smith, K.G. Standards for grading texture of erosional topography. Am. J. Sci. 1950, 248, 655–668. [Google Scholar] [CrossRef]
- Miller, V.C. A Quantitative Geomorphic Study of Drainage Basin Characteristics in the Clinch Mountain Area, Virginia and Tennessee; Technical Report (Columbia University. Department of Geology): New York, NY, USA, 1953. [Google Scholar]
- Melton, M.A. An Analysis of the Relations among Elements of Climate, Surface Properties, and Geomorphology; Columbia University: New York, NY, USA, 1957. [Google Scholar]
- Thomas, P.G.; Doherty, P.C. The analytic hierarchy. In Process: Planning, Priority Setting, Resource Allocation; McGraw-Hill: New York, NY, USA; Citeseer: Princeton, NJ, USA, 1980. [Google Scholar]
- Ichim, I. Cateva Observatii Asupra Raportului de Confluenta; Bull Publishing: Suceava, Romania, 1984. [Google Scholar]
- Enea, A.; Stoleriu, C.C.; Iosub, M.; Niacsu, L. A GIS Automated Tool for Morphometric Flood Analysis Based on the Horton–Strahler River Classification System. Water 2024, 16, 536. [Google Scholar] [CrossRef]
- Schumm, S.A. Evolution of drainage systems and slopes in badlands at Perth Amboy, New Jersey. Geol. Soc. Am. Bull. 1956, 67, 597–646. [Google Scholar] [CrossRef]
- Chendes, V.; Balteanu, D.; Sima, M. Flood Events in the Curvature Subcarpathians (Romania); Romanian Academy Institute of Geography: Bucharest, Romania, 2008. [Google Scholar]
- Armaş, I. Bazinul Hidrografic Doftana: Studiu de Geomorfologie; Editura Enciclopedică: Bucharest, Romania, 1999. [Google Scholar]
- Constantin, M.; Bednarik, M.; Jurchescu, M.C.; Vlaicu, M. Landslide susceptibility assessment using the bivariate statistical analysis and the index of entropy in the Sibiciu Basin (Romania). Environ. Earth Sci. 2011, 63, 397–406. [Google Scholar] [CrossRef]
- Odiji, C.A.; Aderoju, O.M.; Eta, J.B.; Shehu, I.; Mai-Bukar, A.; Onuoha, H. Morphometric analysis and prioritization of upper Benue River watershed. North. Niger. Appl. Water Sci. 2021, 11, 41. [Google Scholar] [CrossRef]
- Diaconu, D.C.; Andronache, I.; Pintilii, R.I.; Breţcan, P.; Simion, A.G.; Drăghici, C.C.; Gruia, K.A.; Grecu, A.; Marin, M.; Peptenatu, D. Using fractal fragmentation index (FFI) in analysis of the deforestation process in Bucegi Mountains Group, Romania. Carpathian J. Earth Environ. Sci. 2019, 14, 431–438. [Google Scholar] [CrossRef]
- Dunea, D.; Șerban, G.; Brețcan, P. Hydroinformatic Tools and Spatial Analyses for Water Resources and Extreme Water Events. Water 2023, 15, 463. [Google Scholar] [CrossRef]
- Minea, G. Assessment of the flash flood potential of Basca river catchment (Romania) based on physiographic factors. Open Geosci. 2013, 5, 344–353. [Google Scholar] [CrossRef]
- Ovreiu, A.B.; Barsoianu, L.A.; Nedelea, A.; Comanescu, L.; Nistor, C. Implementation of a new model on soil erosion. Case study-Văratica hydrographic basin (Cozia Mountains, Romania). Z. Für Geomorphol. 2018, 62, 41–56. [Google Scholar] [CrossRef]
- Aouragh, M.H.; Essahlaoui, A. A TOPSIS approach-based morphometric analysis for sub-watersheds prioritization of high Oum Er-Rbia basin, Morocco. Spat. Inf. Res. 2018, 26, 187–202. [Google Scholar] [CrossRef]
- Malik, A.; Kumar, A.; Kandpal, H. Morphometric analysis and prioritization of sub-watersheds in a hilly watershed using weighted sum approach. Arab. J. Geosci. 2019, 12, 118. [Google Scholar] [CrossRef]
- Godif, G.; Manjunatha, B.R. Prioritizing sub-watersheds for soil and water conservation via morphometric analysis and the weighted sum approach: A case study of the Geba river basin in Tigray, Ethiopia. Heliyon 2022, 8, e12261. [Google Scholar] [CrossRef] [PubMed]
- Horton, R.E. Drainage basin characteristics transactions. Am. Geophys. Union 1932, 13, 350–361. [Google Scholar] [CrossRef]
- Strahler, A.N. Quantitative analysis of watershed geomorphology. Eos Trans. Am. Geophys. Union 1957, 38, 913–920. [Google Scholar] [CrossRef]
- Strahler, A. Geografia Fizică; Editura Științifică: Bucharest, Romania, 1973. [Google Scholar]
- Chendeș, V. Resursele de Apă Din Subcarpații de la Curbură. Evaluări Geospațiale; Editura Academiei Române: Bucharest, Romania, 2011. [Google Scholar]
- Bogale, A. Morphometric analysis of a drainage basin using geographical information system in Gilgel Abay watershed, Lake Tana Basin, upper Blue Nile Basin, Ethiopia. Appl. Water Sci. 2021, 11, 122. [Google Scholar] [CrossRef]
- Sankriti, R.; Subbarayan, S.; Aluru, M.; Devanantham, A.; Reddy, N.; Ayyakkannu, S. Morphometric analysis and prioritization of sub-watersheds of Himayatsagar catchment, Ranga Reddy District, Telangana, India using remote sensing and GIS techniques. Int. J. Syst. Assur. Eng. Manag. 2021, 12, 1–13. [Google Scholar] [CrossRef]
- Tukura, N.G.; Akalu, M.M.; Hussein, M.; Befekadu, A. Morphometric analysis and sub-watershed prioritization of Welmal watershed, Ganale-Dawa River Basin, Ethiopia: Implications for sediment erosion. J. Sediment. Environ. 2021, 6, 121–130. [Google Scholar] [CrossRef]
- Sarkar, P.; Kumar, P.; Vishwakarma, D.K.; Ashok, A.; Elbeltagi, A.; Gupta, S.; Kuriqi, A. Watershed prioritization using morphometric analysis by MCDM approaches. Ecol. Inform. 2022, 70, 101763. [Google Scholar] [CrossRef]
- Mundetia, N.; Sharma, D.; Dubey, S.K. Morphometric assessment and sub-watershed prioritization of Khari River basin in semi-arid region of Rajasthan, India. Arab. J. Geosci. 2018, 11, 503. [Google Scholar] [CrossRef]
- Chaudhary, S.; Pandey, A.C. PCA driven watershed prioritization based on runoff modeling and drought severity assessment in parts of Koel river basin, Jharkhand (India). Water Supply 2022, 22, 2034–2054. [Google Scholar] [CrossRef]
- Ahmed, R.; Sajjad, H.; Husain, I. Morphometric parameters-based prioritization of sub-watersheds using fuzzy analytical hierarchy process: A case study of lower Barpani Watershed, India. Nat. Resour. Res. 2018, 27, 67–75. [Google Scholar] [CrossRef]
- Ghosh, M.; Gope, D. Hydro-morphometric characterization and prioritization of sub-watersheds for land and water resource management using fuzzy analytical hierarchical process (FAHP): A case study of upper Rihand watershed of Chhattisgarh State, India. Appl. Water Sci. 2021, 11, 17. [Google Scholar] [CrossRef]
- Shelar, R.S.; Shinde, S.P.; Pande, C.B.; Moharir, K.N.; Orimoloye, I.R.; Mishra, A.P.; Varade, A.M. Sub-watershed prioritization of Koyna river basin in India using multi criteria analytical hierarchical process, remote sensing and GIS techniques. Phys. Chem. Earth Parts A/B/C 2022, 128, 103219. [Google Scholar] [CrossRef]
- Meshram, S.G.; Sepheri, M.; Meshram, C.; Moatamed, A.; Benzougagh, B.; Parvizi, S.; Bazrafshan, E.; Rahimi, Y. Prioritization of watersheds based on a picture fuzzy analytic hierarchy process and linear assignment model. Stoch. Environ. Res. Risk Assess. 2023, 37, 735–748. [Google Scholar] [CrossRef]
- Grecu, F. Bazinul Hârtibaciu. Elemente de Morfohidrografie; Ed Academiei: Bucharest, Romania, 1992. [Google Scholar]
- Grecu, F.; Zăvoianu, I. Bazinul morfohidrografic. Rev. Geomorfol. 1997, 1, 99–106. [Google Scholar]
- Zăvoianu, I.; Herișanu, G.; Marin, C.; Cruceru, N.; Parichi, M.; Vartolomei, F. Relații Cantitative Între Producția de Aluviuni în Suspensie și Factorii de Mediu; Editura Transversal: Bucharest, Romania, 2011. [Google Scholar]
- Zaharia, L.; Costache, R.; Prăvălie, R.; Minea, G. Assessment and mapping of flood potential in the Slănic catchment in Romania. J. Earth Syst. Sci. 2015, 124, 1311–1324. [Google Scholar] [CrossRef]
- Popa, M.C.; Peptenatu, D.; Drăghici, C.C.; Diaconu, D.C. Flood hazard mapping using the flood and flash-flood potential index in the Buzău River catchment, Romania. Water 2019, 11, 2116. [Google Scholar] [CrossRef]
- Prăvălie, R.; Costache, R. The vulnerability of the territorial-administrative units to the hydrological phenomena of risk (flash-floods). Case study: The subcarpathian sector of Buzău catchment. Analele Univ. Oradea—Ser. Geogr. 2013, 23, 91–98. [Google Scholar]
- Constantin, M.; Rotaru, A.; Nishimoto, H.; Yamakoshi, T. Geomorphological hazards in Romania. Some examples from the area situated at the contact between Buzău Carpathians and Buzău Subcarpathians. J. Jpn. Soc. Erosion. Control Eng. 2005, 58, 59–62. (In Japanese) [Google Scholar]
- Armaş, I.; Nistoran, D.E.G.; Osaci-Costache, G.; Braşoveanu, L. Morpho-dynamic evolution patterns of subCarpathian Prahova River (Romania). Catena 2013, 100, 83–99. [Google Scholar] [CrossRef]
- Grecu, F.; Comănescu, L. The morphometric analysis of the gravels from the Slănic of Buzău bed–preliminary considerations. Rev. Geomorfol. 2006, 8, 45–52. [Google Scholar]
- Iancu, M.; Ielenicz, M. Depresiunea și Munții Întorsura Buzăului [Depression and Întorsura Buzăului Mountains]; Alua: Gheorghe, Romania, 1972; pp. 233–240. [Google Scholar]
- Frunzescu, D.; Brănoiu, G. Monografia Geologică a Bazinlui Râului Buzău; Editura Universității din București: Bucharest, Romania, 2004. [Google Scholar]
- Longley, P.A.; Goodchild, M.F.; Maguire, D.J.; Rhind, D.W. Geographic Information Science and Systems; John Wiley & Sons: Hoboken, NJ, USA, 2015. [Google Scholar]
- Faniran, A. The index of drainage intensity—a provisional new drainage factor. Aust. J. Sci. 1968, 31, 328–330. [Google Scholar]
- Gâştescu, P.; Breţcan, P. Hidrologie Continentală şi Oceanografie; Edit Transversal: Bucharest, Romania, 2009. [Google Scholar]
- Strahler, A.N. Quantitative geomorphology of drainage basins and channel networks. In Hand Book of Applied Hydrology; Te Chow, V., Ed.; McGraw Hill Book Company: New York, NY, USA, 1964. [Google Scholar]
- Smart, J.S. The analysis of drainage network composition. Earth Surf. Process. 1978, 3, 129–170. [Google Scholar] [CrossRef]
- Abrahams, A.D. Factor analysis of drainage basin properties: Evidence for stream abstraction accompanying the degradation of relief. Water Resour. Res. 1972, 8, 624–633. [Google Scholar] [CrossRef]
- Morisawa, M.E. Quantitative geomorphology of some watersheds in the Appalachian Plateau. Geol. Soc. Am. Bull. 1962, 73, 1025–1046. [Google Scholar] [CrossRef]
- Ichim, I.; Batuca, D.; Radoane, M.; Duma, D. Morfologia si Dinamica Albiilor de Rauri; Edit Tehnica: Bucharest, Romania, 1989. [Google Scholar]
- Shreve, R.L. Variation of mainstream length with basin area in river networks. Water Resour. Res. 1974, 10, 1167–1177. [Google Scholar] [CrossRef]


Disclaimer/Publisher’s Note: The statements, opinions and data contained in all publications are solely those of the individual author(s) and contributor(s) and not of MDPI and/or the editor(s). MDPI and/or the editor(s) disclaim responsibility for any injury to people or property resulting from any ideas, methods, instructions or products referred to in the content. |
© 2024 by the authors. Licensee MDPI, Basel, Switzerland. This article is an open access article distributed under the terms and conditions of the Creative Commons Attribution (CC BY) license (https://creativecommons.org/licenses/by/4.0/).