Article

An Enhanced Continuation Power Flow Method Using Hybrid Parameterization

1
School of Electrical Engineering, Korea University, Seoul 02841, Republic of Korea
2
Korea Electric Power Corporation Research Institute, Naju 58277, Republic of Korea
3
College of Electrical Engineering and Automation, Fuzhou University, Fuzhou 350116, China
*
Author to whom correspondence should be addressed.
Sustainability 2024, 16(17), 7595; https://doi.org/10.3390/su16177595
Submission received: 1 August 2024 / Revised: 26 August 2024 / Accepted: 30 August 2024 / Published: 2 September 2024
(This article belongs to the Special Issue Electrical Engineering and Sustainable Power Systems)

Abstract

:
The rapid integration of renewable energy sources and the increasing complexity of modern power systems urge the development of advanced methods for ensuring power system stability. This paper presents a novel continuation power flow (CPF) method that combines two well-known parameterization techniques: natural parameterization and arc-length parameterization. The proposed hybrid approach significantly improves computational efficiency, reducing processing time by 32.76% compared to conventional methods while maintaining high accuracy. The method enables faster and more reliable stability assessments by efficiently managing the complexities and uncertainties, particularly in grids with high penetration of renewable energy.

1. Introduction

Evaluating power system stability is a crucial interest in power system research [1] and static voltage stability is widely used for grid planning [2]. The increasing renewable energy sources and the emergence of new types of loads, such as electric vehicles, have significantly increased the complexity and uncertainty of modern power systems. To effectively account for the variability and unpredictability of the power system, various approaches have been introduced. These approaches mainly involve estimating or evaluating the power system across multiple scenarios using techniques such as Monte Carlo simulations, stochastic methods [3], or interval analysis [4].
Consequently, several efforts have been introduced focusing on developing novel static stability assessment methods [5] while enhancing the computational performance of traditional methods, which can also be applied for real-time applications. For example, ref. [6] proposes a voltage stability metric for a quick assessment to evaluate numerous contingency scenarios. Furthermore, data-driven methods may be incorporated in power system assessment [7], which are beneficial for evaluating multiple scenarios using parallel computation.
The P-V (power-voltage) curve illustrates how voltage changes as system load increases and is effective in assessing the stability of power grids under varying generation and load profiles or contingency scenarios. The P-V curve is calculated by solving power flow equations repetitively under gradually increasing net load at a constant power factor. However, the P-V curve reaches a maximum loading point when the voltage enters an unstable region known as the bifurcation point. At this point, the power flow is likely to diverge by the singularity of the Jacobian matrix, which leads to the development of the continuation power flow (CPF) technique [8,9]. The CPF introduces a load parameter ( λ ) representing the load increment in the power flow equations to overcome the singularity around the bifurcation point.
The CPF process consists of a predictor step, a corrector step, a parameterization algorithm, and a step size control algorithm [10,11,12]. The predictor step estimates the convergence point of the next step in the CPF and can apply linear methods, such as tangents or secants, or nonlinear predictors that employ quadratic or higher equations [13,14]. The corrector step involves performing power flow calculations (e.g., Newton–Raphson, Fast Decoupled Method) to find the actual solution point near the predicted point. The step size represents the distance from the last solution to the next predicted point. Larger step sizes increase speed but may reduce accuracy; hence, balancing computational speed and accuracy is the main task of step size control. Parameterization determines how CPF calculates subsequent steps, including the additional equation about the load parameter ( λ ) [15].
Recent studies on CPF have focused on improving the core algorithm by advancing the predictor and corrector steps, step size control, and parameterization techniques [16]. Some researchers have concentrated on adaptive step size control [17], particularly around the critical point where the P-V curve requires smaller step sizes. For example, a logistic function is employed in [18] to determine an adequate step size during the CPF process. Similarly, ref. [19] proposes a discrete step size selection method depending on the proposed distance value. Furthermore, ref. [20] proposes a damping factor that is updated at each continuation step, enabling power flow and CPF to solve ill-conditioned networks. This damping factor helps determine the step size applied to the CPF. On the other hand, improvements in parameterization have also been explored. In [21], the total system loss of the power system is applied as an additional parameter. Another study [22] proposes a local geometric parameterization to successfully solve the power flow equations when the conditions are near the bifurcation point and in the unstable area of the P-V curve. Additionally, ref. [23] compares several well-known parameterization methods and suggests a switching method that improves CPU time (the processing time).
Research has also been conducted to determine the optimal combination of existing methods. For instance, ref. [13] explores the best combination of the basic predictor, corrector, and parameterization methods. Combinations are experimented with through the division of solution spaces based on tangent values, and their efficiency is compared. Furthermore, there have been efforts to reduce the calculation time for voltage margins due to the increasing complexity of power grids, the need to assess more contingency cases and uncertainty scenarios, and to enable real-time applications. Several studies propose data-driven approaches to decrease the calculation time of multiple scenarios [24,25]. However, these approaches are limited in accuracy, as they imitate the solution obtained from CPF.
P-V analysis mainly focuses on the stability of the transmission system [26]. However, the rapid increase in distributed power generation has shifted attention toward the stability of distribution systems. Consequently, the CPF has also been implemented in distribution systems to enable three-phase analysis [27] and even for unbalanced three-phase analysis [28], addressing uncertainties associated with distributed generators (DGs) [29], and managing disconnection scenarios considering the grid codes [30]. Another approach [31] also addresses unbalanced three-phase distribution power systems while integrating DGs. Another aspect of CPF studies focuses on integrating other considerations to imitate the actual power system operation. The authors of [32] consider the switch of the logical bus states (PV bus and PQ bus) while solving the power flow to ensure feasible power flow solutions during CPF calculations. In [33], the dynamic behavior of the grid components, including the dynamics of renewable DGs, is discovered by integrating a modified Jacobian matrix within the conventional CPF. Improving the core algorithm of CPF could be difficult for these applications due to its complexity.
This paper proposes a novel combination of basic methods to reduce the computation time of the CPF method while preserving the best accuracy. These simple modifications are expected to be easily applied for power system analysis tools or other CPF applications. The development of faster algorithms for stability assessment enables the evaluation of the power system under various scenarios, addressing the grid uncertainty caused by the rapid integration of renewable energy and electrification. Therefore, this paper potentially improves stability monitoring and the stable operation of renewable-integrated power systems. The main contributions of this paper are as follows:
  • A simple modification to the basic parameterization method allows convenient adaptation to CPF applications.
  • The proposed method reduces the processing time by 32.76% from the well-known arc-length parameterization method while maintaining accuracy.
  • The paper proposes a quantitative evaluation method for the accuracy of load margin assessment, which has not previously existed for CPF studies.
  • The enhanced computational efficiency of the proposed method enables fast assessment of numerous scenarios to ensure power system stability under a complex and uncertain renewable-integrated grid.
This paper is organized as follows: Section 2 outlines the principles of the P-V curve and the structure of the CPF method. It also introduces combining different parameterization methods to maintain accuracy while enhancing computational speed. Section 3 presents an accuracy evaluation method and compares the accuracy and the computational time of the conventional method with the proposed parameterization. Finally, Section 4 concludes the article.

2. Proposed Method

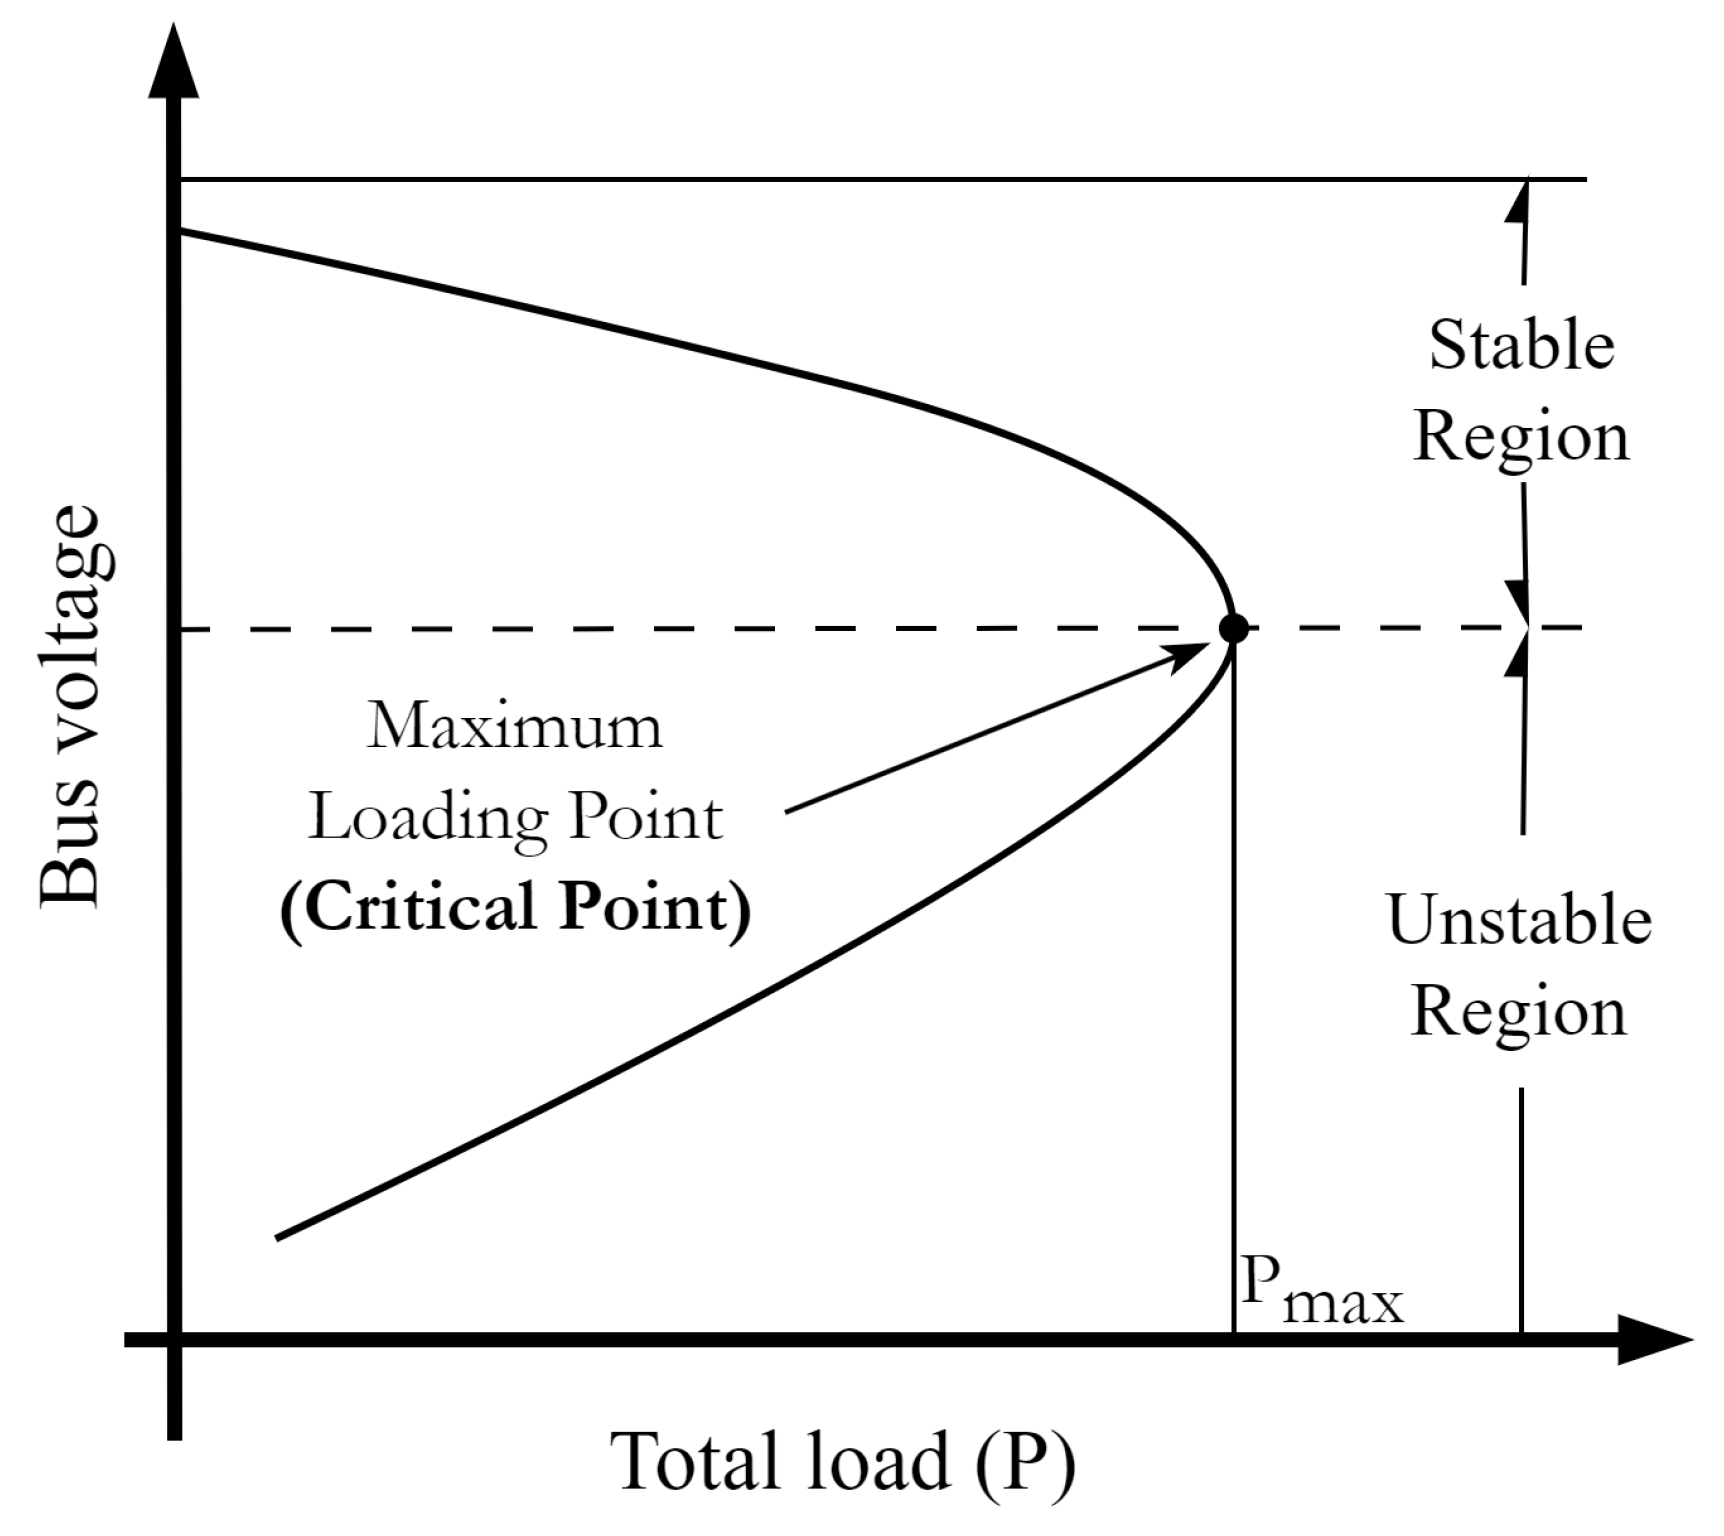
2.1. P-V Curve and Loadability Factor

The P-V curve is a graphical representation that illustrates the relationship between power and voltage concerning the active power injected into the load. Figure 1 shows the structure and elements of a typical P-V curve. At each total load, two operating points of the power system are observed. The operating point with higher voltage is located in the stable region, which represents the normal operating condition. On the other hand, the lower voltage solution lies in the unstable region and the operation condition indicates the system has a huge current flow. Assuming the load model as a constant power model, the load demand can increase up to P max , known as the maximum loading point or loadability limit, which separates the stable and unstable region.
CPF analysis is an iterative method used to determine the steady-state loadability limit on the P-V curve. A P-V analysis is conducted by solving the power flow equations while gradually increasing the loadability factor ( λ ), as represented below:
λ P G i 0 λ P L i 0 = j = 1 n V i V j y i j cos ( δ i δ j θ i j ) ,
λ Q L i 0 = j = 1 n V i V j y i j sin ( δ i δ j θ i j ) ,
where V i and δ i represent the voltage magnitude and the angle at bus i, respectively, and y i j and θ i j are the admittance magnitude and angle between bus i and j. P G i 0 is the active power generation of the grid and P L i 0 represents the system load at the base case.
However, as the system net load ( P L i 0 ) approaches the maximum loading point (critical point), the solution of the power flow equations is likely to diverge due to the singularity of the Jacobian matrix. To overcome this singularity, CPF analysis introduces an additional equation to the power flow equations, enabling the continuation of the solution path near the critical point.
When power flow equations are defined as a function as follows:
f ( x , λ ) = 0 ,
where x is a vector representing the voltage magnitudes and angle for all buses, the tangent vector of the system equation is derived from (4). In this context, f x represents the Jacobian matrix of the conventional power flow. By adding the column f λ , the singularity of the original Jacobian matrix is resolved.
d [ f ( x , λ ) ] = f x d x + f λ d λ = 0 .
Representing the partial derivatives as f x and f λ , (4) can be rewritten as (5), which indicates the tangent vector.
f x f λ d x d λ = 0 .
Since the loadability factor λ is considered as a variable, the number of variables exceeds the number of equations while solving the power flow. To avoid infinite solutions in (5), CPF assumes that there is a parameter having a known value. The criterion for selecting this parameter varies by the parameterization algorithm. For example, in local parameterization, the largest element of the tangent vector from the previous continuation step is assumed to be the known value for the next step.

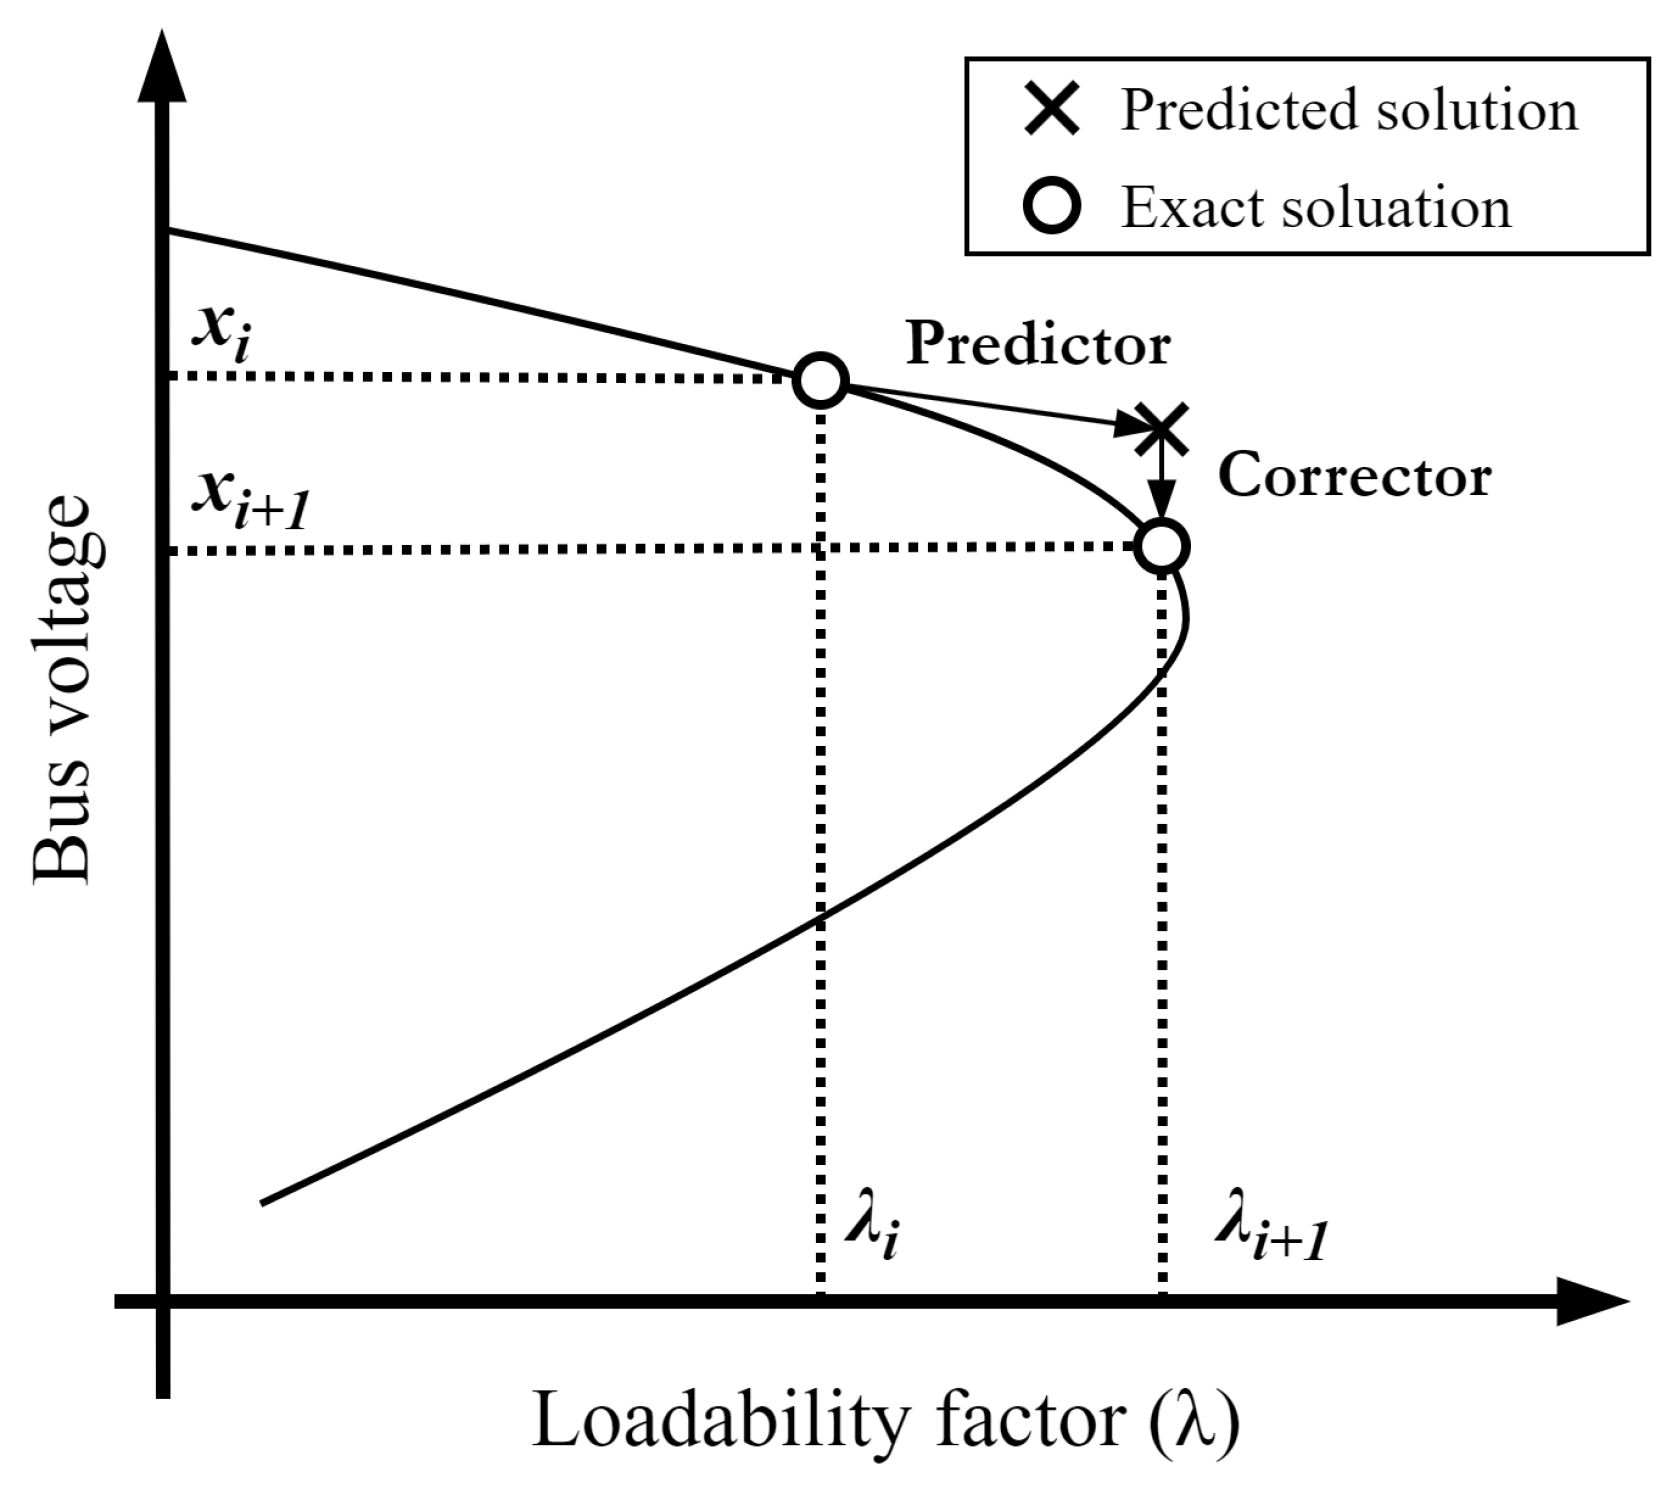
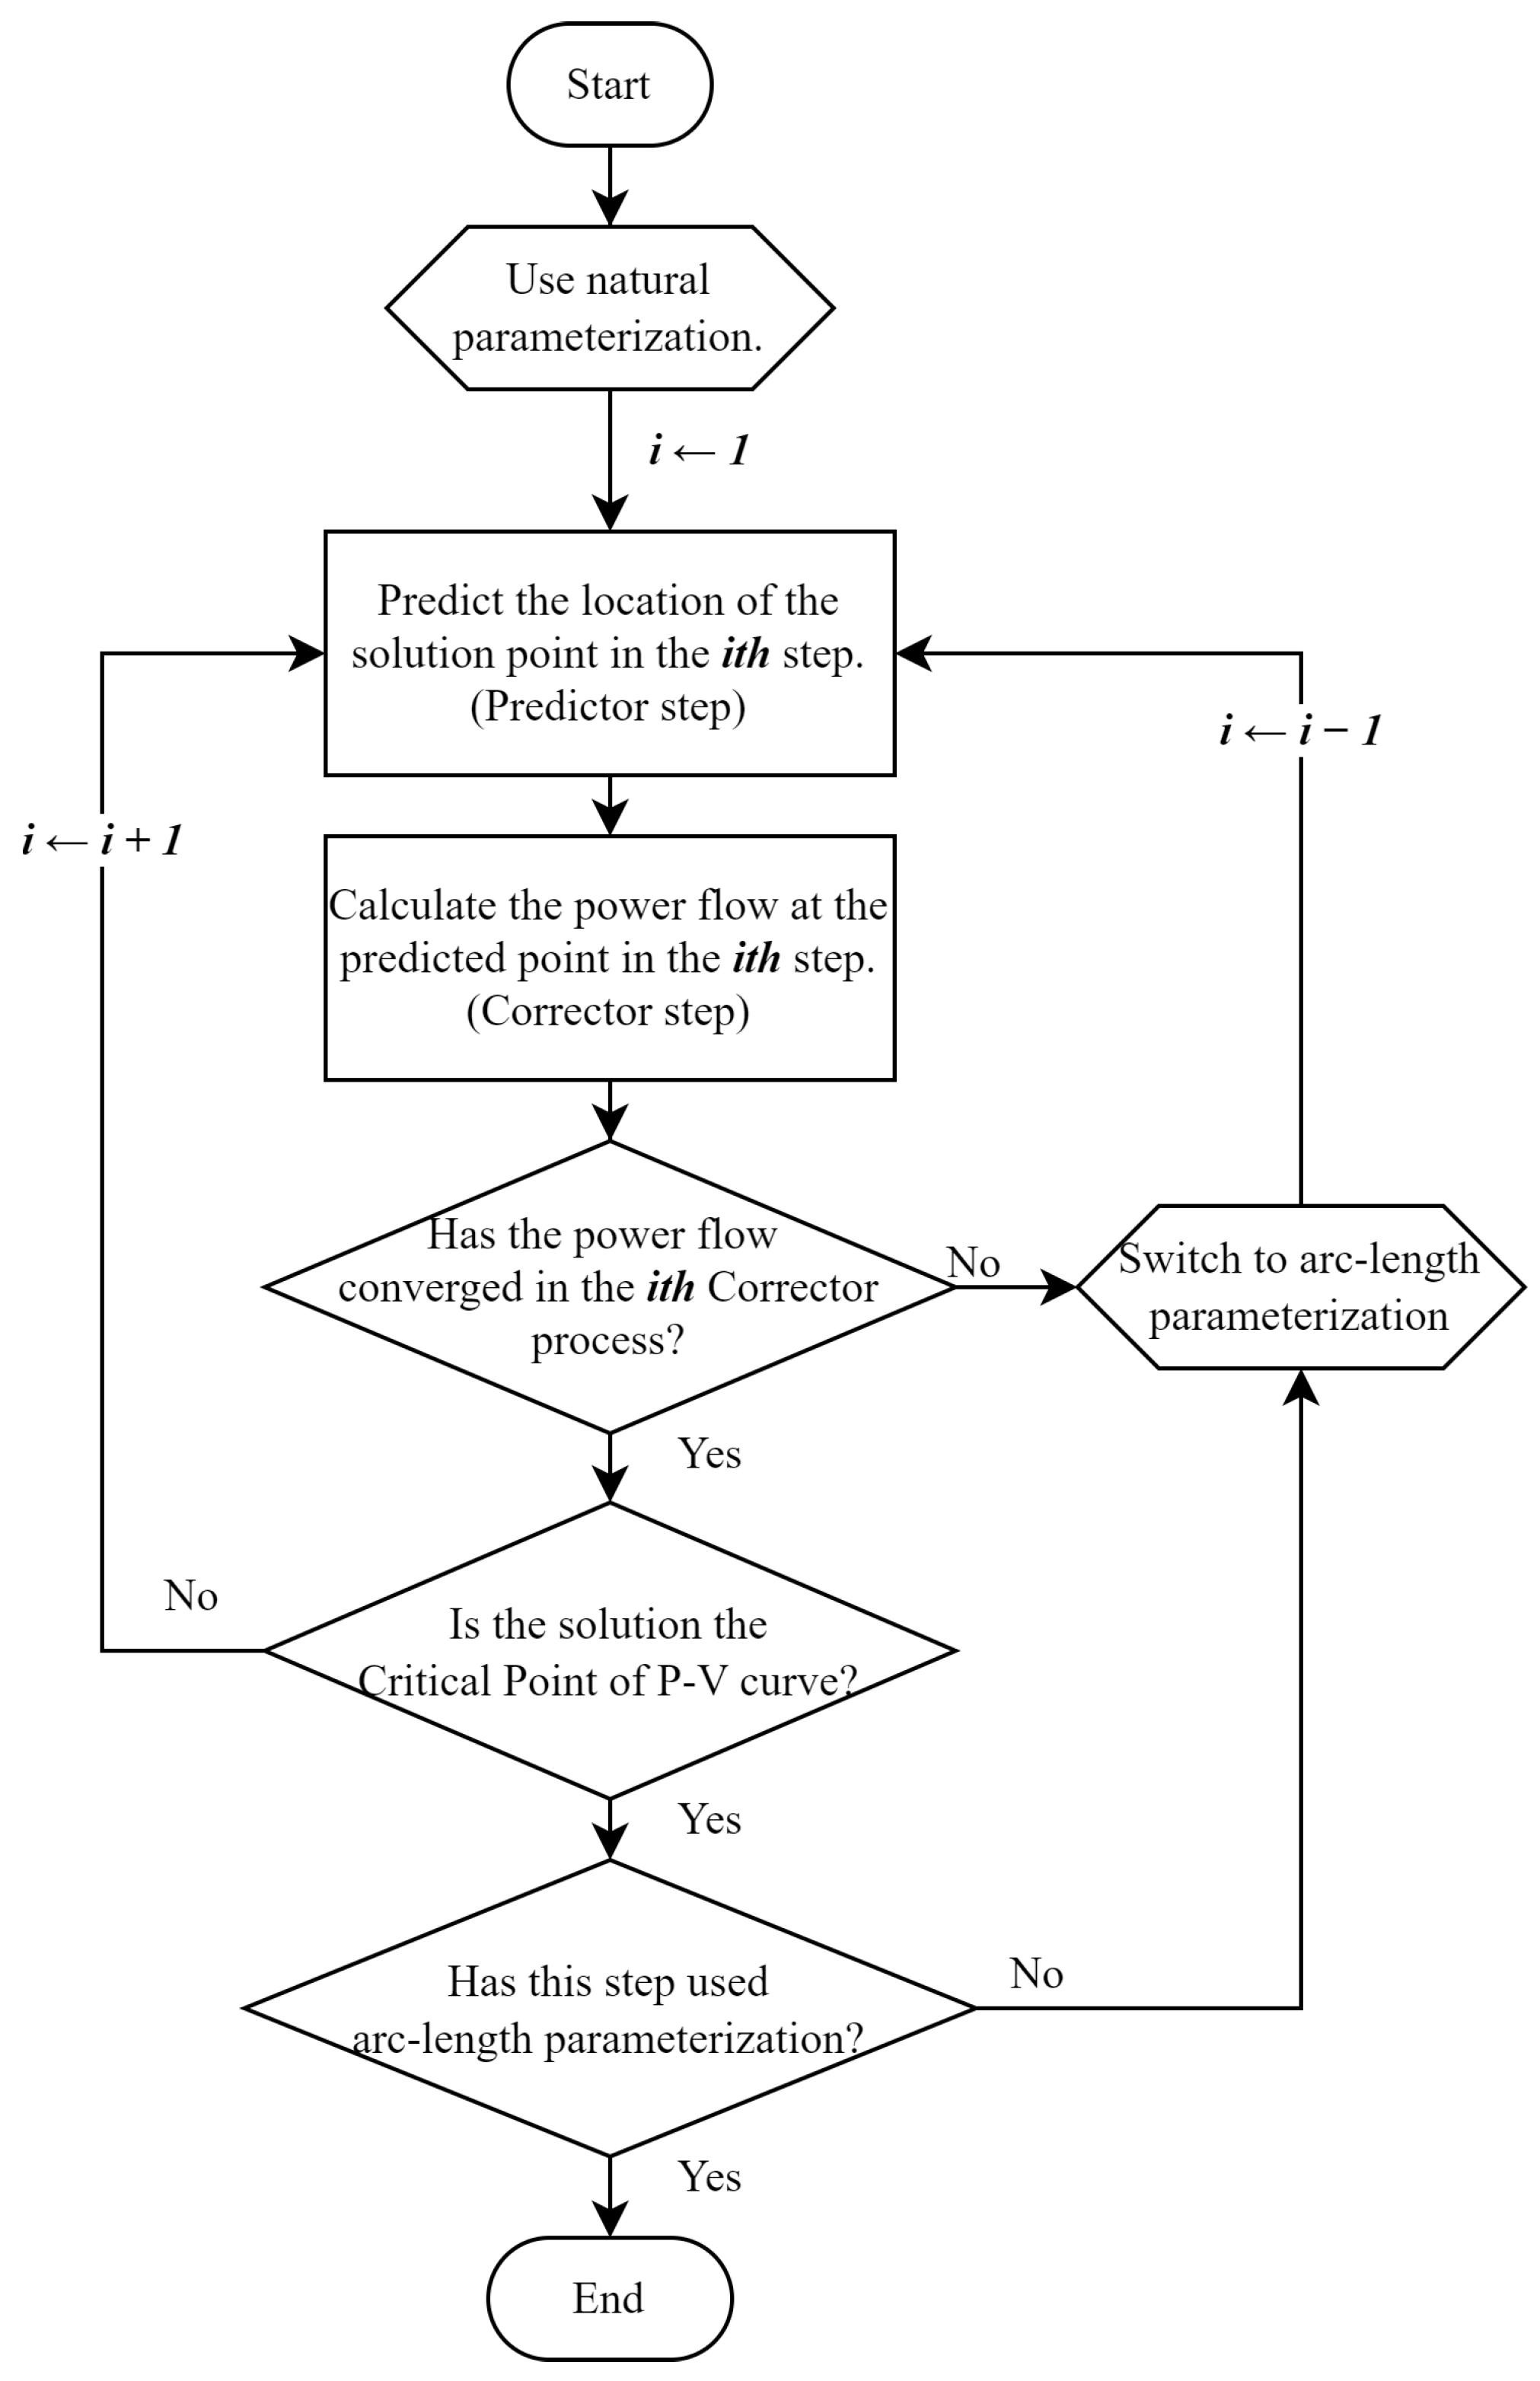
2.2. Process of Continuation Power Flow

The CPF process involves several steps, each characterized by selecting a predictor, corrector, parameterization, and step size control methods. This section describes the characteristics of each component and introduces the major methods used in the CPF process. Figure 2 illustrates the progression of a single step in the CPF process. The CPF calculation starts with the base load condition ( λ 1 = 1 ), and in each step, the predictor process estimates the expected condition point as the grid load increases (proportional to λ ). The corrector step then adjusts this expected point by solving the power flow equations. The step size control and parameterization methods determine the λ change amount. These steps progress iteratively until the critical point condition is met.

2.2.1. Predictor

The predictor step forecasts the next solution in the CPF. An accurate predictor method reduces the computational effort required in the corrector step. Predictor methods can be categorized into secant- and tangent-based linear methods, which estimate solutions using past and current solutions and nonlinear predictors, which typically utilize polynomials. The tangent predictor can be expressed as follows:
x ^ i + 1 λ ^ i + 1 = x i λ i + σ d x i d λ i ,
where x ^ i λ ^ i T represents the predicted solution, and x i λ i T represents the exact solution at step i.

2.2.2. Corrector

The solution predicted by the predictor is corrected by solving power flow equations. The Newton–Raphson method is frequently utilized due to its robust characteristics. However, the fast decoupled method may be employed when high computational efficiency occurs. In the case of additional parameters for CPF, when the load scaling variable λ is employed as the parameter, the correction step equations are identical to the power flow equations. If a different variable (such as V k , arc-length, or total power loss) is used as the parameter, λ is treated as an additional unknown variable, similar to bus voltages.

2.2.3. Parameterization

The parameterization method determines how to incorporate an additional equation into the power flow equations. The parameter can be the loading parameter λ , the voltage magnitude at bus k ( V k ), and the distance between two solutions. Parameterization methods are broadly categorized into global and local methods. Global parameterization uses a single parameter and does not change throughout the P-V curve assessment, while local parameterization selects different parameterizations during the continuation process. A typical local parameterization, as described in [9], uses the parameter with the largest tangent vector component at each continuation step. The update process for natural, arc-length, and pseudo arc-length parameterizations is expressed as follows:
λ i + 1 λ i = Δ s ,
k = 1 N ( x k i + 1 x i i ) 2 + ( λ i + 1 λ i ) 2 = ( Δ s 2 ) ,
( x i + 1 λ i + 1 x i λ i ) T t i = Δ s ,
where i is the step number, k is the bus number, and there is a total of N buses in the system. Δ s indicates the step size and x k i represents the state variables at bus k during step i.

2.3. Hybrid Parameterization

The proposed hybrid parameterization method is a local parameterization approach that combines two well-known parameterization techniques: natural parameterization and arc-length parameterization. This hybrid method combines the computational efficiency of natural parameterization with the accuracy of arc-length parameterization.
A flowchart of the proposed method is shown in Figure 3. The process begins with natural parameterization and continues until a divergence occurs in the continuation step. When the predicted solution in step i diverges during the correction process, the method reverts to step i 1 and switches to arc-length parameterization. If the estimated solution converges but does not reach the maximum loading point, the continuation proceeds to step i + 1 . When the maximum loading point is reached in step i, but the parameterization method is not the arc-length, the method switches to arc-length parameterization and resumes the process to step i 1 . The proposed method ends when the arc-length parameterization at step i converges to the critical point.
The CPF using the proposed hybrid parameterization primarily assesses the critical point of the P-V curve and changes the parameterization at the final stages of the continuation step. This approach quickly skips the gentle slope region and precisely searches around the nose point. Natural parameterization is advantageous due to its computational speed, as it directly uses λ as the parameter, making the step size equal to the change in λ . In contrast, other methods result in parameter changes that are always smaller than the step size. The arc-length method, although more computationally intensive due to its nonlinear operations, provides greater accuracy for deriving the critical point. The balancing of computing speed and accuracy is an important object of this hybrid parameterization method.

3. Case Study

This section evaluates the performance of the proposed hybrid parameterization method in terms of accuracy and computation time. A quantitative accuracy measurement method is proposed and applied to various grid scenarios. Case studies were conducted to determine the optimal conditions for the hybrid method, considering variations in step sizes and parameterization selection. Additionally, the performance of the proposed hybrid method is compared with conventional methods across different grid scales.

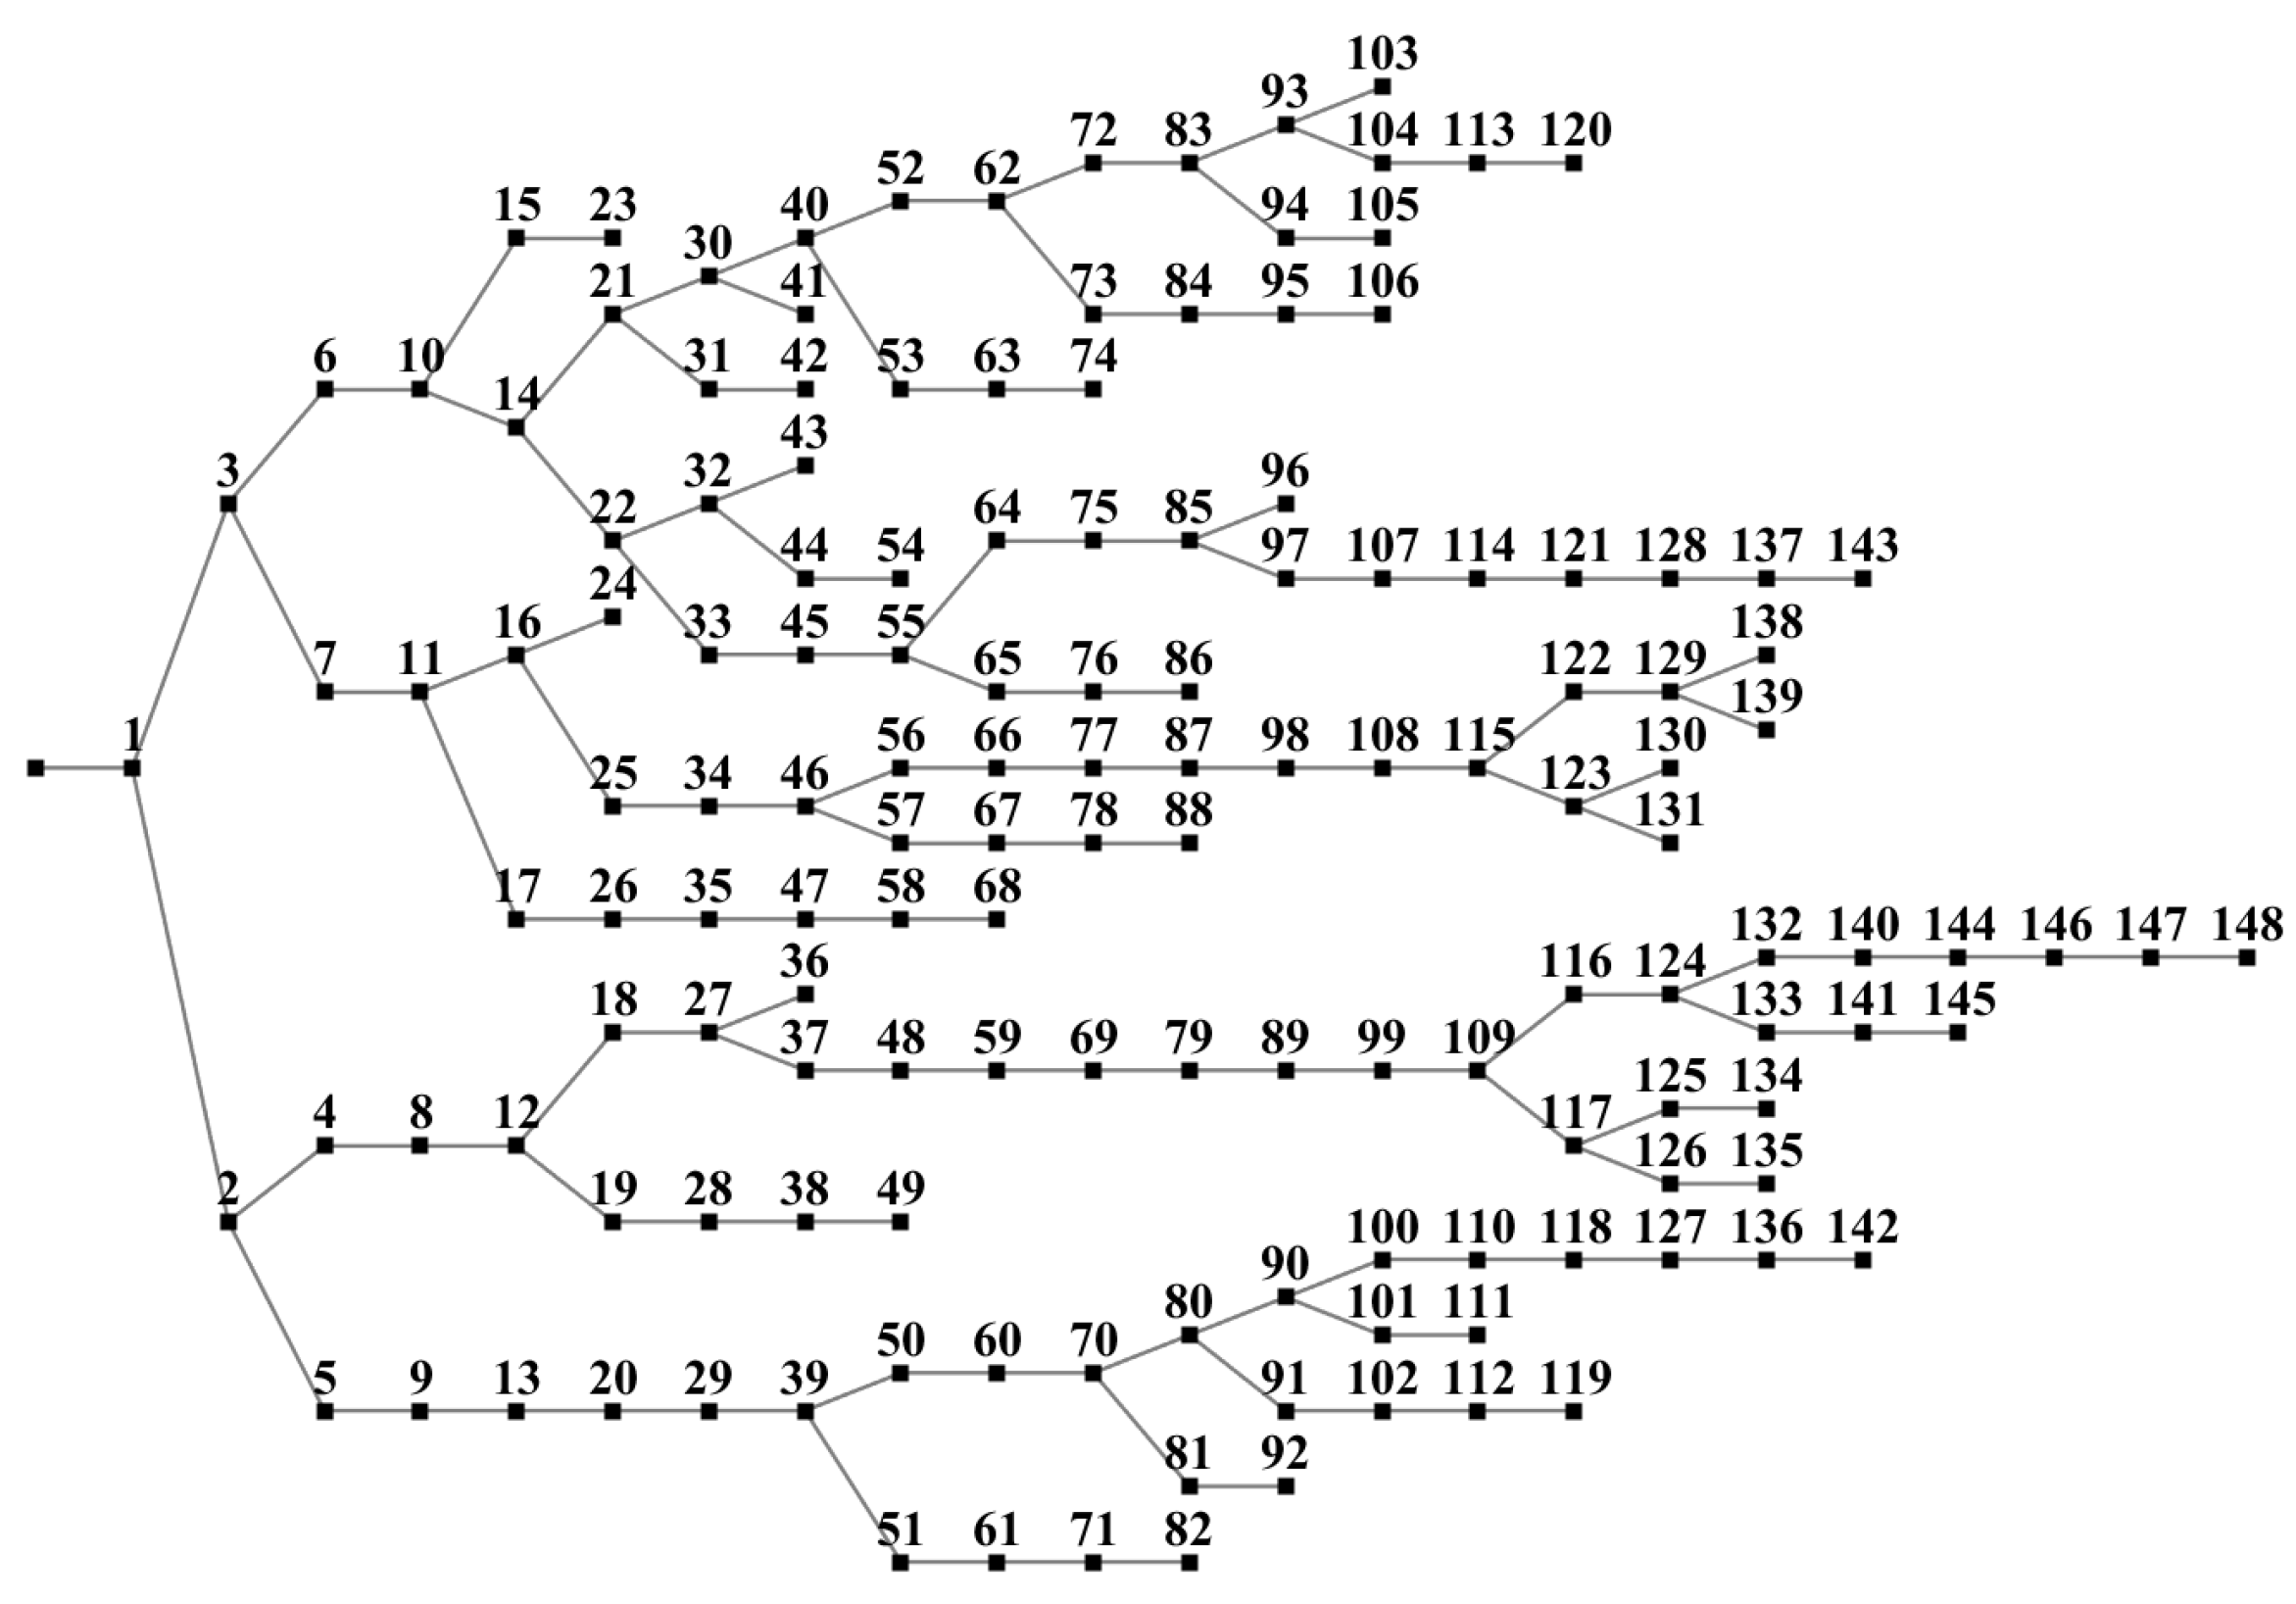
3.1. Power Grid Test Case

A test feeder from the Korea Electric Power Corporation (KEPCO 148-bus system), based on a specific Korean distribution system, is used for this case study. This distribution network has a radial structure consisting of four feeders connected to a single substation, with a total load of 19.8 MW. Buses 4, 5, 6, and 7 represent the starting point of feeders for each distribution line. Under the grid codes and Korea’s operation policy, the sum of the load in each feeder is less than 6000 kVA. The grid topology is illustrated in Figure 4.

3.2. DG Scenarios

Recent power system research focuses on the challenges presented by the rapid penetration and expansion of renewable generation [34,35]. In the stability domain, the characteristics of inverters and their impact on the power system are the primary concerns [36]. From a planning perspective, the uncertainty of renewable generation is a crucial consideration. To address this, numerous studies approach the issue by predicting uncontrollable renewable energy generation [37], applying probabilistic methods [38], and employing various uncertainty scenarios.
This study considers multiple scenarios involving the uncertain penetration and placement of renewable generators. For evaluating CPF, scenarios were designed based on the KEPCO 148-bus system, incorporating various DGs. Scenarios were generated intervally considering three features: the total generation of DGs with 10, 20, and 40 MW, the proportion of DG placement relative to the distance from the feeders, and the number of DGs within the same generation capacity. Each DG capacity is greater than 100 kW and the placement is restricted to not exceeding 10 MW under a single distribution feeder to simulate realistic grid conditions. Moreover, each DG connection scenario accounted for load variations by randomly connecting a 1 MW scale load into each line. The location of each DG and the load were decided randomly, following a uniform distribution.
A total of 1344 grid scenarios were created to cover a wide range of DG integration cases. The load margin was calculated using each CPF method, followed by a performance evaluation of each parameterization algorithm.

3.3. Parameterization Comparison
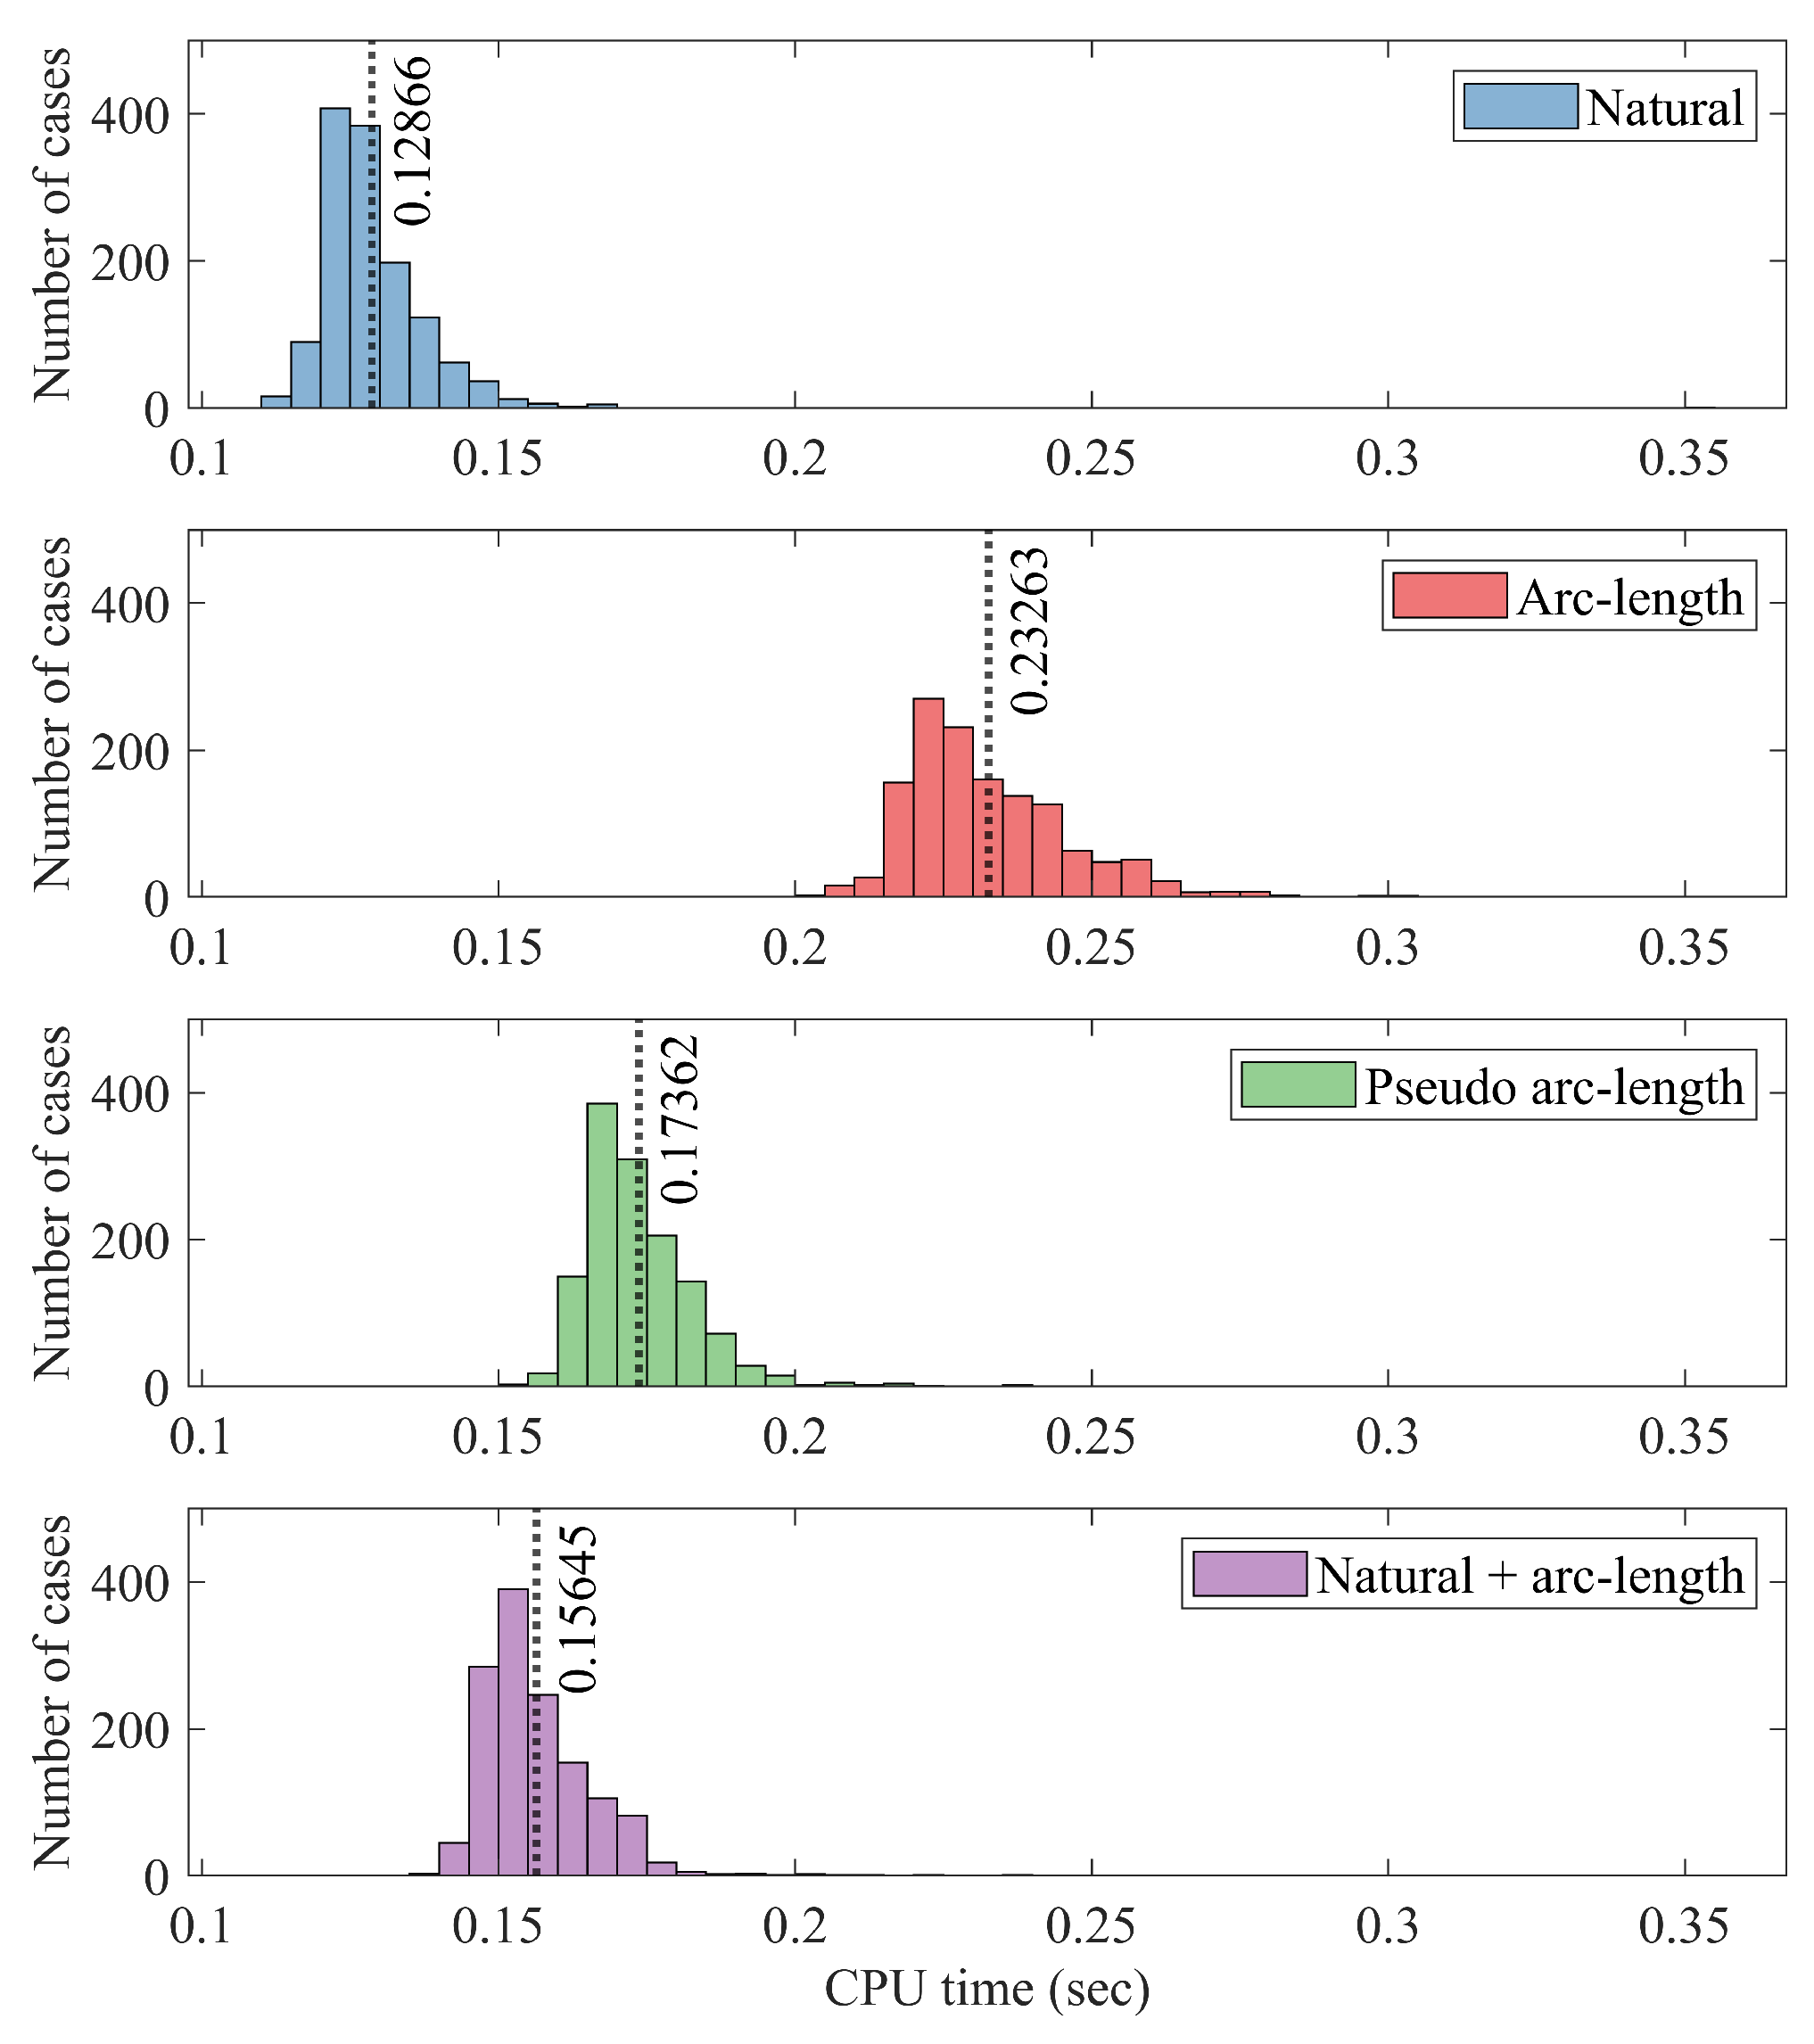
To compare different parameterization methods, this study fixed other CPF options besides parameterization (such as the step size, predictor method, and corrector method). All simulations use the tangent predictor and the Newton–Raphson power flow method as the corrector. The step size is set to 0.1, with no adaptive step size control method applied. Computations were conducted using MATLAB 2022b on a personal computer equipped with an Intel Core i9-11900K, 3.50 GHz CPU. The result highlights the trade-offs between computational efficiency and accuracy for each method.

3.3.1. Metrics

As determining the exact maximum loading point is hardly possible, it is a challenging task to establish a reference value for algorithm accuracy. Previous studies [18,39,40] have demonstrated the precision of methods for determining the loadability limit by comparing the largest solutions. However, these comparisons are typically limited to a single case or a few cases.
The paper evaluates the accuracy by calculating the reference value using a repetitive power flow method. This approach allows quantification of the average computational accuracy across many scenarios. The accuracy evaluation metric used in this study is the percentage error, calculated as follows:
Percentage error % = | λ max ref λ ^ max | | λ max ref | × 100 % ,
where λ max ref represents the reference value of the maximum loading point and λ ^ max is the estimated value.
The repetitive power flow method proposed in this study involves two steps. First, the initial maximum loading point is calculated using CPF with pseudo arc-length parameterization. Second, this initial maximum loading point is used as the starting condition, with the total load gradually increasing while the power flow converges. If the continuation step converges, this condition becomes the new initial condition for the next power flow analysis. Repeating this sequence ensures that the maximum loading point derived from the repetitive power flow is the largest among all CPF results.

3.3.2. Performance

The average performance of each parameterization across the 1344 network scenarios is summarized in Table 1. The natural parameterization demonstrated the fastest average computation speed but was significantly less accurate than the other three methods. The other three methods—arc-length, pseudo arc-length, and hybrid—showed similar accuracy levels, with slight differences in the average computation speed.
The differences in computation speed are more noticeable when examining the distribution, as shown in Figure 5. The figure represents the histogram of the CPU time using natural parameterization, arc-length, pseudo arc-length, and hybrid parameterization, respectively. Natural parameterization consistently had the fastest computation performance across all scenarios. The hybrid method emerged as the second fastest algorithm, with 97.4% of the scenarios evaluated indicating it was the fastest parameterization, excluding natural parameterization.
The arc-length parameterization displayed significant variance in computation time. However, the distribution of the hybrid method’s calculation times closely resembles the natural parameterization rather than the arc-length method despite using arc-length parameterization for the last several steps. This result indicates that the hybrid method benefits from the computational speed of natural parameterization while achieving the precision of the arc-length method.

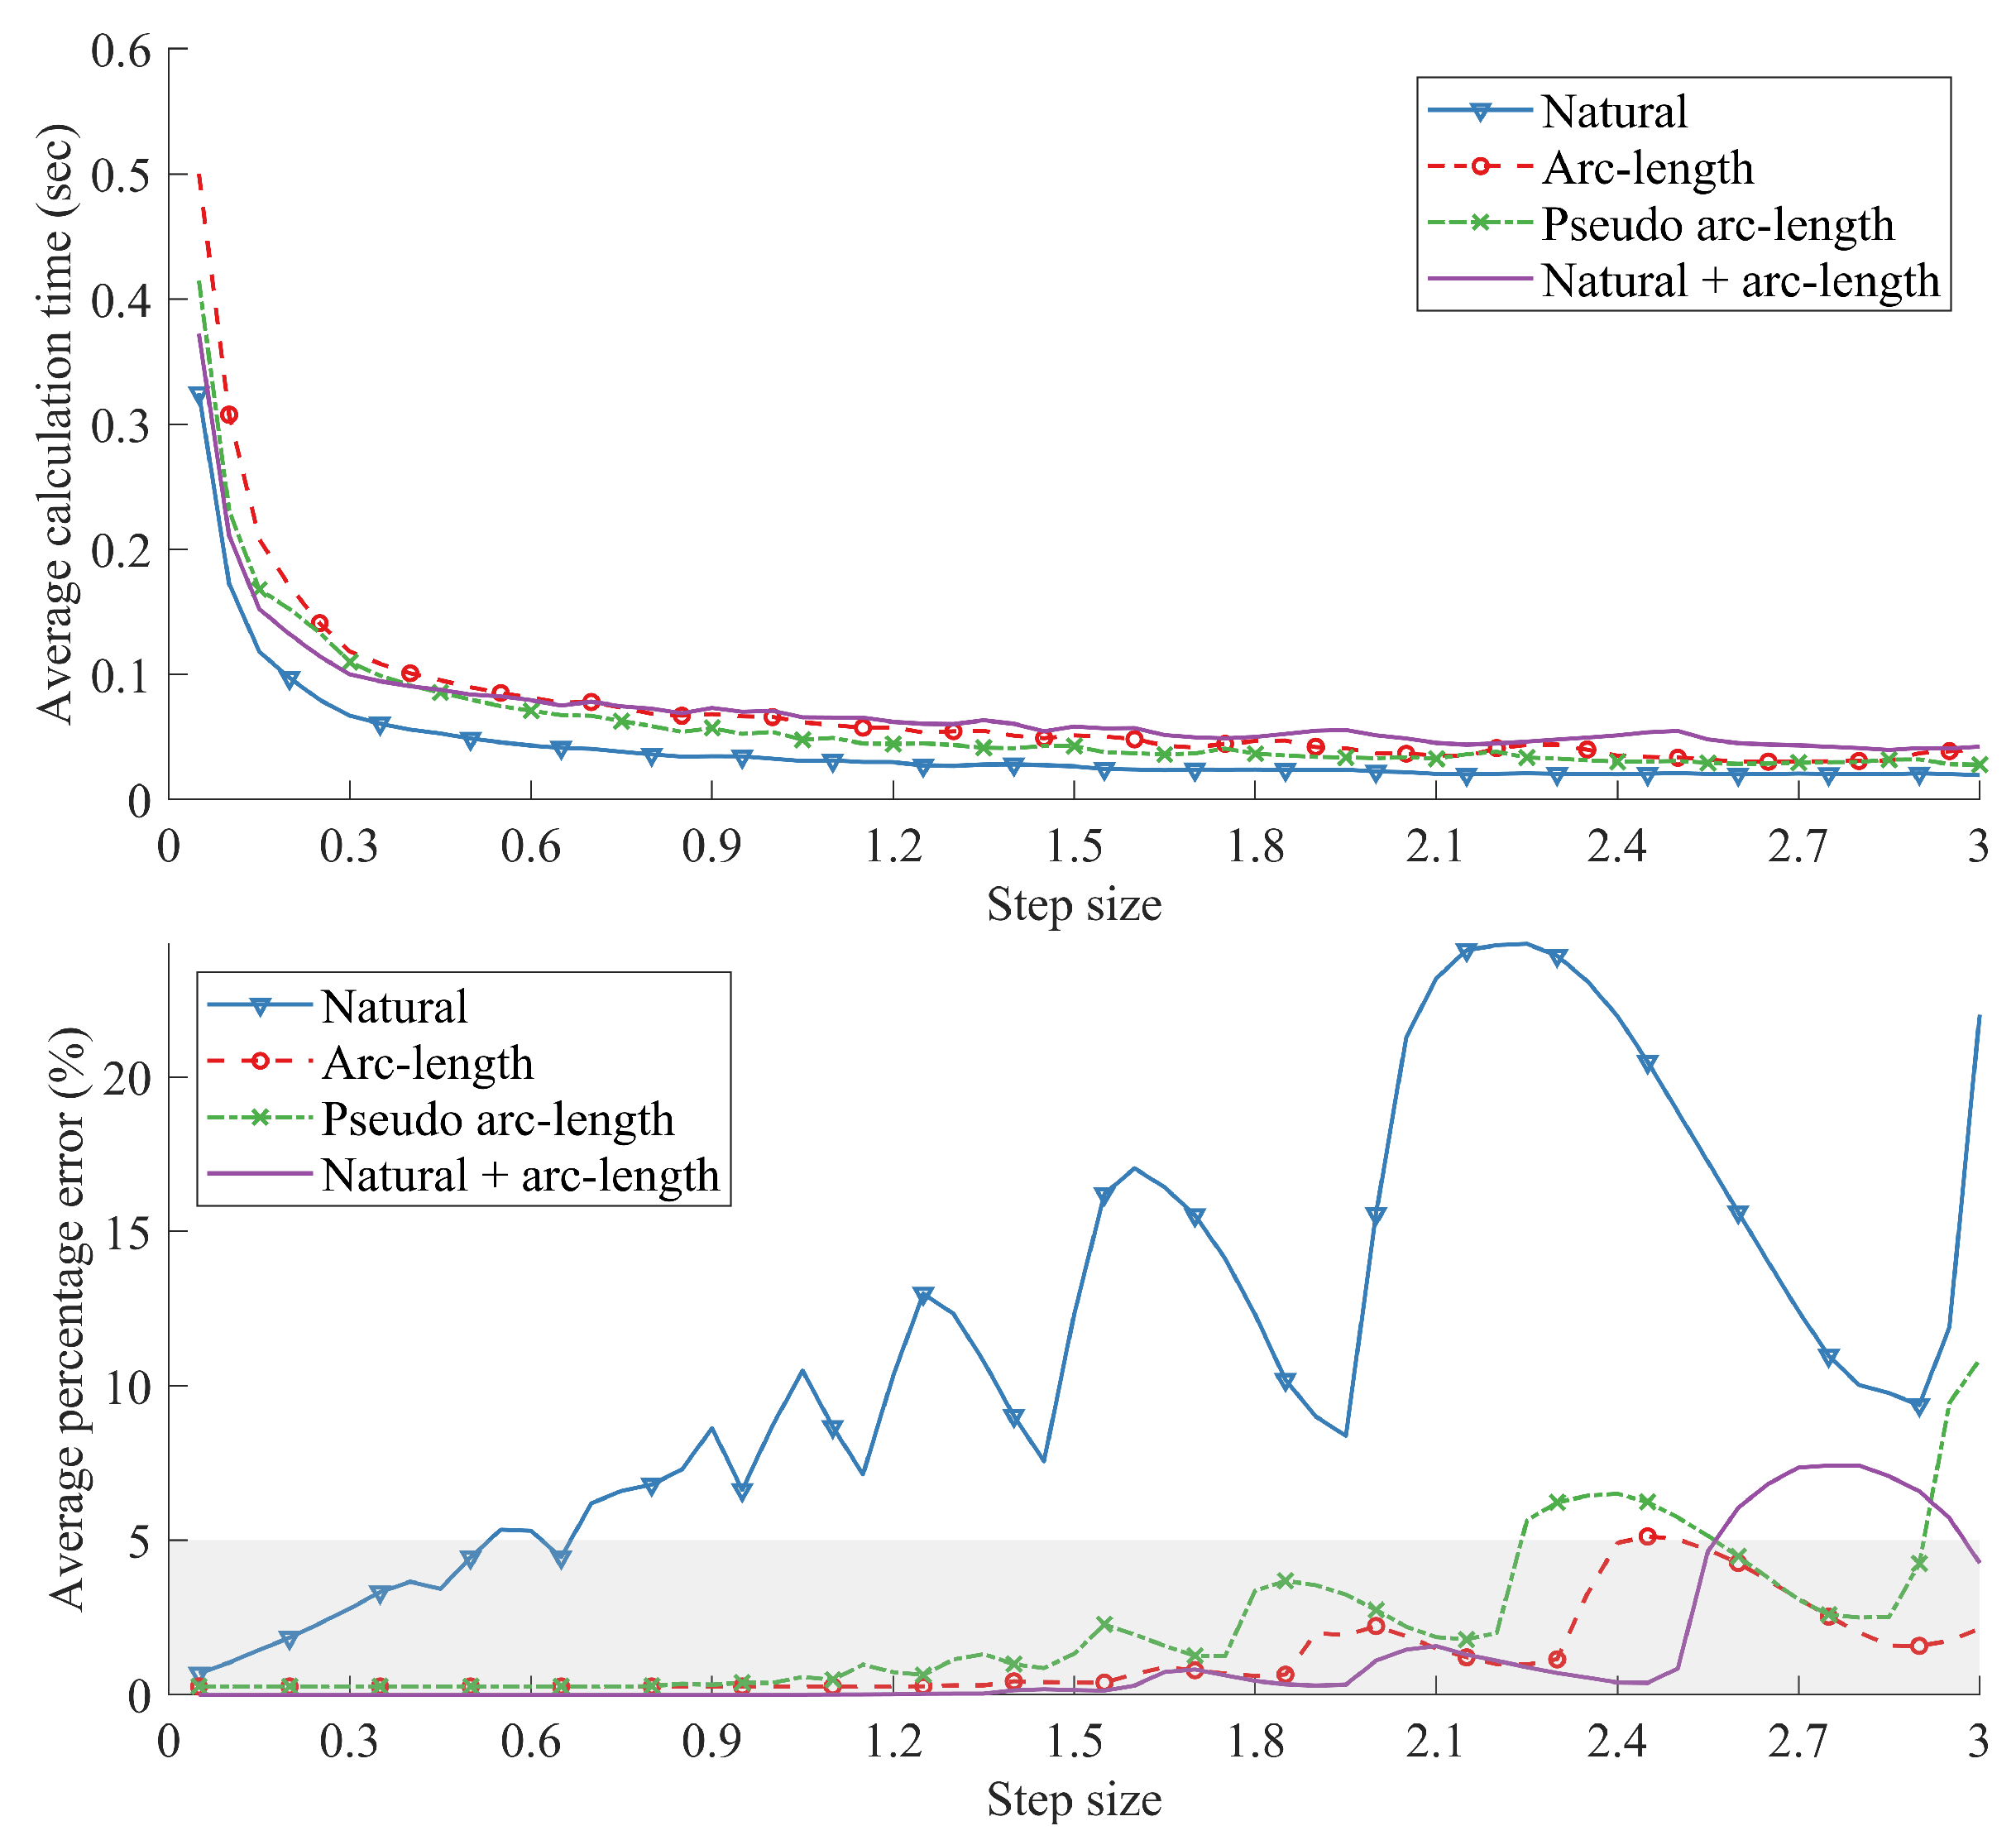
3.4. Performance over Different Step Sizes

The performance of the proposed hybrid parameterization method depends significantly on the calculation speed of the natural parameterization. This section presents additional experiments to investigate the impact of varying step sizes on the efficiency and accuracy of the hybrid parameterization method.
To analyze the effects of step size, experiments were conducted across a range of step sizes from 0.05 to 3. The results, shown in Figure 6, illustrate the average CPU time and percentage error across 1344 scenarios, where the average maximum λ value is 6.12. The findings indicate that for step sizes larger than 0.5, no significant improvement is observed in the average calculation time.
Further analysis is performed to examine the impact of the step size on each parameterization method. As the step size increases, the calculation time decreases, though the reduction becomes insignificant after a certain threshold. In terms of accuracy, the percentage error increases significantly beyond a certain step size, particularly when using natural parameterization. The hybrid parameterization method, however, preserves the accuracy at larger step sizes. While the arc-length and pseudo arc-length methods reach 5% error at step sizes of 2.45 and 2.25, respectively, the hybrid method has the same level of accuracy until the step size reaches 2.6, which indicates that the hybrid method can select a larger step size with a minimal trade-off in accuracy.
The step length of the first parameterization is critical for the CPU time, as shown in Figure 7. This figure illustrates the computation time and the percentage error as the step size varies for the first and second parameterization methods. The lines indicate the average values across all scenarios, while the shaded region represents the range of the values. The results illustrate that, for both computation time and accuracy, the step size of the first parameterization is more critical than that of the second. Note that the percentage error does not vary much until the step size reaches 1 for both parameterizations. Conversely, the steepest decrease in CPU time occurs up to a step size of approximately 1.

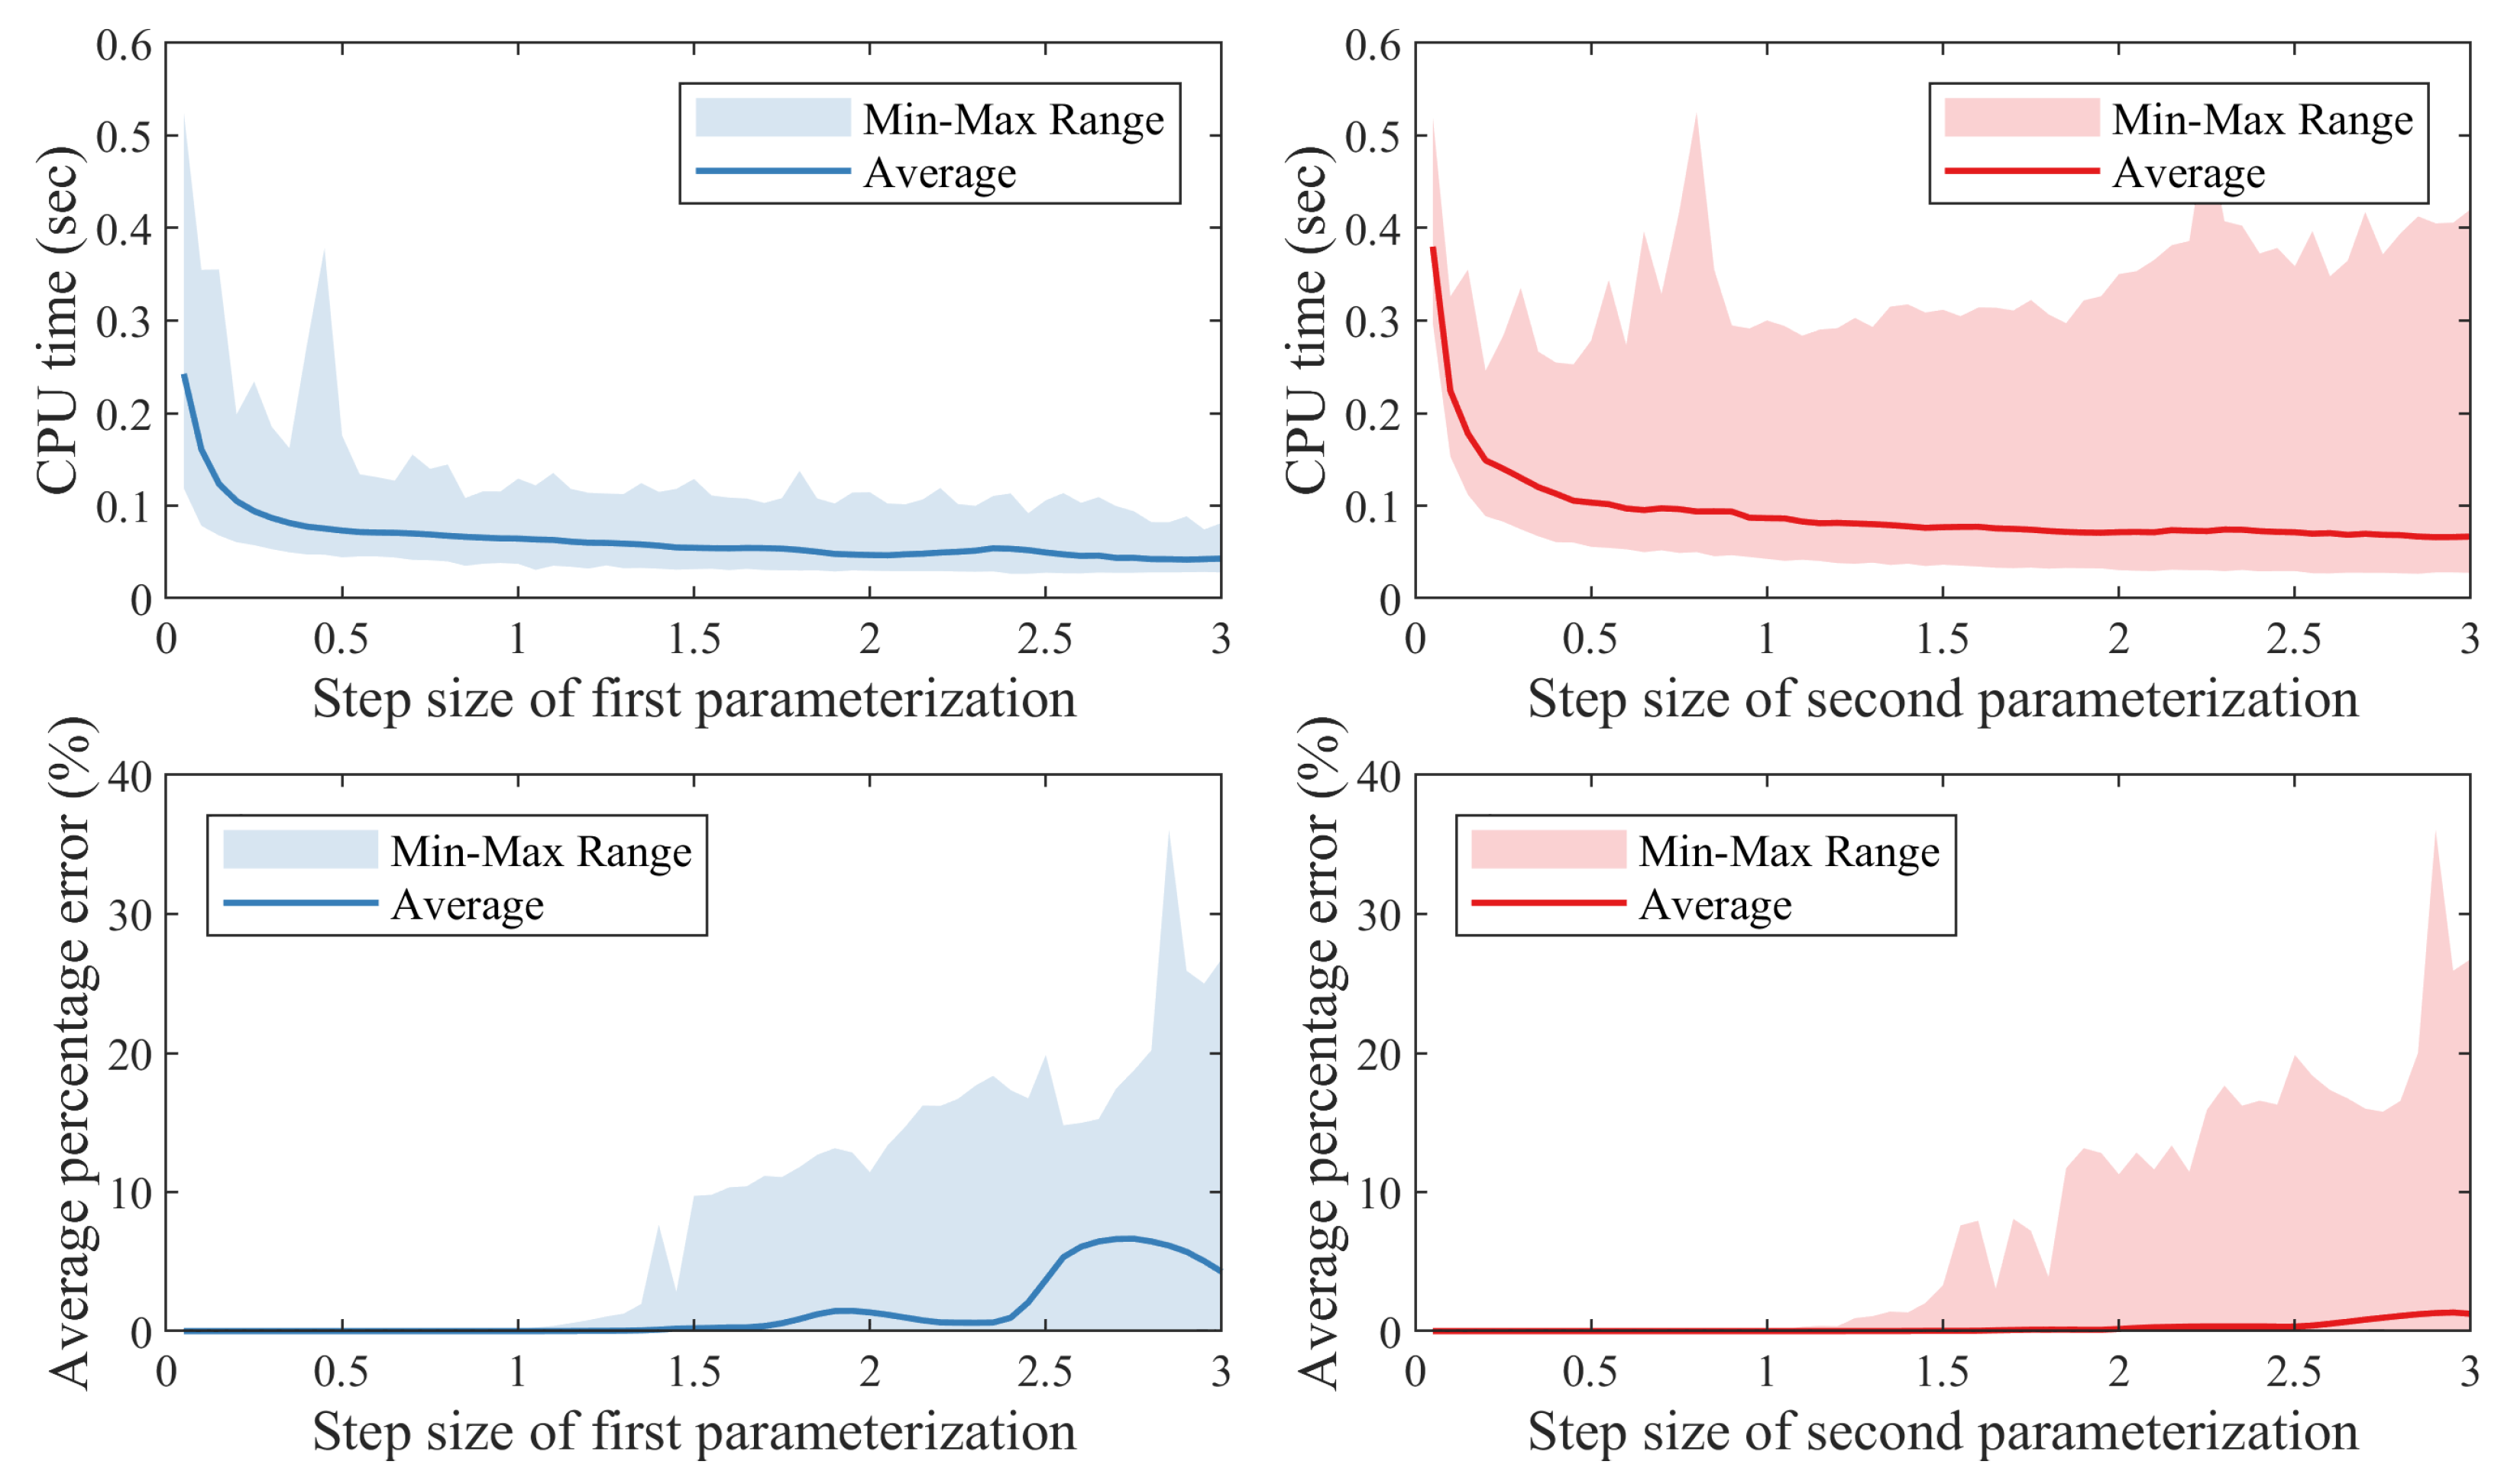
3.5. Other Parameterization Combinations for the Hybrid Method

This section evaluates the performance of the proposed switching algorithm using different parameterization sets at the beginning and the end of the CPF process. As previously discussed, this study primarily uses natural parameterization for the initial calculation and arc-length parameterization for the latter recalculation step. This approach was chosen because natural parameterization provides the largest changes per step size, while arc-length parameterization ensures optimal accuracy. Table 2 summarizes the results, examining whether the combination of natural and arc-length parameterization is the most effective among other possible combinations. In all cases, the initial parameterization step size was set to 0.2 and the recalculation step size was set to 0.1.
Although the fastest method employed only natural parameterization with varying step sizes, it showed significantly higher percentage errors than other combinations. The second fastest combination was the proposed natural and arc-length combination, which maintained accuracy relative to other methods. In summary, the analysis confirms that the natural and arc-length combination for the hybrid parameterization method showed the best performance compared to other combinations, effectively balancing speed and accuracy.

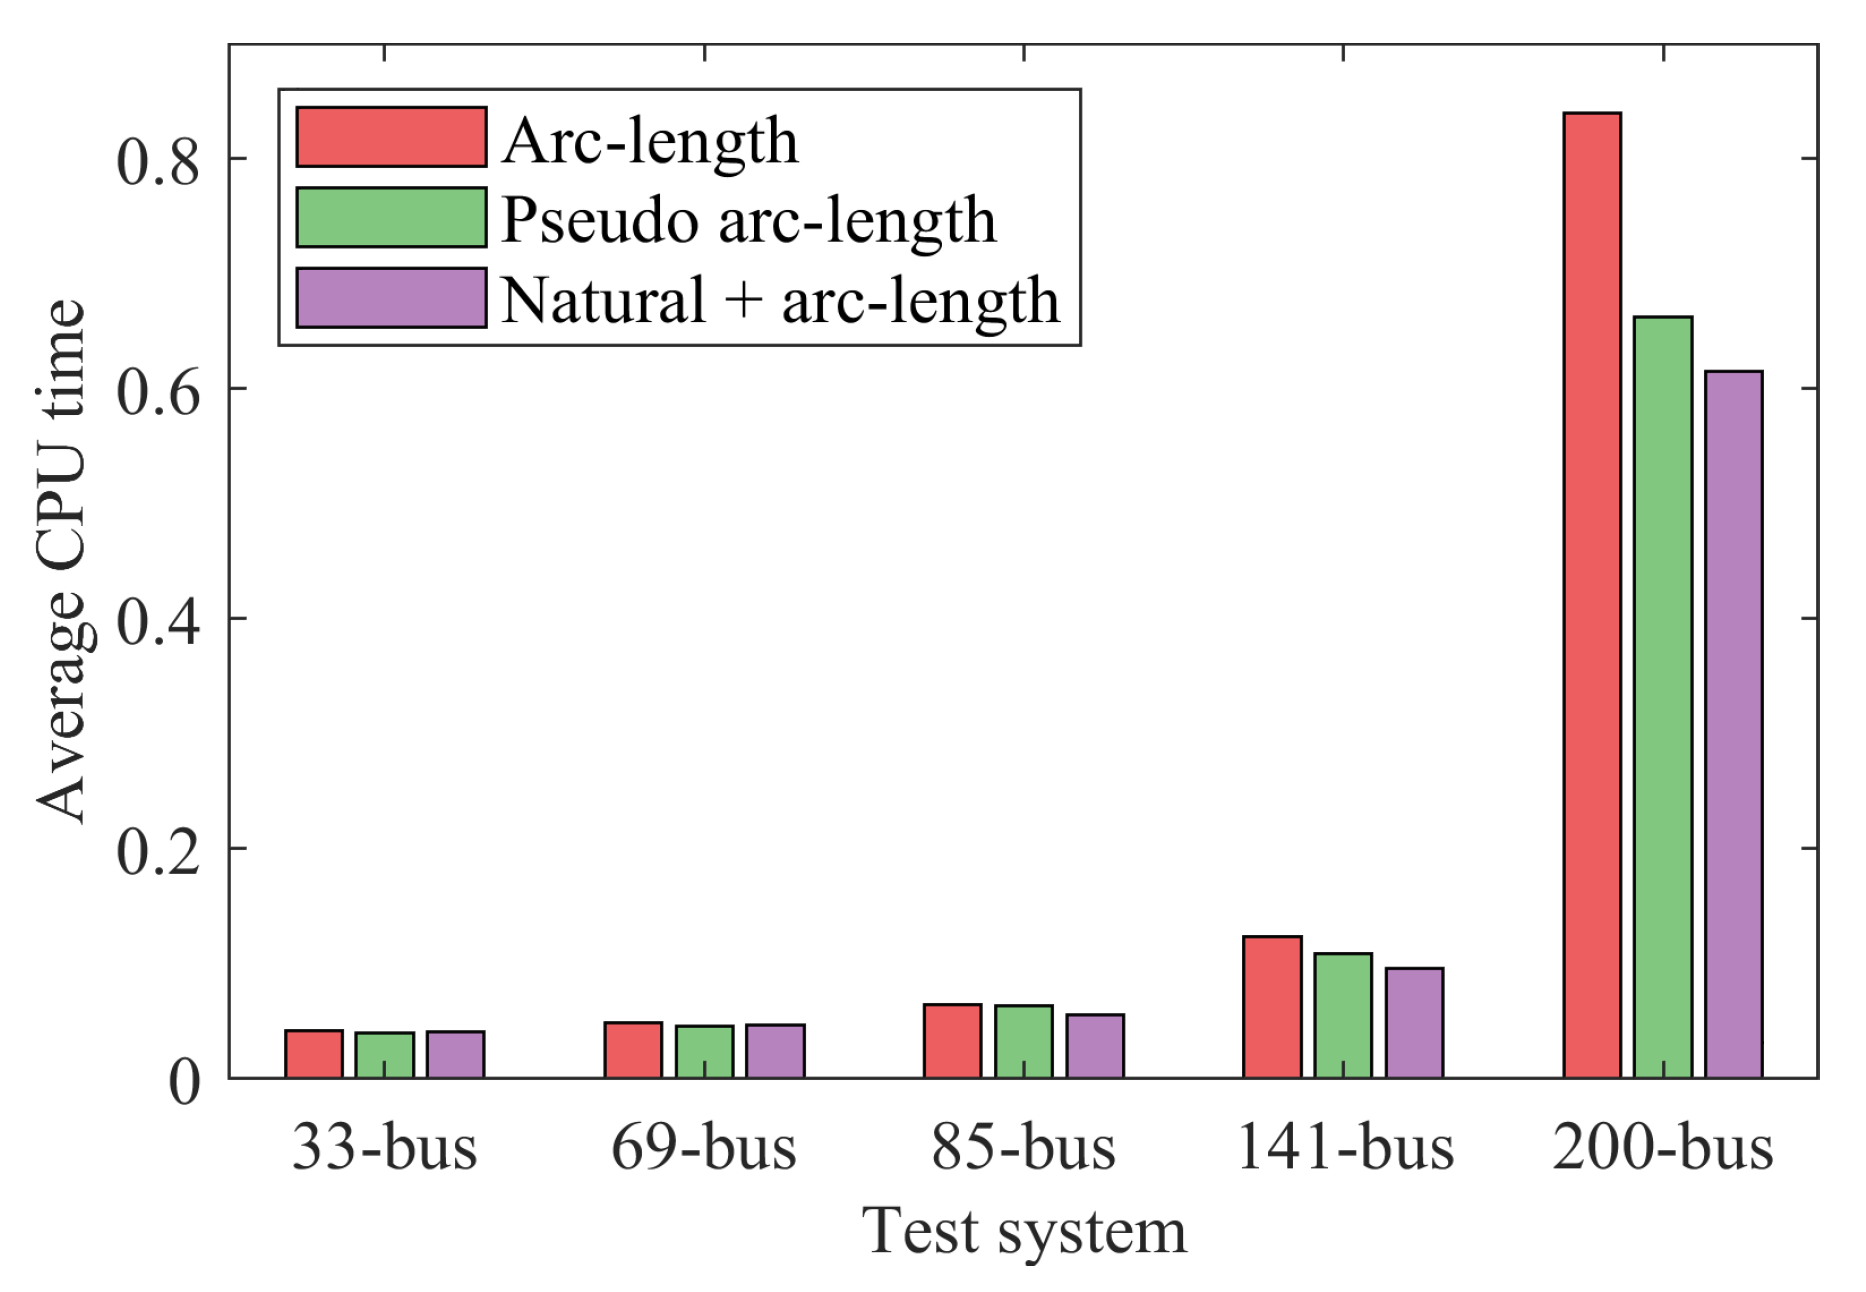
3.6. Performace Comparation on Different Grid Scales

In this section, we compare the CPU times for the different parameterization methods across various grid scales using the IEEE 33-bus [41], the IEEE 69-bus [42], the 85-bus test feeder from [43], the 141-bus test feeder from [44], and the 200-bus synthetic test system from [45], which are widely used test systems. The parameterization method can affect the computational efficiency of power system analysis, especially as the grid scale increases. By conducting experiments on these diverse grid sizes, we aim to evaluate the performance of various parameterization techniques under different system complexities.
To measure the average computational speed of algorithms, random scenarios were generated with the penetration rate of the test systems at three levels: 10%, 20%, and 40% of the total load. Additionally, the number of generators varied from 25% to 75% of the total number of nodes in the system. Generator locations were randomly sampled to obtain a total of 1800 scenarios for each test feeder. Table 3 shows the average computation time for each parameterization method across different grid scales, and Figure 8 graphically indicates that hybrid parameterization is more beneficial for computation time in larger grids. The figure excludes the results of natural parameterization to compare methods with similar accuracy intuitively.
As the grid size increases, there is a tendency for the average computational time of all parameterization methods to increase. The natural parameterization method consistently exhibits the lowest average computational time across all grid sizes. In contrast, the arc-length method tends to have larger computational times compared to other methods. The hybrid method combines the advantages of natural and arc-length methods, showing efficient performance across various grid sizes. In addition, it significantly reduces the computational time as the grid scale increases.

4. Conclusions

The CPF is the critical algorithm for deriving P-V curves and determining loading margins, which is essential for static voltage stability analysis. This paper introduces a hybrid parameterization that combines basic parameterization techniques to determine the maximum loading limit. Various distributed generation placement scenarios were established for a test feeder and an accuracy evaluation method was proposed to assess the efficiency of different parameterization methods.
Experiments were conducted to evaluate the impact of the step size on the performance of the hybrid parameterization method, proving that the method maintains high accuracy even with larger step sizes. Additionally, the hybrid method was experimented with by applying other combinations of hybrid parameterization, showing that the natural and the arc-length combination performs the best. Evaluations across different grid scales show the superior performance of the proposed method in larger grids compared to conventional methods.
The findings indicate that the hybrid method impressively balances the speed and accuracy, particularly in large and complex power grids. As modern power systems grow more complex with the expansion of renewable energy, electric vehicles, and power electronics, the need for more scenario assessments to predict risks and evaluate control strategies is increasing. In this context, the improvement in computational speed by the proposed hybrid parameterization allows for the accurate assessment of power systems quickly, thereby enhancing their stability. The evaluation of renewable energy scenarios in this study shows that the proposed method is robust under increased integration.
While this study focused on a simplified system consisting of only constant power loads and renewable energy to introduce the methodology, future research could include diverse load models and equipment to validate its effectiveness in complex systems. Additionally, the approach can be further enhanced to improve performance in smaller systems with fewer buses.

Author Contributions

Conceptualization, H.K., H.-T.K., M.K. and S.C.; methodology, H.K., H.-T.K., Y.J.K. and S.C.; software, H.K.; validation, H.K., Y.J.K., X.Z. and S.C.; formal analysis, H.K., H.W., Y.Y., H.-T.K., Y.J.K. and X.Z.; investigation, H.K., H.W., Y.Y., H.-T.K. and X.Z.; resources, H.-T.K. and Y.J.K.; data curation, H.K.; writing—original draft, H.K.; writing—review and editing, H.K. and S.C.; visualization, H.K.; supervision, M.K. and S.C.; project administration, M.K. and S.C.; funding acquisition, S.C. All authors have read and agreed to the published version of the manuscript.

Funding

This work was supported in part by a Korea Institute of Energy Technology Evaluation and Planning (KETEP) grant funded by the Korea government (MOTIE) (No. RS-2023-00234707), in part by the Korea Institute of Energy Technology Evaluation and Planning (KETEP) and the Ministry of Trade, Industry and Energy (MOTIE) of the Republic of Korea (No. 20225500000110), in part by a National Research Foundation of Korea (NRF) grant funded by the Korea government (MSIT) (No. 2022R1A2C2011522), and in part by the projects of the Korea Electric Power Corporation (No. R23EA02).

Institutional Review Board Statement

Not applicable.

Informed Consent Statement

Not applicable.

Data Availability Statement

Data are contained within the article.

Conflicts of Interest

The authors declare no conflicts of interest.

References

  1. Kundur, P.; Paserba, J.; Ajjarapu, V.; Andersson, G.; Bose, A.; Canizares, C.; Hatziargyriou, N.; Hill, D.; Stankovic, A.; Taylor, C.; et al. Definition and classification of power system stability IEEE/CIGRE joint task force on stability terms and definitions. IEEE Trans. Power Syst. 2004, 19, 1387–1401. [Google Scholar] [CrossRef]
  2. Canizares, C.; Alvarado, F. Point of collapse and continuation methods for large AC/DC systems. IEEE Trans. Power Syst. 1993, 8, 1–8. [Google Scholar] [CrossRef]
  3. Woo, H.; Son, Y.; Cho, J.; Choi, S. Stochastic Second-Order Conic Programming for Optimal Sizing of Distributed Generator Units and Electric Vehicle Charging Stations. Sustainability 2022, 14, 4964. [Google Scholar] [CrossRef]
  4. Wang, D.; Zhang, C.; Li, J.; Zhu, L.; Zhou, B.; Zhou, Q.; Cheng, L.; Shuai, Z. A Novel Interval Power Flow Method Based on Hybrid Box-Ellipsoid Uncertain Sets. IEEE Trans. Power Syst. 2024, 39, 6111–6114. [Google Scholar] [CrossRef]
  5. Lee, M.; Yoon, M.; Cho, J.; Choi, S. Probabilistic Stability Evaluation Based on Confidence Interval in Distribution Systems with Inverter-Based Distributed Generations. Sustainability 2022, 14, 3806. [Google Scholar] [CrossRef]
  6. Jaramillo, M.D.; Carrión, D.F.; Muñoz, J.P. A Novel Methodology for Strengthening Stability in Electrical Power Systems by Considering Fast Voltage Stability Index under N − 1 Scenarios. Energies 2023, 16, 3396. [Google Scholar] [CrossRef]
  7. Jaramillo, M.; Carrión, D.; Muñoz, J. A Deep Neural Network as a Strategy for Optimal Sizing and Location of Reactive Compensation Considering Power Consumption Uncertainties. Energies 2022, 15, 9367. [Google Scholar] [CrossRef]
  8. Iba, K.; Suzuki, H.; Egawa, M.; Watanabe, T. Calculation of critical loading condition with nose curve using homotopy continuation method. IEEE Trans. Power Syst. 1991, 6, 584–593. [Google Scholar] [CrossRef]
  9. Ajjarapu, V.; Christy, C. The continuation power flow: A tool for steady state voltage stability analysis. IEEE Trans. Power Syst. 1992, 7, 416–423. [Google Scholar] [CrossRef]
  10. Farid, K.; Shahriar, A.; Reza Shabani, H. The Continuation Power Flow (CPF) Methods. In Voltage Stability in Electrical Power Systems; John Wiley & Sons, Ltd.: Hoboken, NJ, USA, 2022; Chapter 5; pp. 97–118. [Google Scholar] [CrossRef]
  11. Chiang, H.D.; Flueck, A.J.; Shah, K.S.; Balu, N. CPFLOW: A practical tool for tracing power system steady-state stationary behavior due to load and generation variations. IEEE Trans. Power Syst. 1995, 10, 623–634. [Google Scholar] [CrossRef]
  12. Flueck, A.; Dondeti, J. A new continuation power flow tool for investigating the nonlinear effects of transmission branch parameter variations. IEEE Trans. Power Syst. 2000, 15, 223–227. [Google Scholar] [CrossRef]
  13. Li, S.H.; Chiang, H.D. Nonlinear predictors and hybrid corrector for fast continuation power flow. IET Gener. Transm. Distrib. 2008, 2, 341–354. [Google Scholar] [CrossRef]
  14. Mori, H.; Yamada, S. Continuation power flow with the nonlinear predictor of the Lagrange’s polynomial interpolation formula. In Proceedings of the IEEE/PES Transmission and Distribution Conference and Exhibition, Yokohama, Japan, 6–10 October 2002; Volume 2, pp. 1133–1138. [Google Scholar] [CrossRef]
  15. Kim, H.T.; Lee, J.; Yoon, M.; Lee, M.J.; Cho, N.; Choi, S. Continuation power flow based distributed energy resource hosting capacity estimation considering renewable energy uncertainty and stability in distribution systems. Energies 2020, 13, 4367. [Google Scholar] [CrossRef]
  16. Alves, D.; da Silva, L.; Castro, C.; da Costa, V. Continuation fast decoupled power flow with secant predictor. IEEE Trans. Power Syst. 2003, 18, 1078–1085. [Google Scholar] [CrossRef]
  17. Dong, X.; Wang, C.; Yun, Z.; Han, X.; Liang, J.; Wang, Y.; Zhao, P. Calculation of optimal load margin based on improved continuation power flow model. Int. J. Electr. Power Energy Syst. 2018, 94, 225–233. [Google Scholar] [CrossRef]
  18. Liang, H.; Zhao, J. A New Method of Continuous Power Flow for Voltage Stability Analysis. In Proceedings of the 2021 IEEE Asia-Pacific Conference on Image Processing, Electronics and Computers (IPEC), Dalian, China, 14–16 April 2021; pp. 337–340. [Google Scholar] [CrossRef]
  19. Neto, A.B.; Filho, L.R.A.G.; Alves, D.A. Continuation Power Flow: A Parameterization Technique and Adaptive Step Size Control. In Proceedings of the 2021 IEEE URUCON, Montevideo, Uruguay, 24–26 November 2021; pp. 75–79. [Google Scholar] [CrossRef]
  20. Pourbagher, R.; Derakhshandeh, S.Y.; Hamedani Golshan, M.E. An adaptive multi-step Levenberg-Marquardt continuation power flow method for voltage stability assessment in the Ill-conditioned power systems. Int. J. Electr. Power Energy Syst. 2022, 134, 107425. [Google Scholar] [CrossRef]
  21. Alves, D.A.; da Silva, L.C.; Castro, C.A.; da Costa, V.F. Alternative parameters for the continuation power flow method. Electr. Power Syst. Res. 2003, 66, 105–113. [Google Scholar] [CrossRef]
  22. Ju, Y.; Wu, W.; Zhang, B.; Sun, H. Continuation power flow based on a novel local geometric parameterisation approach. IET Gener. Transm. Distrib. 2014, 8, 811–818. [Google Scholar] [CrossRef]
  23. Ruan, C.; Wang, X.; Wang, X.; Gao, F.; Li, Y. Improved Continuation Power Flow Calculation Method Based on Coordinated Combination of Parameterization. In Proceedings of the 2018 IEEE 2nd International Electrical and Energy Conference (CIEEC), Beijing, China, 4–6 November 2018; pp. 207–211. [Google Scholar] [CrossRef]
  24. Gao, H.; Wang, L.; Yang, D.; Cai, G. Mechanism Enhanced Data-Driven Method for Reliability Improvement of Load Margin Estimation. IEEE Trans. Power Syst. 2024, 39, 3715–3724. [Google Scholar] [CrossRef]
  25. Bento, M.E.C. Physics-Guided Neural Network for Load Margin Assessment of Power Systems. IEEE Trans. Power Syst. 2024, 39, 564–575. [Google Scholar] [CrossRef]
  26. Lee, B.; Song, H.; Kwon, S.H.; Jang, G.; Kim, J.H.; Ajjarapu, V. A study on determination of interface flow limits in the KEPCO system using modified continuation power flow (MCPF). IEEE Trans. Power Syst. 2002, 17, 557–564. [Google Scholar] [CrossRef]
  27. de Araujo, L.R.; Penido, D.R.R.; de Souza, B.C.; de Alcântara Vieira, F. Discontinuities and unstable solutions beyond the maximum load point of nonlinear unbalanced distribution systems. Electr. Power Syst. Res. 2023, 214, 108865. [Google Scholar] [CrossRef]
  28. Zhang, X.P.; Ju, P.; Handschin, E. Continuation three-phase power flow: A tool for voltage stability analysis of unbalanced three-phase power systems. IEEE Trans. Power Syst. 2005, 20, 1320–1329. [Google Scholar] [CrossRef]
  29. Zhou, Y.; Zhang, J.; Gao, W. Fast Calculation Method for Continuous Power Flow of Microgrid Based on Levenberg-Marquardt Algorithm. IEEE Access 2023, 11, 49578–49586. [Google Scholar] [CrossRef]
  30. Colombari, L.F.S.; Kuiava, R.; Peric, V.; Ramos, R.A. Continuation Load Flow Considering Discontinuous Behaviors of Distribution Grids. IEEE Trans. Power Syst. 2019, 34, 3476–3483. [Google Scholar] [CrossRef]
  31. Nirbhavane, P.S.; Corson, L.; Rizvi, S.M.H.; Srivastava, A.K. TPCPF: Three-Phase Continuation Power Flow Tool for Voltage Stability Assessment of Distribution Networks with Distributed Energy Resources. IEEE Trans. Ind. Appl. 2021, 57, 5425–5436. [Google Scholar] [CrossRef]
  32. Zeng, L.; Chiang, H.D.; Neves, L.S.; Alberto, L.F.C. On the accuracy of power flow and load margin calculation caused by incorrect logical PV/PQ switching: Analytics and improved methods. Int. J. Electr. Power Energy Syst. 2023, 147, 108905. [Google Scholar] [CrossRef]
  33. Wang, T.; Wang, S.; Ma, S.; Guo, J.; Zhou, X. An Extended Continuation Power Flow Method for Static Voltage Stability Assessment of Renewable Power Generation-Penetrated Power Systems. IEEE Trans. Circuits Syst. II Express Briefs 2022, 71, 1. [Google Scholar] [CrossRef]
  34. Zhang, X.; Shin, D.; Son, Y.; Woo, H.; Kim, S.Y.; Choi, S. Three-Stage Flexibility Provision Framework for Radial Distribution Systems Considering Uncertainties. IEEE Trans. Sustain. Energy 2023, 14, 948–961. [Google Scholar] [CrossRef]
  35. Zhang, C.; Liu, Q.; Zhou, B.; Chung, C.Y.; Li, J.; Zhu, L.; Shuai, Z. A Central Limit Theorem-Based Method for DC and AC Power Flow Analysis Under Interval Uncertainty of Renewable Power Generation. IEEE Trans. Sustain. Energy 2023, 14, 563–575. [Google Scholar] [CrossRef]
  36. Yoon, M.; Cho, N.; Choi, S. Analysis of temporary overvoltage due to inverter-based distributed generation in networked distribution systems. Appl. Energy 2023, 341, 121059. [Google Scholar] [CrossRef]
  37. Cho, J.; Kim, H.; Ryu, H.; Son, Y.; Choi, S. Analysis of distributed power generation forecasting model for power distribution planning. Trans. Korean Inst. Electr. Eng. 2021, 70, 1248–1262. [Google Scholar] [CrossRef]
  38. Zhang, X.; Woo, H.; Choi, S. An interval power flow method for radial distribution systems based on hybrid second-order cone and linear programming. Sustain. Energy Grids Netw. 2023, 36, 101158. [Google Scholar] [CrossRef]
  39. Li, X.; Zhao, J.; Liang, H.; Xu, J. Application of an Improved Continuous Power Flow Method in Voltage Stability Analysis. In Proceedings of the 2019 6th International Conference on Systems and Informatics (ICSAI), Shanghai, China, 2–4 November 2019; pp. 244–248. [Google Scholar] [CrossRef]
  40. Kuroda, E.; Watanabe, M.; Kato, D.; Saito, N.; Yatsu, M. Fast computation method of static voltage stability using geometric parameter adjustment for the continuation power flow. Electr. Eng. Jpn. 2021, 214, e23296. [Google Scholar] [CrossRef]
  41. Baran, M.; Wu, F. Network reconfiguration in distribution systems for loss reduction and load balancing. IEEE Trans. Power Deliv. 1989, 4, 1401–1407. [Google Scholar] [CrossRef]
  42. Das, D. Optimal placement of capacitors in radial distribution system using a Fuzzy-GA method. Int. J. Electr. Power Energy Syst. 2008, 30, 361–367. [Google Scholar] [CrossRef]
  43. Das, D.; Kothari, D.; Kalam, A. Simple and efficient method for load flow solution of radial distribution networks. Int. J. Electr. Power Energy Syst. 1995, 17, 335–346. [Google Scholar] [CrossRef]
  44. Khodr, H.; Olsina, F.; Jesus, P.D.O.D.; Yusta, J. Maximum savings approach for location and sizing of capacitors in distribution systems. Electr. Power Syst. Res. 2008, 78, 1192–1203. [Google Scholar] [CrossRef]
  45. Birchfield, A.B.; Xu, T.; Gegner, K.M.; Shetye, K.S.; Overbye, T.J. Grid Structural Characteristics as Validation Criteria for Synthetic Networks. IEEE Trans. Power Syst. 2017, 32, 3258–3265. [Google Scholar] [CrossRef]
Figure 1. Structure of the typical P-V curve.
Sustainability 16 07595 g001
Figure 2. The concept of the CPF procedure.
Sustainability 16 07595 g002
Figure 3. Flowchart of the proposed hybrid parameterization.
Sustainability 16 07595 g003
Figure 4. The KEPCO 148-bus test feeder.
Sustainability 16 07595 g004
Figure 5. CPU time histogram for each parameterization.
Sustainability 16 07595 g005
Figure 6. Impact of step size on CPU time (top) and percentage error (bottom) for different parameterization methods.
Sustainability 16 07595 g006
Figure 7. Computation time and percentage error as a function of step size for the first and second parameterization methods.
Sustainability 16 07595 g007
Figure 8. Bar plot showing the average CPU times for different grid scales.
Sustainability 16 07595 g008
Table 1. Average performance of each parameterization.
ParameterizationPercentage Error (%)CPU Time (s)
Natural0.78220.12866
Arc-length 1.078 × 10 5 0.23263
Pseudo arc-length 1.078 × 10 5 0.17362
Natural + arc-length 1.020 × 10 5 0.15645
Table 2. Comparative performance of parameterization combinations.
First
Parameterization
Second
Parameterization
Percentage Error
(%)
CPU Time
(s)
Arc-lengthNatural 1.3645 × 10 4 0.17964
Arc-lengthArc-length 1.1524 × 10 5 0.17833
Arc-lengthPseudo arc-length 1.1525 × 10 5 0.18789
Pseudo arc-lengthNatural 3.7523 × 10 4 0.16849
Pseudo arc-lengthArc-length 1.1381 × 10 5 0.16346
Pseudo arc-lengthPseudo arc-length 1.1381 × 10 5 0.16023
NaturalNatural2.98250.10397
NaturalArc-length 1.2147 × 10 5 0.13917
NaturalPseudo arc-length 1.2143 × 10 5 0.14294
Table 3. Average CPU times for different grid scales.
Test CaseIEEE
33-Bus
IEEE
69-Bus
85-Bus
[43]
141-Bus
[44]
200-Bus
[45]
Natural0.03150.03560.03440.07250.2875
Arc-length0.04210.04890.06470.12330.8394
Pseudo arc-length0.03980.04600.06360.10880.6621
Natural + arc-length0.04060.04660.05530.09620.6150
Disclaimer/Publisher’s Note: The statements, opinions and data contained in all publications are solely those of the individual author(s) and contributor(s) and not of MDPI and/or the editor(s). MDPI and/or the editor(s) disclaim responsibility for any injury to people or property resulting from any ideas, methods, instructions or products referred to in the content.

