Abstract
Evaluation of a recreational walking environment for the elderly is an essential method for planning intervention in constructing a walking environment. The Stated Preference method, discrete choice model, Spearman correlation analysis, and logistic regression model are used to build the evaluation index system of the leisure walking environment for the elderly and obtain its corresponding weight value. The study also explored the differences in preferences for recreational trails among older adults with different personal characteristics. It found that the Stated Preference method is a well-established method for evaluating the quality of recreational walking environments for older adults. Older walkers have shown a heightened sensitivity to certain factors, such as the degree of street shading, effective sidewalk width, street leveling, traffic volume, street interface openness, percentage of green interface, service facility density, and commercial storefront density. Understanding these sensitivities can help us design more empathetic and age-friendly walking environments. Among them, older adults with poorer health preferred street environment factors with less traffic, higher street leveling, and better service facilities. Quantitatively evaluating the recreational walking environment for the elderly provides a new way of thinking from a behavioral perspective to enhance its sustainability and age-friendliness.
1. Introduction
With the acceleration of global population aging, the quality of life and physical and mental health of the elderly have become the focus of social attention. As a special group, the elderly display significant differences from other age groups in their environmental perception, needs, and preferences. In the urban environment, streets are the most frequently used public spaces in daily life. The design and configuration of these streets have a direct and significant impact on the quality of outdoor activities for the elderly. Factors such as safety, comfort, convenience, and aesthetics all play a crucial role in determining the suitability of these spaces for the elderly. Therefore, optimizing the street environment to make it more suitable for the leisure needs of the elderly can both improve their quality of life and promote the vitality of the community and social harmony.
China has one of the largest populations in the world. According to statistics, the elderly population aged 60 and above accounted for about 19.5% of the total population in 2023, and this proportion is expected to continue growing [1]. The rapid aging of the population has precipitated numerous challenges, including a surge in demand for elderly care services, a strain on medical resources, and mounting pressure on social security. Furthermore, the accumulation of historical debt has led to a severe shortage of public space in age-friendly communities [2,3]. Since the founding of the People’s Republic of China, China’s response to the aging problem has gone through many stages. Initially relying on family pensions, it began to promote basic old-age insurance for urban workers and a new rural social old-age insurance in the 1990s. It also promoted the construction of old-age service facilities and encouraged home-based and community old-age care in the 2000s. After 2010, the government increased its investment in smart aging and healthcare integration, and issued several policies and plans. However, challenges remain, including a lack of elderly care facilities, uneven service quality, psychological health issues among the elderly, incomplete policy coverage, limited service functions, insufficient service radius, and inconsistent quality. In recent years, although new pension models such as old age care real estate have gradually emerged, a centralized institutional pension is not the mainstream, and elderly people who are cared for at home have an urgent need of an improved community space environment. In particular, a community-friendly street environment is crucial for the elderly to walk for leisure, which not only improves their quality of life but also promotes physical health and social interaction. Therefore, further improving the community environment, increasing walking facilities, and ensuring that the elderly can carry out daily activities safely and comfortably is an important direction for dealing with aging in the future. In recent years, the influence of the street environment on the quality of life of the elderly has aroused extensive attention from academia, and the related research has gradually increased. The literature shows that a good street environment not only contributes to the physical health of the elderly but also positively impacts their psychological and social levels. For example, the research of Li Mingkai and Shi Wei shows that the street’s walking environment is closely related to the daily outdoor activities of the elderly, and directly affects their travel frequency and travel path choice [4].
Other studies have further revealed the multidimensional influencing factors of the street environment. Greening and landscape design can provide the elderly with psychological relaxation and pleasure, and increase their enthusiasm for outdoor activities [5]. The width of pedestrian paths and barrier-free facilities are also crucial to the convenience and sense of security of the elderly [6]. In addition, street lighting and traffic safety measures significantly affect the walking willingness and comfort of the elderly [7].
In the research on pedestrian environment assessment for the elderly, many scholars have tried to develop and apply assessment tools to quantify the attractiveness of different street environments to the elderly. Alfonzo’s study surveyed elderly people’s street walking experience and found that comfort and safety were decisive factors [8]. Zheng Fei and Wang Shan et al. explored the relationship between street design, neighborhood atmosphere, and the walking behavior of the elderly by using a multifaceted model. They proved that cheerful street design could significantly improve the walking environment experience of the elderly [9].
In addition to the above, this study summarizes a large number of previous studies (Table 1). Combining these studies, it can be seen that the influence of the street environment on elderly people’s leisure path preference is extensive and complex. This study aims to provide a solid basis for future street design and urban planning through an in-depth analysis of the correlation between various characteristics of the street environment and the choice of leisure paths for the elderly.

Table 1.
Street environment indicators affecting the walking behavior of the elderly.
1.1. Walking Behavior Evaluation Method
From the methodological level of pedestrian environment assessment, the researchers used a variety of quantitative and qualitative methods to evaluate pedestrian-friendly street designs and facilities for the elderly. These assessment methods included questionnaires, field observations, GIS (Geographic Information System) techniques, and environmental review indicators.
Questionnaires are usually used to collect older adults’ subjective evaluations of their walking environment, including their feelings about the flatness of sidewalks, the adequacy of street lighting, the safety of traffic, and the availability of public seats. For example, Zhong Tao assessed elderly people’s satisfaction with the walking environment through a questionnaire survey and compared these data with actual records of walking behavior to assess the impact of environmental factors on walking frequency [24]. Field observation is used to directly record the actual conditions in the street environment, such as the maintenance of sidewalks, the clarity of traffic signs, and the overall cleanliness of streets [25]. This method can provide more objective environmental data that can be used to analyze the relationship between environmental characteristics and walking activity in older adults. GIS technology is used to more accurately measure the physical characteristics of the street environment, such as sidewalk width, actual walking distance from public facilities, and street connectivity [26]. These data helped the researchers quantify the convenience and safety of walking environments and analyze how these factors affect walking choices in older adults. Environmental review indicators, such as the Pedestrian Environment Index (PEI) or Walkability Index, take into account several factors, such as density, connectivity, and land use mix, to assess an area’s walkability. These indicators are often combined with GIS data and on-site assessment results to provide an overall score of how age-friendly a street environment is.
The combined use of these evaluation methods can provide city planners with comprehensive data support to help them design and improve more pedestrian-friendly environments for older adults. Through this multidimensional assessment, the key issues affecting the walking activities of the elderly can be more effectively identified and resolved.
1.2. An Evaluation Method of Walking Path Choice Preference
Two main evaluation methods can be used to explore people’s preferences for walking path selection: Revealed Preference (RP) and Stated Preference (SP). Both methods take data differently and use modeling tools to analyze and infer people’s preferences for walking environments.
The RP method reveals preference through actual observed data [27]. Specifically, this method records people’s actual walking path choices in daily life, analyzes the characteristics of these paths, such as length, surrounding environment, and convenience facilities, and compares these actual paths with the theoretical shortest or optimal paths [28]. Through this comparison, it is possible to explore people’s preferences for different walking path characteristics in real-world environments.
In contrast, the SP method obtains data by constructing a virtual walking scenario. The researchers designed a series of hypothetical scenarios with different path characteristics and asked respondents which path to choose. Based on these choices, a discrete choice model can be built to analyze the influence of different path characteristics on people’s choices, and further speculate which factors play a crucial role in walking path selection [29]. In addition, the SP method can indirectly assess people’s importance to environmental features by asking respondents about their willingness to pay for specific walking environment improvements.
The RP method faces some challenges in application. First, it can only reflect people’s choice of known or common paths, but this method may need to provide complete data for potential and insufficiently understood path options [30,31]. Second, multiple paths may have overlapping or similar starting and ending points, which may violate the choice independence assumed in discrete choice models. At the same time, although the SP method provides a broader scope for exploration, it relies on hypothetical scenarios, which can lead to the importance of specific environmental features being overestimated or underestimated [32]. In addition, respondents’ choices may be limited by their imagination or understanding of the virtual situation, which may affect the accuracy of the data. However, due to the relatively low cost of data acquisition, and the advantages of limiting the selection set through experimental design and avoiding the multicollinearity between environmental attributes, the SP method has been more widely used [33]. At present, the narrative preference method has been applied in the field of urban planning to assess people’s preferences for space, facilities, environment, etc. Existing studies on living environment and quality [34,35,36], walking environment [37,38], recreational environment [39,40], virtual scene [41], and traffic environment [42], etc., reflect the effectiveness of this method in analyzing different populations’ preferences for spatial elements selection, and it is very suitable for analyzing people’s choice of areas. The use preference of the park accurately guides the space design and facility configuration of the small-area park.
In summary, the SP method has several significant advantages compared with the RP method in the study of walking path selection:
- (1)
- More comprehensive application range: the SP method is not limited by the existing environment and can explore possible changes in the walking environment, providing forward-looking data for planning;
- (2)
- Exploring non-market factors in depth: the SP method can assess the impact of non-market factors such as aesthetics and comfort, which are often difficult for RP methods to separate from real-world behavior directly;
- (3)
- Avoid real-world constraints: Because existing path choices limit RP, they may not fully reveal people’s valid preferences. The SP method allows respondents to express their valid preferences without the constraints of reality through virtual scenarios;
- (4)
- Flexibility and innovation: the SP method allows researchers to design experimental scenarios with various variables, which helps to explore and test new walking path design concepts creatively.
1.3. Leisure Behavior of the Elderly
With the intensification of the global population aging trend, the quality of life of the elderly has become one of the hot issues of social concern. As an essential part of improving the quality of life, leisure activities play an important role in the physical and mental health of the elderly.
Leisure behavior refers to the various non-work activities individuals carry out after completing the labor and responsibilities necessary for daily life. For the elderly, leisure activities are a pastime and a way of social participation and self-realization.
The existing literature indicates that the elderly’s outdoor activities are mainly concentrated in three areas: the basic life circle, the expanded neighborhood circle, and the city circle. Their activities occur in two primary fields: individual fields (such as quiet areas for meditation or rest) and group fields (typically involving activities with five or more people). There is a close communication distance between physiological function decline (it can be carried out in any public space) and integrated activity areas (such as parks, green spaces, squares, outdoor chess and card tables, etc.) [43].
Since the authors are located in a cold area, the information about the elderly in the preliminary investigation is mainly focused on the cold area. Preliminary observations showed that the elderly mainly engage in outdoor activities between 6 p.m. and 11 p.m., and between 2 p.m. and 5 p.m. during summer and transitional seasons, and between 9 a.m. and 3 p.m. in winter. Additionally, their outdoor activity times and areas vary with the season, age, health, and living environment. Statistics have found that older people’s choice to participate in leisure activities is often influenced by various factors, including but not limited to, the need for social interaction, physical health status, personal interests and hobbies, and financial status. Their social support system can significantly influence their choice of leisure activities.
Numerous studies have shown that participation in leisure activities can significantly improve life satisfaction, reduce symptoms of depression and anxiety, and improve physical health in older adults. In addition, group activities can enhance the social sense of belonging and social skills of the elderly [44]. Therefore, this paper divides the leisure behaviors of the elderly into two categories and summarizes the expected path duration of various leisure behaviors according to the pre-survey (the pre-survey includes an interview record, an observation, and a questionnaire) and literature review, as one of the influencing factors of the street environment in the following paper (Table 2).
Table 2.
General classification of leisure behavior of the elderly.
1.4. Research Purpose
Given this context, developing a walking environment evaluation system based on the behavioral needs and preferences of the elderly is crucial for creating elder-friendly walking spaces, and is a key approach for urban planning to support elderly mobility. However, due to the need for more theoretical understanding, the planning practice can often only mechanically copy the practice of typical cities at home and abroad. It can not accurately evaluate the degree of age-friendly walking environment and the effectiveness of renovation measures, and the effect could be better.
Building on domestic and international studies, this paper aims to explore evaluation methods and an index system for the elderly’s leisure walking environment through empirical research, with the goal of enriching theoretical understanding and examining how different street environments influence the elderly’s walking perceptions. At the same time, the difference in preference choice for street environment factors among the elderly with different personal characteristics was explored. By using the stated preference method, discrete choice model, Spearman correlation analysis, and logistic regression model, the evaluation index system of the elderly leisure walking environment was constructed, and its corresponding weight value was obtained (Figure 1). The purpose was to explore which street environment will impact the leisure path preference of the elderly and to conduct a study on the relationship between the walking behavior of the elderly and the street environment. At the same time, it provides a reference for the reconstruction planning of a friendly walking environment for the elderly.
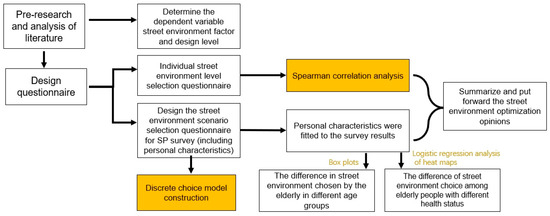
Figure 1.
Research framework.
2. Materials and Methods
The SP method was used to design a virtual walking environment choice behavior survey. Combined with a discrete choice model analysis, the influence of various factors on the elderly’s walking environment choice behavior was inferred, and then the walking environment evaluation system was constructed. First, the environmental factors of this study were determined by the results of existing research and pre-investigation. Second, the SP survey experiment design was used to generate the selection scheme, expressed in pictures. Third, by establishing a discrete choice model to analyze the questionnaire, model-fitting results can obtain the relative preference degree of the elderly for different walking environmental factors. Fourthly, the third-party libraries of Seaborn and Matplotlib in Python version 3.10. Available at: https://www.python.org/ (accessed 10 June 2024). were used to draw the box plot and heat map of the distribution of the selection of street environment by the elderly with different personal characteristics, explaining the differences in the selection of street environment by the elderly with different personal characteristics (Figure 1).
2.1. Determination and Level Setting of Street Environmental Factors
Considering the principles of typicality, perceptibility, and measurability, and based on a literature review and pre-investigation, ten walking environment factors of concern to the elderly were identified, with their levels defined (Table 3). They are effective sidewalk width, street smoothness, street shade, green border proportion, traffic flow, density of commercial facilities, density of service facilities, street interface openness, pedestrian flow, and path length.
Table 3.
The selection and level setting table of street environment factors.
2.2. Questionnaire Survey Design
The success of the SP investigation mainly depends on the design of the investigation experiment. Following the discrete choice model principle, where only differences in factor levels influence selection, this study’s innovative design of environmental factor combinations significantly reduces the number of options and improves investigation efficiency [45]. In the generation stage of scheme selection, if each horizontal combination of factors is comprehensively arranged and combined, a large number of schemes will be generated, and the interviewees will need to judge too many times, and there will be many unnecessary repetitions. To overcome this shortcoming, most studies often use the Orthogonal Design method. The main feature of orthogonal design is that each test point is “evenly dispersed and neatly comparable” within the experimental range. On the one hand, it can significantly reduce the number of options generated and improve investigation efficiency. On the other hand, it can better ensure the generated virtual paths’ evenness, representativeness, and operability [46].
The questionnaire can be expressed in graphic and literal description methods, each of which has advantages and disadvantages [47]. The graphical method of using pictures to express the walking environment information for interviewees to choose from is intuitive and straightforward. However, it is difficult to determine whether the interviewees can accurately capture all the information to be expressed in the pictures, and there is also the possibility of deviation between information expression and interviewees’ understanding [48]. While the textual description is more precise and accurate in conveying meaning, it places the interviewees in an unnatural decision-making environment, not through perception, but through translating words into imagination. Especially in the case of more factors to consider, it is easy to increase the difficulty of decision-making. In this study, it was found through the network pre-survey that the accuracy of the model constructed by the illustrated questionnaire was higher than that of the simple text questionnaire. Therefore, this study also innovates by adopting the form of an illustrated questionnaire for the formal survey.
This paper is divided into two kinds of questionnaire. The first one only allowed the interviewed elderly people to choose different levels of street environment elements. Each older adult answered ten questions to determine which level of the 10 street environments they preferred when walking (Table 3), to calculate whether there was a correlation among various environmental street elements that influenced elderly people’s choices. Therefore, Table 3 was randomly distributed to 425 older adults as a questionnaire, and 400 questionnaires were effectively recovered.
The other questionnaire asked respondents to choose a preferred walking route based on the characteristics of two relative walking environment scenarios, or they could choose neither (Table 4). The environmental elements of the road section are represented by the drawing software Sketch Up version 2019., and ICONS represents the path length (Figure 2). Therefore, this paper used an orthogonal design to generate sixteen scenarios from ten influence factors (nine factors were set at two levels, and one factor was set at three levels). To reduce the decrease in answering efficiency caused by the large number of options, the sixteen options were divided into two questionnaires, with eight groups of options for each questionnaire. At the same time, ten impact factors were graphically displayed, 400 questionnaires were distributed, and 384 valid questionnaires were recovered. In addition to the design of the perceived preference questionnaire, this paper also added the personal characteristics of the elderly: age, gender, and health status (Table 5).
Table 4.
SP Questionnaire (take Questionnaire A as an example).
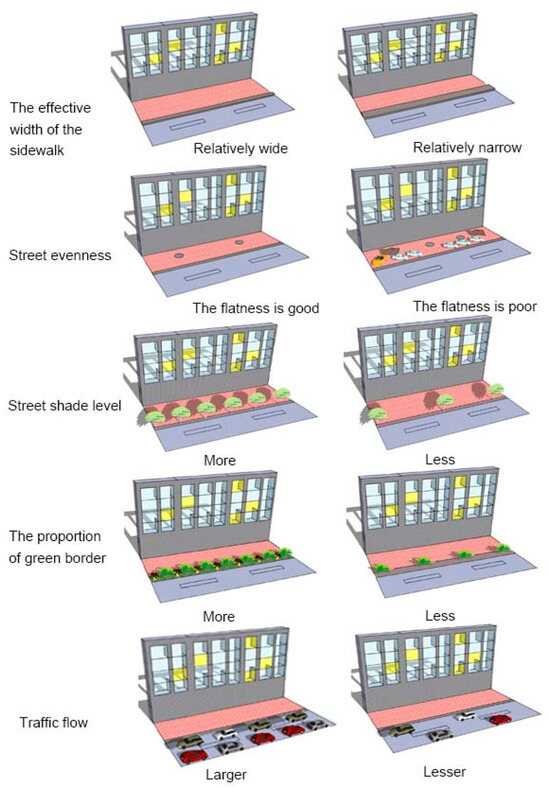
Figure 2.
Questionnaire diagram (Take Diagram 1 as an example).
Table 5.
Design of personal characteristics questionnaire for the elderly.
2.3. Model Construction of Correlation of Street Environmental Factors
Correlation analysis is a statistical method used to assess the strength and direction of a linear relationship between two or more variables. The aim is to identify and quantify correlations between different variables by providing a basis for further analysis, forecasting, and decision-making. Correlation analysis quantifies the linear relationship between two variables by calculating correlation coefficients (such as Pearson) [49]. The value of the correlation coefficient ranges from −1 to 1, where 1 means an utterly positive correlation, −1 means an entirely negative correlation, and 0 means no correlation. This helps researchers understand the interactions between different variables. Although correlation analysis does not establish causality, it provides important clues to explore potential causality [50]. Based on the findings of significant correlations, researchers can design further experiments or longitudinal studies to verify and determine causality. By understanding the critical variables associated with user experience and their correlations, correlation analysis helps design and optimize the environment to improve user satisfaction and usage.
According to the Shapiro–Wilk test, all the recovered questionnaire data had a value of less than 0.05, which did not conform to a normal distribution. Therefore, this paper adopted Spearman’s rank correlation coefficient. The Spearman correlation analysis is a non-parametric statistical method used to evaluate the monotonic relationship between two variables (i.e., whether the variables show a consistent trend of increase or decrease). Unlike the Pearson correlation coefficient, the Spearman correlation analysis does not assume a linear relationship or normal distribution of data, so it is suitable for processing non-linear and non-normal data. Spearman’s correlation coefficient ( or rs) measures a monotone relationship by ranking two variables and calculating the correlation coefficient between their ranking values. Spearman’s correlation coefficient ranges from −1 to 1. The coefficient ρ = 1 indicates a complete positive correlation, that is, an increase in another variable always accompanies an increase in one variable; ρ = −1 indicates a decrease in the other variable which always accompanies a perfect negative correlation, i.e., an increase in one variable. ρ = 0 indicates no correlation, and there is no monotonic relationship between the two variables. Its calculation formula is as follows:
where is the difference in ranking of the i-th observation of the two variables, and n is the number of observations.
2.4. Construction of the Discrete Choice Model
A Discrete Choice model is a statistical model used to analyze an individual’s behavior when choosing between discrete options (i.e., a finite number of choices) [35]. Such models are often used in fields such as economics, market research, and transportation planning [51] to understand and predict individuals’ decision-making processes. The basic idea of the discrete choice model is that individuals, when faced with multiple choices, will make decisions based on the utility of each choice. Utility can be viewed as the degree to which an individual prefers a choice. Discrete choice models predict individual choices by comparing the utility of each option [52].
The SP method analyzes the relative importance of the influence of various spatial elements of the street through the elderly’s preference choice of leisure paths, which conforms to the random utility theory, the basic theory of the discrete choice model. The utility formula of the discrete choice model adopted in this paper is as follows:
In the formula, V is the total utility obtained by tourists in the street space; β1–10 is the fitting coefficient required by the model; is the effective width of the sidewalk; is street roughness; is street shade degree; is the proportion of green boundary; is the traffic volume; is consumer store density; is the density of service facilities; is the street interface openness. According to the above principles, this study established a discrete selection model to judge the weight relationship of various spatial elements and used the analysis software STATA version 15.1. to model fit the effective questionnaire. The principle is as follows:
First, the data obtained from the questionnaire (Table 3) were coded, and the numbers 1–3 represented different level values for each scene element. In the comparison question group, according to tourists’ preference, the preferred spatial element combination choice was “1”, and the scene without choice was marked as “0”. Each tourist sample was judged by two choices, 1 for eight times.
2.5. Construction of Logistic Regression Model
The logistic regression model performs classification by estimating the relationship between input features and output categories [53]. The basic idea is to map linear regression output to a probability value between 0 and 1 through a logistic function, thus achieving classification. The output of the logistic regression model is probability, and the coefficient can be directly interpreted as the direction and magnitude of each feature’s influence on the classification result. The explanatory nature of logistic regression is an essential advantage for application scenarios where the model decision process needs to be understood and explained, such as medical diagnosis and credit scoring [54]. This paper uses a logistic regression model to explain how elderly individuals with different health conditions choose street environment factors and suggests tailored sustainability planning for various groups of older adults. This paper explains the differences in the selection of street environment factors by the elderly with different health conditions through the construction of a logistic regression model. It proposes more specific sustainability planning for the street environment for different groups of elderly people.
First, the data need to be pre-processed and features extracted, which includes processing missing values, standardization, category coding, etc. The selection of features is based on their correlation to the target variable (health group) and the performance of the model. Secondly, the processed data set is input into the logistic regression model for training. Based on the training data set, the model learns how each feature influences the classification outcome (health group) and generates the corresponding coefficient. The coefficient generated by the logistic regression model represents the direction and magnitude of each feature’s influence on the classification result. A positive coefficient indicates that features have a positive impact on classification results, a negative coefficient indicates a negative impact, and the greater the absolute value, the more significant the impact.
The calculation formula used is:
Logistic regression model output probability formula:
where, xi, is the eigenvector of the i-th sample, and β is the coefficient vector.
Logarithmic likelihood function:
where is the label of the first sample (0 or 1).
Gradient of logarithmic likelihood function:
Coefficient updating formula (gradient descent method):
where α is the learning rate.
After updating the coefficient several times, the final coefficient β makes the logarithmic likelihood function reach the maximum value. In other words, the coefficients of the logistic regression model are obtained by optimizing the log-likelihood function. Therefore, the feature importance coefficient is:
3. Result
3.1. Correlation of Street Environment Factors
As shown in the Figure 3, the correlation coefficient between effective sidewalk width and street smoothness is 0.48, which means that elderly people who choose wider sidewalks often choose smoother streets. This suggests that these respondents have a common preference for a broad and level street environment, possibly because it is easier for them to walk and move in such an environment. The correlation coefficient with Pedestrian Flow is −0.46, which means that elderly people who choose wider sidewalks tend to choose streets with a lower pedestrian flow. This indicates that they may prefer quiet and uncrowded environments; spacious sidewalks make them feel safer and more comfortable. The correlation coefficient between Street Smoothness and Shade Coverage is −0.49, meaning that older people who choose smoother streets tend to choose streets with less shade. This may be because streets with more shade tend to have more trees and less level ground, while open areas are more level. The correlation coefficient with Consumer Shop Density is 0.35, meaning that older people who choose smoother streets also tend to choose areas with higher consumer store density. This indicates that they prefer places with better facilities and commercial activities, which are generally better maintained and have smoother streets. The correlation coefficient between street Shade Coverage and Green Boundary Ratio is −0.48, which means that older adults who choose more shade often do not choose areas with more green borders. This may be because, although more green borders exist, they may need to provide more shade, or the species and layout of trees in these areas are different. The correlation coefficient with Street Openness was −0.34, meaning that older people who chose more shade tended not to choose areas with higher street openness. This indicates they prefer closed, shaded environments, and open streets generally have less shade. The correlation coefficient between the Green Boundary Ratio and Traffic Flow is −0.46, which means that elderly people who choose more green boundaries often do not choose areas with large traffic flow. This indicates that they may prefer a quieter and greener environment. Places with heavy traffic are usually noisy and heavily polluted. The correlation coefficient with Street Openness is 0.44, which means that elderly people who choose more green borders also tend to choose areas with high street openness. This indicates that they prefer open and green environments because these places have good air and are more visually comfortable. The correlation coefficient of −0.38 between traffic volume and consumer store density suggests that older adults who prefer low traffic areas tend to choose locations with high store density. This indicates a preference for quiet, low-traffic areas that still offer convenient shopping options. The correlation coefficient of 0.41 between store density and street openness indicates that elderly individuals who prefer areas with high store density also tend to choose locations with high street openness, suggesting a preference for open, commercially dense areas that offer a better shopping experience.
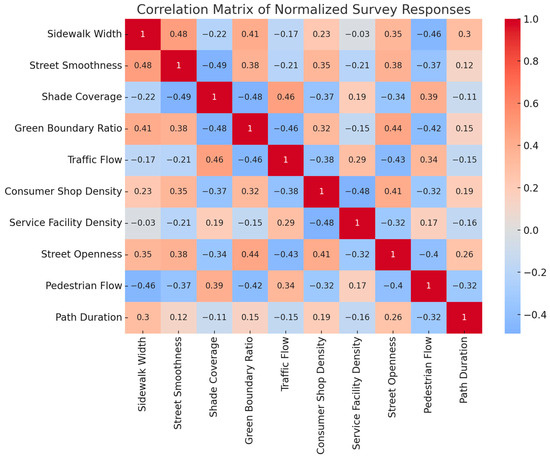
Figure 3.
Correlation heat map of street environment factors affecting walking behavior preference of elderly people.
3.2. Discrete Selection Model Results and Factor Importance Analysis
The above correlation analysis shows that different combinations of each street environment may have a particular impact on the elderly’s preference for leisure paths. Therefore, to better analyze what kind of street environment has the most significant impact on the walking behavior of the elderly and to build sustainable street environment development, we asked the elderly respondents to choose again through the combination of street environment factors.
Model fitting was carried out on 384 valid questionnaires collected by STATA, and the results are shown in Table 6 (“***” indicates a significance level of 0.01, meaning that the results are significant at a 99% confidence level. This means that the p-value is less than 0.01, indicating that the relationship between the variable and the response variable is very significant. “**” indicates a significance level of 0.05, meaning that the result is significant at a 95% confidence level. This means that the p-value is less than 0.05, indicating a significant relationship between the variable and the response variable). R2 is 0.2647, indicating that the overall fitting result of the model is good. Experience suggests that if the Conditional Logit model has many elements in the field of building planning, and if it is more significant than 0.1, it is acceptable. It is considered a high level if it is more significant than 0.2. Relevant studies generally range from 0.09 to 0.27. Most of the factors are significant at a 95% confidence level, and the significance of commercial store density is relatively low, indicating that the elderly do not pay special attention to commercial store density when they engage in leisure walking. Path duration is lower than other factors except commercial store density, indicating that the elderly’s choice of path duration is uncertain. The influence of other factors on the elderly’s choice is weaker, which is consistent with the above correlation of street environment factors, that is, in the comprehensive scene analysis, path duration may decrease or increase with a change in different street environments, that is, the degree of influence is relatively weak.
Table 6.
The fitting results of the environment choice behavior model for the elderly leisure walking.
The absolute value of the variable coefficient reflects the degree of tourists’ preference for different factors and grades, and the positive and negative values of the coefficient reflect the direction of influence of factor-level value on utility. This study’s regression results show that all factors pass the significance test at different levels.
Street shade degree, effective pedestrian passage width, and street smoothness have the most significant influence on the preference of the elderly, and all pass the test at the significance level of 0.01. The variable coefficients are 1.2012, 0.9998, and 0.7001, respectively, and the coefficients are positive. It shows that, under the same conditions, the elderly prefer these three street space elements, indicating that the elderly pay more attention to their comfort level during the process of leisure walking.
Vehicle and pedestrian flow also passed the test at the significant level of 0.01, and the variable coefficients were −0.6015 and −0.3997, respectively, and the coefficients were negative. It can be seen that the elderly are more inclined to a street environment with less vehicle and pedestrian flow. In particular, they prefer a street environment with less traffic, which reflects the elderly’s need for a safe and less noisy street environment when carrying out leisure activities.
The proportion of green boundaries passed the test at the significant level of 0.01, and the coefficient was positive, indicating that the elderly were still more inclined to choose the street environment with a better natural environment. The density of service facilities is significant at the 0.05 level, with a positive coefficient, indicating it is less critical for the elderly than other factors. The negative coefficient suggests that tourists prefer streets with dense service facilities.
Older adults’ perceptions and preferences for walking environments often depend on daily life experiences. First, the size of the traffic flow affects the walking environment’s safety. As the elderly move slowly, and it is difficult to avoid large amounts of traffic flexibly, many interviewees mentioned in the interview that they would instead take the pedestrian bridge and cross the street on the ground when crossing the intersection. They would often walk around a neighborhood to avoid the safety risks of crossing the intersection. Secondly, due to more leisure time and better light during the day, the elderly are more accustomed to walking during the day, and the summer is relatively hot; many respondents were very concerned about the shade, and the shade of trees is a kind of landscape. In addition, the size of the pedestrian flow also dramatically impacts the choice of walking environment, and the overcrowded walking environment reduces the comfort of pedestrians. Regarding the sidewalk interface, the elderly prefer streets with a more open street interface, which can provide better vision and security, and the elderly prefer open streets from which they can see the surrounding environment. The moderate density of commercial storefronts and service facilities can increase the vitality and convenience of the street, provide shopping and dining options, attract the elderly to choose such streets for leisure and walking, as well as provide a higher density of service facilities such as medical facilities, public toilets, rest areas, etc. These facilities can provide the necessary support and services to meet the various needs of older people when they are away from home.
3.3. Differences in Group Preferences
The elderly are a special group whose mobility and perception differ from the young. By analyzing the influence of individual characteristics on the choice of street environment, the needs of the elderly can be better understood, so a walking environment that better meets their needs can be designed. Therefore, the preferences of street environment elements of elderly people with different attributes were studied, and the gender, age, and health degree of different elderly people were investigated. Since elderly men accounted for the majority, 70.36%, the analysis results may be partially replaced by the whole (Table 7). The analysis results and proposed strategies should have universal significance, so only a visual analysis of the street environment choice of the elderly with different ages and different health conditions was carried out.
Table 7.
Measurement and descriptive statistics of demographic characteristics variables of the elderly who participated in the survey.
3.3.1. The Difference in Preference for Street Environment Choice among Elderly People of Different Ages
In Figure 4, choice uses color to represent the path selection. Specifically, orange (0) indicates that the path combination is not selected, and yellow (1) indicates that the path scenario is selected. The horizontal co-ordinate represents the coding of different age groups: 0 represents the elderly aged 60–65; 1 represents the elderly aged 65–70; 2 represents people over 70. The ordinate value represents the standardized value after the street environment factors are selected, and the standardized value is used to compare the distribution of different characteristics.
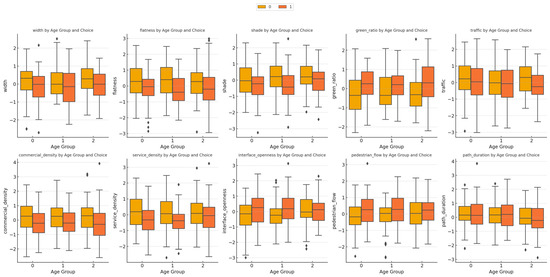
Figure 4.
Box plot of differences in street environment selection among elderly people with different age conditions. (Diamond marks often represent outliers, which can provide additional information about the distribution of the data, especially when detecting and interpreting anomalies or broad variability in the data).
Across all age groups, there was no significant difference in preferences for effective pedestrian widths between selected paths (yellow) and unselected paths (orange). The distribution of all age groups was relatively uniform, indicating that the street width had little influence on the path choice of the elderly at different ages. Street smoothness was an essential feature in all age groups. The street chosen by the path is significantly smoother, especially in age group 2. This indicates that the smoother street is more favored by the elderly over 70. This suggests that older people are more inclined to choose a flat path to avoid the inconvenience of walking. The degree of street shade is essential to all age groups. The distribution of selected street shade levels was slightly higher in all age groups, especially in groups 1 and 2. This suggests that well-shaded street environments positively impact the path choice of older adults, especially in the summer or when the sun is intense. In all age groups, the proportion of the green boundary of the selected path was significantly higher than that of the non-selected path. This indicates that the proportion of green boundaries is an essential factor affecting the path choice of the elderly, and the elderly prefer greener walking environments. Traffic flow affected all age groups, but the effect was more uniform. The relatively low traffic flow distribution of the selected path indicates that the elderly are more inclined to choose a street with less traffic flow to ensure the safety and comfort of walking. The distribution of commercial store density was relatively uniform across all age groups, and there was no significant difference in preference between selected and unselected routes. This shows that the density of commercial stores has little influence on the route choice of the elderly. The effect of the density of service facilities was balanced in all age groups. The density of service facilities in the chosen path was slightly higher, especially in age groups 1 and 2, indicating that the older participants were, the more inclined they were to choose the path with more service facilities. The effects of street interface openness and pedestrian flow were uniform across all age groups, and there was no significant difference in the distribution of selected and unselected paths. The results showed that street interface openness and pedestrian flow had little influence on the path choice of the elderly. Path length was affected in all age groups. The distribution of path selection time was slightly higher in all age groups, especially in age group 1, suggesting that older adults may be more inclined to choose walking paths with moderate path length.
3.3.2. The Difference of Street Environment Choice Preference among Elderly People with Different Health Status
Visualization of the coefficients generated in 2.4 above. The heat map uses color depth to represent the size and direction of the coefficients (red represents positive coefficients, blue represents negative coefficients, and the darker the color, the greater the absolute value). The horizontal axis of the heat map is the health group, the vertical axis is the feature name, and the crossing point is the coefficient value of the feature in the health group (Figure 5).
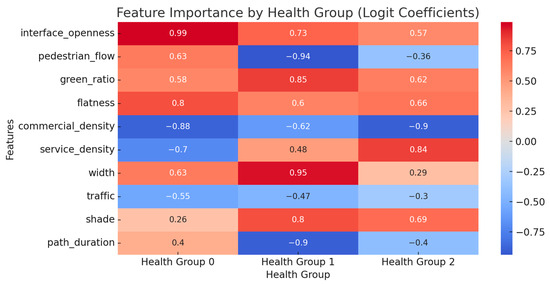
Figure 5.
The characteristic importance of street environment choice preference among elderly people with different health conditions (Logit coefficient).
The influence of street interface openness on the street environment of the elderly with different health conditions is significant and positive. Significantly, the elderly with good health status prefer a street environment with better street interface openness. The reason may be that the elderly with good health status have better physical strength and are willing to explore a more open environment. The influence of people flow on the choice of the street environment of the elderly with different health conditions is different. Only the elderly with good health status prefer the street environment with more people, possibly because the elderly with good health status have more experience socializing in a place with more people. The influence of green border proportion, street smoothness, and street shade on the choice of the street environment of the elderly with different health conditions is positive, and there are only slight differences between the preferences of the elderly with different health conditions. The influence of effective pedestrian width on the street environment choice of the elderly with different health conditions is also essential and positive, and the elderly with ordinary health conditions especially prefer a street environment with effective pedestrian width. The influence of commercial store density and traffic flow on the street environment choice of the elderly with different health conditions is negative, indicating that the elderly with different health conditions prefer a street environment with less commercial store density and less traffic flow, which indicates that the elderly with different health conditions may prefer a relatively quiet and safe street environment. The density of service facilities affects the choice of the elderly with different health conditions. From the perspective of the importance coefficient, the elderly with worse health conditions need a street environment with more convenient service facilities. As can be seen from the importance coefficient of the length of the path time, the poorer the health status of the elderly, the shorter the travel time.
In summary, the current preferences of individual characteristics for street environment factors are roughly consistent with the choices of the general group, and only street environment factors related to convenience, comfort, and safety have differences for the elderly with different health conditions. Therefore, we should comprehensively consider the elderly with different personal characteristics in street environment sustainability planning, and realize the construction of an all-inclusive and humanized sustainable development of the street environment for the elderly.
4. Discussion
This study’s analysis of the street environment emphasizes that multiple environmental factors affect the elderly’s choice of leisure path and reveals deficiencies in providing suitable street facilities for the elderly in specific areas. Our findings echo those of Wen Yantao et al. [55], who, by assessing the urban street environment, found that the elderly’s choice of leisure paths is closely related to the street greening rate and the improvement of barrier-free facilities. In addition, our results also support the study by Zhang et al. [56], which, by investigating street conditions in different neighborhoods, showed that older people are more likely to choose routes with low traffic volume and low noise. Using a quantitative analysis and field investigation methods, our study further deepened the understanding of the factors affecting the leisure path preference of the elderly. This method is similar to that adopted by Wu Yan et al. [57]. In their study, they used field research and questionnaire analysis to assess the impact of the street environment on the walking behavior of the elderly, and emphasized the importance of a good street environment in promoting the physical and mental health of the elderly. Our research expands knowledge in this area, revealing the potential and challenges of urban planning in improving leisure path choices for older adults through a more nuanced analysis of environmental factors.
In terms of specific influencing factors, our study found that the greening rate and barrier-free facilities had a particularly significant impact on the leisure path choice of the elderly. The high greening rate provides visual pleasure, improves air quality, reduces noise, provides shade, and enhances walking comfort and security for the elderly. This finding is consistent with the study by Zhao Yuxi et al. [58], who indicated that a very green street environment can significantly improve the frequency of outdoor activities and older people’s mental health.
The perfection of barrier-free facilities is also a key factor affecting the path choice of the elderly. Smooth sidewalks, reasonable slope design, and barrier-free access not only reduce the elderly’s inconvenience and risk during walking but also enhance their confidence and willingness to travel. The study by Li et al. [59] also showed that improving barrier-free facilities can significantly improve the travel satisfaction and independence of the elderly.
In addition, our study also found that the width of the road has an essential impact on the route choice of the elderly. Streets with wide paths offer more walking space and better safety, which are especially important for the elderly. This finding supports the research of Gallagher et al. [60], who, through field observation and data analysis, found that spacious street environments can effectively improve the walking comfort and security of the elderly.
Moreover, elderly people with different personal characteristics have different preferences for street environments. Age, health, lifestyle, and other factors can affect their path choice. For example, older adults in better health may be more willing to choose a path with a longer walking distance. In comparison, older adults in poorer health are more focused on accessibility and safety of the path. The study by Shuba et al. [61] also showed that the personal characteristics of the elderly largely determine their preference for the street environment.
Although the Spearman correlation analysis and logistic regression model were used in this study to explore the influencing factors of the elderly’s leisure path choice, the complex interaction between variables was not fully explored. This interaction may reveal deeper mechanisms that explain why certain environmental features disproportionately affect older adults. Taking the degree of street shade and the proportion of green borders as an example, although these two variables independently affect the path choice of the elderly, their interaction may reveal more information. For example, well-shaded streets are often associated with a high greening rate, which not only enhances visual beauty but may also improve walking comfort by improving microclimate conditions and lowering street temperatures. This compounding effect is particularly important during the hot summer months, when older adults may be more inclined to engage in outdoor activities in such environments. Further studies could test these hypotheses with a multivariable interaction effect model and assess the combined influence of different combinations of variables on routing in older adults.
In addition, the density of commercial stores, as a variable with low significance, may have an important impact on route selection in some specific situations. For example, in central urban areas, older people may be more inclined to choose commercially dense streets for social and shopping activities, while in suburban or residential areas, the impact of commercial storefront density may be relatively small. Future studies could explore the influence of variables in these specific contexts more deeply through situational analysis or hierarchical regression methods to reveal the potential importance of commercial storefront density in different urban environments.
In order to more fully understand the findings in this study, it is necessary to theoretically explore the multiple factors that older adults consider when choosing paths, and the psychological and physiological mechanisms behind them. According to the theoretical framework of environmental psychology and health geography, when the elderly choose walking paths, they are not only limited by the objective conditions of the physical environment, but are also affected by psychological comfort, security, and self-efficacy. The significant influence of street shade on the path choice of the elderly can be explained from multiple perspectives. First, from a physiological point of view, shade helps to reduce sun exposure and thus the risk of heat stroke, which is particularly important for older people who are physiologically weakened and more sensitive to extreme climates. Secondly, streets with a high degree of shade are usually accompanied by good greening, and the existence of this natural environment can reduce psychological pressure and improve emotional state. According to Ulrich’s “restored environment” theory, natural landscape can effectively improve the mental health of the elderly by providing psychological rest and recovery functions. Therefore, the combination of shade and greening not only meets the physiological needs of the elderly, but also enhances their preferences for the environment at the psychological level. The importance of smooth street surfaces in the path selection of the elderly can also be explained by the risk aversion theory. The elderly are more prone to accidental falls on uneven roads due to reduced balance and reaction speed. Therefore, the choice of smooth streets is not only a comfort consideration, but also a reflection of safety needs. The findings are consistent with the “fear-avoidance hypothesis”, which states that individuals, when they perceive a potential threat, tend to choose a safer path to avoid risk.
In summary, our street environment study not only confirms the findings of previous studies that older adults’ leisure path choice differs significantly across street environments, but also provides new insights into how older adults’ leisure path choice experiences can be more comprehensively assessed and improved by taking into account factors such as greening rate, accessibility, road width, and traffic volume. These findings provide vital information for urban planners and policymakers to help them design strategies for more friendly and inclusive street environments to improve the quality of life and well-being of older adults.
5. Conclusions
The street environment plays a vital role in urban planning and construction. A good street environment is not only an essential part of the city’s image but also a key factor in enhancing residents’ happiness in life and promoting social equity. More and more studies show that the street environment is essential to the walking behavior of the elderly in many respects, including physical health, mental health, social participation, and independent living ability. A good street environment can significantly increase the willingness and frequency of elderly people to walk, thus positively affecting all aspects. In addition, optimizing the street environment can promote the social participation and community integration of the elderly. Well-designed streets and public spaces, such as community parks, plazas, and pedestrian malls, provide older adults with more social opportunities and places to interact. By participating in community activities and interacting with neighbors, older adults can build and maintain social networks and reduce feelings of loneliness and social isolation. Good social interactions improve the quality of life of older people and enhance their social support networks and sense of community. Moreover, a good street environment has a significant positive impact on the mental health of the elderly. Very green streets, peaceful walking paths, and beautiful natural landscapes help reduce psychological stress, boost mood, and reduce symptoms of anxiety and depression. Studies have shown that activities in the natural environment can promote the release of endorphins in the brain, boosting psychological pleasure and happiness in older adults. Improving the street environment not only provides a pleasant living environment but also a psychologically soothing space for the elderly. Therefore, this study used the SP (Stated Preference) survey method, discrete choice model, Spearman correlation analysis, and logistic regression model to systematically explore the effects of street environment on older adults’ leisure path choice preferences. Our research results not only verify the importance of factors such as greening rate, barrier-free facilities, road width, and traffic volume in the street environment on the path choice of the elderly, but also reveal the difference in preferences of the elderly with different personal characteristics with regard to these factors. This research has important theoretical and practical significance for understanding how to optimize the urban street environment to improve the quality of life of the elderly.
This study systematically discussed the influence of street environment on the elderly’s leisure path selection, and verified the importance of factors such as shade degree, street smoothness, green rate, and barrier-free facilities on the elderly’s path selection. Although we discussed in detail the positive effects of these factors on walking behavior in older adults in the conclusion section, to further enhance the practical application value of this study we need to explore in more depth how these findings can be applied in practice and where future research should focus.
(1) Prioritization of street design: Urban planners should give priority to improving street shade and greening when designing age-friendly streets. Specific measures can include increasing the planting of trees on both sides of the street and setting up shading facilities, etc., to improve the street microclimate and provide a more comfortable walking environment. (2) The comprehensive promotion of barrier-free facilities: In view of the strong demand for barrier-free facilities for the elderly, city managers should strengthen the evaluation of existing street barrier-free facilities and improve the shortcomings. For example, when renovating streets, priority should be given to repairing or laying flat sidewalks, and optimizing ramp design to ensure safe and convenient access for wheelchair and walker users. (3) Regional planning differentiation: Street planning in different urban areas should take into account the differences in the health status and needs of elderly groups. In dense elderly communities, there should be more construction of barrier-free facilities, reduced traffic flow, and the creation of a quiet, comfortable walking environment. In urban centers or commercially dense areas, the accessibility of walking space can be optimized by increasing greening and shading facilities, and elderly people in better health can be attracted to participate in more outdoor activities. (4) Intelligent and data-driven planning: In future urban street planning, it is proposed to introduce smart city technology to optimize street design through real-time monitoring and data analysis. For example, using sensors and intelligent monitoring systems to monitor street temperature, noise levels, and air quality and safety, so the street environment is dynamically adjusted to the actual needs of the elderly. This data-driven approach to planning can better respond to the individual needs of older people and improve the inclusion and livability of cities. (5) In terms of policy support, the standards and requirements for the construction and renovation of barrier-free facilities should be clarified through legislation and financial subsidies, and policy preferences should be provided to encourage enterprises and social organizations to participate in construction and maintenance. At the same time, the regular inspection and maintenance of street facilities, the establishment of an effective feedback mechanism, and the timely collection and processing of elderly opinions and suggestions should be conducted. Through these comprehensive measures, urban planners and policy makers can significantly improve the street environment of the elderly, enhance their quality of life and travel safety, build inclusive and friendly urban communities, and promote sustainable urban development and social harmony.
Although this study has provided many valuable findings, there are still some limitations, which should be further explored in the following aspects of future studies: (1) Future studies should expand the sample size and geographical scope of data collection to verify the universality of research results, and they should consider more urban and regional characteristics. (2) Long-term longitudinal studies: Although the cross-sectional data used in this study revealed the correlation between the path choice of the elderly and the street environment, in order to further verify the causal relationship of these associations, future research should consider long-term longitudinal studies. This will help to observe the long-term impact of the street environment’s improvement on the path choice and quality of life of the elderly, and provide more persuasive evidence for policy making. (3) Comprehensive assessment and interdisciplinary research: Future studies may explore incorporating the comprehensive quality of the street environment into the evaluation system, taking into account not only the improvement of the physical environment, but also the impact of the socio-cultural environment, such as community belonging, social opportunities, etc. Interdisciplinary research will contribute to a comprehensive understanding of the multi-dimensional impact of the street environment on the physical and mental health of the elderly. (4) Research on individual needs: The differences in needs of different elderly groups have been preliminarily revealed in this study, but more in-depth research is still necessary. Future studies could further subdivide the elderly group and explore how the elderly with different genders, ages, health status, and living habits make path choices in different environments, so as to provide a basis for more refined urban planning. (5) Research on individual needs: The differences in needs of different elderly groups have been preliminarily revealed in this study, but more in-depth research is still necessary. (6) Experimental intervention studies: In order to better understand the actual impact of the street environment on the routing of elderly people, experimental intervention studies could be designed in the future. For example, by introducing specific environmental transformation measures in some street areas (such as increasing greening, setting up shading facilities, etc.), and conducting a comparative analysis of the path choice behavior of the elderly before and after the transformation. This kind of field experimental research can directly verify the effectiveness of environmental renovation measures and guide future urban street design practice.
In summary, this study systematically analyzed the influence of the street environment on the leisure path selection of the elderly. It put forward several optimization suggestions, which provide important references for urban planners and policymakers. These findings not only contribute to improving the quality of life and happiness of the elderly but also provide a theoretical and practical basis for building healthier, harmonious, and sustainable cities. By continuously optimizing the street environment and improving its equity and accessibility, we can effectively promote older people’s physical and mental health and social well-being, and build more inclusive and friendly urban communities.
Author Contributions
Conceptualization, J.L. and J.Z.; methodology, J.L. and J.Z.; software, J.L.; validation, J.L. and J.Z.; formal analysis, J.Z.; investigation, J.L.; resources, J.Z.; data curation, J.L.; writing—original draft preparation, J.L.; writing—review and editing, J.Z.; visualization, J.L.; supervision, J.L.; project administration, J.L. All authors have read and agreed to the published version of the manuscript.
Funding
This research received no external funding.
Institutional Review Board Statement
Not applicable.
Informed Consent Statement
Not applicable.
Data Availability Statement
Data are contained within the article.
Conflicts of Interest
The authors declare no conflicts of interest.
References
- Wei, S.; Xiong, J. Coping with Population Aging with Healthy Aging. People’s Daily Overseas Edition, 23 July 2023; p. 9. [Google Scholar]
- Pang, R.; Liu, L.; Li, Q. Structural imbalance of health resource allocation and social welfare loss under the trend of population aging. J. China Univ. Geosci. 2024, 24, 86–100. [Google Scholar] [CrossRef]
- Fleurbaey, M. Health, equity and social welfare. Ann. D’econ. Stat. 2006, 2006, 21–59. [Google Scholar] [CrossRef]
- Li, M.; Shi, W. Strategies for building elderly friendly communities from the perspective of co-building. China Constr. 2024, 7, 83–85. [Google Scholar]
- Wollaeger, H.C. Measuring Streetscape Design for Livability Using Special Data and Methods. Master’s Thesis, University of Vermont, Burlington, VT, USA, 2014. [Google Scholar]
- Yuan, Q.; Chen, Y.; Xiao, X. Environmental factors affecting cognitive health in the elderly: Based on international research progress from 2000 to 2021. New Archit. 2022, 3, 146–150. [Google Scholar]
- Jing, G.; Nan, W.Y.; Pei, W.; Yao, Y.; He, L.; Meng, Y.G. Study on the influence of Internet use on the sense of worthlessness in the elderly. China Health Policy Res. 2019, 17, 64–71. (In Chinese) [Google Scholar]
- Alfonzo, M.A. To walk or not to walk? The hierarchy of walking needs. Environ. Behav. 2005, 37, 808–836. (In Chinese) [Google Scholar] [CrossRef]
- Zheng, F.; Wang, S.; Li, D.; Zhao, Z. Discussion on the elderly living environment design. China Hous. Facil. 2004, 1, 17–21. [Google Scholar]
- Booth, M.L.; Owen, N.; Bauman, A.; Clavisi, O.; Leslie, E. Social-cognitive and perceived environmental influences associated with physical activity in older Australians. Prev. Med. 2000, 31, 15–22. [Google Scholar] [CrossRef]
- Krizek, K.J. Residential relocation and changes in urban travel: Does neighborhood-scale urban form matter? J. Am. Plan. Assoc. 2003, 69, 265–281. [Google Scholar] [CrossRef]
- Lee, C.; Moudon, A.V. Physical activity and environment research in the health field: Implications for urban and transportation planning practice and research. J. Plan. Lit. 2004, 12, 147–181. [Google Scholar] [CrossRef]
- Suminski, R.R.; Poston, W.S.C.; Petosa, R.L.; Stevens, E.; Katzenmoyer, L.M. Features of the neighborhood environment and walking by US adults. American J. Prev. Med. 2005, 28, 149–155. [Google Scholar]
- Cao, X.; Handy, S.L.; Mokhtarian, P.L. The influences of the built environment and residential self-selection on pedestrian behavior: Evidence from Austin, TX. Transportation 2006, 33, 1–20. [Google Scholar]
- Mowen, A.; Orsega-Smith, E.; Payne, L.; Ainsworth, B.; Godbey, G. The role of park proximity and social support in shaping park visitation, physical activity, and perceived health among older adults. J. Phys. Act. Health 2007, 4, 167. [Google Scholar]
- Berke, E.M.; Koepsell, T.D.; Moudon, A.V.; Hoskins, R.E.; Larson, E.B. Association of the Built Environment with Physical Activity and 0 besity in Older Persons. Am. J. Public Health 2007, 97, 486–492. [Google Scholar] [PubMed]
- Borst, H.C.; Miedema, H.M.; de Vries, S.I.; Graham, J.M.; van Dongen, J.E. Relationships between street characteristics and perceived attractiveness for walking reported by elderly people. J. Environ. Psychol. 2008, 28, 353–361. (In Chinese) [Google Scholar]
- Satariano, W.A.; Lvey, S.L.; Kurtovich, E.; Kealey, M.; Hubbard, A.E.; Bayles, C.M.; Bryant, L.L.; Hunter, R.H.; Prohaska, T.R. Lower-body function, neighborhoods, and walking in an older population. Am. J. Prev. Med. 2010, 38, 419–428. [Google Scholar] [CrossRef]
- Kelly, C.; Tight, M.; Hodgson, F.; Page, M. A comparison of three methods for assessing the walkability of the pedestrian environment. J. Transp. Geogr. 2011, 19, 1500–1508. [Google Scholar] [CrossRef]
- Su, S. Study on the Impact of Walking Environment on Travel Safety and Travel Behavior. Ph.D. Thesis, Chang’an University, Xi’an, China, 2017. [Google Scholar]
- Wu, H.; Zhang, Z.; Chen, Y.; Jiao, J. The impact of street characteristics on older pedestrians’ perceived safety in Shanghai, China. J. Transp. Land Use 2020, 13, 469–490. [Google Scholar]
- Lv, F.; Zhong, Y.; Wei, X. Study on the influence of community built environment on social interaction activities of elderly people living alone. Resid. Area 2023, 6, 52–61. [Google Scholar]
- Yang, L.; Tang, X.; Yang, H.; Shi, Y. Research on elderly people’s walking environment satisfaction and Improvement strategy of age-appropriate environment supported by machine learning. West. J. Resid. Environ. 2024, 33, 35–40. [Google Scholar]
- Tao, Z. Study on Adaptability of Sidewalk System to Elderly People; Southwest Jiaotong University: Chengdu, China, 2006. [Google Scholar]
- Qiu, Y. Campus Walking the Influence of the Travel Behavior Research. Master’s Thesis, Beijing Jiaotong University, Beijing, China, 2020. [Google Scholar]
- Peng, Z.; Akimasa, F.; Reinen, S. Application of SP survey method in traffic prediction. J. North Jiaotong Univ. 2000, 24, 29–32. [Google Scholar]
- Bovy, P.H.; Stern, E. Route Choice: Wayfinding in Transport Networks; Springer Science & Business Media: New York, NY, USA, 2012. [Google Scholar]
- Lanser, S. Modelling Travel Behavior in Multi-Modal Networks; TU Delft, Delft University of Technology: Delft, The Netherlands, 2005. [Google Scholar]
- Stinson, M.; Bhat, C. Commuter bicyclist route choice: Analysis using a stated preference survey. Transp. Res. Rec. J. Transp. Res. Board 2003, 1828, 107–115. [Google Scholar]
- Liu, J.; Zhang, R.; Meng, X.; Wang, Y.; Li, Z. Heroin Freight Mode Choice Model Based on Railway Transportation Pricing Method. Transportation Systems Engineering and Information Technology, pp. 1–11. Available online: https://kns-cnki-net.webvpn.nefu.edu.cn/kcms/detail/11.4520.u.2 0240709.0907.002.HTML (accessed on 17 July 2024).
- Xia, H.; Tang, H.; Zhong, Y.; Zhang, Z. Spatial and Temporal Characteristics of Visitors’ Landscape Preference in Protected Areas Based on Multi-Source Heteroge-neous Data. Nature Reserve, pp. 1–18. Available online: https://kns-cnki-net.webvpn.nefu.edu.cn/kcms/detail/33.1417.S.20240626.1609.002.html (accessed on 17 July 2024).
- Train, K.E. Discrete Choice Methods with Simulation; Cambridge University Press: Cambridge, UK, 2003. [Google Scholar]
- Sheng, Y. Research on Space and Facility Use preference of pocket park: Based on the Narrative Preference Method (SP method)//Urban Planning Society of China. People’s City, Planning Empowerment. In Proceedings of the 2023 Annual Conference on Urban Planning in China (05 Application of New Technologies in Urban Planning). Guangzhou Urban Planning, Survey and Design Institute, Wuhan, China, 23 September 2023; p. 10. [Google Scholar]
- Qian, Z.; De, W.; Wei, Z. Research on urban residential environment quality assessment method based on narrative preference method. Sci. Geogr. Sin. 2013, 33, 8–15. [Google Scholar]
- Fang, J.; Wang, D.; Zhu, W.; Song, S. Study on recreation preference of Shanghai residents in country parks based on SP method. Chin. J. Landsc. Archit. 2016, 32, 50–55. (In Chinese) [Google Scholar]
- Jaung, W.G.; Carrasco, L.R.; Shaikh, S.F.E.A.; Tan, P.Y.; Richards, D.R. Temperature and air pollution reductions by urban greenspaces are highly valued in a tropical city-state. Urban For. Urban Green. 2020, 55, 126827. [Google Scholar]
- Liu, J.; Wang, D.; Wang, H. Evaluation of leisure walking environment of the elderly in Shanghai: An empirical case based on walking behavior preference. Shanghai Urban Plan. Rev. 2017, 1, 43–49. [Google Scholar]
- Liu, J.; Wang, D.; Zhu, W.; Wang, H.; Zhu, C. Comparison of leisure walking environment quality in new and old urban areas: A case study of Anshan New Village and Jiangwan New Town in Shanghai. Geogr. Res. 2015, 34, 2195–2204. [Google Scholar]
- Fox, D. Leisure time preference: The influence of gardening on garden visitation. World Leis. J. 2017, 59, 45–53. [Google Scholar]
- Aydin, B.; Arslan, E. The Role of Social Media on Leisure Preferences: A Research on the Participants of Outdoor Recreation Activities. Tour. Acad. J. 2016, 3, 1–10. [Google Scholar]
- Farooq, B.; Cherchi, E.; Sobhani, A. Virtual immersive reality for stated preference travel behavior experiments: A case study of autonomous vehicles on urban roads. Transp. Res. Rec. 2018, 2672, 35–45. [Google Scholar]
- Cartenì, A.; Henke, I.; Picone, M. The value of waiting spaces: Tourists’ willingness to pay for high-quality bus terminals. Transp. Res. Interdiscip. Perspect. 2024, 26, 101129. [Google Scholar]
- Pantene. Research on the suitability of outdoor activity space in old residential areas. Shanghai Constr. Sci. Technol. 2024, 3, 39–44. [Google Scholar]
- Cheng, S.; Han, H.; Yang, C. The effect of built environment on the daily leisure behavior of the elderly from the perspective of community differentiation: A case study of Hefei City. Trop. Geogr. 2022, 2063–2075. [Google Scholar]
- Adamowicz, W.; Louvere, J.; Williams, M. Combining revealed and stated preference methods for valuing environmental amenities. J. Environ. Econ. Manag. 1994, 26, 271–292. [Google Scholar] [CrossRef]
- Wang, F.; Chen, J.; Chen, Y. Transportation SP survey and design methods. Urban Transp. 2000, 13, 69–72. [Google Scholar]
- Hochmair, H.H. Decision support for bicycle route planning in urban environments. In Proceedings of the 7th AGlLE Conference on Geographic Information Science, Salt Lake City, UT, USA, 22–26 June 2004. [Google Scholar]
- Aspinall, P.A.; Ward Thompson, C.; Alves, S.; Sugiyama, T.; Brice, R.; Vickers, A. Preference and relative importance for environmental attributes of neighborhood open space in older people. Environ. Plan. B 2010, 37, 1022. [Google Scholar]
- Feng, Y.; Liu, X.; Li, J.; Zhang, L.; Kong, D.; Xv, L. Zhengzhou shallow mountain village streets micro climate impact mechanism analysis. J. Henan Agric. Univ. 2024, 1–17, Online ahead of print. [Google Scholar] [CrossRef]
- Fang, X.; Liu, S.; Li, K. Platts to insect repellent to released the effect of immunoglobulins leels in the horse dung. China’s Feed 2024, 15, 27–34. [Google Scholar] [CrossRef]
- Akiva, M.B. Discrete Choice Analysis: Theory and Application to Travel Demand; MIT Press: Cambridge, MA, USA, 1985; Volume 2, pp. 575–589. [Google Scholar]
- Song, S.; Wang, D.; Zhu, W.; Wang, C. Spatial allocation of elderly care institutions in Shanghai based on demand preference. City Plan. Rev. 2016, 40, 77–82, 90. [Google Scholar]
- Wang, T. Research on Random Forest Stock Selection Strategy Based on Large-Small-Cap Style Rotation. Master’s Thesis, Zhongnan University of Economics and Law, Wuhan, China, 2020. [Google Scholar]
- Boateng, E.Y.; Abaye, D.A. A review of the logistic regression model with emphasis on medical research. J. Data Anal. Inf. Process. 2019, 7, 190–207. (In Chinese) [Google Scholar]
- Wen, Y.; Li, S.; Yang, N. Elderly friendly cognitive perspective or active street space update strategy study. J. Archit. Cult. 2024, 6, 146–147. [Google Scholar] [CrossRef]
- Zhang, C.B.; Chen, F.; Wei, Y.Y. Evaluation of pedestrian crossing behavior and safety at uncontrolled mid-block crosswalks with different numbers of lanes in China. Accid. Anal. Prev. 2019, 123, 263–273. [Google Scholar]
- Wu, Y.; Liu, Y. Evaluation of the impact area of community health service facilities from the perspective of pedestrian friendliness for the elderly: A case study of the old residential area of Longhai Street, Guancheng District, Zhengzhou. South. Archit. 2024, 3, 108–114. [Google Scholar]
- Yuxi, Z.; Qi, C.; Xu, Z. Study on the Characteristics of Walking activity of elderly people in mountainous communities and its impact on Space Envi-ronment//Chinese Society of Highways, Chinese Society of Navigation, Chinese Society of Railways, Chinese Society of Aero-nautics, and Chinese Society of Automotive Engineering. In Proceedings of the 2024 World Transportation Congress (WTC2024) (Transportation Planning and Air Transportation). School of Architecture and Urban Planning, Chongqing Jiaotong University, Qingdao, China, 26–29 June 2024; Volume 10. [Google Scholar]
- Li, F.; Harmer, P.A.; Cardinal, B.J.; Bosworth, M.; Acock, A.; Johnson-Shelton, D.; Moore, J.M. Built Environment, Adiposity, and Physical Activity in Adults Aged 50–75. Am. J. Prev. Med. 2008, 35, 1–46. [Google Scholar]
- Gallagher, N.A.; Gretebeck, K.A.; Robinson, J.C.; Torres, E.R.; Murphy, S.L.; Martyn, K.K. Neighborhood factors relevant for walking in older, urban, African American adults. J. Aging Phys. Act. 2010, 18, 99–115. [Google Scholar] [PubMed]
- Shuba, N.; Prakash, B. Effects of age, gender and education level on cognition in elderly people. J. Evol. Med. Dent. Sci. 2017, 6, 6952–6957. [Google Scholar]
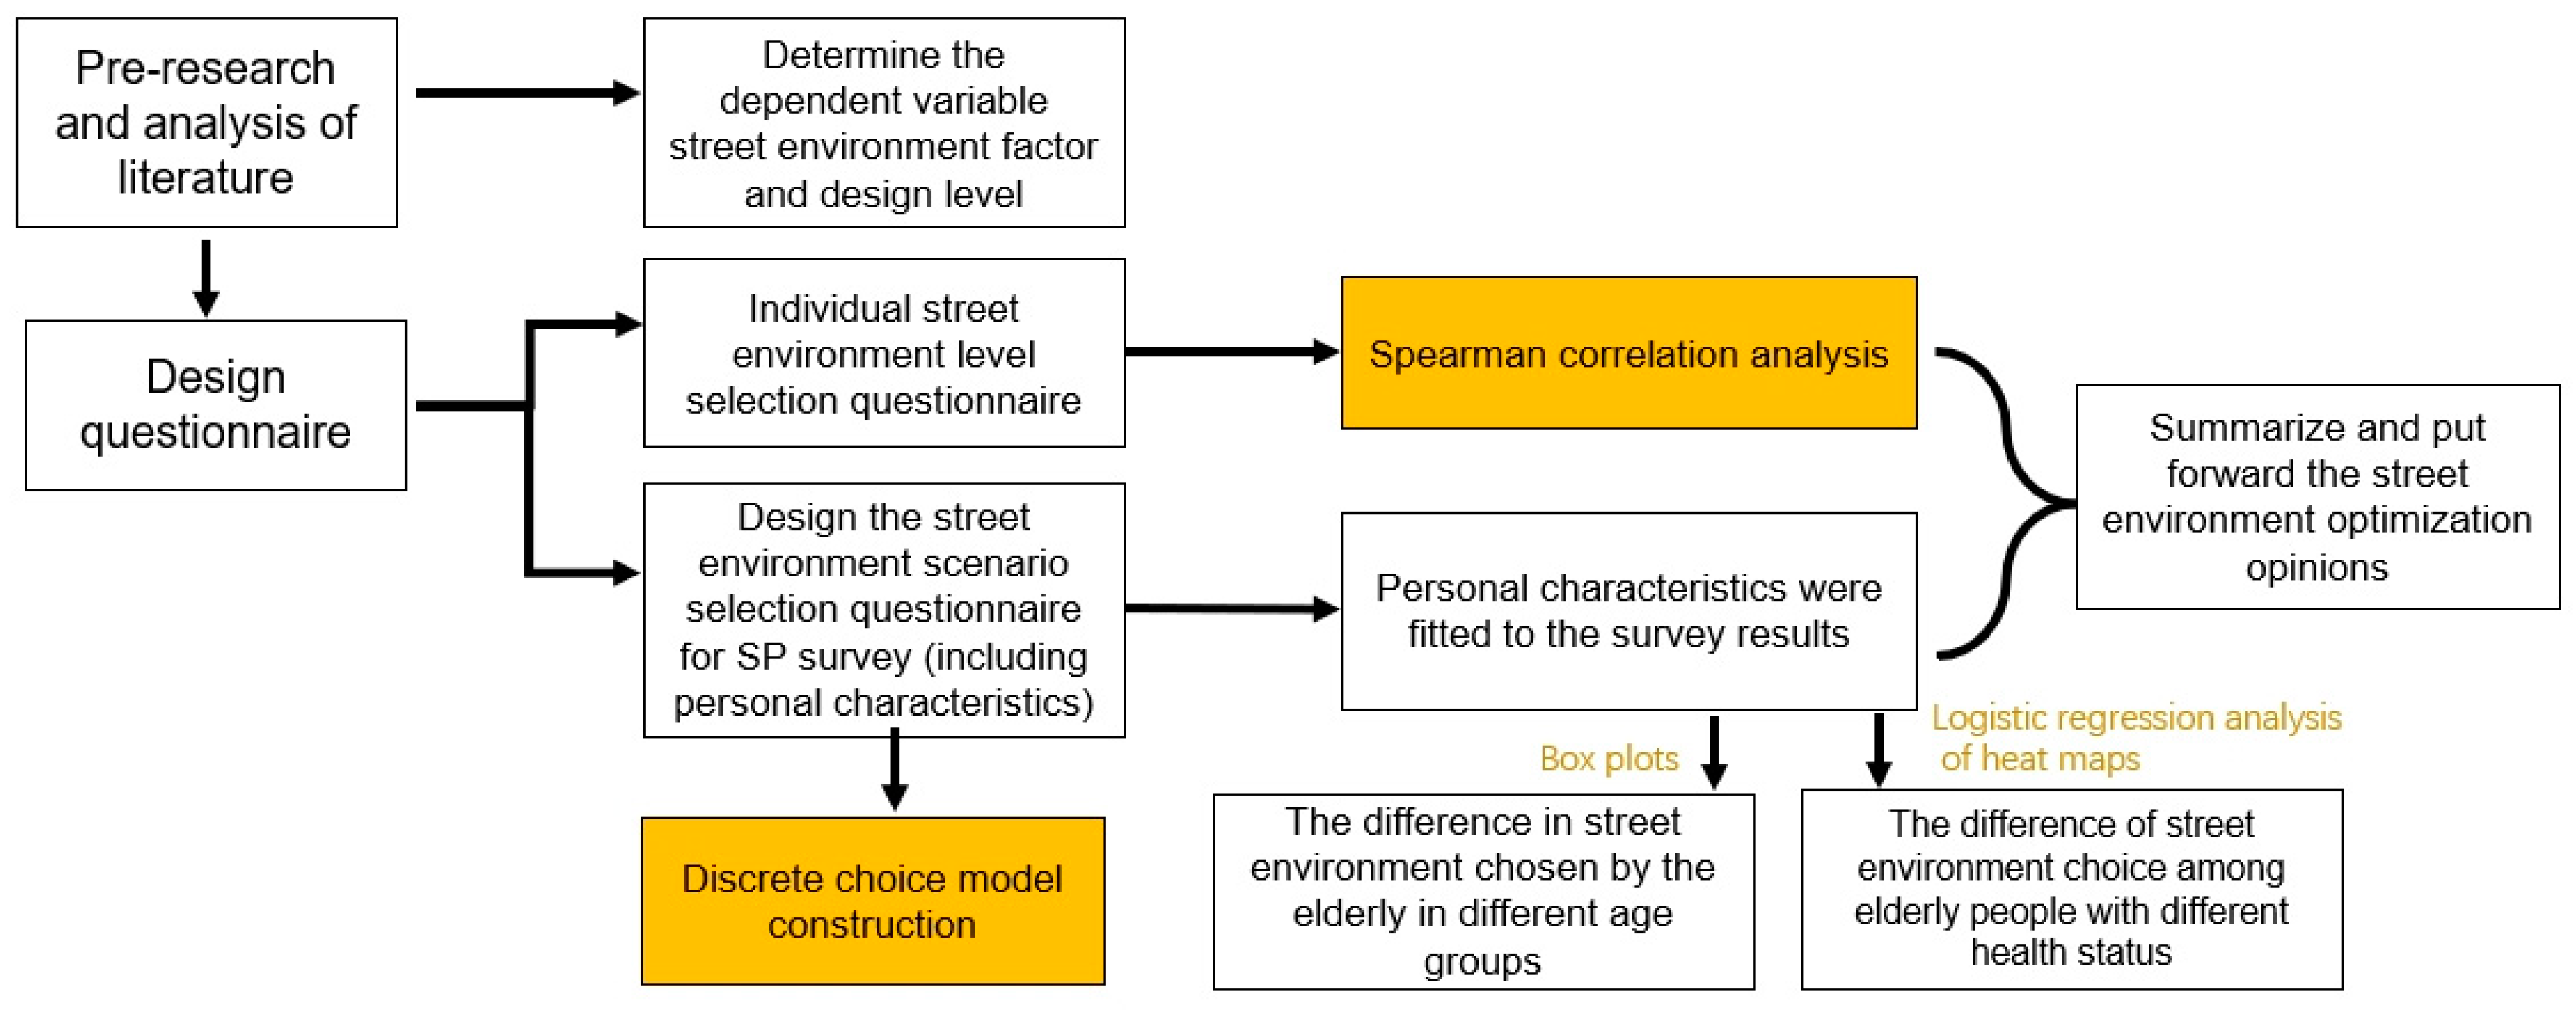

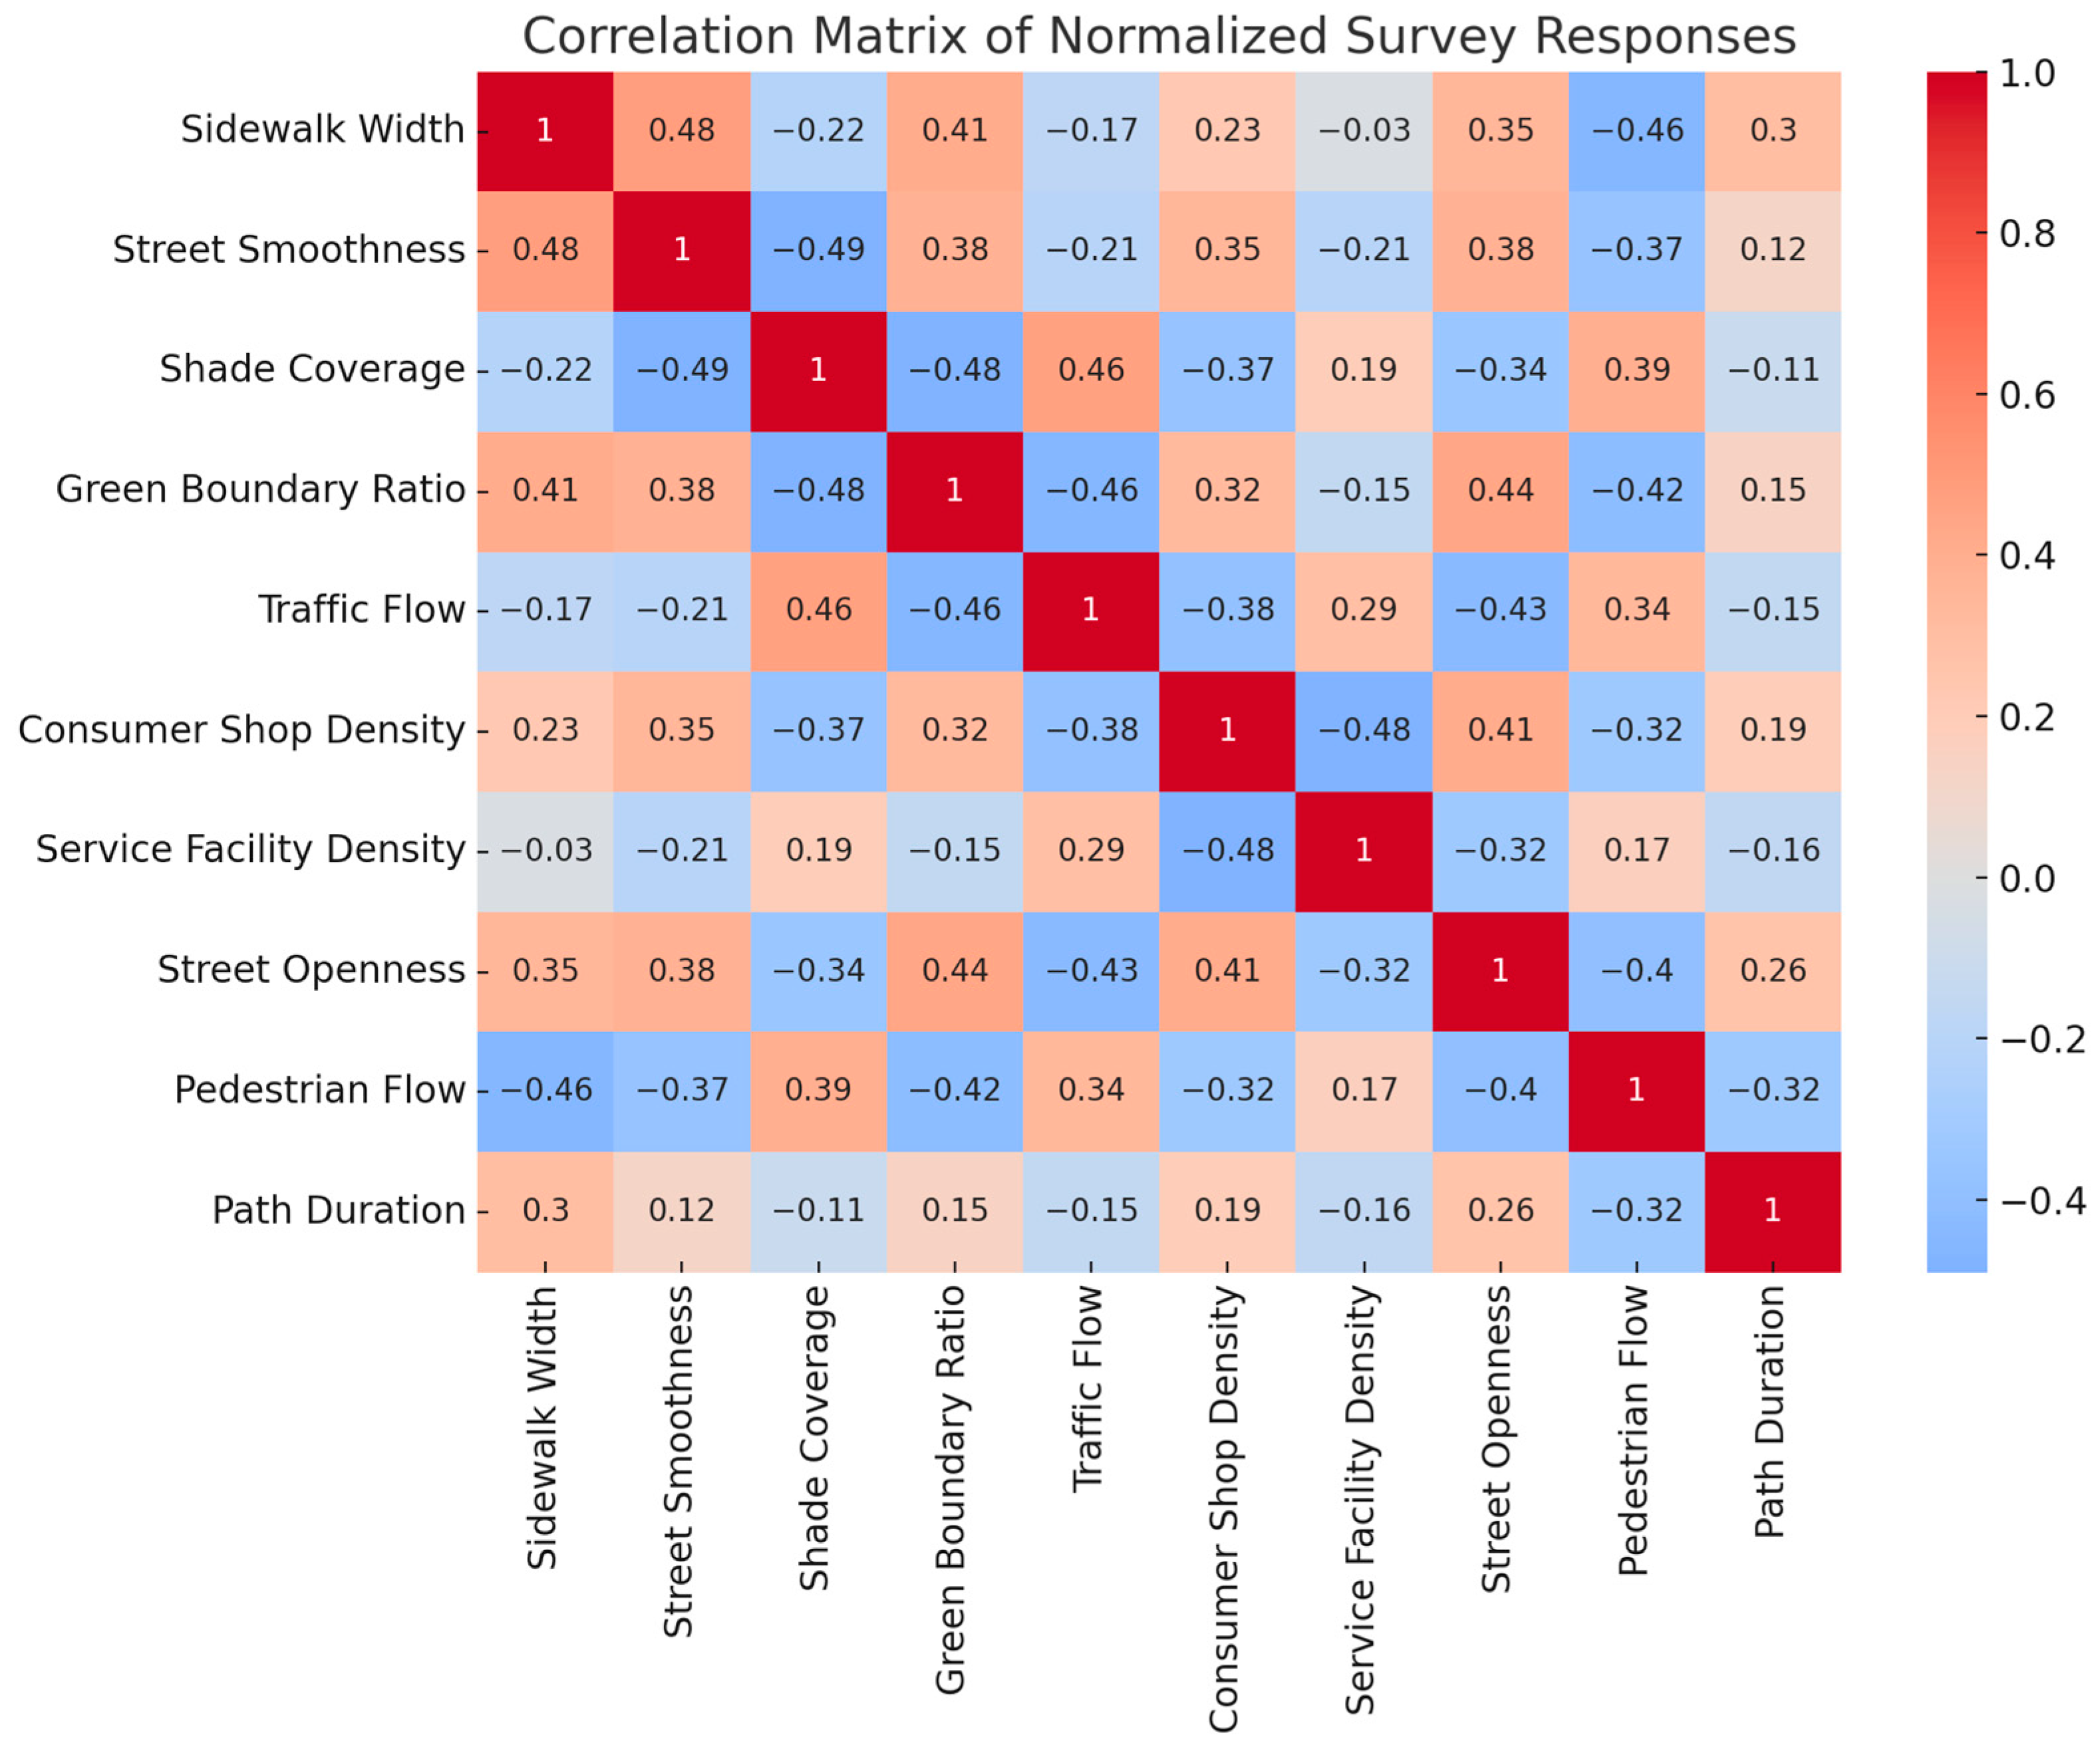

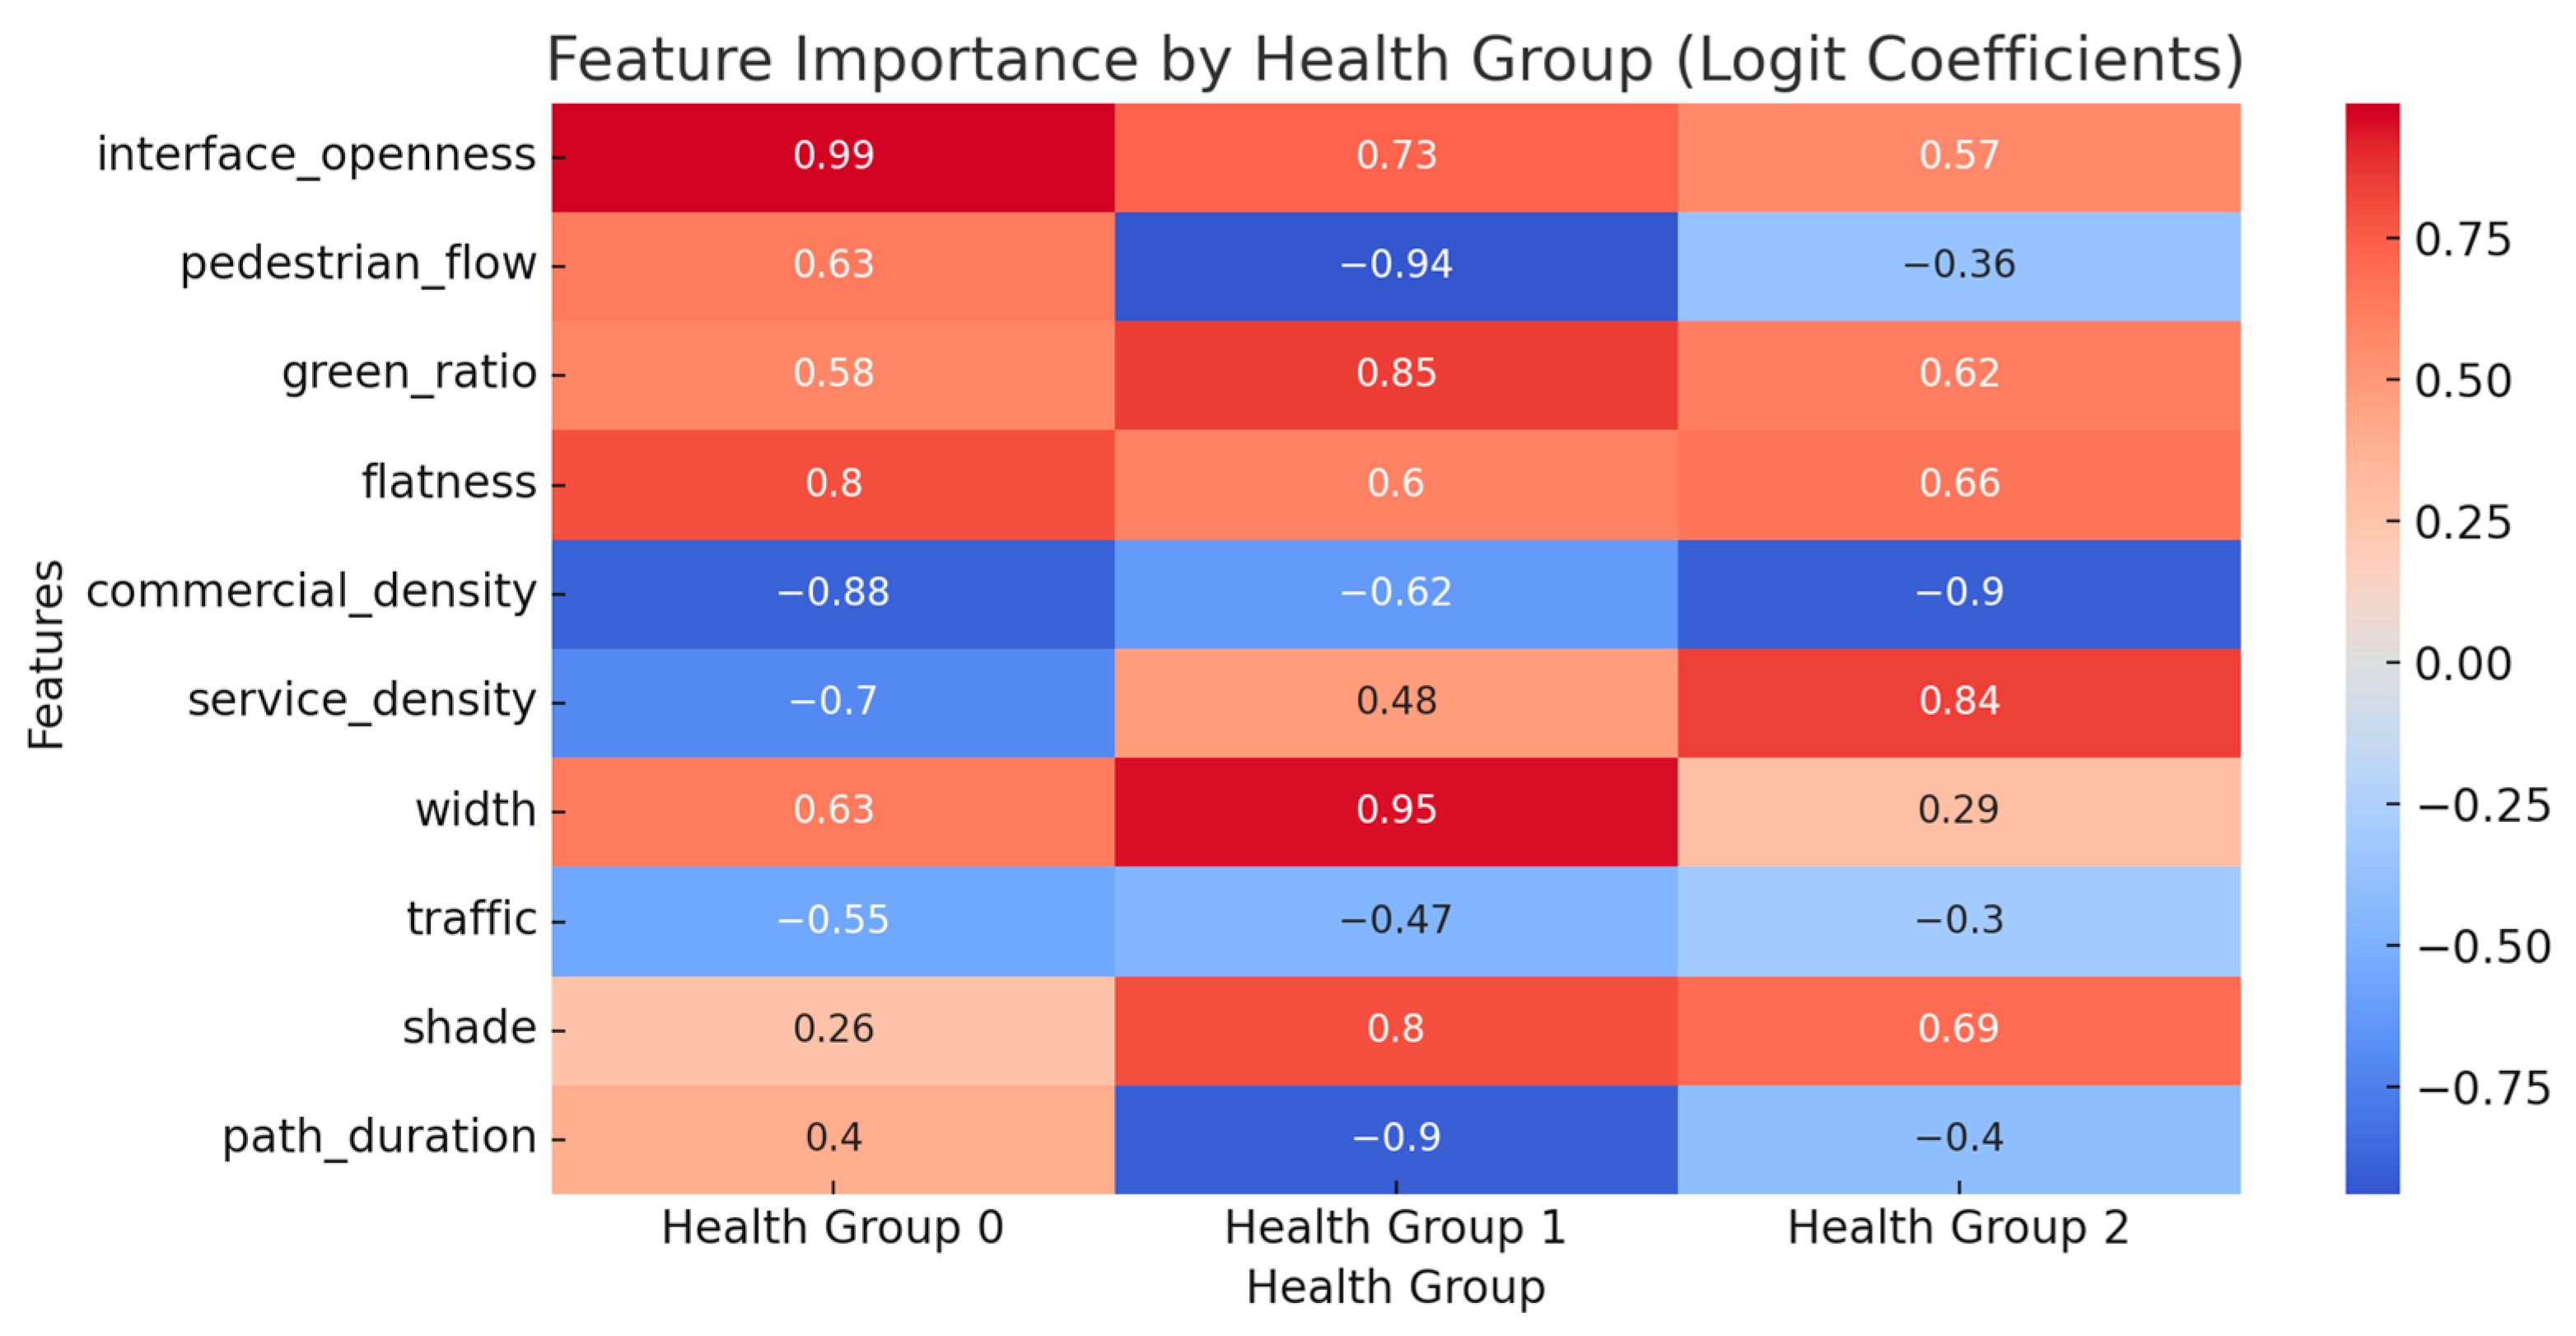
Disclaimer/Publisher’s Note: The statements, opinions and data contained in all publications are solely those of the individual author(s) and contributor(s) and not of MDPI and/or the editor(s). MDPI and/or the editor(s) disclaim responsibility for any injury to people or property resulting from any ideas, methods, instructions or products referred to in the content. |
© 2024 by the authors. Licensee MDPI, Basel, Switzerland. This article is an open access article distributed under the terms and conditions of the Creative Commons Attribution (CC BY) license (https://creativecommons.org/licenses/by/4.0/).