
Analysis of Techno-Functional Properties of Fermented and Non-Fermented Buttermilk-Containing Ice Creams

 , , , ,
Abstract
1. Introduction
2. Materials and Methods
2.1. Ice Cream Production Procedure
2.2. pH Measurement
2.3. Color Measurement
2.4. Rheological Measurement
2.5. Overrun Measurement and Meltdown Test of Ice Creams
2.6. Texture Measurement of Frozen Ice Cream
2.7. Statistical Analysis
3. Results and Discussion
3.1. Color
3.2. pH
3.3. Texture
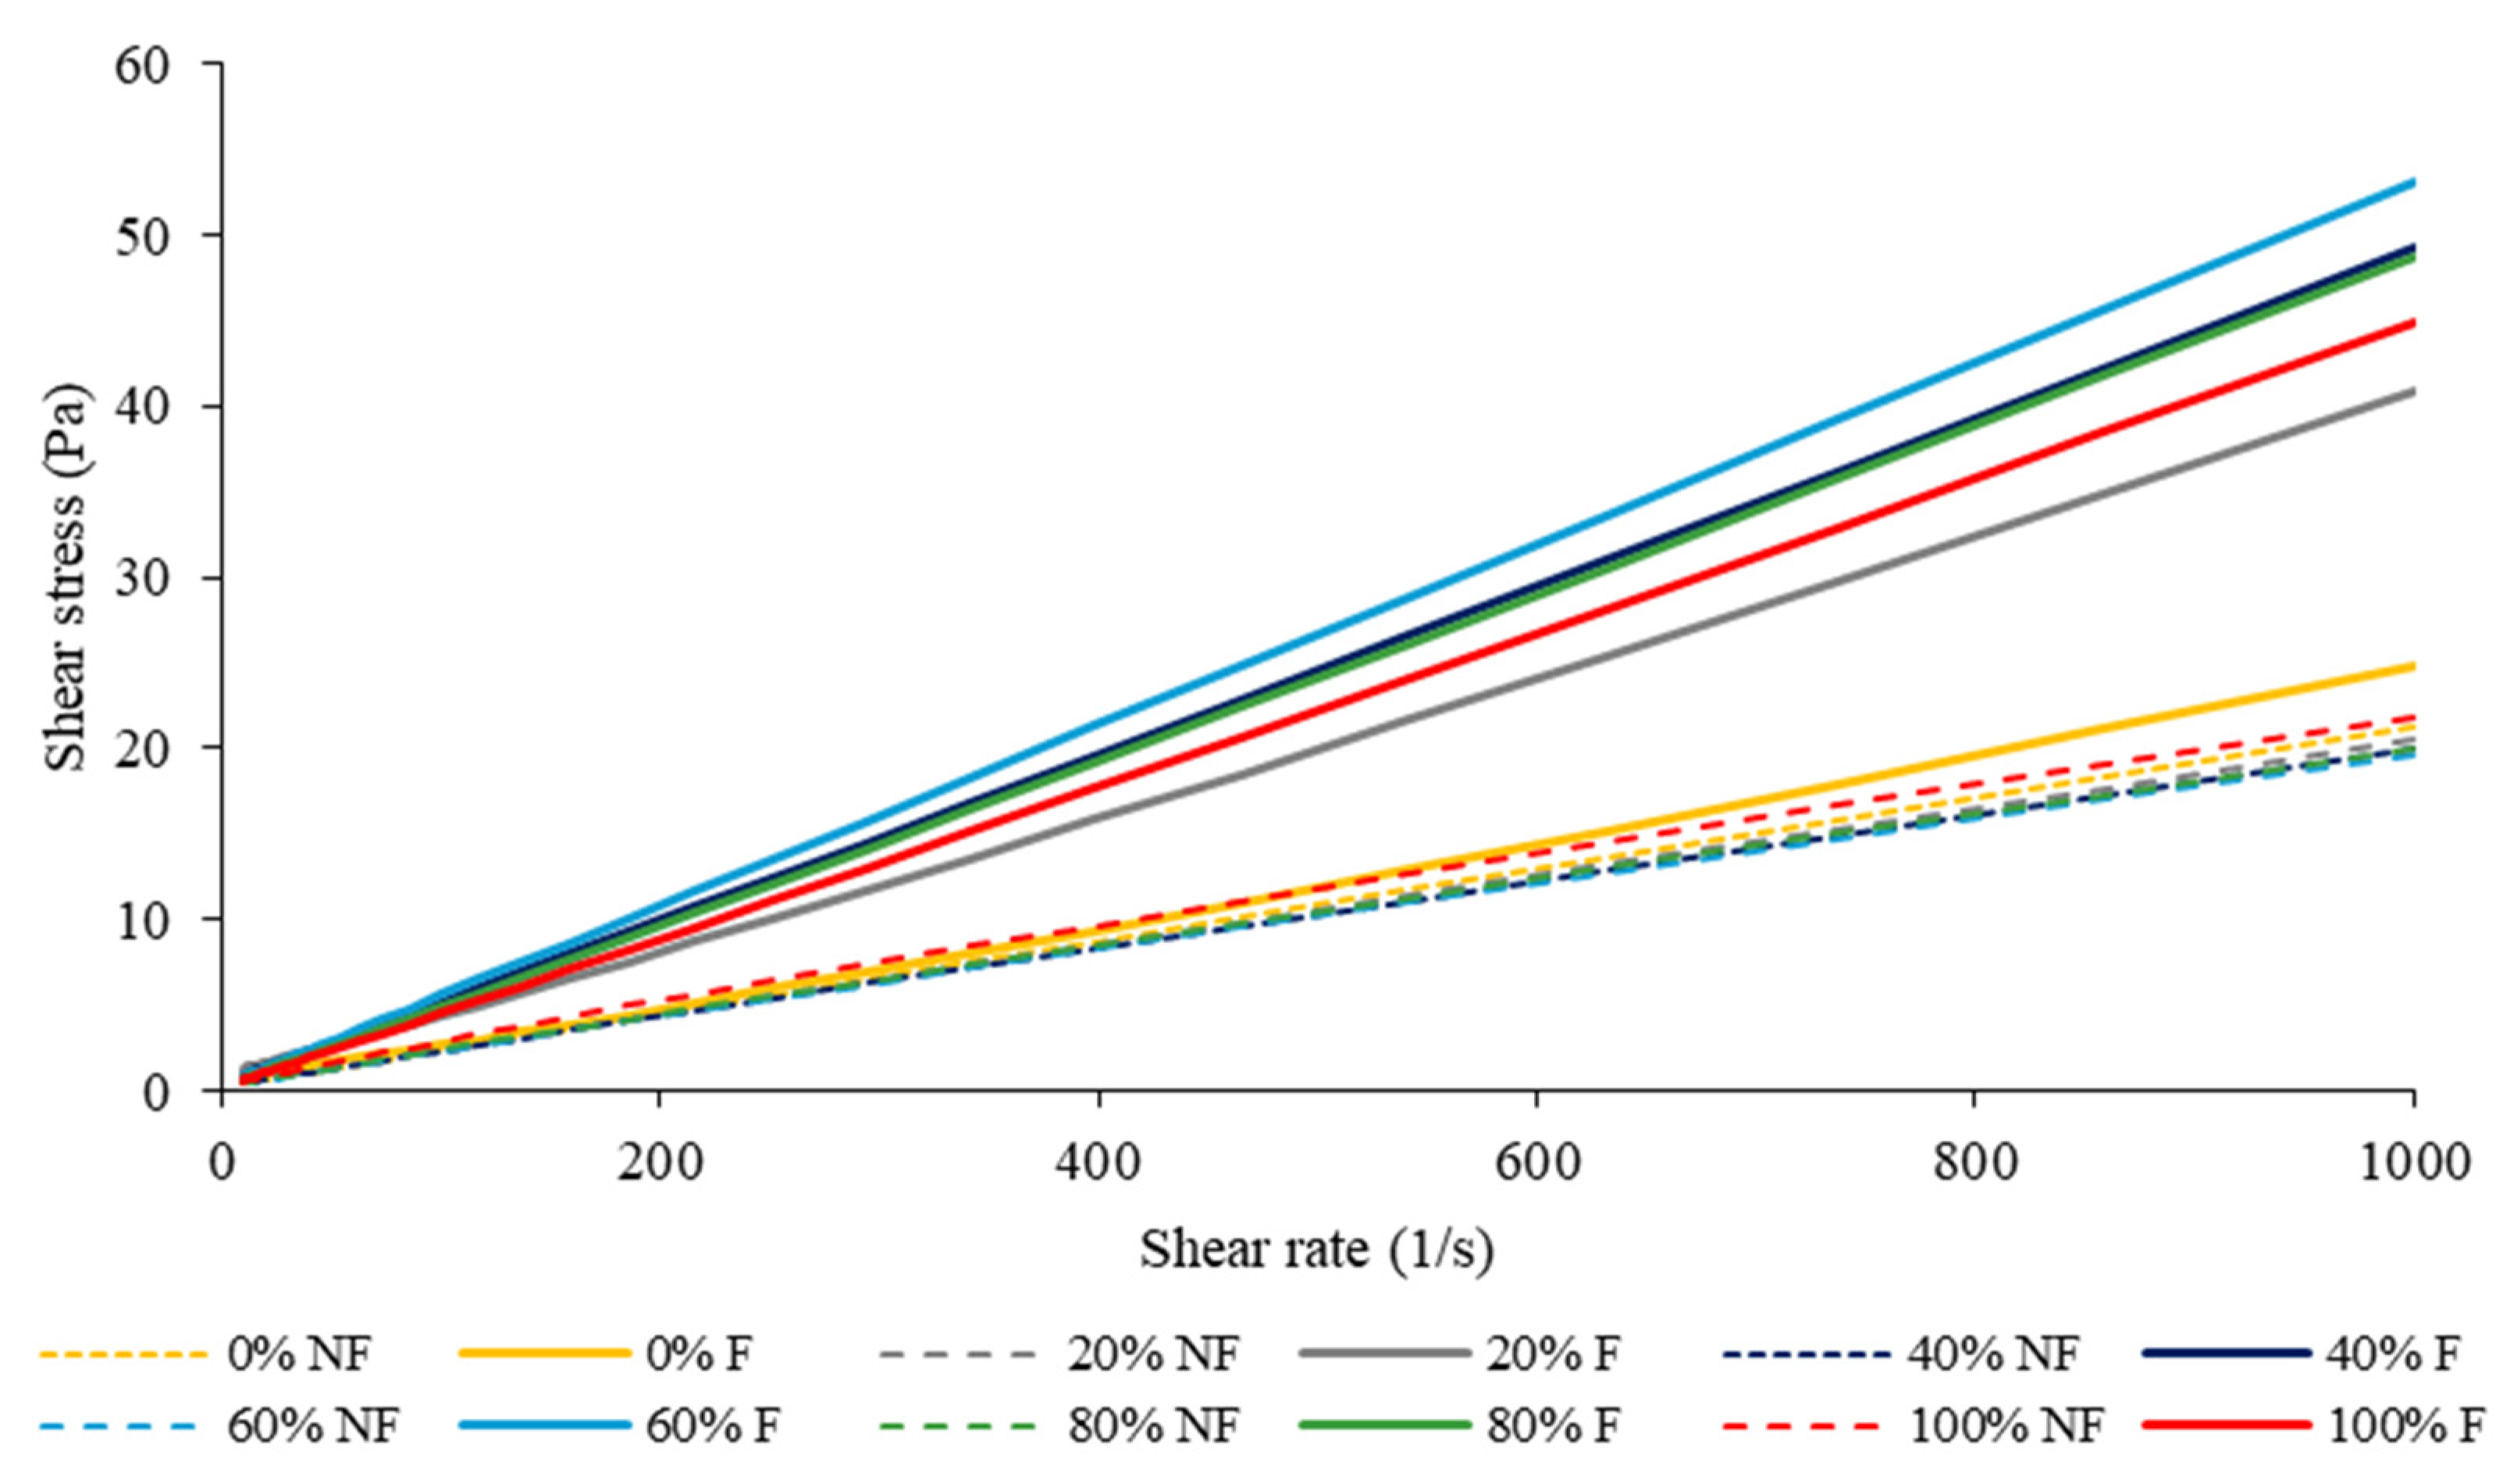
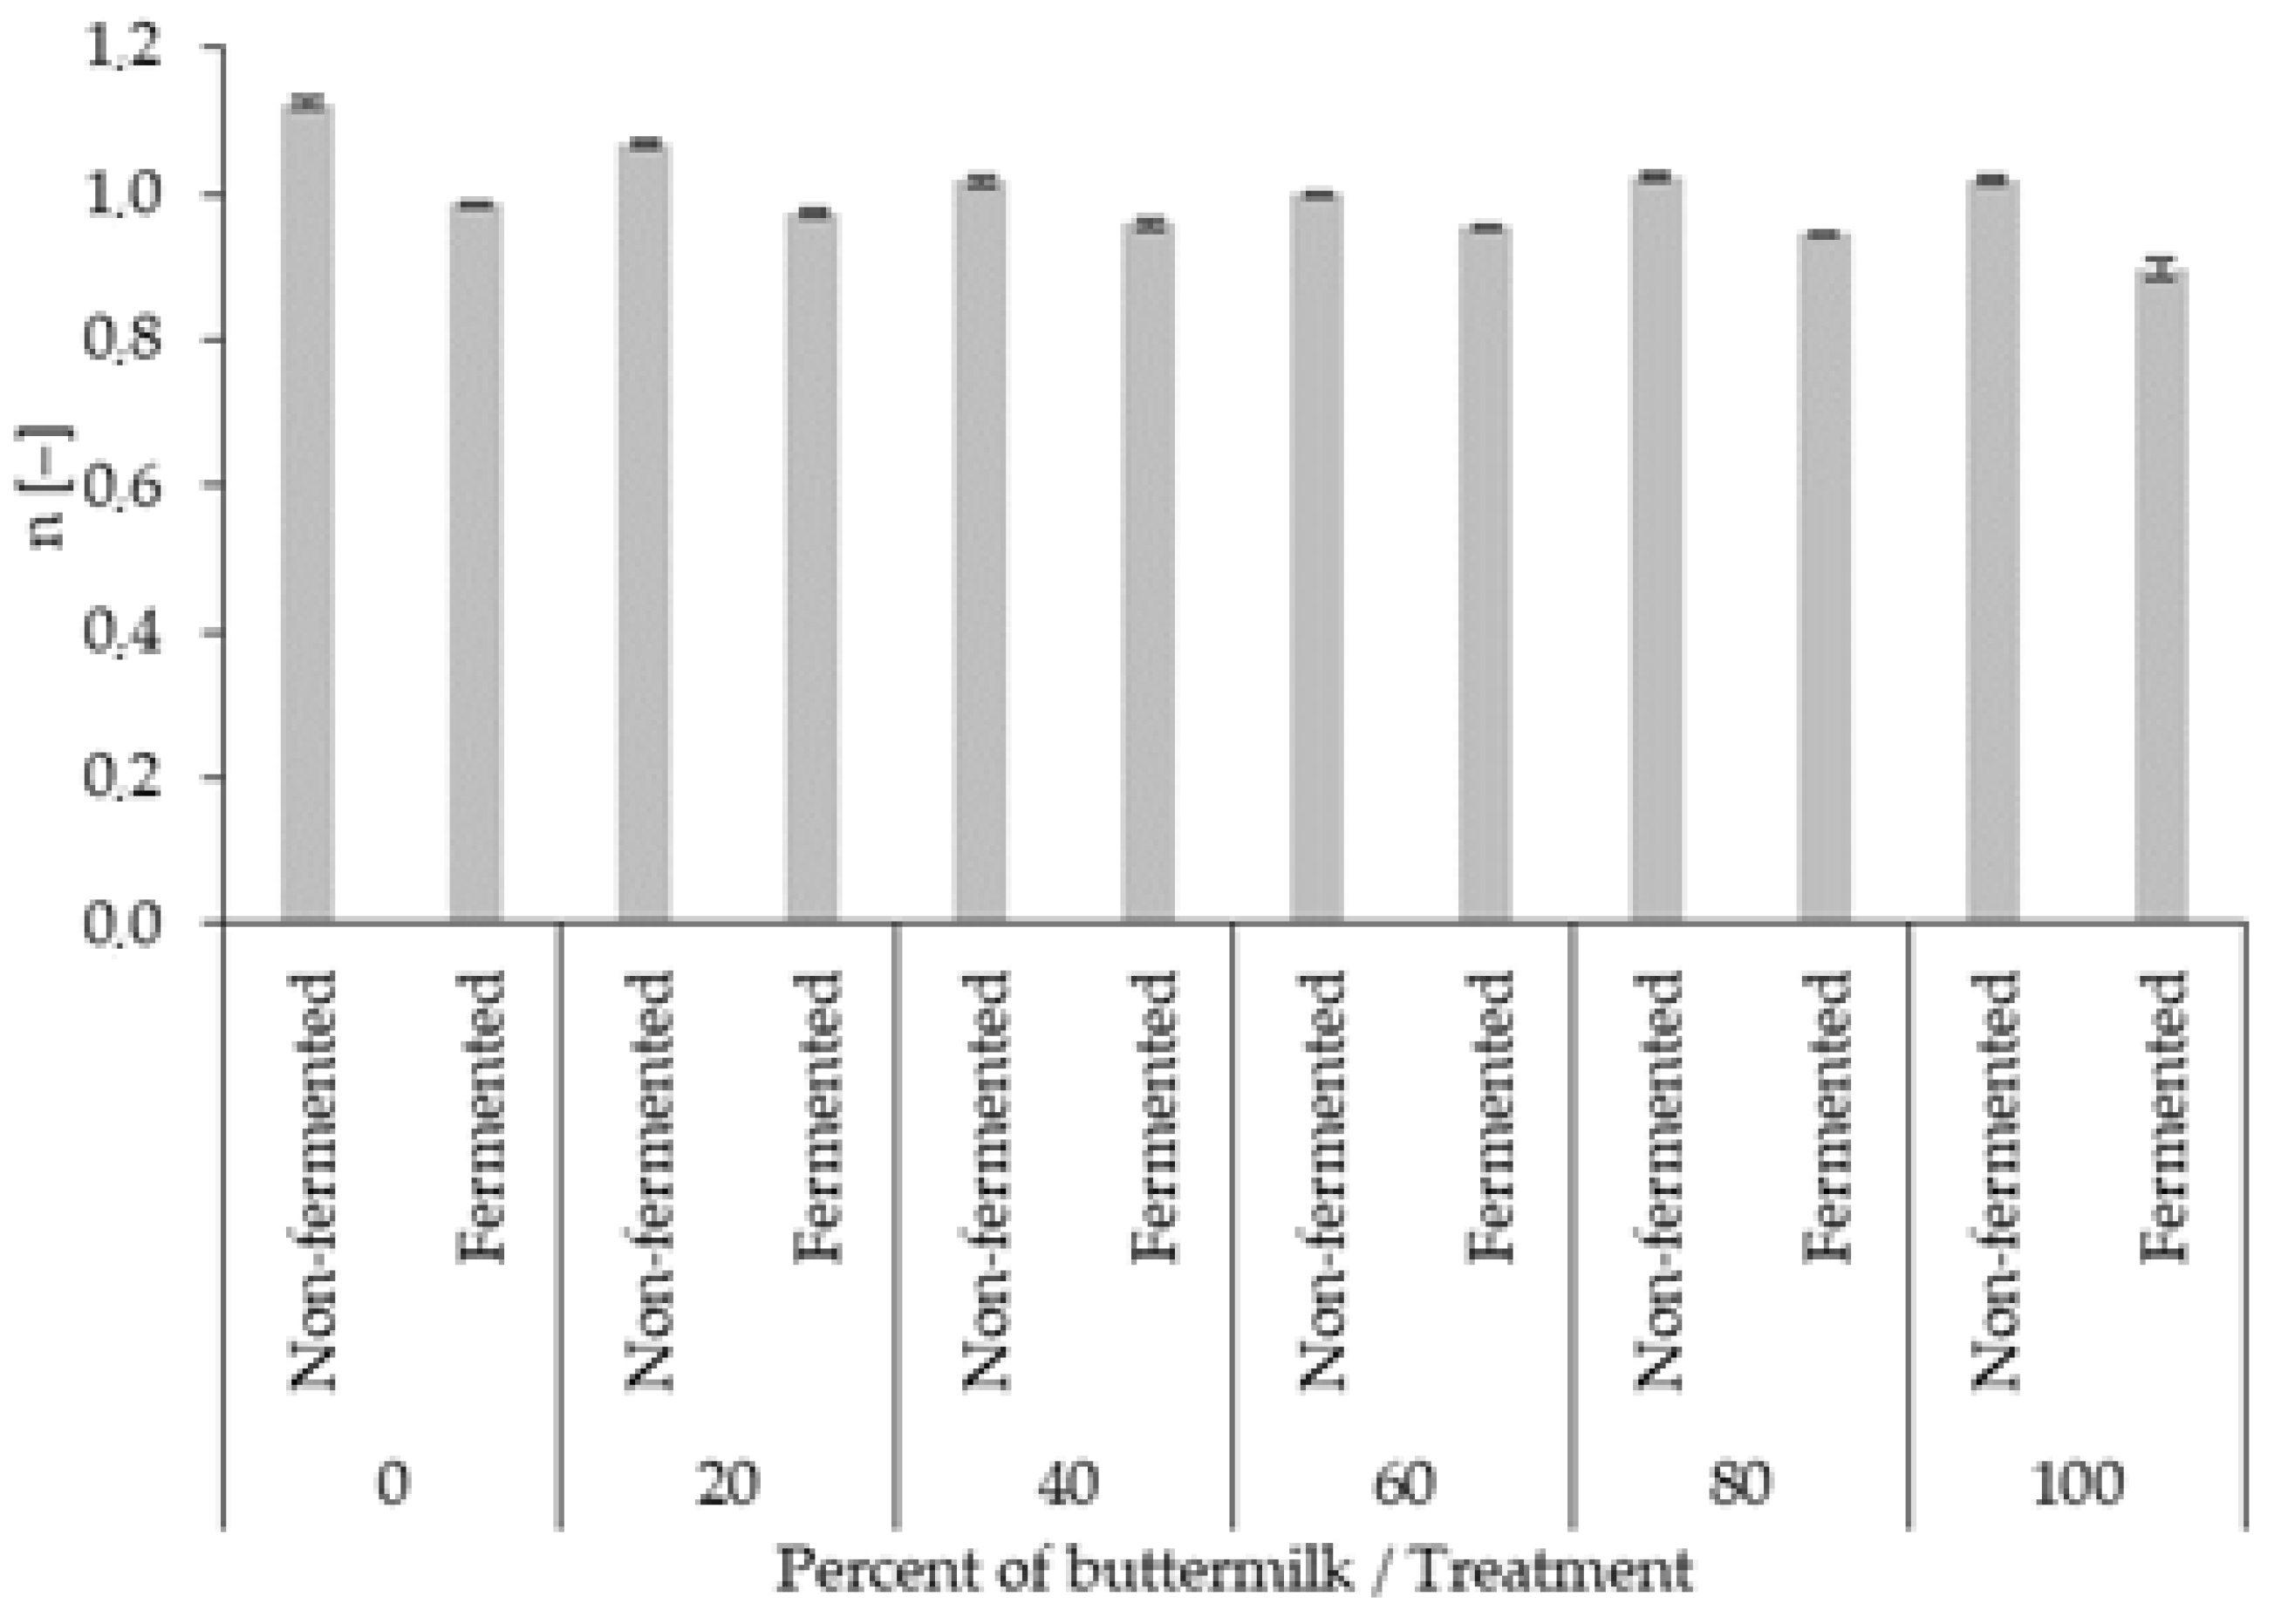
3.4. Rheology
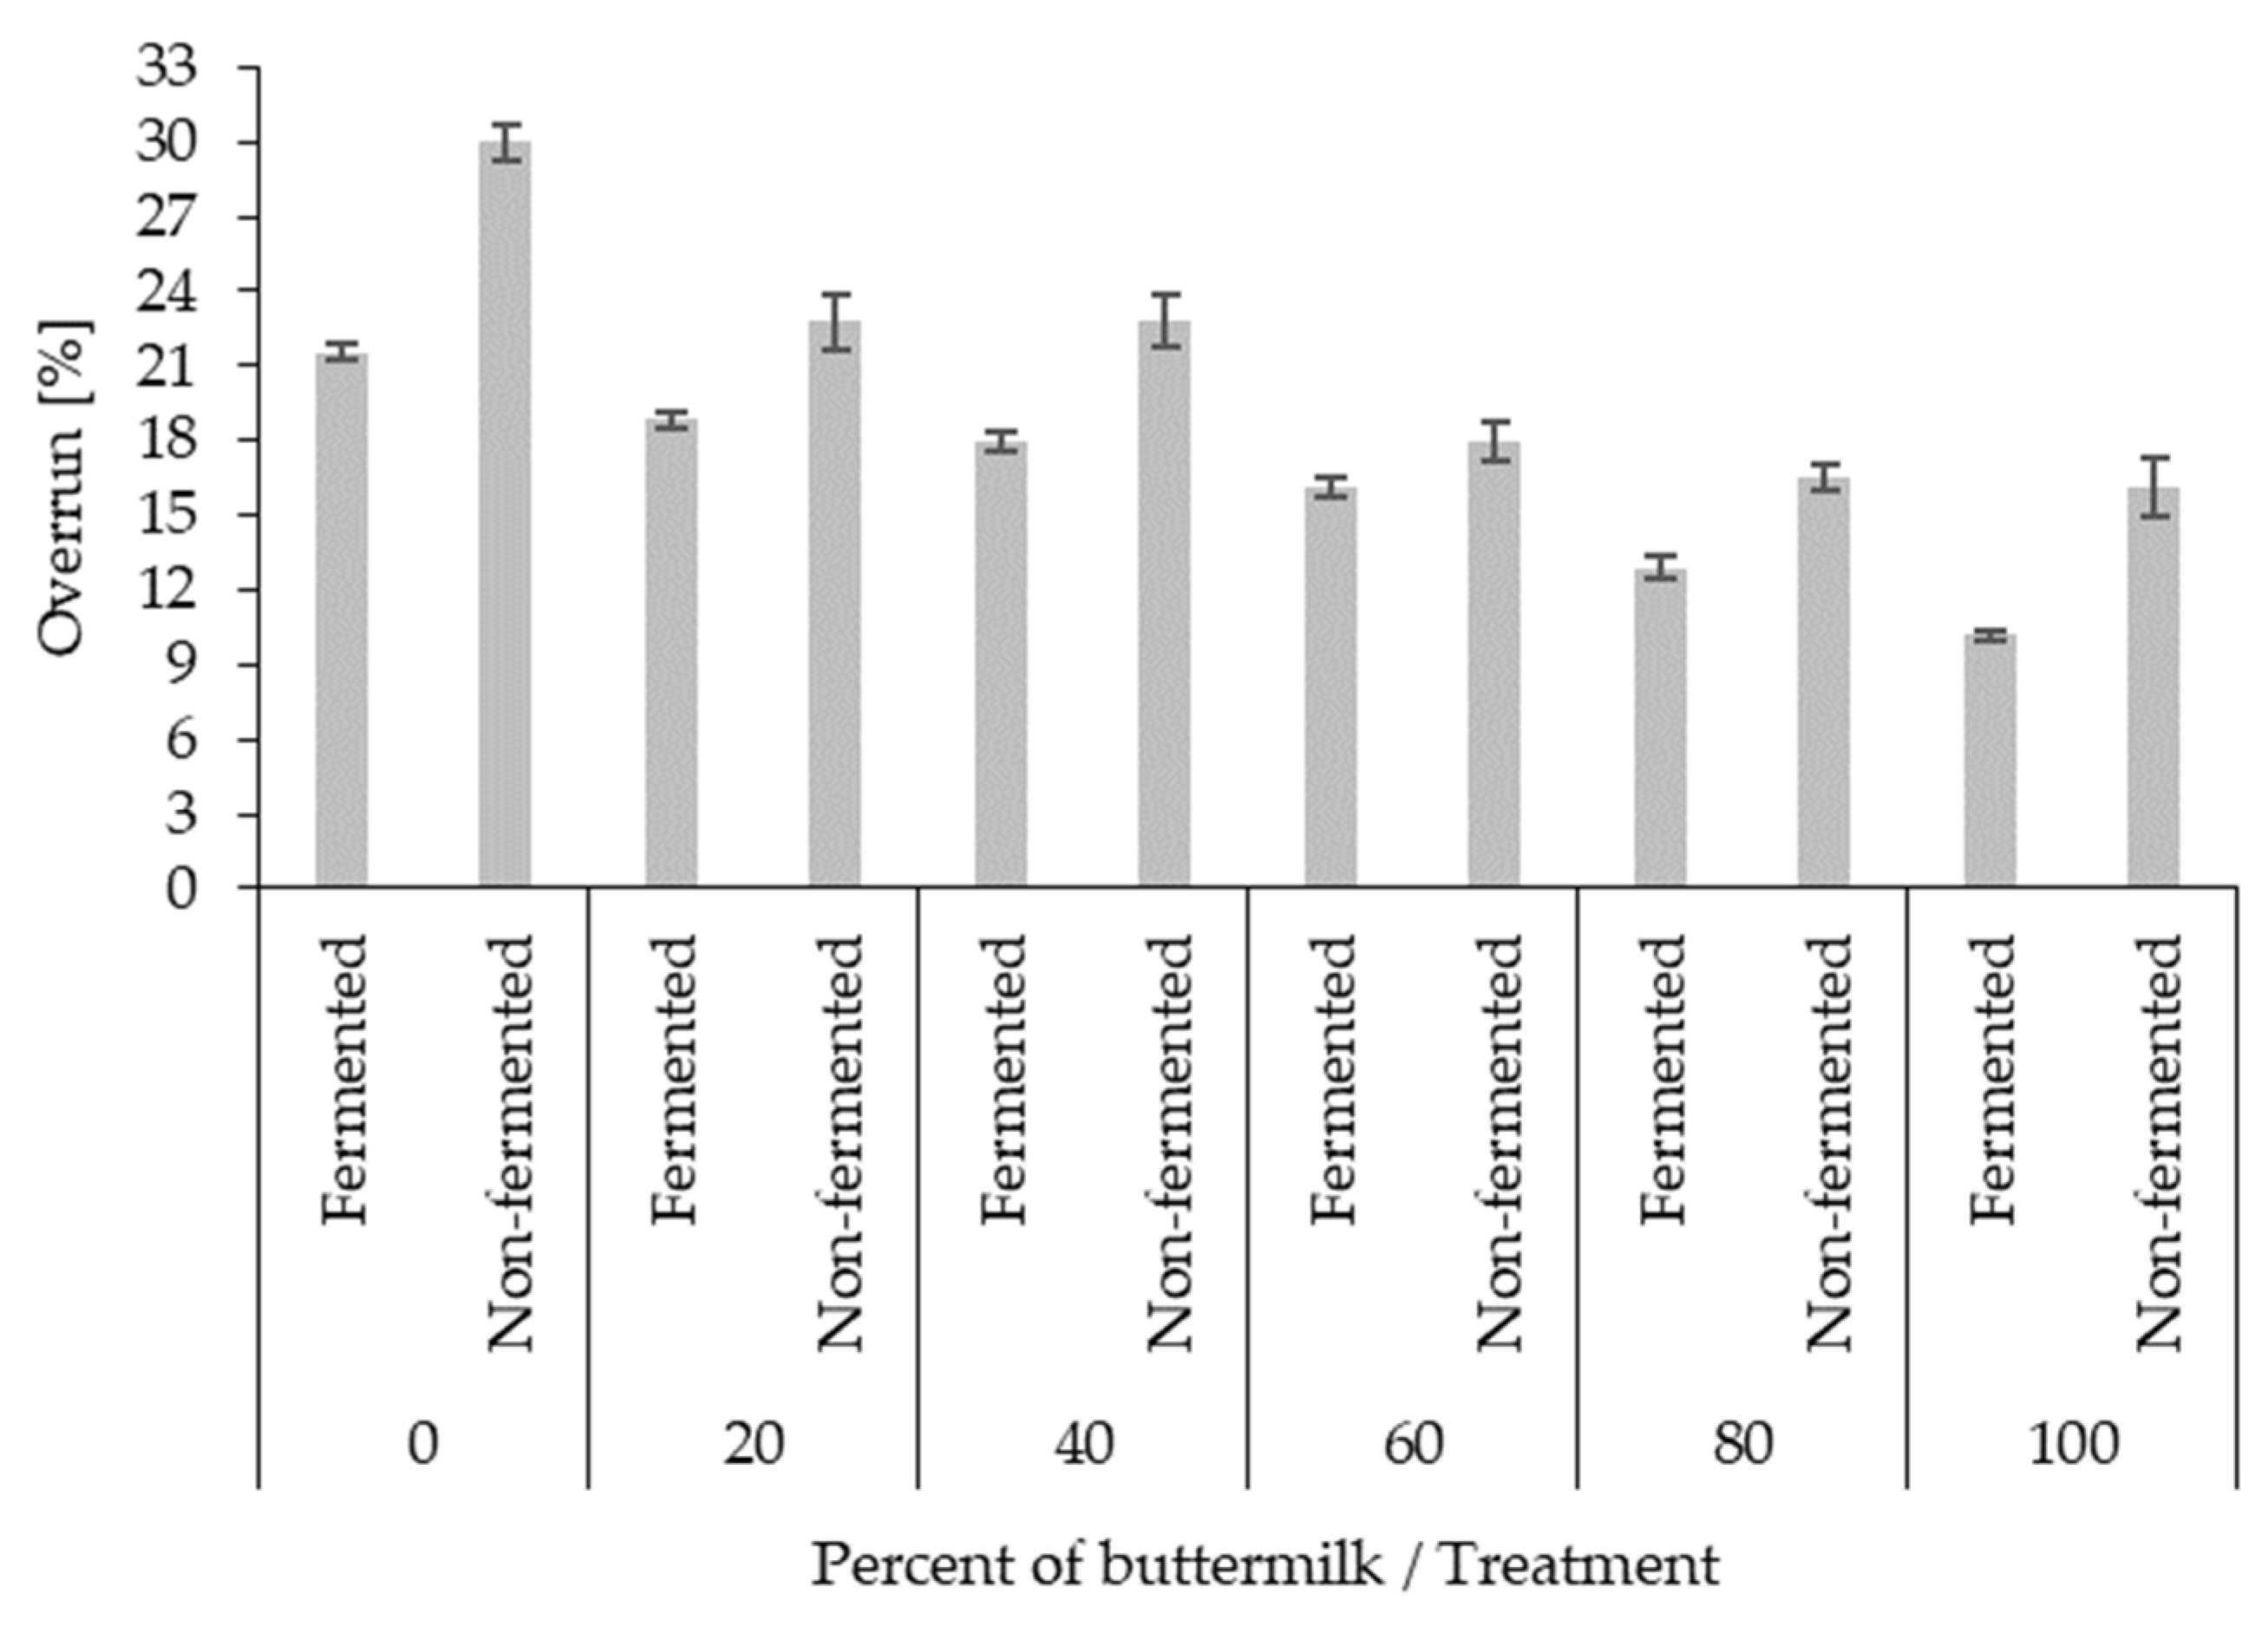
3.5. Overrun
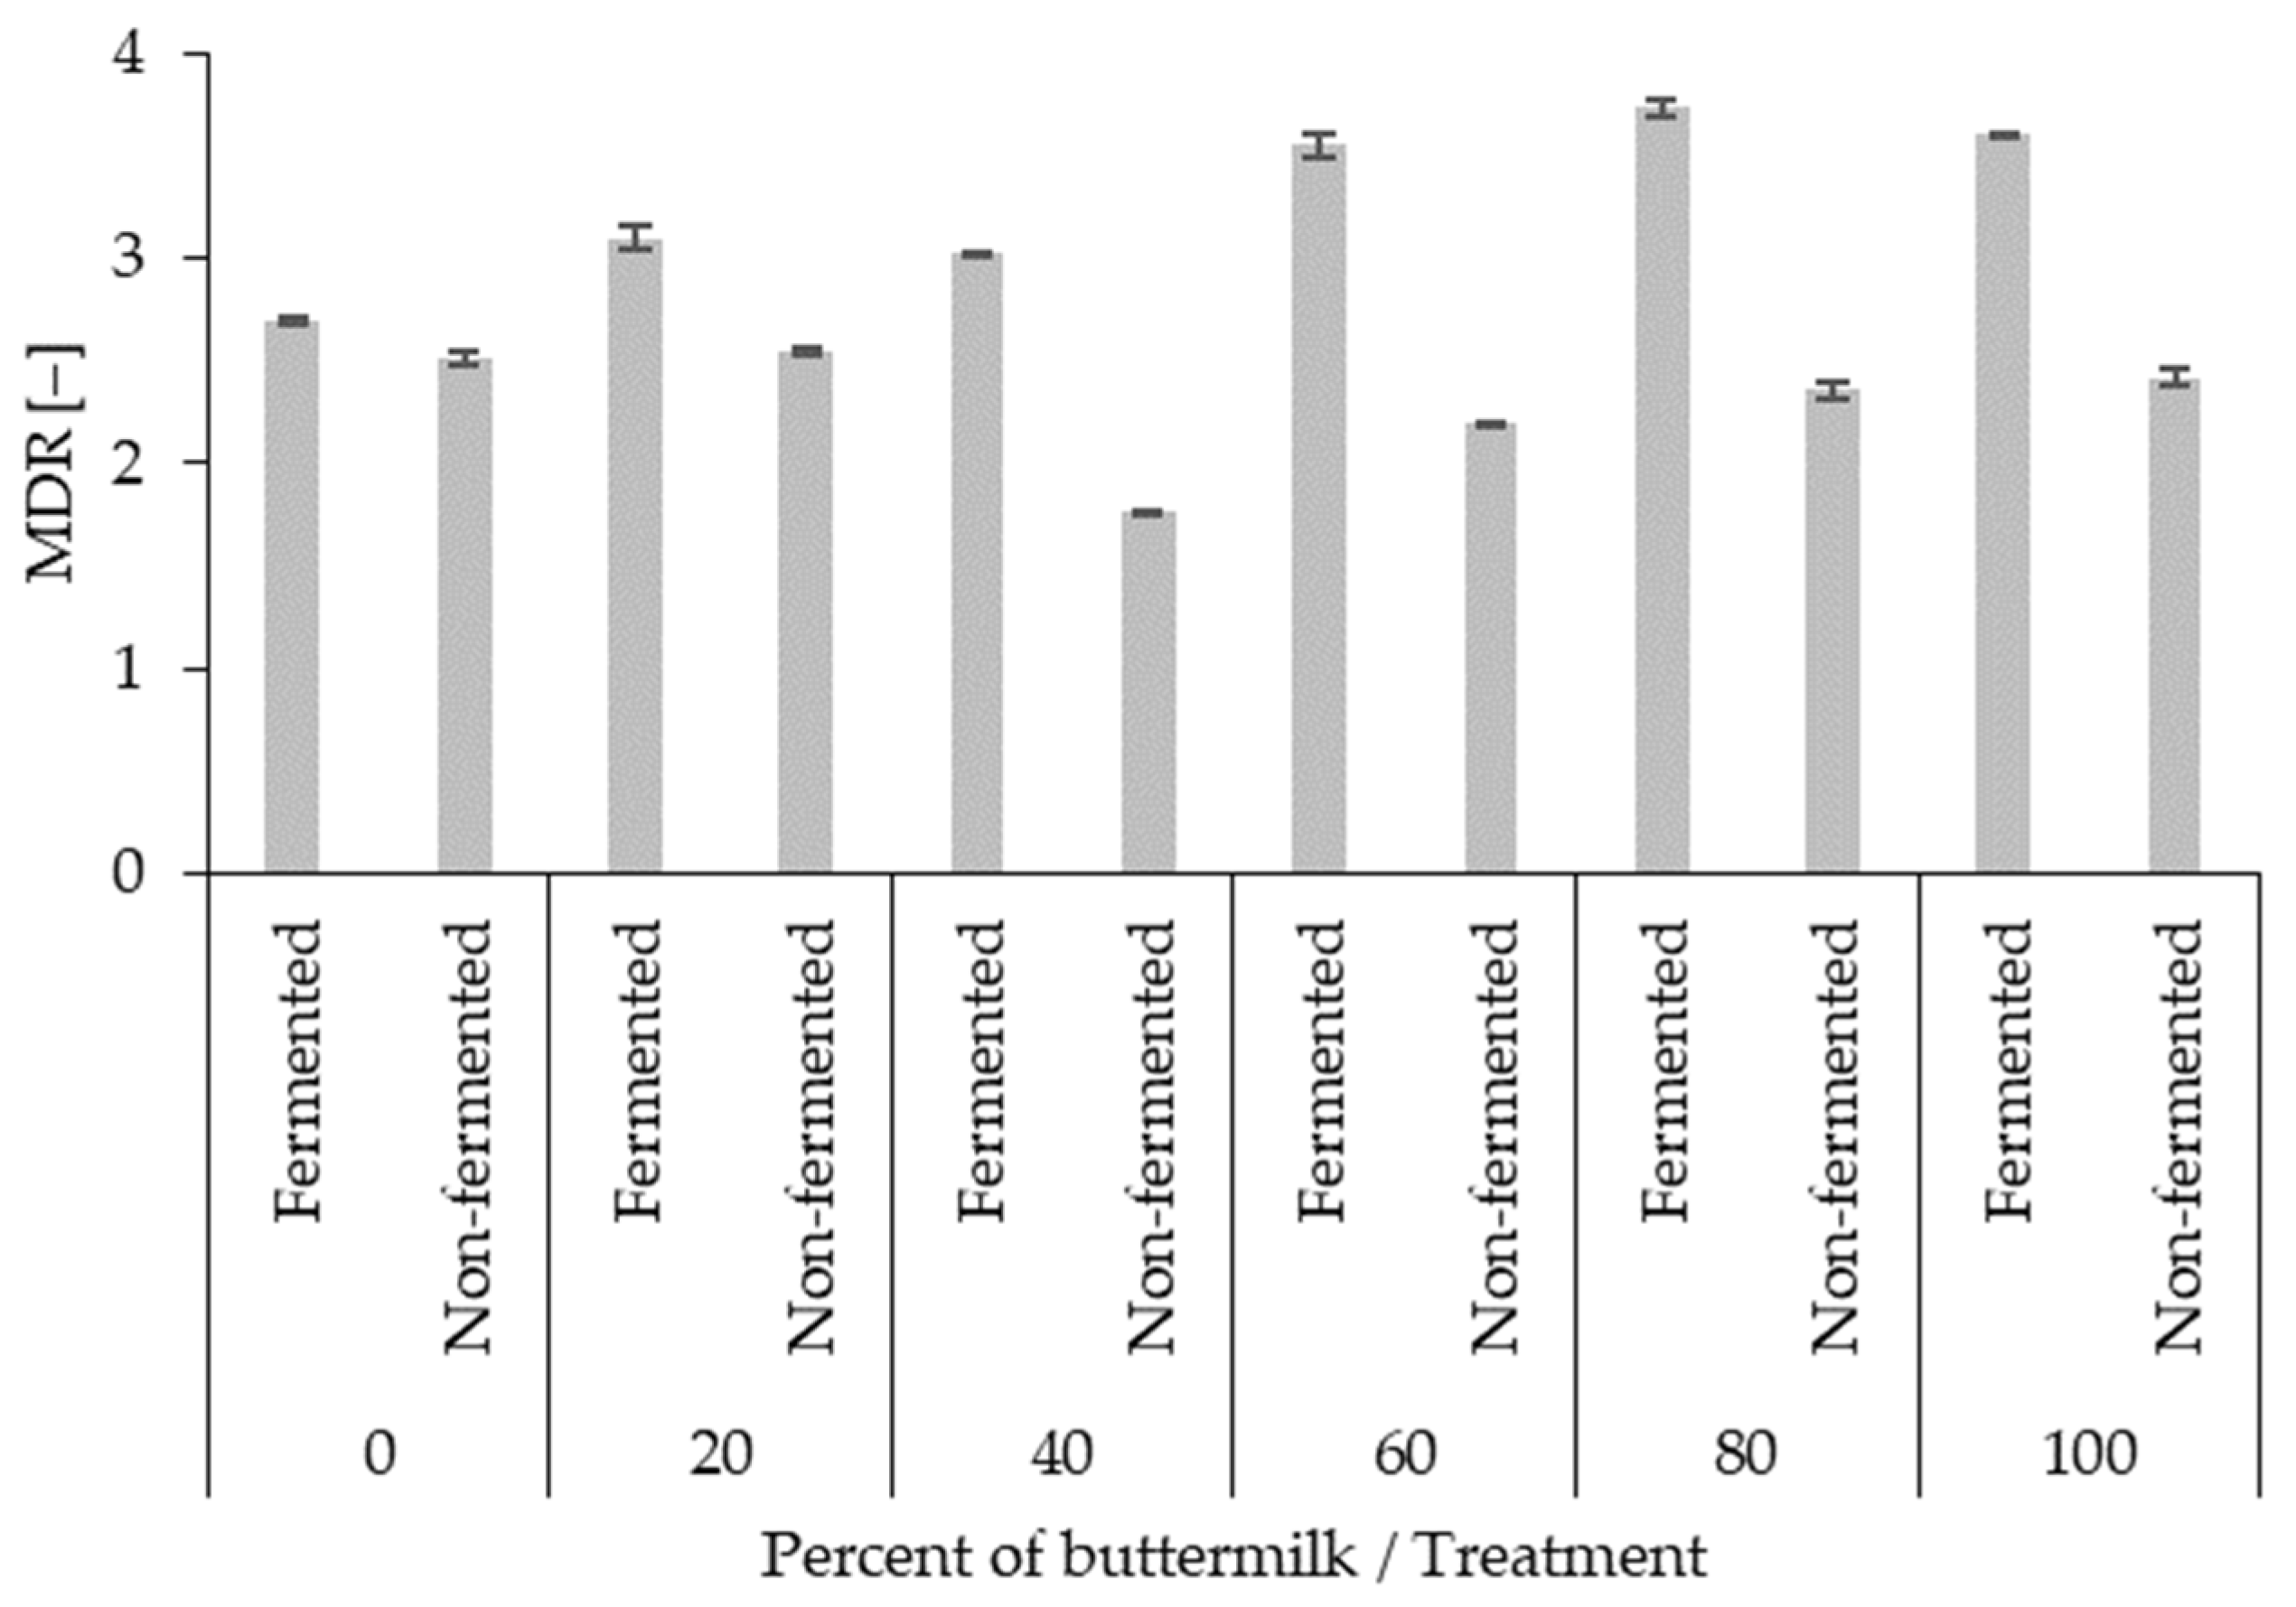
3.6. Melting Properties
4. Conclusions
Author Contributions
Funding
Institutional Review Board Statement
Informed Consent Statement
Data Availability Statement
Acknowledgments
Conflicts of Interest
References
- Krebs, L.; Bérubé, A.; Iung, J.; Marciniak, A.; Turgeon, S.L.; Brisson, G. Impact of Ultra-High-Pressure Homogenization of Buttermilk for the Production of Yogurt. Foods 2021, 10, 1757. [Google Scholar] [CrossRef] [PubMed]
- Hungarian Central Statistical Office, Purchase of Cow’s Milk and Production of Dairy Products Based on Cow’s Milk per Month. Available online: https://www.ksh.hu/stadat_files/mez/hu/mez0110.html (accessed on 29 August 2024).
- De Bassi, L.G.; Ferreira, G.C.C.; Da Silva, A.S.; Sivieri, K.; Aragon-Alegro, L.C.; Costa, M.D.R. Evaluation of Physicochemical, Microbiological and Sensorial Characteristics of Fermented Milk Beverages with Buttermilk Addition. Int. J. Dairy Technol. 2012, 65, 282–286. [Google Scholar] [CrossRef]
- Tarchi, I.; Boudalia, S.; Ozogul, F.; Câmara, J.S.; Bhat, Z.F.; Hassoun, A.; Perestrelo, R.; Bouaziz, M.; Nurmilah, S.; Cahyana, Y.; et al. Valorization of Agri-Food Waste and by-Products in Cheese and Other Dairy Foods: An Updated Review. Food Biosci. 2024, 58, 103751. [Google Scholar] [CrossRef]
- Zhang, H.; Liu, G.; Xue, L.; Zuo, J.; Chen, T.; Vuppaladadiyam, A.; Duan, H. Anaerobic Digestion Based Waste-to-Energy Technologies Can Halve the Climate Impact of China’s Fast-Growing Food Waste by 2040. J. Clean. Prod. 2020, 277, 123490. [Google Scholar] [CrossRef]
- de Meneses, R.B.; Monteiro, M.L.G.; dos Santos, F.F.; Leão, M.H.M.d.R.; Conte-Junior, C.A. Sensory Characteristics of Dairy By-Products as Potential Milk Replacers in Ice Cream. Sustainability 2021, 13, 1531. [Google Scholar] [CrossRef]
- Ali, A.H. Current Knowledge of Buttermilk: Composition, Applications in the Food Industry, Nutritional and Beneficial Health Characteristics. Int. J. Dairy Technol. 2019, 72, 169–182. [Google Scholar] [CrossRef]
- Dewettinck, K.; Rombaut, R.; Thienpont, N.; Le, T.T.; Messens, K.; Van Camp, J. Nutritional and Technological Aspects of Milk Fat Globule Membrane Material. Int. Dairy J. 2008, 18, 436–457. [Google Scholar] [CrossRef]
- Lung, J.; Doyen, A.; Remondetto, G.; Pouliot, Y.; Brisson, G. The Affinity of Milk Fat Globule Membrane Fragments and Buttermilk Proteins to Hydroxyapatite. J. Dairy Sci. 2024, 107, 4235–4247. [Google Scholar] [CrossRef]
- Sodini, I.; Morin, P.; Olabi, A.; Jiménez-Flores, R. Compositional and Functional Properties of Buttermilk: A Comparison Between Sweet, Sour, and Whey Buttermilk. J. Dairy Sci. 2006, 89, 525–536. [Google Scholar] [CrossRef]
- Garczewska-Murzyn, A.; Smoczyński, M.; Kotowska, N.; Kiełczewska, K. Effect of Buttermilk and Skimmed Milk Powder on the Properties of Low-Fat Yoghurt. J. Food Sci. Technol. 2022, 59, 2160–2167. [Google Scholar] [CrossRef]
- McGovern, C.J.; González-Orozco, B.D.; Jiménez-Flores, R. Evaluation of Kefir Grain Microbiota, Grain Viability, and Bioactivity from Fermenting Dairy Processing by-Products. J. Dairy Sci. 2024, 107, 4259–4276. [Google Scholar] [CrossRef]
- Hickey, C.D.; O’Sullivan, M.G.; Davis, J.; Scholz, D.; Kilcawley, K.N.; Wilkinson, M.G.; Sheehan, J.J. The Effect of Buttermilk or Buttermilk Powder Addition on Functionality, Textural, Sensory and Volatile Characteristics of Cheddar-Style Cheese. Food Res. Int. 2018, 103, 468–477. [Google Scholar] [CrossRef] [PubMed]
- Mistry, V.V.; Metzger, L.E.; Maubois, J.L. Use of Ultrafiltered Sweet Buttermilk in the Manufacture of Reduced Fat Cheddar Cheese. J. Dairy Sci. 1996, 79, 1137–1145. [Google Scholar] [CrossRef]
- Poduval, V.S.; Mistry, V.V. Manufacture of Reduced Fat Mozzarella Cheese Using Ultrafiltered Sweet Buttermilk and Homogenized Cream. J. Dairy Sci. 1999, 82, 1–9. [Google Scholar] [CrossRef]
- Szkolnicka, K.; Dmytrów, I.; Mituniewicz-Małek, A. Buttermilk Ice Cream—New Method for Buttermilk Utilization. Food Sci. Nutr. 2020, 8, 1461–1470. [Google Scholar] [CrossRef]
- Santos, H.C.; Leonel, G.V.F.; da Silva Ramos, L.C.; Hudson, E.A.; Pinto, M.S.; de Rezende, J.P.; Vidigal, M.C.T.R.; dos Pires, A.C.S. Enhancing Dairy Sustainability: Rheological, Sensory, and Physical-Chemical Properties of Low-Fat Fermented Beverages Incorporating Buttermilk. J. Clean. Prod. 2024, 443, 141159. [Google Scholar] [CrossRef]
- Elkashef, H.; Mobdy, A.A.; Hassan, A. Texture, Microstructure, and Antioxidant Characteristics of Bio-Fermented Milk Fortified with Buttermilk Nano-Powder. Int. Dairy J. 2022, 126, 105248. [Google Scholar] [CrossRef]
- Vidhauliya, Y.; Singh, B.; Kumar, A. Enhancement of Nutritional Value of Fermented Buttermilk Using Vitamin A and D. Int. J. Hortic. Agric. Food Sci. 2024, 8, 26–31. [Google Scholar] [CrossRef]
- Gebreselassie, N.; Abrahamsen, R.K.; Beyene, F.; Abay, F.; Narvhus, J.A. Chemical Composition of Naturally Fermented Buttermilk. Int. J. Dairy Technol. 2016, 69, 200–208. [Google Scholar] [CrossRef]
- Chen, L.H.; Chen, I.C.; Chen, P.Y.; Huang, P.H. Application of Butterfly Pea Flower Extract in Mask Development. Sci. Pharm. 2018, 86, 53. [Google Scholar] [CrossRef]
- Limsuwan, T.; Paekul, N.; Ingsriwan, L. Effects of Butterfly Pea Extract and Flower Petals on Sensory, Physical, Chemical and Microbiological Characteristics of Sugar-Free Ice Cream. Asian J. Food Agro-Ind. 2014, 7, 057–067. [Google Scholar]
- Siti Azima, A.M.; Noriham, A.; Manshoor, N. Phenolics, Antioxidants and Color Properties of Aqueous Pigmented Plant Extracts: Ardisia colorata Var. Elliptica, Clitoria ternatea, Garcinia mangostana and Syzygium cumini. J. Funct. Foods 2017, 38, 232–241. [Google Scholar] [CrossRef]
- Jeyaraj, E.J.; Lim, Y.Y.; Choo, W.S. Extraction Methods of Butterfly Pea (Clitoria ternatea) Flower and Biological Activities of Its Phytochemicals. J. Food Sci. Technol. 2021, 58, 2054–2067. [Google Scholar] [CrossRef]
- Azahar, S.S.; Raja, P.B.; Mohamad Ibrahim, M.N.; Awang, K.; Zakeyuddin, M.S.; Hamidon, T.S.; Hussin, M.H. Extraction of Flavonoids from Butterfly Blue Pea (Clitoria ternatea) Flower as Carbon Steel Corrosion Inhibitor in CO2 Environment: Experimental and Theoretical Approaches. J. Mol. Liq. 2024, 396, 124056. [Google Scholar] [CrossRef]
- Rashid, N.F.M.; Zulkifli, N.A.; Anwar, N.Z.R.; Gani, H.S.M.; Jusoh, T.F.I.C.K. Physicochemical Properties, Antioxidant Activities and Sensory Evaluation of Butterfly Pea (Clitoria Ternatea L.) Ice Cream Flavoured with Citrus Juice. Biosci. Res. 2022, 19 (Suppl. S1), 73–81. [Google Scholar]
- Hidas, K.I.; Nyulas-Zeke, I.C.; Szepessy, A.; Romvári, V.; Gerhart, K.; Surányi, J.; Laczay, P.; Darnay, L. Physical Properties of Hemp Drink-Based Ice Cream with Different Plant Proteins Guar Gum and Microbial Transglutaminase. LWT 2023, 182, 114865. [Google Scholar] [CrossRef]
- Hidas, K.I.; Visy, A.; Csonka, J.; Nyulas-Zeke, I.C.; Friedrich, L.; Pásztor-Huszár, K.; Alpár, B.; Hitka, G.; Felföldi, J.; Fehér, O.; et al. Development of a Novel Gluten-Free Egg Pie Product: Effects of Sensory Attributes and Storage. Sustainability 2020, 12, 10389. [Google Scholar] [CrossRef]
- Horváth-Mezőfi, Z.; Baranyai, L.; Nguyen, L.L.P.; Dam, M.S.; Ha, N.T.T.; Göb, M.; Sasvár, Z.; Csurka, T.; Zsom, T.; Hitka, G. Evaluation of Color and Pigment Changes in Tomato after 1-Methylcyclopropene (1-MCP) Treatment. Sensors 2024, 24, 2426. [Google Scholar] [CrossRef] [PubMed]
- Csurka, T.; Szücs, F.; Csehi, B.; Friedrich, L.F.; Pásztor-Huszár, K. Substitution of milk allergen ingredient by blood plasma powder in custard with different sweeteners. Prog. Agric. Eng. Sci. 2021, 17 (Suppl. S1), 77–85. [Google Scholar] [CrossRef]
- Hidas, K.I.; Németh, C.; Le Nguyen, L.P.; Visy, A.; Tóth, A.; Barkó, A.; Friedrich, L.; Nagy, A.; Nyulas-Zeke, I.C. Effect of Cryogenic Freezing on the Rheological and Calorimetric Properties of Pasteurized Liquid Egg Yolk. Czech J. Food Sci. 2021, 39, 181–188. [Google Scholar] [CrossRef]
- Amador, J.; Hartel, R.; Rankin, S. The Effects of Fat Structures and Ice Cream Mix Viscosity on Physical and Sensory Properties of Ice Cream. J. Food Sci. 2017, 82, 1851–1860. [Google Scholar] [CrossRef] [PubMed]
- Innocente, N.; Biasutti, M.; Venir, E.; Spaziani, M.; Marchesini, G. Effect of high-pressure homogenization on droplet size distribution and rheological properties of ice cream mixes. J. Dairy Sci. 2009, 92, 1864–1875. [Google Scholar] [CrossRef]
- Javidi, F.; Razavi, S.M.A.; Behrouzian, F.; Alghooneh, A. The influence of basil seed gum, guar gum and their blend on the rheological, physical and sensory properties of low fat ice cream. Food Hydrocoll. 2016, 52, 625–633. [Google Scholar] [CrossRef]
- Kot, A.; Kamińska-Dwórznicka, A.; Galus, S.; Jakubczyk, E. Effects of different ingredients and stabilisers on properties of mixes based on almond drink for vegan ice cream production. Sustainability 2021, 13, 12113. [Google Scholar] [CrossRef]
- Kurt, A.; Atalar, I. Effects of quince seed on the rheological, structural and sensory characteristics of ice cream. Food Hydrocoll. 2018, 82, 186–195. [Google Scholar] [CrossRef]
- Mostafavi, F.S.; Tehrani, M.M.; Mohebbi, M. Rheological and sensory properties of fat reduced vanilla ice creams containing milk protein concentrate (MPC). J. Food Meas. Charact. 2017, 11, 567–575. [Google Scholar] [CrossRef]
- Csurka, T.; Hidas, K.I.; Varga-Tóth, A.; Dalmadi, I.; Pásztor-Huszár, K.; Friedrich, L.F. Effect of High Biological Value Animal Protein Sources on the Techno-Functional Properties of Ice Cream. Sustainability 2023, 15, 16794. [Google Scholar] [CrossRef]
- Ghaderi, S.; Mazaheri Tehrani, M.; Hesarinejad, M.A. Qualitative Analysis of the Structural, Thermal and Rheological Properties of a Plant Ice Cream Based on Soy and Sesame Milks. Food Sci. Nutr. 2021, 9, 1289–1298. [Google Scholar] [CrossRef] [PubMed]
- Koxholt, M.M.R.; Eisenmann, B.; Hinrichs, J. Effect of the Fat Globule Sizes on the Meltdown of Ice Cream. J. Dairy Sci. 2001, 84, 31–37. [Google Scholar] [CrossRef]
- Sofjan, R.P.; Hartel, R.W. Effects of Overrun on Structural and Physical Characteristics of Ice Cream. Int. Dairy J. 2004, 14, 255–262. [Google Scholar] [CrossRef]
- Aksornsri, T.; Chaturapornchai, N.; Jitsayen, N.; Rojjanapaitoontip, P.; Peanparkdee, M. Development of Kombucha-like Beverage Using Butterfly Pea Flower Extract with the Addition of Tender Coconut Water. Int. J. Gastron. Food Sci. 2023, 34, 100825. [Google Scholar] [CrossRef]
- Setiawati, A.E.; Kusnadi, J. Optimization of Fermentation Time and Grain Concentration for Water Kefir Production from Butterfly Pea Flower (Clitoria ternatea). IOP Conf. Ser. Earth Environ. Sci. 2021, 924, 012081. [Google Scholar] [CrossRef]
- Mary, S.K.; Koshy, R.R.; Pillai, P.K.S.; Reghunadhan, A.; Pothen, L.A. Butterfly Pea Flower Anthocyanin Immobilized pH Sensitive Intelligent Nanocomposite Films of Starch/Chitin with Improved Thermal and Mechanical Properties. Starch-Stärke 2024, 76, 2200287. [Google Scholar] [CrossRef]
- Mary, S.; Koshy, R.; Daniel, J.; Koshy, J.; Pothan, L.; Thomas, S. Development of Starch Based Intelligent Films by Incorporating Anthocyanins of Butterfly Pea Flower and TiO 2 and Their Applicability as Freshness Sensors for Prawns during Storage. RSC Adv. 2020, 10, 39822–39830. [Google Scholar] [CrossRef]
- Narayanan, G.P.; Radhakrishnan, P.; Baiju, P. Fabrication Of Butterfly Pea Flower Anthocyanin-Incorporated Colorimetric Indicator Film Based On Gelatin/Pectin For Monitoring Fish Freshness. Food Hydrocoll. Health 2023, 4, 100159. [Google Scholar] [CrossRef]
- Hasanah, N.N.; Mohamad Azman, E.; Rozzamri, A.; Zainal Abedin, N.H.; Ismail-Fitry, M.R. A Systematic Review of Butterfly Pea Flower (Clitoria ternatea L.): Extraction and Application as a Food Freshness pH-Indicator for Polymer-Based Intelligent Packaging. Polymers 2023, 15, 2541. [Google Scholar] [CrossRef] [PubMed]
- Thilakarathna, H.I.U.; Jayarathna, G.N.; Mudannayake, D.C. Probiotic Ice Cream Incorporated with Blue Pea Flower (Clitoria ternatea) as a Natural Colorant and Dehydrated Banana Flour as a Potential Prebiotic Ingredient. Food Life 2023, 2023, 67–75. [Google Scholar] [CrossRef]
- El-Kholy, A.; El-Nour, A.; El-Safty, M.; Mokbel, S. Utilization of buttermilk in low fat ice cream making. Ismailia J. Dairy Sci. Technol. 2014, 1, 11–18. [Google Scholar] [CrossRef]
- Aboulfazli, F.; Baba, A.S.; Misran, M. The Rheology and Physical Properties of Fermented Probiotic Ice Creams Made with Dairy Alternatives. Int. J. Food Eng. 2015, 11, 493–504. [Google Scholar] [CrossRef]
- Aboulfazli, F.; Baba, A.S.; Misran, M. Effects of Fermentation by Bifidobacterium Bifidum on the Rheology and Physical Properties of Ice Cream Mixes Made with Cow and Vegetable Milks. Int. J. Food Sci. Technol. 2015, 50, 942–949. [Google Scholar] [CrossRef]
- Larsson, M.; Duffy, J. An Overview of measurement Techniques for determination of yield stress. Annu. Trans. Rheol. Soc. 2013, 21, 125–138. [Google Scholar]
- Dertli, E.; Toker, O.S.; Durak, M.Z.; Yilmaz, M.T.; Tatlısu, N.B.; Sagdic, O.; Cankurt, H. Development of a Fermented Ice-Cream as Influenced by in Situ Exopolysaccharide Production: Rheological, Molecular, Microstructural and Sensory Characterization. Carbohydr. Polym. 2016, 136, 427–440. [Google Scholar] [CrossRef] [PubMed]
- Warren, M.M.; Hartel, R.W. Effects of Emulsifier, Overrun and Dasher Speed on Ice Cream Microstructure and Melting Properties. J. Food Sci. 2018, 83, 639–647. [Google Scholar] [CrossRef]
- Wu, B.; Freire, D.O.; Hartel, R.W. The effect of overrun, fat destabilization, and ice cream mix viscosity on entire meltdown behavior. J. Food Sci. 2019, 84, 2562–2571. [Google Scholar] [CrossRef] [PubMed]
- Favaro-Trindade, C.S.; de Carvalho Balieiro, J.C.; Dias, P.F.; Amaral Sanino, F.; Boschini, C. Effects of Culture, pH and Fat Concentration on Melting Rate and Sensory Characteristics of Probiotic Fermented Yellow Mombin (Spondias Mombin L.). Ice Creams. Food Sci. Technol. Int. 2007, 13, 285–291. [Google Scholar] [CrossRef]


| Ingredients | Buttermilk Content * | |||||
|---|---|---|---|---|---|---|
| 0% | 20% | 40% | 60% | 80% | 100% | |
| Buttermilk | 0 | 11.14 | 22.28 | 33.42 | 44.56 | 55.7 |
| Milk | 55.7 | 44.56 | 33.42 | 22.28 | 11.14 | 0 |
| Cream | 25.3 | 25.2 | 26.0 | 26.6 | 26.5 | 27.5 |
| Sucrose | 12.8 | 12.8 | 12.2 | 11.7 | 11.7 | 10.9 |
| Dextrose | 6.4 | 6.4 | 6.1 | 5.8 | 5.8 | 5.5 |
| Milk protein isolate | 0.1 | 0.15 | 0.25 | 0.4 | 0.5 | 0.6 |
| Locust bean powder | 0.1 | 0.1 | 0.1 | 0.1 | 0.1 | 0.1 |
| Vanilla extract | 0.1 | 0.1 | 0.1 | 0.1 | 0.1 | 0.1 |
| Buttermilk Content (%)/Fermentation | 0 | 20 | 40 | 60 | 80 | 100 | |||||||
|---|---|---|---|---|---|---|---|---|---|---|---|---|---|
| NF | F | NF | F | NF | F | NF | F | NF | F | NF | F | ||
| 0 | NF | 0.00 | 4.50 | 15.49 | 3.77 | 17.30 | 5.79 | 20.95 | 8.93 | 23.40 | 11.94 | 28.21 | 14.57 |
| F | - | 0.00 | 19.39 | 4.88 | 20.93 | 8.76 | 24.52 | 12.05 | 27.15 | 15.35 | 32.09 | 18.17 | |
| 20 | NF | - | - | 0.00 | 15.04 | 2.67 | 11.26 | 5.97 | 8.69 | 7.99 | 6.22 | 12.77 | 4.93 |
| F | - | - | - | 0.00 | 16.34 | 4.09 | 19.87 | 7.30 | 22.58 | 10.66 | 27.57 | 13.53 | |
| 40 | NF | - | - | - | - | 0.00 | 12.54 | 3.67 | 9.64 | 6.26 | 6.88 | 11.33 | 5.12 |
| F | - | - | - | - | - | 0.00 | 16.06 | 3.30 | 18.72 | 6.61 | 23.65 | 9.45 | |
| 60 | NF | - | - | - | - | - | - | 0.00 | 13.02 | 3.03 | 10.06 | 8.09 | 7.81 |
| F | - | - | - | - | - | - | - | 0.00 | 15.72 | 3.38 | 20.63 | 6.28 | |
| 80 | NF | - | - | - | - | - | - | - | - | 0.00 | 12.65 | 5.13 | 10.18 |
| F | - | - | - | - | - | - | - | - | - | 0.00 | 17.44 | 2.90 | |
| 100 | NF | - | - | - | - | - | - | - | - | - | - | 0.00 | 14.77 |
| F | - | - | - | - | - | - | - | - | - | - | - | 0.00 | |
| Percent of Buttermilk (%) | Treatment | Hardness [N] | Work of Shear [Nmm] |
|---|---|---|---|
| 0 | Non-fermented | 8.45 ± 3.975 | 18.93 ± 9.117 |
| Fermented | 21.74 ± 5.546 | 40.40 ± 20.819 | |
| 20 | Non-fermented | 10.58 ± 4.013 | 13.58 ± 5.594 |
| Fermented | 27.24 ± 9.548 | 49.27 ± 21.027 | |
| 40 | Non-fermented | 10.43 ± 4.128 | 20.97 ± 8.741 |
| Fermented | 18.24 ± 4.323 | 31.61 ± 11.068 | |
| 60 | Non-fermented | 14.27 ± 5.907 | 35.31 ± 21.260 |
| Fermented | 7.97 ± 2.232 | 18.89 ± 5.382 | |
| 80 | Non-fermented | 5.77 ± 1.919 | 11.04 ± 5.434 |
| Fermented | 21.21 ± 6.486 | 38.87 ± 18.888 | |
| 100 | Non-fermented | 13.73 ± 3.997 | 22.48 ± 8.843 |
| Fermented | 16.47 ± 4.188 | 26.49 ± 11.346 |
Disclaimer/Publisher’s Note: The statements, opinions and data contained in all publications are solely those of the individual author(s) and contributor(s) and not of MDPI and/or the editor(s). MDPI and/or the editor(s) disclaim responsibility for any injury to people or property resulting from any ideas, methods, instructions or products referred to in the content. |
© 2024 by the authors. Licensee MDPI, Basel, Switzerland. This article is an open access article distributed under the terms and conditions of the Creative Commons Attribution (CC BY) license (https://creativecommons.org/licenses/by/4.0/).
Share and Cite
Nyulas-Zeke, I.C.; Hidas, K.I.; Pásztor-Huszár, K.; Dalmadi, I.; Szücs, E.; Pap, R.; Csurka, T. Analysis of Techno-Functional Properties of Fermented and Non-Fermented Buttermilk-Containing Ice Creams. Sustainability 2024, 16, 7714. https://doi.org/10.3390/su16177714
Nyulas-Zeke IC, Hidas KI, Pásztor-Huszár K, Dalmadi I, Szücs E, Pap R, Csurka T. Analysis of Techno-Functional Properties of Fermented and Non-Fermented Buttermilk-Containing Ice Creams. Sustainability. 2024; 16(17):7714. https://doi.org/10.3390/su16177714
Chicago/Turabian StyleNyulas-Zeke, Ildikó Csilla, Karina Ilona Hidas, Klára Pásztor-Huszár, István Dalmadi, Enikő Szücs, Rebeka Pap, and Tamás Csurka. 2024. "Analysis of Techno-Functional Properties of Fermented and Non-Fermented Buttermilk-Containing Ice Creams" Sustainability 16, no. 17: 7714. https://doi.org/10.3390/su16177714
APA StyleNyulas-Zeke, I. C., Hidas, K. I., Pásztor-Huszár, K., Dalmadi, I., Szücs, E., Pap, R., & Csurka, T. (2024). Analysis of Techno-Functional Properties of Fermented and Non-Fermented Buttermilk-Containing Ice Creams. Sustainability, 16(17), 7714. https://doi.org/10.3390/su16177714