Article

Development and Analysis of Artificial Ornamental Stone with Industrial Wastes and Epoxy Resin

by
Rivelino Neri Silva
1,*,
Anderson Ravik dos Santos
1,
Patrícia Santiago de Oliveira Patrício
2 and
Wanna Carvalho Fontes
1
1
Department of Civil Engineering, Federal University of Ouro Preto (UFOP), Morro do Cruzeiro University Campus, Ouro Preto 35400-000, Brazil
2
IntechLab Laboratory, Chemistry Department, Federal Center for Technological Education of Minas Gerais (CEFET-MG), Belo Horizonte 30510-000, Brazil
*
Author to whom correspondence should be addressed.
Sustainability 2024, 16(17), 7715; https://doi.org/10.3390/su16177715
Submission received: 25 July 2024 / Revised: 1 September 2024 / Accepted: 3 September 2024 / Published: 5 September 2024

Abstract

:
The mining and steelmaking industries, while vital for economic and social development, produce and dispose of waste that contributes to environmental instability and discomfort. In this context, this study aimed to develop novel polymer composites intended for Artificial Ornamental Stone (AOS) application by incorporating iron ore tailings (IOTs), quartzite waste (QTZ), and steel slag (SS) into an epoxy (EP) matrix. The chemical, mineralogical, physical, mechanical, morphological, and thermal properties of the materials were assessed. Three waste mixtures were proposed using the Modified Andreassen Curve method, each with 35, 45, and 55 v/v% of EP. The composite properties were evaluated, showing that the composite with QTZ, SS, and 55 v/v% EP exhibited the lowest porosity (0.3%), water absorption (0.1%), and highest flexural strength (41 MPa). The composite containing the three wastes with 55 v/v% EP presented 1.0% porosity, 0.4% water absorption, and 34 MPa flexural strength. Lastly, the composite with IOTs, QTZ, and 55 v/v% EP exhibited 1.1% apparent porosity, 0.5% water absorption, and 23 MPa flexural strength. Therefore, the polymer composites developed with IOTs, QTZ, SS, and EP demonstrated suitable properties for wall cladding and countertops, presenting a potentially sustainable alternative to reduce environmental impacts from the mining and steelmaking industries.

1. Introduction

Critical for economic and social development, the mining and steel industries extract and produce large volumes of materials. The 2023 world iron production was approximately 2.5 billion metric tons, contributed mainly by Australia (38.4%) and Brazil (17.6%) [1]. The natural ornamental stone industry also deals with large volumes of materials, where, for instance, the Brazilian industry alone exploited over 10.2 million tons of natural ornamental stones in 2023 [2]. Lastly, the steelmaking industry produced approximately 1.9 billion tons of steel, which was produced mainly by basic oxygen furnaces (71.1%) and primarily used in the building and infrastructure sector (52%) [3]. However, the negative environmental impact of these industries is significant, being exacerbated by their large scale. This can limit the availability of natural resources and damage ecosystem quality. Resource extraction can deplete natural resources and degrade ecosystem quality, increasing water turbidity, altering water quality and pH, causing soil and water pollution with heavy metals, contributing to air pollution, and leading to the extinction of flora and fauna [4]. Moreover, the waste disposal in piles and waste dams can generate further impacts, including human losses, due to a dam’s collapse.
The scale of the negative environmental impacts is larger considering that iron ore and quartzite (one kind of natural ornamental stone) industries can generate from 20 to 40% and up to 92% of waste, respectively, while approximately 62% of waste is generated for each ton of steel produced [5,6,7]. The Brazilian production in 2021 would mean up to 224 million tons of iron ore tailings and 22 million tons of steel slag.
In this context, incorporating iron ore tailings (IOTs), quartzite waste (QTZ), and steel slag (SS) into civil construction materials can contribute to reducing negative environmental impacts. The main use of IOTs and QTZ in civil construction is as aggregate substitutes while SS has a broader applicability, including cement/concrete addition and road construction. Incorporating industrial wastes reduces natural resource consumption and enhances waste management [8,9,10]. The contributions are related to the Sustainable Development Goals (SDG) 9 (Industry, Innovation and Infrastructure), 11 (Sustainable Cities and Communities), 12 (Responsible Consumption and Production), 14 (Life Below Water), and 15 (Life on Land), proposed by the United Nations (UN) as part of the 2030 Agenda for Sustainable Development [11].
IOTs, QTZ, and SS have been extensively studied on construction material incorporation in applications such as geopolymers, pigments, ceramics, pavement structures, mortars, concretes, and other composites [12,13,14,15,16,17,18,19,20]. Fontes et al. [21] developed laying and coating mortars with IOTs from tailing dams. They obtained mortars with higher densities, lower levels of incorporated air, and higher mechanical properties when compared to conventional mortars. De Carvalho et al. [22] obtained concretes with up to 99 MPa compressive strength using up to 95 v/v% recycled material, including QTZ and SS. Rana and Singh [20] conducted a review of microstructural properties of SS-based concretes and found that SS has a positive effect on the microstructural characteristics of concretes with replacements of up to 20% of Portland cement, 50% of coarse aggregate, and 30% of fine aggregate, as well as increasing their fire resistance and mechanical and durability properties.
Among civil construction materials, one innovative approach to incorporating industrial wastes is the production of polymer composites known as Artificial Ornamental Stone (AOS). These composites combine the advantages of both inorganic (industrial waste) and organic (polymer) materials, resulting in products with high mechanical strength, low density, low water absorption, and reduced production costs [23]. They have a wide variety of applications, from wall and floor coverings, tabletops, and countertops to tombstones.
The polymers used in AOS production vary between thermoplastics and thermosets, each contributing distinct properties to the final AOS product. Gomes et al. [24] produced AOS using 85 wt% granite waste and 15 wt% vegetable polyurethane from castor oil through vacuum vibrocompression, obtaining composites with low water absorption (0.13%), apparent porosity (0.31%), and good flexural strength (17.31 MPa). Ribeiro et al. [25] used 85 v/v % marble residue and 15 v/v % unsaturated orthophtalic polyester resin through resin transfer molding. They obtained AOS with a density of 2.27 g/cm3, higher apparent porosity (8.28%), water absorption (3.64%), and low compressive strength (16.7 MPa).
On the other hand, cured epoxy, denoted as EP, is a thermoset polymer attractive to AOS production mainly due to the crosslinked polymer chain that enhances mechanical resistance. It is worth noting that EP properties highly vary with the monomers used, their chemical structure, and the curing conditions. Generally, the properties can reach the following values: density from 1.2 to 1.3 g/cm3, water absorption from 0.04 to 1.00%, impact resistance from 10 to 50 J/m, a three-point flexural strength of 34–200 MPa, a flexural Young modulus of 3400–31,000 MPa, thermal conductivity from 0.19 to 0.34 W/m.k, and linear shrinkage from 0.001 to 0.01 [26].
In this context, Aggrizzi et al. [27] produced AOS using 15 wt% of EP and 85 wt% QTZ through vacuum vibrocompression and achieved 2.35 g/cm3 density, 0.38% apparent porosity, 0.16% water absorption, and 27.96 MPa flexural strength. Barreto et al. [28] also produced AOS through vacuum vibrocompression with EP (15 wt%), glass packaging waste, and quartz powder, obtaining AOS with 2.26 g/cm3 apparent density, 0.21% apparent porosity, 0.1% water absorption, and 33.54 MPa flexural strength. Epoxy composites have also been produced with other industrial wastes as filler, such as brick [29] and micro-sized marble dust [30], enhancing heat resistance, thermal conductivity, compressive strength, and decreased water absorption.
This work used transfer molding to produce AOS using IOTs, QTZ, SS, and EP. The incorporation of IOTs into the epoxy matrix for AOS production and the combination of two or more waste materials has not been documented in the literature. Additionally, the use of the transfer molding process and particle proportioning via the Modified Andreassen Curve method further underscores the innovative aspects of this work. Therefore, the main aim of this work is to evaluate the feasibility of producing a polymer composite containing EP and industrial wastes that is adequate for application as AOS. The composites produced enhanced physical, mechanical, and thermal properties adequate for wall and floor covering, tables, and countertops. The importance of the knowledge domain to the civil construction sector comes from reducing the natural resources exploitation of industrial waste disposal and providing innovative and sustainable solutions with competitive potential on the market.

2. Materials and Methods

2.1. Materials

All industrial wastes were collected according to the ABNT NBR NM 26 standard [31]. Before testing, the three types of industrial waste were dried in an oven at 100 °C for 24 h and stored in plastic bags to prevent moisture absorption. The IOTs were collected from the Maravilhas Dam in Itabirito—MG, Brazil. They were weathered in open air for 2 years, dried in an oven at 100 ± 5 °C for 24 h, ground in a porcelain mortar, and stored in plastic bags to prevent moisture contact. The QTZ was obtained by a company located in Três Corações—MG, Brazil. It was dried in an oven at 100 ± 5 °C for 24 h, and stored in plastic bags to prevent moisture contact. Lastly, the SS, a Basic Oxygen Furnace Slag (BOFS) waste, was obtained from a company located in João Monlevade—MG, Brazil. It was also exposed to outdoor conditions for 2 years, dried in an oven at 100 ± 5 °C for 24 h, ground in a Retsch jaw mill until particles were smaller than 2.4 mm, then further ground in a Marconi MA500 horizontal ball mill for 180 min with 15 min breaks every 60 min. The resulting material was stored in plastic bags to prevent moisture contact.
The EP used was supplied by EpoxyFiber company—located in Rio de Janeiro, Brazil—and was composed of Diglycidyl Ether of Bisphenol A (DGEBA) prepolymer and Triethylenetetramine (TETA) hardener. They were mixed in proportion of 90 wt% DGEBA with 10 wt% TETA and the components presented density values of 1.15 and 0.98 g/cm3, respectively.

2.2. Methods

2.2.1. Materials’ Characterization Methods

Firstly, the chemical composition of the industrial wastes was obtained through X-ray fluorescence (XRF). Particles smaller than 75 µm were analyzed by PANalytical Epsilon3x equipment (Malvern Panalytical—São Paulo, Brazil). The loss on ignition was also obtained through the mass difference between the initial sample (20 g) and the sample after being heated by a JUNG kiln, model 301 (fabricated by Jung—Blumenau, Brazil), at a heating rate of 10 °C/min until 1000 °C and held for 2 h,
The mineral composition was also obtained by X-ray diffraction (XRD) using the equipment Bruker D2 Phaser (produced by Bruker—Atibaia, Brazil), 2nd generation (40 kV, 30 mA), with copper radiations (CuKα) and 2θ ranging between 10 and 70° (0.02°/s). For the analysis, the X’Pert HighScore Plus® software (by Panalytical, v. 3.0.5) was used.
Regarding the physical properties, the real density of the industrial wastes was determined using the helium pycnometer method while water absorption was measured according to the ABNT NBR 16916 standard [32]. Particle size distribution was assessed using mechanical sieving, following the ABNT NBR 17054 standard [33], and with the laser particle sizer Bettersize 2000 (by Bettersize Instruments—São Paulo, Brazil), with particles below 1.2 mm. Water absorption was obtained for the EP following the ASTM D570 standard [34] and using six cylindric samples (1.7 cm diameter × 1.7 cm height). Based on the ASTM D792 standard [35], apparent density was also attained, measured by dividing the samples’ mass (conditioned at 120 °C) and the difference between the initial and final measurements of a pycnometer. This test also used six cylindric samples of 1.7 × 1.7 cm.
The EP mechanical properties were also assessed following the ASTM D695 standard of compressive strength and ASTM D790 for flexural strength [36,37]. The Instron EMIC 23-20 Universal Testing Machine (Instron—São José dos Pinhais, Brazil) was used for both tests with a 20 kN load cell and 1.3 mm/min load rate. For the compressive strength, eight samples measuring 1.7 cm in diameter and 1.7 cm in height were used, whereas for the flexural test, three samples were used measuring 12.7 mm × 3.2 mm × 127 mm with a 50 mm support span.
Scanning Electron Microscopy (SEM) images were obtained through a Tescan Vega 3 electronic microscope (Tescan—São Bernardo do Campo, Brazil), with secondary electrons and a high vacuum being used to analyze the materials’ morphology. The industrial wastes and EP’s samples were covered in gold powder by a Quorum Q150R ES device (Quorum Technologies—East Sussex, UK). The rupture area of a sample from the flexural strength test was used for the EP. The SEM images were used to evaluate the material’s shape, morphology, and the presence of voids and fine particles.
Thermogravimetry analysis (TGA) and its derivative (DTG) were also obtained for the materials using Shimadzu DTG-60H equipment (Shimadzu—Rio de Janeiro, Brazil) with a gas flux of 50 mL/min and a heating rate of 10 °C/min until the maximum temperatures of 1100 °C for the industrial wastes and 900 °C for the EP. The TA-60WS® software (TA Instruments, v. 2.01) was used to obtain the curve parameters.

2.2.2. Polymeric Composites’ Proportioning and Production

The modified Andreassen Curve method was used for the industrial waste proportioning, following Equation (1). Here, D represents the particle diameter; CPFT is the percentual of particles smaller than D; DS and DL are the smallest and largest particle diameters, respectively; and q is the distribution coefficient, which considers the mixture’s workability and is set at 0.2 for better auto densification.
CPFT % = 100 × D q D S q D L q D S q
Three mixtures were proposed based on the lowest deviations from the Modified Andreassen Curve wherein the combinations of different wastes were aimed to evaluate the isolated effects of each material on the AOS final properties. The mixtures, considering only the volumes of industrial wastes, were 30I40Q30S with 30 v/v % IOTs, 40% vol QTZ, and 30 v/v % SS; 90I10Q0S with 90 v/v % IOTs and 10 v/v % QTZ; and 0I55Q45S with 55 v/v % QTZ and 45 v/v % SS.
The industrial waste contents obtained by the Modified Andreassen Curve method were produced, varying the EP content in 35, 45, and 55 v/v %, as shown in Table 1.
To identify the best EP content for each industrial waste mixture, the apparent density, apparent porosity, water absorption, and compressive strength were assessed, except for the 90I10Q0S composite that did not present cohesion after molding on pre-tests.
The production of the AOS followed the following steps: (1) the EP components (DGEBA and TETA) were mixed for 1 min in a polypropylene container, and the resin-to-catalyst ratio was 1:10 wt%; (2) the industrial wastes were hand-mixed with a wooden rod for better homogenization and particle dispersion; (3) the industrial wastes were added to the EP and hand-mixed for 4 min; and (4) the composite was transferred to the silicone mold and cured at room temperature for 24 h.

2.2.3. Polymeric Composites’ Characterization Methods

As mentioned, the apparent density, porosity, water absorption, and compressive strength were first assessed to determine the best EP content for each industrial waste proportion. Five cylinder-shaped samples measuring 1.5 cm × 1.5 cm were used for each mixture, and the ABNT NBR 15845-2 and 15845-5 standards were followed [38,39]. The Instron EMIC 23-20 Universal Testing Machine (Instron—São José dos Pinhais, Brazil) was used for the compressive strength test with a 20 kN load cell and 0.5 mm/min load rate.
The composites with the best EP content for each industrial waste mixture also had their flexural strength, morphology, and thermal behavior evaluated. The three-point flexural strength was obtained following the ABNT NBR 15845-6 [40], with five samples each (13 mm × 25 mm × 55 mm), a load rate of 0.25 mm/min, and a support span of 40 mm in an Instron EMIC 23-20 Universal Testing Machine.
The morphology was evaluated through SEM images of the rupture area of the samples from the flexural strength test, which were covered in gold powder by Quorum Q150R ES equipment (Quorum Technologies—East Sussex, UK). The images were obtained through a Tescan Vega 3 electronic microscope (Tescan—São Bernardo do Campo, Brazil) with secondary electrons and a high vacuum. SEM images were obtained to evaluate the composite surface morphology, voids, and particle–matrix interface, influencing the composite properties.
Lastly, the composites’ thermal behavior was assessed through TGA and DTG techniques, using Shimadzu DTG-60 equipment (Shimadzu—Rio de Janeiro, Brazil) with a gas flux of 50 mL/min and a heating rate of 10 °C/min until the maximum temperature of 980 °C. The TA-60WS® software (TA Instruments, v. 2.01) was also used to obtain the curves’ parameters.

3. Results and Discussion

3.1. Materials’ Characterization

3.1.1. Materials’ Chemical and Mineral Composition

Table 2 shows the chemical composition of IOTs, QTZ, and SS, in oxides %, and the mineral structure that they present. It can be observed that the IOTs were mainly composed of iron oxide and smaller parts of silicon and aluminum oxides, appearing as goethite, hematite, kaolinite, gibbsite, and quartz. A higher Fe2O3 content and the presence of goethite and hematite can promote higher apparent density, apparent porosity, and water absorption. The QTZ was predominantly composed of silicon oxide (as quartz) and aluminum oxide in smaller quantities. SiO2 and quartz reduce apparent density, apparent porosity, and water absorption and, due to quartz’s high hardness, increase mechanical strength. On the other hand, SS has more calcium, iron, and silicon oxides and smaller amounts of magnesium and aluminum oxides. Its oxides are structured as brownmillerite, calcite, larnite and wüstite minerals. CaO, SiO2, Fe2O3, and Al2O3 enhance thermal stability, glass transition temperature, and flexural and compressive strengths [41,42,43,44].
Moreover, the loss of ignition in industrial wastes is due to dehydroxylation once they have stabilized and do not present organic matter. The results showed that IOTs presented the most loss in terms of ignition (10.0%), followed by SS (1.8%) and QTZ with minimum loss (0.8%).

3.1.2. Materials’ Physical and Mechanical Properties

Regarding the physical properties, shown in Table 3 and Figure 1, SS presented the highest bulk density (3.71 g/cm3) due to its iron and aluminum oxide contents, followed by IOTs with an approximate value (3.68 g/cm3), also containing high-density components such as iron and aluminum oxides. QTZ showed the lowest density (2.53 g/cm3) among the industrial wastes due to its predominant SiO2 composition. Conversely, EP exhibited the lowest density amongst all materials (1.14 g/cm3) because of its organic nature, being composed of a carbonic chain lighter than the industrial wastes’ mineral components.
Table 3 also exhibits that IOTs constituted the most hygroscopic material, presenting 17.44% water absorption, followed by SS with 15.16%. This behavior was explained by their chemical and mineral compositions combined with their clayey nature. In contrast, QTZ presented a minimum water absorption (0.42%), which was explained by the low fine content combined with a predominantly quartz composition. Due to the hydrophobic nature of carbon chains, the EP exhibited the lowest water absorption (0.07%). Lastly, the results on the mechanical strength of EP were 15 MPa for compressive strength and 29 MPa for flexural strength, which was below the range (34–200 MPa) pointed out by the literature [26].

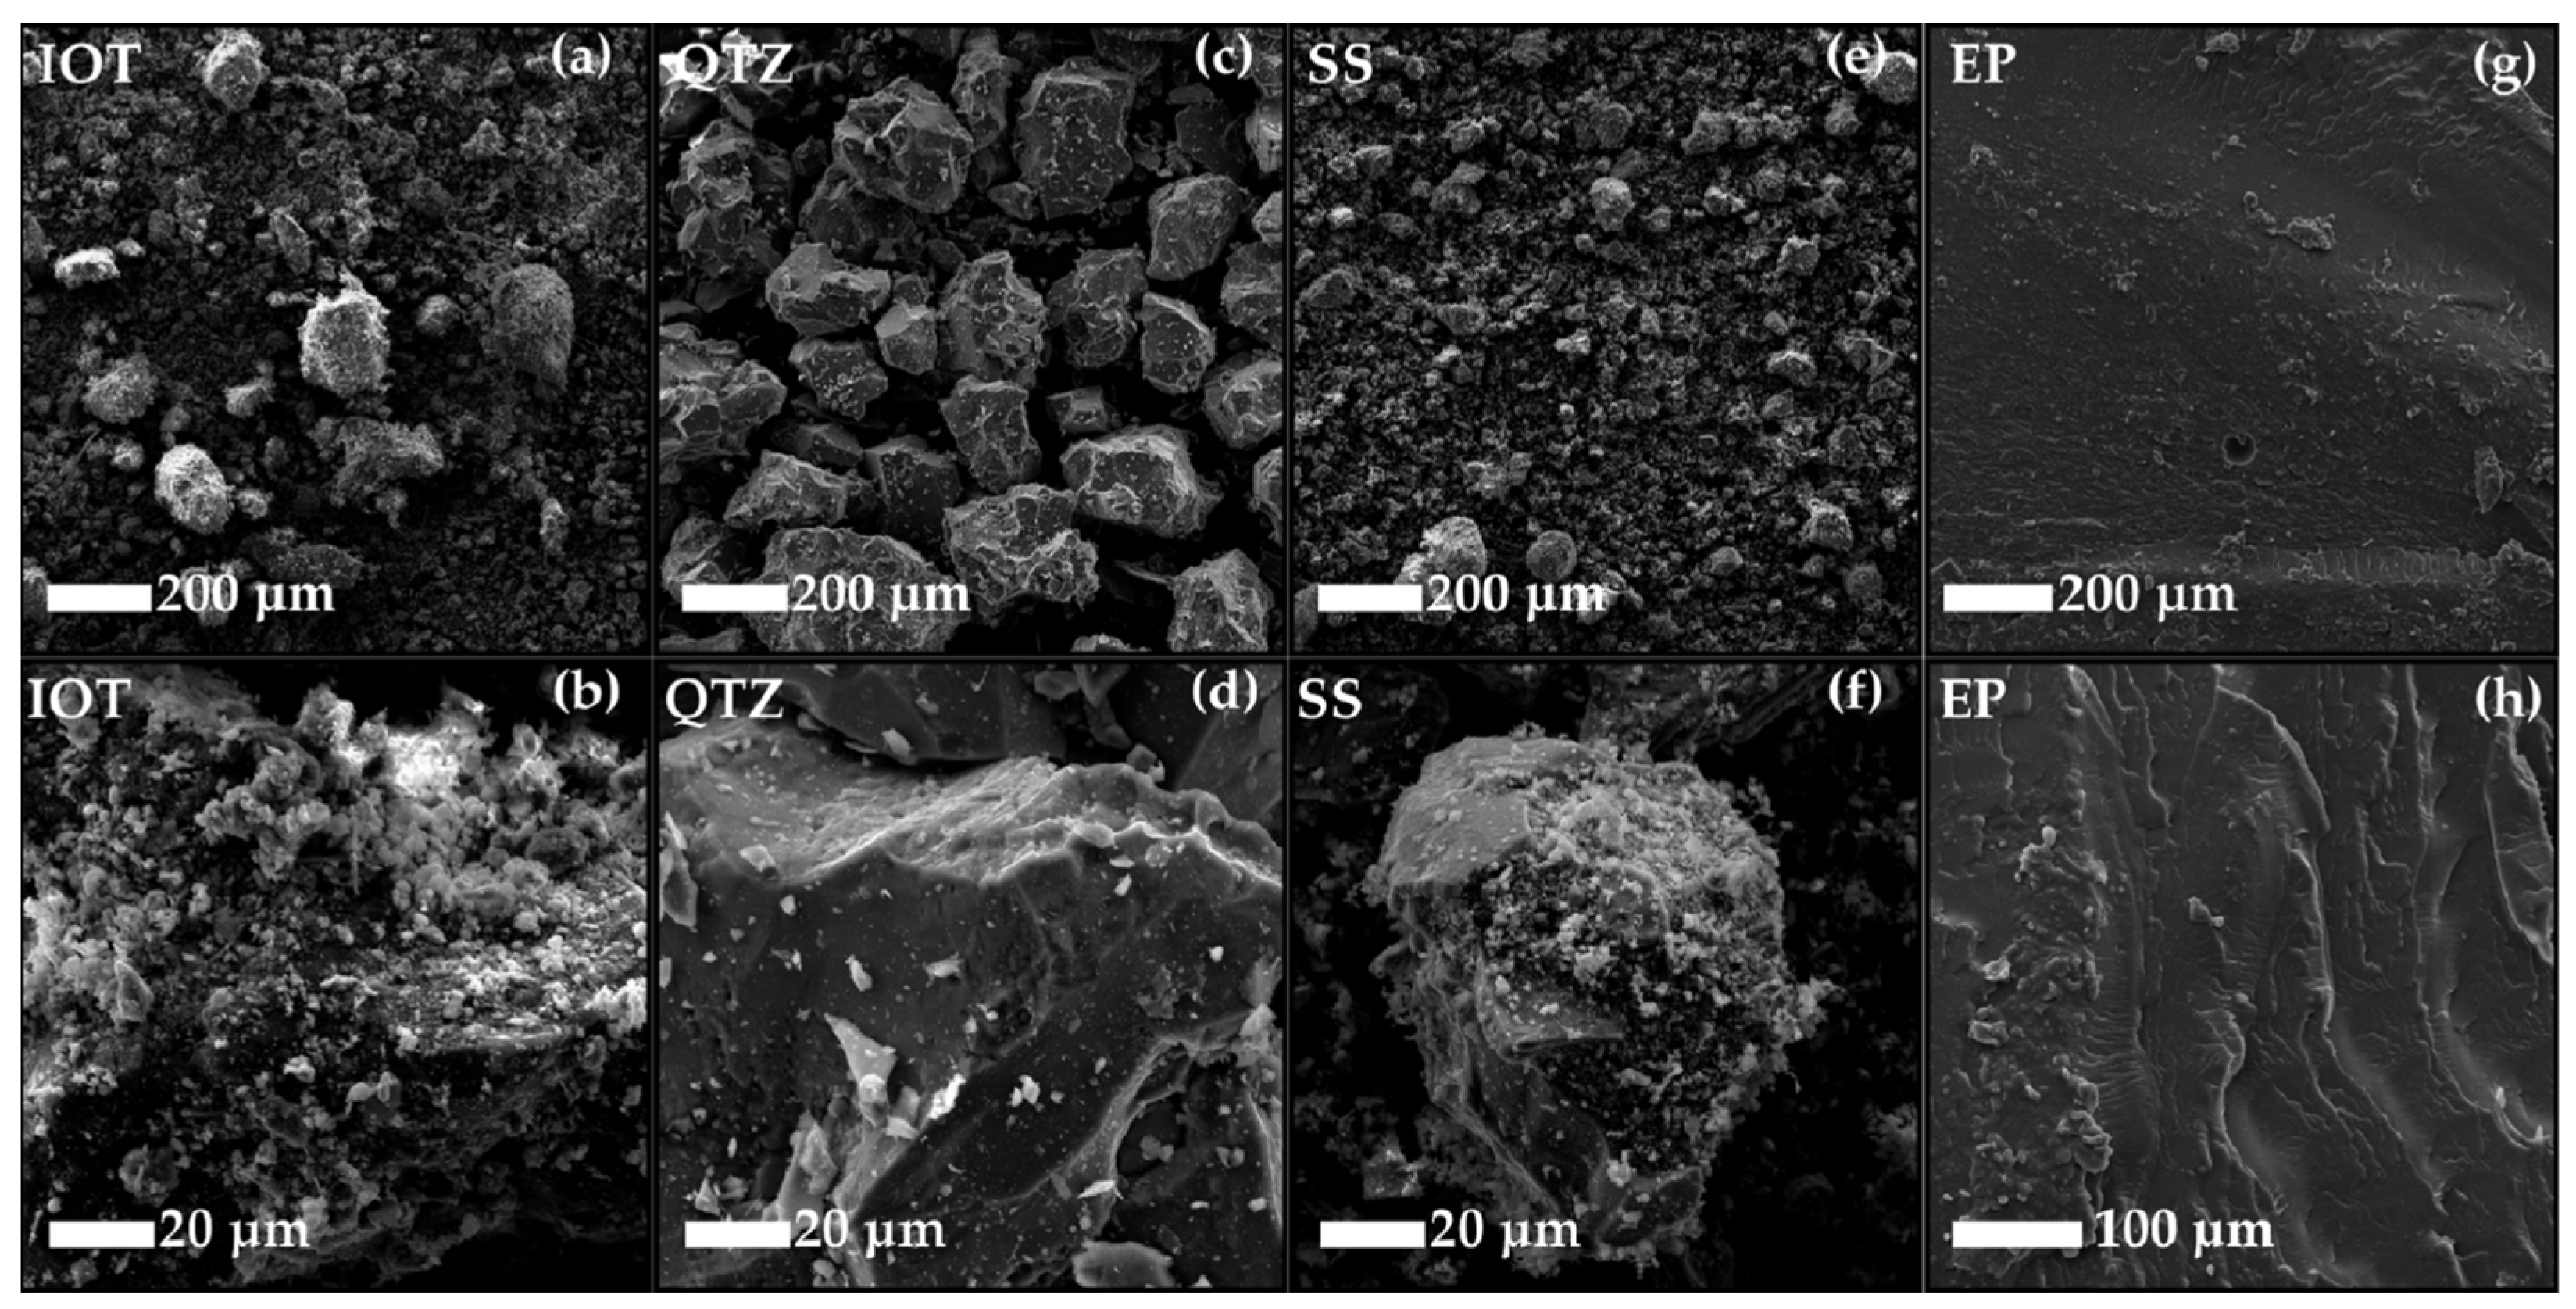
3.1.3. Materials’ Morphology

Figure 2 shows the SEM images of IOTs, QTZ, SS, and the EP rupture section from the flexural test. It can be seen that IOT particles were irregularly shaped, with rounded edges (Figure 2a) and high fine content adhered to the large grains’ surfaces (Figure 2b). The large number of fine particles adhered to the large grains were clayey and increased the interstitial void volume and water absorption [45]. Differently, the QTZ presented more homogeneous particles: irregularly shaped, with sharp edges, smooth surfaces (Figure 2c), and low contents of fine particles adhered on the quartz particles’ surfaces (Figure 2d). The fine particles, tabular shaped, displayed a friable material characteristic, and their small quantity reduced QTZ’s water absorption. The SS particles had a semi-round shape (Figure 2e) and presented fine particles on top of the larger grains (Figure 2f), increasing the SS’s water absorption similarly to the IOTs. In contrast, the EP exhibited a low void volume (Figure 2g) due to air imprisonment during the polymer cure. Figure 2h also shows high rugosity on the polymer’s surface, indicating plastic rupture. EP should exhibit brittle rupture as a thermoset polymer, typically resulting in a smooth fracture surface [46].

3.1.4. Materials’ Thermal Behavior

Finally, the materials’ thermal behavior was assessed through TGA and DTG, shown in Figure 3. It was observed that IOTs present only one thermic event starting at 250.2 °C with a mass loss of 5.2% due to the dihydroxylation of low crystallinity goethite and its transformation in hematite. The QTZ had the highest thermal stability once no thermal events were observed in the temperature range analyzed. SS presented a mass loss of 2.2% at 634.8 °C due to calcite (CaCO3) decomposition. The presence of hydroxyl groups in IOTs and carbonates in SS confirms that the materials were adequately stabilized, resulting in a loss of ignition due to dehydroxylation rather than the presence of organic matter. EP exhibited the lowest thermal stability, presenting two thermal events. The first represented a mass loss of 10.3% at 47.5 °C because of humidity removal while the 55.3% at 327.1 °C shows the EP decomposition. However, the first peak might have indicated a loss of H2O content, which could have diluted the monomers, resulting in lower crosslink density, bulk density, and mechanical strength.

3.2. Polymeric Composites’ Characterization

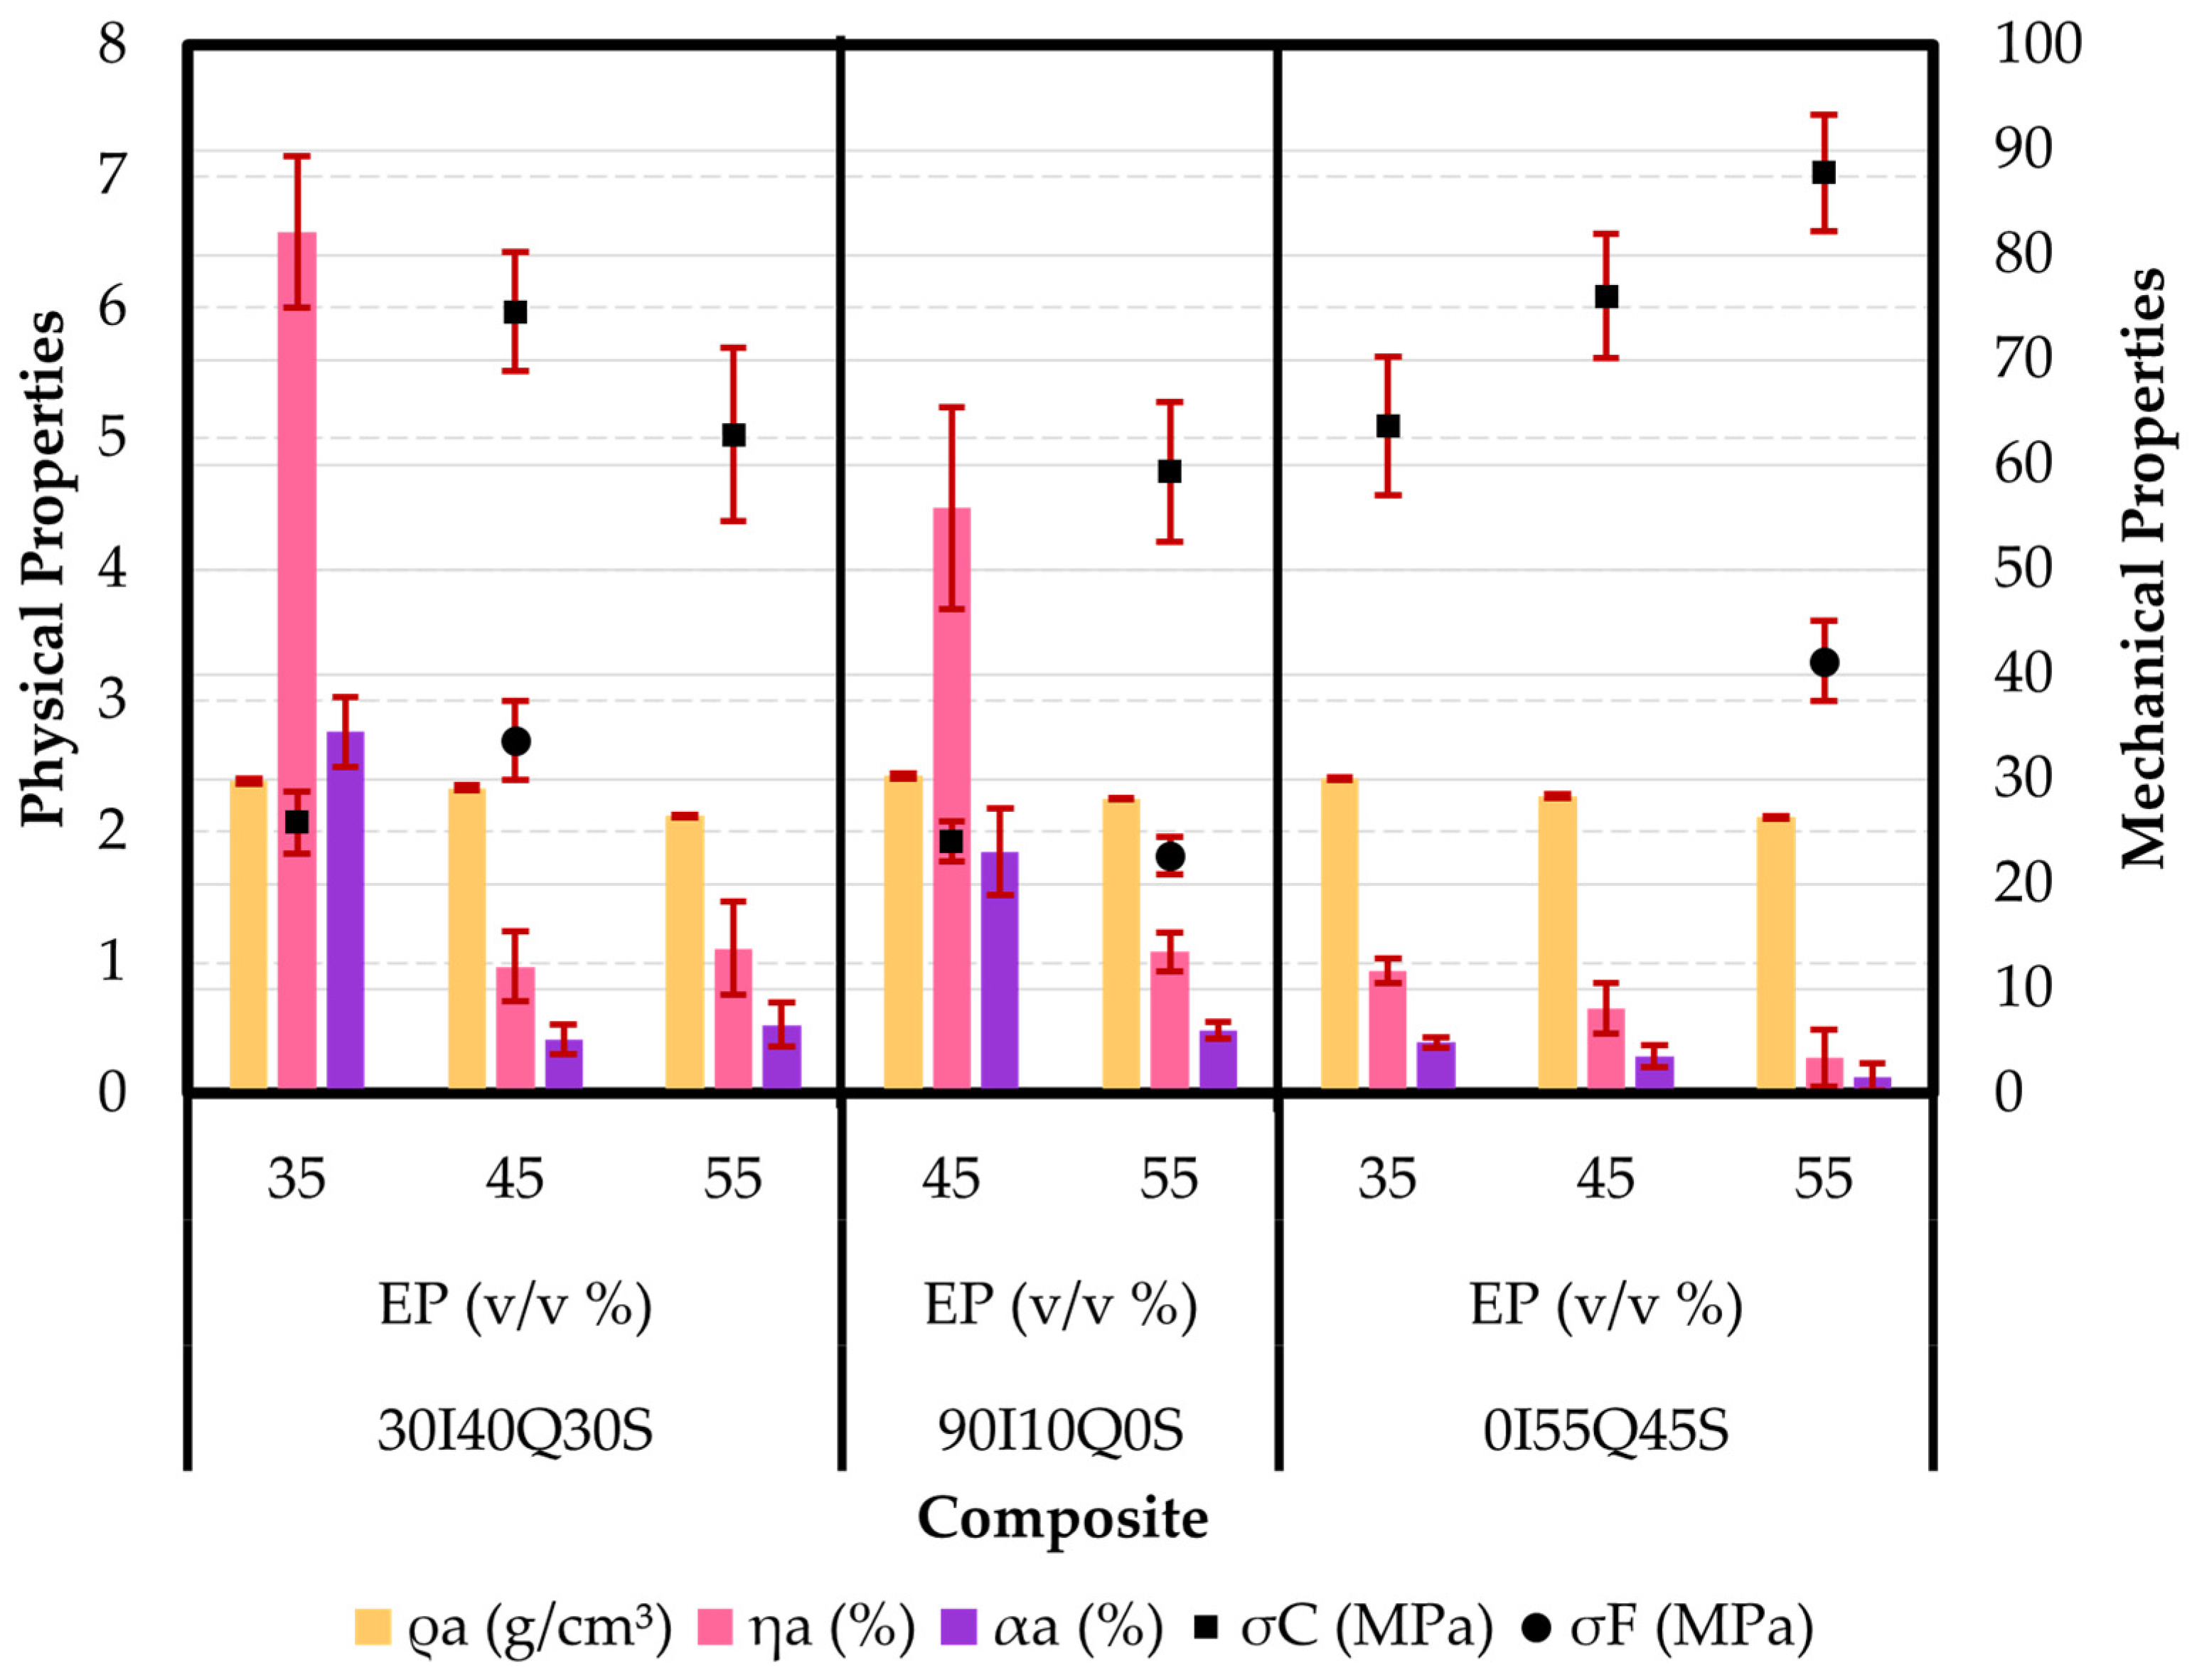
3.2.1. Composites’ Physical and Mechanical Properties

Figure 4 and Table 4 display the produced polymeric composites’ apparent density (ρa), apparent porosity (ηa), water absorption (αa), compressive and flexural strengths (σC and σF, respectively), and respective elastic moduli (EC and EF, respectively). It was observed that with an increase in the EP volume, there was a reduction in the physical properties and an increase in the mechanical properties. This trend indicates that the EP content efficiently filled the voids between the particles, reducing porosity and enhancing mechanical performance. Notably, the density reduction was expected due to the lower density of EP.
The 30I40Q30S composite with 55 v/v % EP exhibited increased apparent porosity and water absorption, indicating that its lower apparent density was due to a higher void content, resulting in lower compressive strength. Among the composites containing the same amount of EP, 90I10Q0S showed the poorest performance. This was attributed to the highest content of IOTs, which constituted the most hygroscopic material and contained a high amount of Fe2O3 (which has high density and lower hardness), leading to lower mechanical strength values and suggesting lower compatibility between IOTs and EP. Conversely, the 0I55Q45S composite demonstrated the lowest apparent porosity and water absorption, resulting in the highest mechanical strength. This was due to its high content of SiO2 (which has low water absorption and high hardness), the presence of SS (which has medium hardness), and the good compatibility between QTZ, SS, and EP.
Considering the lowest physical properties and highest compressive strengths, the optimal EP contents for each composite were 45 v/v % for 30I40Q30S and 55 v/v % for both 90I10Q0S and 0I55Q45S. Accordingly, only these composites had their flexural strength, SEM images, and thermal behavior assessed. Firstly, the flexural strength (Table 4) exhibited a similar trend to compressive strength, with 0I55Q45S 55 v/v % EP achieving the highest value, followed by 30I40Q30S 45 v/v % EP and 90I10Q0S 55 v/v % EP. These results reinforced the previous findings that the presence of QTZ and SS enhanced the composites’ apparent porosity, water absorption, and mechanical strength, in contrast to IOTs, which exhibited higher physical properties and lower mechanical performance.

3.2.2. Composites’ Morphology

Figure 5 shows the SEM images of the rupture surfaces of the 30I40Q30S 45 v/v % EP, 90I10Q0S 55 v/v % EP, and 0I55Q45S 55 v/v % EP composites obtained from the flexural strength test samples. The 30I40Q30S 45 v/v % EP composite (Figure 5a) contained many small, irregular, and round-shaped voids, indicating the removal of industrial waste particles. Similarly, the 90I10Q0S 55 v/v % EP composite presented many irregular and round-shaped voids (Figure 5c) but with larger dimensions. Figure 5c also shows that the 90I10Q0S 55 v/v % EP composite contained a high volume of likely interconnected micropores, resulting in this composite’s high porosity, water absorption, and low mechanical strength. In contrast, the 0I55Q45S 55 v/v % EP composite exhibited a low quantity of small, irregular, and round-shaped voids (Figure 5e,f), explaining its low porosity, low water absorption, and high mechanical strength. Moreover, Figure 5b,c,e suggest that the composites’ rupture occurred with the rupture of quartz particles, as indicated by the smooth ruptured surfaces of the particles. This fact highlights a strong interface between the matrix and QTZ, mainly due to quartz’s high hardness. Other components may have lower compatibility with the matrix, as demonstrated by the voids from particle removal. Overall, the SEM images show a good dispersion of the materials as the EP could not be observed in separate phases, and there were no particle agglomerations.

3.2.3. Composites’ Thermal Behavior

The thermal behavior of the composites was subsequently assessed through TGA and DTG (Figure 6). The first thermal event observed for all composites was the degradation of EP, occurring at 353.4 °C for 30I40Q30S 45 v/v % EP, 340.0 °C for 90I10Q0S 55 v/v % EP, and 348.9 °C for 0I55Q45S 55 v/v % EP. Additionally, 30I40Q30S 45 v/v % EP exhibited the decomposition of CaCO3 from SS at 502.6 °C while 90I10Q0S 55 v/v % EP showed the dihydroxylation of kaolinite from IOTs at 462.0 °C. Since EP decomposition was the first thermal event that might have compromised the composites’ performance, their thermal stability could be evaluated based on this parameter. Therefore, this suggested that 30I40Q30S 45 v/v % EP had higher thermal stability, attributed to the high content of QTZ and SS and the lower content of EP.
In contrast, the 90I10Q0S 55 v/v % EP composite demonstrated the lowest thermal stability due to its high contents of EP and IOTs, the industrial waste with lower thermal stability. This finding was reinforced by the 0I55Q45S 55 v/v % EP composite, which only showed EP degradation and exhibited intermediate thermal stability. This intermediate stability could be explained by the increased thermal stability due to the absence of IOTs, counterbalanced by the decreased stability from the higher content of EP.
The EP contributed to the thermal stability of the composites by acting as a key factor in determining the onset of thermal degradation. In the composites, the first thermal event observed was the degradation of the EP, which occurred at different temperatures depending on the composite’s composition. A lower content of EP in the composite, as seen in the 30I40Q30S 45 v/v % EP sample, was associated with higher thermal stability, likely because the higher content of other materials like QTZ and SS enhanced the overall thermal resistance. Conversely, a higher EP content, particularly when combined with other less thermally stable materials like IOTs, as seen in the 90I10Q0S 55 v/v % EP sample, resulted in lower thermal stability. Therefore, while EP is essential for the composite’s structure, its thermal stability is compromised at higher concentrations, especially when paired with other materials with lower thermal stability.
The homogeneous appearance and well-distributed particles observed in the composites through SEM images (Figure 5), along with the thermal events identified from the material combinations (Figure 6), indicate the good compatibility of the materials. The enhanced mechanical performance compared to pure EP further supports this. These findings confirm that the production method employed—using hand mixing, transfer molding, and no heat curing—can yield viable products. While more costly and specialized methods, such as vacuum vibrocompression, may improve the composite properties and reduce the polymer content required, they are not essential for producing AOS suitable for construction and decoration purposes, making AOS production more feasible.

3.3. Applicability of the Polymeric Composites as AOS and Competitiveness

The 30I40Q30S 45 v/v % EP, 90I10Q0S 55 v/v % EP, and 0I55Q45S 55 v/v% EP composites were classified according to the “Application Guide for Ornamental Stones” by the Brazilian Association of Ornamental Stones Industry [47] to demonstrate that the produced polymeric composites can be used as AOS in civil construction. The classification (Table 5), based on water absorption and three-point flexural strength, showed that all three composites (Figure 7) can be used as AOS, even 90I10Q0S 55 v/v % EP, which presented inferior physical and mechanical properties.
Both 30I40Q30S 45 v/v % EP and 0I55Q45S 55 v/v % EP are suitable for wall cladding without restrictions as their water absorption levels are sufficient to withstand weathering on external walls and exposure to moisture in internal areas such as bathrooms and kitchens. Their flexural strength is also adequate for use as countertops or surfaces that may occasionally be wet. However, due to its higher absorption, 90I10Q0S 55 v/v % EP requires a sealant for water resistance applications. Consequently, its use in countertops should be limited to areas with minimal water exposure.
Considering recent studies that developed AOS using EP composed of DGEBA and TETA, the 30I40Q30S 45 v/v % EP, 90I10Q0S 55 v/v % EP, and 0I55Q45S 55 v/v % EP composites demonstrated competitive values (Table 6). It is worth noting that most of the displayed studies used vacuum, vibration, and compression for production, which tended to enhance the composites’ properties and allow the use of low EP contents. This also presented higher energy costs and required specific high-cost equipment.

4. Conclusions

This research developed polymeric composites for application as Artificial Ornamental Stone (AOS) through a simple and more sustainable route, using iron ore tailings (IOTs), quartzite waste (QTZ), steel slag (SS) from basic oxygen furnaces, and epoxy (EP) composed of Diglycidyl Ether of Bisphenol A (DGEBA) prepolymer and Triethylenetetramine (TETA) hardener. The main challenge encountered was in mixing and demolding due to the high adherence and density of the composite before curing. These properties would make it difficult to achieve a uniform mixture using mechanical equipment. The demolding process was also problematic, requiring molds with disassembling parts or flexible materials to facilitate removal. The following conclusions can be drawn:
  • IOTs are rich in Fe2O3, contributing to their high density and reddish color, while QTZ, mainly composed of SiO2, reduces density and enhances mechanical performance due to quartz’s hardness. SS has high CaO and Fe2O3 content, which leads to its high density. The high fine contents in IOTs and SS increase their water absorption.
  • The 90I10Q0S composites showed the poorest performance, with high density, water absorption, and porosity and low mechanical strength and thermal stability, largely due to the high fine content of IOTs. In contrast, 0I55Q45S composites demonstrated the best performance, attributed to QTZ and SS’s favorable chemical compositions and low fine contents and a good interface with the EP matrix. The 30I40Q30S composites exhibited intermediate performance due to a balanced composition of all industrial wastes.
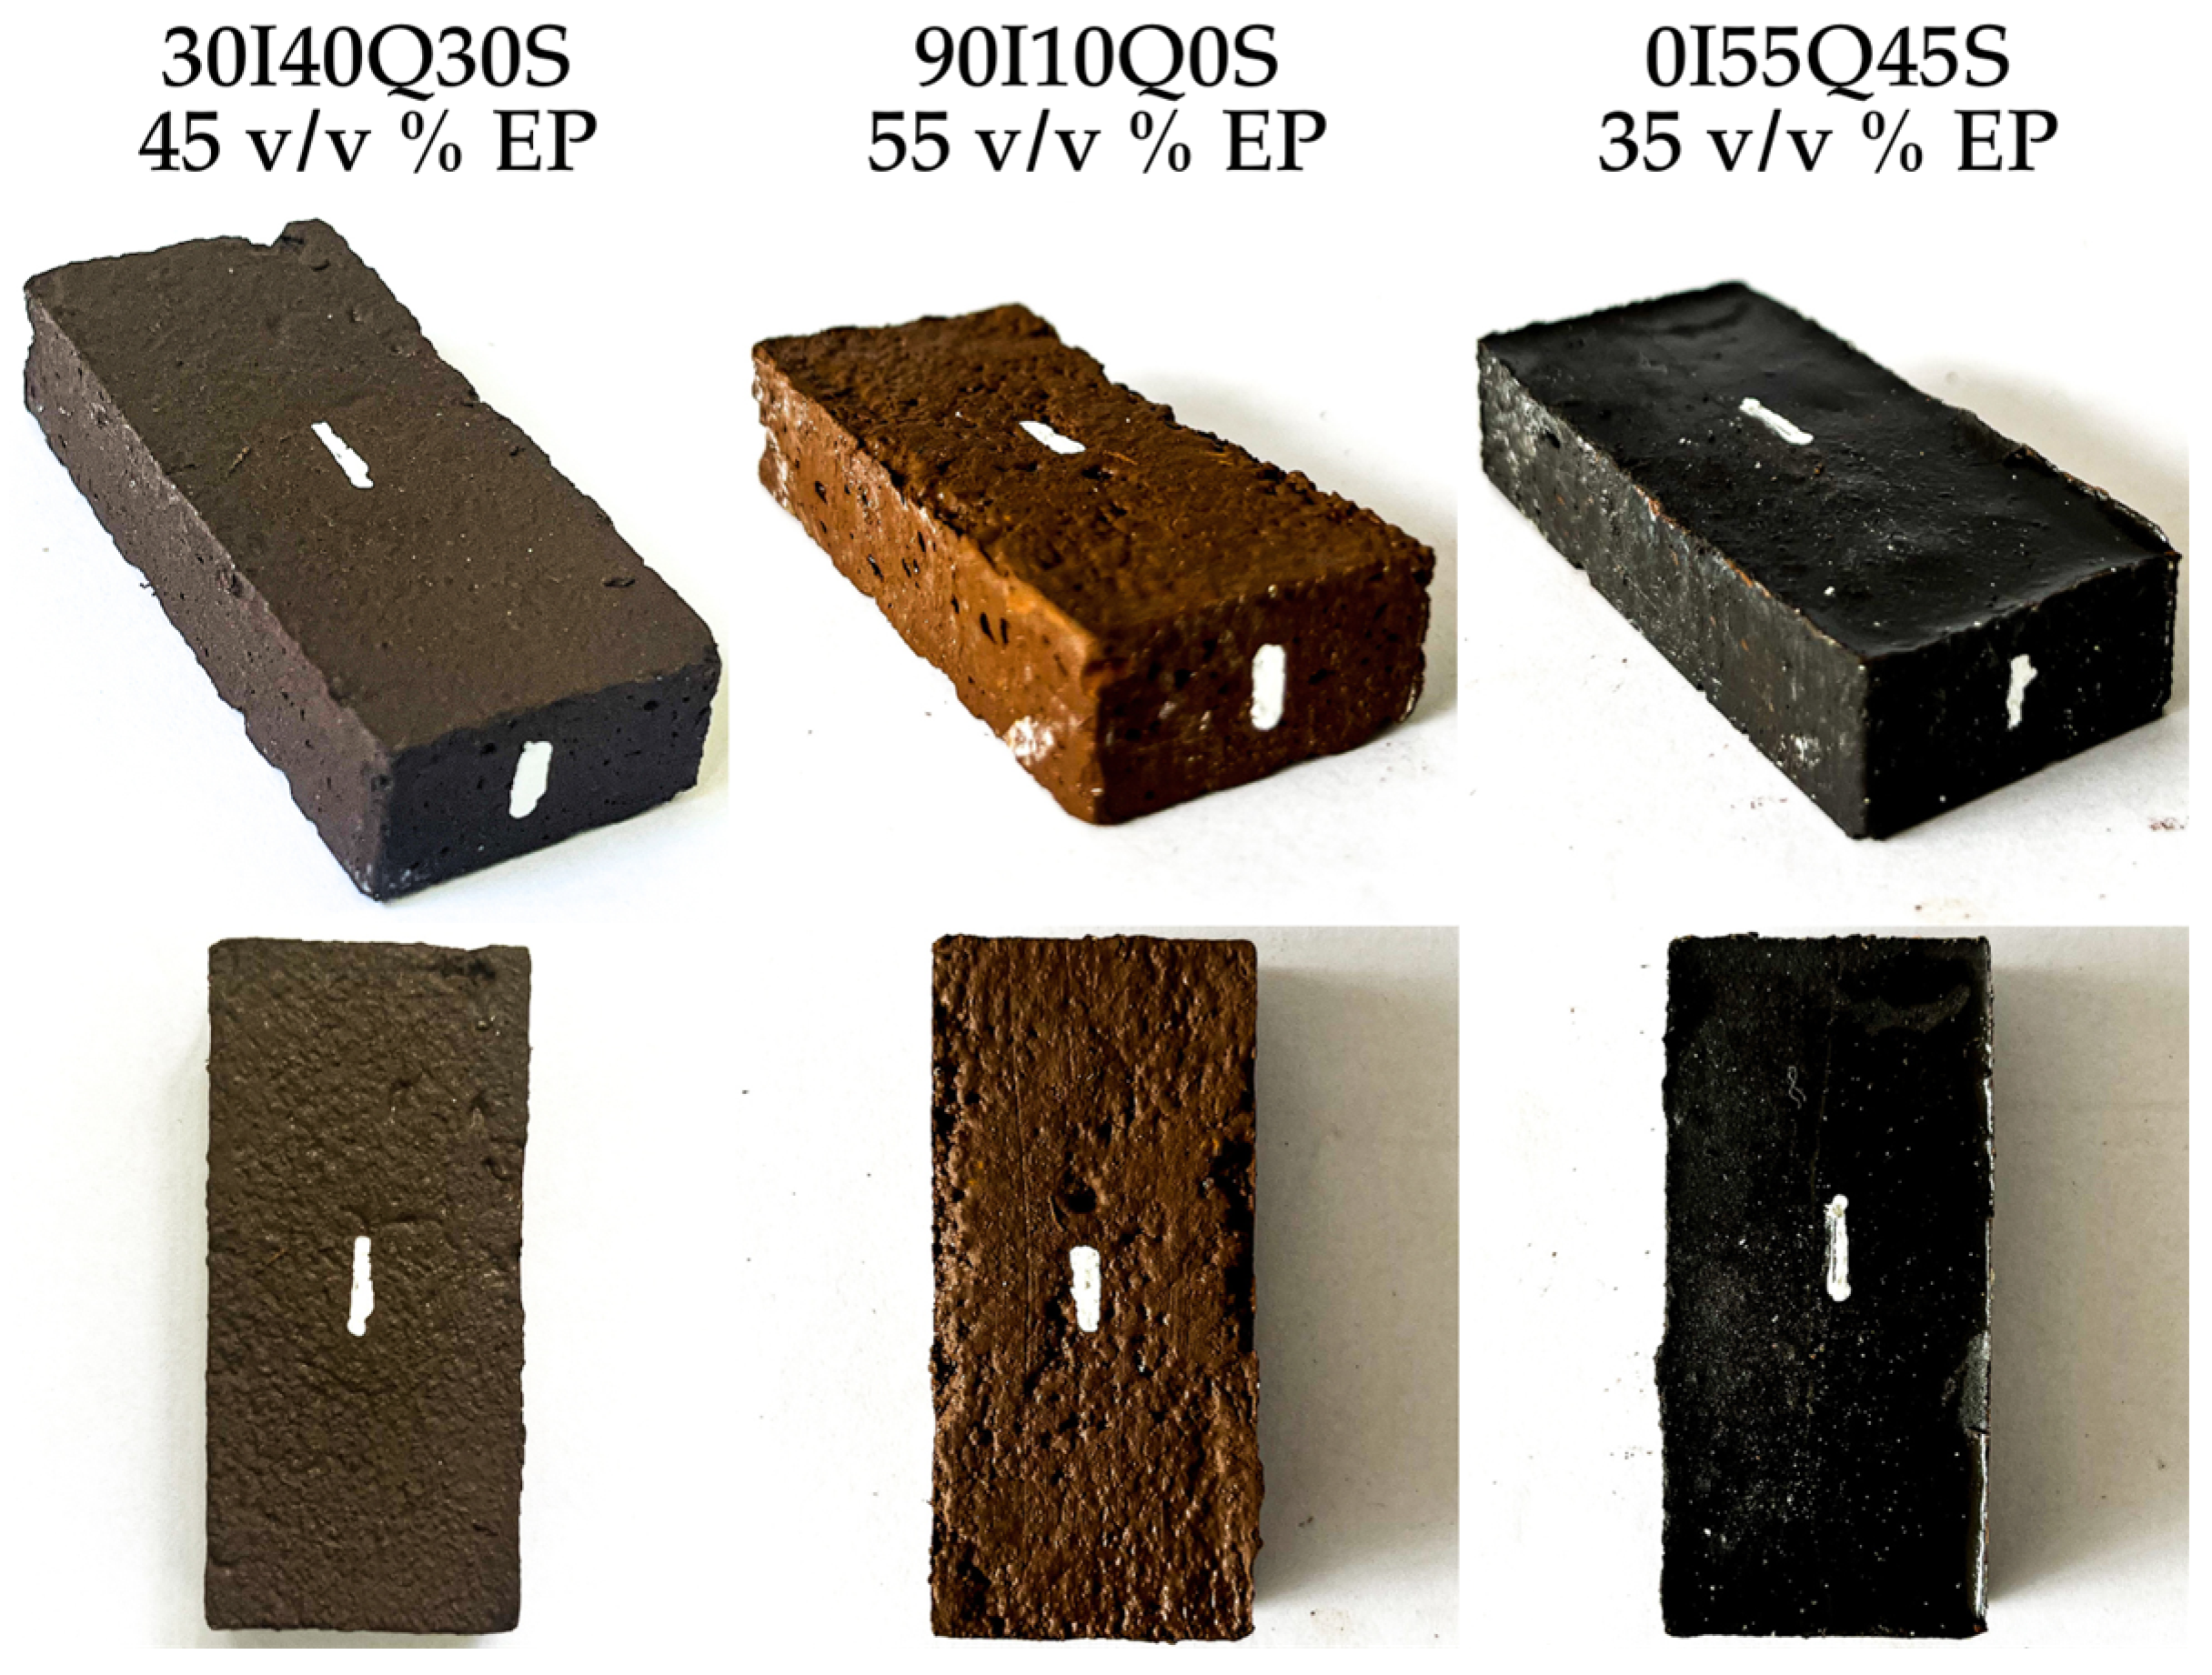
  • The polymeric composites 30I40Q30S 45 v/v % EP, 90I10Q0S 55 v/v % EP, and 0I55Q45S 55 v/v % EP exhibited strong performance, with 0I55Q45S 55 v/v % EP showing the best overall properties: an apparent density of 2.1 g/cm3, porosity of 0.3%, water absorption of 0.1%, and flexural strength of 41.25 MPa. The 30I40Q30S 45 v/v % EP composite also performed well, with a density of 2.3 g/cm3, porosity of 1.0%, water absorption of 0.4%, and flexural strength of 33.67 MPa. While the 90I10Q0S 55 v/v % EP composite had slightly lower metrics, it still demonstrated competitive properties. All three composites are suitable for use as AOS, with 30I40Q30S 45 v/v % EP and 0I55Q45S 55 v/v % EP applicable without restrictions for internal and external wall cladding. However, the 90I10Q0S 55 v/v % EP composite requires a sealant for wet areas and is limited to areas with occasional water exposure when used in tops or countertops.
Incorporating industrial wastes (45–65 v/v %) into the EP matrix creates AOS materials suitable for construction and decoration, offering both technical and sustainable benefits. This approach enhances mechanical strength, durability, and aesthetic value by producing unique colors not found in natural stones. The production method is practical and cost-effective, not requiring expensive, specialized equipment. Although it does not improve the materials’ properties as much as other methods, it still produces viable materials. From a sustainability perspective, this process supports long-term waste management, reduces the need for natural resource extraction, and addresses several Sustainable Development Goals (SDGs 11, 12, 14, and 15).
For future research, evaluating the use of different industrial wastes, production methods, and polymers would be valuable. Varying the matrix could impart various properties to the composite, such as by lowering its glass transition temperature and enabling processes like extrusion and injection. Further assessing the chemical interactions and the influence of factors like temperature, loading, time, and water presence would provide deeper insights into the materials’ behavior.

Author Contributions

Conceptualization, R.N.S., P.S.d.O.P. and W.C.F.; methodology, R.N.S., P.S.d.O.P. and W.C.F.; software, R.N.S.; validation, R.N.S., A.R.d.S., P.S.d.O.P. and W.C.F.; formal analysis, R.N.S., A.R.d.S., P.S.d.O.P. and W.C.F.; investigation, R.N.S.; resources, R.N.S., P.S.d.O.P. and W.C.F.; data curation, R.N.S., A.R.d.S., P.S.d.O.P. and W.C.F.; writing—original draft preparation, R.N.S. and W.C.F.; writing—review and editing, R.N.S., A.R.d.S., P.S.d.O.P. and W.C.F.; visualization, R.N.S., A.R.d.S., P.S.d.O.P. and W.C.F.; supervision, P.S.d.O.P. and W.C.F.; project administration, P.S.d.O.P. and W.C.F.; funding acquisition, P.S.d.O.P. and W.C.F. All authors have read and agreed to the published version of the manuscript.

Funding

This research was funded by Coordenação de Aperfeiçoamento de Pessoal de Nível Superior (CAPES), grant number 88887.714202/2022-00—Rivelino Neri Silva’s master’s scholarship. Financial support (25/2022) was also promoted by PROPPI/UFOP (Pró-Reitoria de Pesquisa e Inovação of the Federal University of Ouro Preto, UFOP) granted to Wanna Fontes.

Institutional Review Board Statement

Not applicable.

Informed Consent Statement

Not applicable.

Data Availability Statement

The original contributions presented in the study have been included in the article; further inquiries can be directed to the corresponding author/s.

Acknowledgments

The authors acknowledge PROPPI/UFOP, PROPEC (Civil Engineering Post-Graduation Program) and the laboratories from UFOP (Nanolab, LMC2 and Soils Characterization), the Federal University of Itajubá (UNIFEI, Labtermo), and the Federal Center for Technological Education (CEFET/MG, Intechlab) for the test support. The authors are also grateful for the collaboration of EcoUrb Research and Extension Group—CNPq.

Conflicts of Interest

The authors declare no conflict of interest.

References

  1. U.S. Geological Survey. Mineral Commodity Summaries. Available online: https://pubs.usgs.gov/periodicals/mcs2024/mcs2024-iron-ore.pdf (accessed on 10 July 2024).
  2. National Mining Agency—ANM. Brazilian Mineral Yearbook. Available online: https://app.powerbi.com/view?r=eyJrIjoiODIyOWJlMTgtZTBlNi00ODFhLWJiOGEtYzlmOWM3MjhmMWQ4IiwidCI6ImEzMDgzZTIxLTc0OWItNDUzNC05YWZhLTU0Y2MzMTg4OTdiOCJ9 (accessed on 10 July 2024). (In Portuguese)
  3. Worldsteel Association. 2024 World Steel in Figures. Available online: https://worldsteel.org/wp-content/uploads/World-Steel-in-Figures-2024.pdf (accessed on 10 July 2024).
  4. Mineral Technology Center—CETEM. Environmental Aspects of the Mining and Steelmaking Industries. Available online: http://mineralis.cetem.gov.br/bitstream/cetem/765/1/CCL00390010.pdf (accessed on 10 June 2023). (In Portuguese)
  5. Collares, E.G.; Francklin, I.; Motta, L.A.D.C. Evaluation of the aggregate produced from wastes of quartzite mining sites to use in concrete. Soils Rocks 2012, 35, 251–266. [Google Scholar] [CrossRef]
  6. Brazil Steel Institute. Sustainability Indicators: Environmental Data. Available online: https://acobrasil.org.br/site/indicadores-de-sustentabilidade/ (accessed on 25 March 2023). (In Portuguese).
  7. Matiolo, E.; Couto, H.J.B.; Lima, N.; Silva, K.; de Freitas, A.S. Improving recovery of iron using column flotation of iron ore slimes. Min. Eng. 2020, 158, 106608. [Google Scholar] [CrossRef]
  8. El Machi, A.; El Berdai, Y.; Mabroum, S.; Safhi, A.e.M.; Taha, Y.; Benzaazoua, M.; Hakkou, R. Recycling of Mine Wastes in the Concrete Industry: A Review. Buildings 2024, 14, 1508. [Google Scholar] [CrossRef]
  9. Martins, L.M.; Peixoto, R.A.F.; Mendes, J.C. Quartzite tailings in civil construction materials: A systematic review. Clean Technol. Environ. Policy 2023, 25, 1807–1824. [Google Scholar] [CrossRef]
  10. Colla, V.; Branca, T.A.; Pietruck, R.; Wölfelschneider, S.; Morillon, A.; Algermissen, D.; Rosendahl, S.; Granbom, H.; Martini, U.; Snaet, D. Future Research and Developments on Reuse and Recycling of Steelmaking By-Products. Metals 2023, 13, 676. [Google Scholar] [CrossRef]
  11. United Nations—UN. Transforming Our World: The 2030 Agenda for Sustainable Development. Available online: https://sdgs.un.org/2030agenda (accessed on 8 July 2024).
  12. Sá, T.S.W.; Oda, S.; Balthar, V.K.C.B.L.M.; Toledo Filho, R.D. Use of iron ore tailings and sediments on pavement structure. Constr. Build. Mater. 2022, 342, 128072. [Google Scholar] [CrossRef]
  13. Liu, K.; Wang, S.; Quan, X.; Jing, W.; Xu, J.; Zhao, N.; Liu, B.; Ying, H. Industrial byproduct Iron ore tailings as ecofriendly materials in the utilization of cementitious composites. Constr. Build. Mater. 2023, 372, 130813. [Google Scholar] [CrossRef]
  14. Gong, L.; Hua, X.; Yao, B.; Liang, J.; Tian, G. Novel red composite pigment with high thermostability from iron ore tailings: Synthesis and coloring mechanism. Ceram. Int. 2022, 49, 5066–5076. [Google Scholar] [CrossRef]
  15. Silva, M.C.A.; Leão, V.A.; Reis, E.L. Incorporation of quartzite fines in the production of red ceramics. J. Clean. Prod. 2021, 288, 125098. [Google Scholar] [CrossRef]
  16. Barros, S.V.A.; Marciano, J.E.A.; Ferreira, H.C.; Menezes, R.R.; Neves, G.A. Addition of quartzite residues on mortars: Analysis of the alkali aggregate reaction and the mechanical behavior. Constr. Build. Mater. 2016, 118, 344–351. [Google Scholar] [CrossRef]
  17. Gehlot, T.; Sankhla, S.S.; Parihar, S. Compressive, flexural strength test and chloride ion permeability test of concrete incorporating quartzite rock dust. Mater. Today Proc. 2021, 45, 4724–4730. [Google Scholar] [CrossRef]
  18. Zhuang, S.; Wang, Q.; Luo, T. A quantitative method to assess and predict the exothermic behavior of steel slag blended cement. Cem. Concr. Res. 2024, 175, 107373. [Google Scholar] [CrossRef]
  19. Carvalho, V.R.; Costa, L.C.B.; Elói, F.P.F.; Bezerra, A.C.S.; Carvalho, J.M.F.; Peixoto, R.A.F. Performance of low-energy steel slag powders as supplementary cementitious materials. Constr. Build. Mater. 2023, 392, 131888. [Google Scholar] [CrossRef]
  20. Rana, A.; Singh, N. Microstructural characteristics of iron-steel slag concrete: A brief review. Mater. Today Proc. 2023, in press. [Google Scholar] [CrossRef]
  21. Fontes, W.C.; Mendes, J.C.; da Silva, S.N.; Peixoto, R.A.F. Mortars for laying and coating produced with iron ore tailings from tailing dams. Constr. Build. Mater. 2016, 112, 988–995. [Google Scholar] [CrossRef]
  22. de Carvalho, J.M.F.; Fontes, W.C.; de Azevedo, C.F.; Brigolini, G.J.; Schmidt, W.; Peixoto, R.A.F. Enhancing the eco-efficiency of concrete using engineered recycled mineral admixtures and recycled aggregates. J. Clean. Prod. 2020, 257, 120530. [Google Scholar] [CrossRef]
  23. Carrieri, M.; Guzzardo, C.; Farcas, D.; Cena, L.G. Characterization of Silica Exposure during Manufacturing of Artificial Stone Countertops. Int. J. Environ. Res. Public Health 2020, 17, 4489. [Google Scholar] [CrossRef] [PubMed]
  24. Gomes, M.L.P.M.; Carvalho, E.A.S.; Barreto, G.N.S.; Rodriguez, R.J.S.; Monteiro, S.N.; Vieira, C.M.F. Development of Sustainable Artificial Stone Using Granite Waste and Biodegradable Polyurethane from Castor Oil. Sustainability 2022, 14, 6380. [Google Scholar] [CrossRef]
  25. Ribeiro, C.E.G.; Rodriguez, R.J.S.; Vieira, C.M.F.; Carvalho, E.A.; Candido, V.S.; Monteiro, S.N. Fabrication of Artificial Stone from Marble Residue by Resin Transfer Molding. Mater. Sci. For. 2014, 775–776, 336–340. [Google Scholar] [CrossRef]
  26. Shelley, M.Y. Epoxy Resins. In Polymer Data Handbook, 1st ed.; Mark, J.E., Ed.; Oxford University Press: Cincinnati, OH, USA, 1998; pp. 90–96. ISBN 0195107896. [Google Scholar]
  27. Agrizzi, C.P.; Carvalho, E.A.S.; Borlini Gadioli, M.C.; Barreto, G.N.S.; de Azevedo, A.R.G.; Monteiro, S.N.; Vieira, C.M.F. Comparison between Synthetic and Biodegradable Polymer Matrices on the Development of Quartzite Waste-Based Artificial Stone. Sustainability 2022, 14, 6388. [Google Scholar] [CrossRef]
  28. Barreto, G.N.S.; Carvalho, E.A.S.; Souza, V.d.S.d.; Gomes, M.L.P.M.; de Azevedo, A.R.G.; Monteiro, S.N.; Vieira, C.M.F. Engineered Stone Produced with Glass Packaging Waste, Quartz Powder, and Epoxy Resin. Sustainability 2022, 14, 7227. [Google Scholar] [CrossRef]
  29. Mostovoi, A.S.; Kurbatova, E.A. Controlling the properties of epoxy composites filled with brick dust. Russ. J. Appl. Chem. 2017, 90, 267–276. [Google Scholar] [CrossRef]
  30. Upadhyay, P.; Rajput, V.; Rajput, P.S.; Mishra, V.; Khan, I.A.; Jha, A.; Agrawal, A. Physical, mechanical and sliding wear behaviour of epoxy composites filled with micro-sized marble dust composites. Mater. Today Proc. 2023; in press. [Google Scholar] [CrossRef]
  31. NBR NM 26; Aggregates–Sampling. Brazilian Association of Technical Norms–ABNT: Rio de Janeiro, Brazil, 2009. (In Portuguese)
  32. NBR 16916; Fine Aggregates—Determination of Bulk Density and Water Absorption. Brazilian Association of Technical Norms—ABNT: Rio de Janeiro, Brazil, 2021. (In Portuguese)
  33. NBR 17054; Aggregates—Determination of Particle-Size Distribution—Testing Methods. Brazilian Association of Technical Norms—ABNT: Rio de Janeiro, Brazil, 2022. (In Portuguese)
  34. D570; Standard Test Method for Water Absorption of Plastics. American Society for Testing and Materials—ASTM: West Conshohocken, PA, USA, 2022.
  35. D792; Standard Test Method for Density and Specific Gravity (Relative Density) of Plastics by Displacement. American Society for Testing and Materials—ASTM: West Conshohocken, PA, USA, 2020.
  36. D695; Standard Test Method for Compressive Properties of Rigid Plastics. American Society for Testing and Materials—ASTM: West Conshohocken, PA, USA, 2015.
  37. D790; Standard Test Method for Flexural Properties of Unreinforced and Reinforced Plastics and Electrical Insulating Materials. American Society for Testing and Materials—ASTM: West Conshohocken, PA, USA, 2017.
  38. NBR 15845-2; Rocks for Cladding. Part 2: Determination of Bulk Density, Apparent Porosity and Water Absorption. Brazilian Association of Technical Norms—ABNT: Rio de Janeiro, Brazil, 2015. (In Portuguese)
  39. NBR 15845-5; Rocks for Cladding. Part 5: Determination of Uniaxial Compressive Strength. Brazilian Association of Technical Norms—ABNT: Rio de Janeiro, Brazil, 2015. (In Portuguese)
  40. NBR 15845-6; Rocks for Cladding. Part 6: Determination of the Modulus of Rupture (Three-point Flexural Strength). Brazilian Association of Technical Norms—ABNT: Rio de Janeiro, Brazil, 2015. (In Portuguese)
  41. Jabbar, F.J. Study the Thermal Properties of Epoxy Resin Reinforced with Calcium Oxide Fibers. Smart Sci. 2021, 9, 61–69. [Google Scholar] [CrossRef]
  42. Pour, Z.; Ghaemy, M. Thermo-mechanical behaviors of epoxy resins reinforced with silane-epoxide functionalized α-Fe2O3 nanoparticles. Prog. Org. Coat. 2014, 77, 1316–1324. [Google Scholar] [CrossRef]
  43. Jin, F.; Park, S. Thermal properties of epoxy resin/filler hybrid composites. Polym. Degrad. Stab. 2012, 97, 2148–2153. [Google Scholar] [CrossRef]
  44. Xie, Q.; Fu, K.; Liang, S.; Liu, B.; Lu, L.; Yang, X.; Huang, Z.; Lü, F. Micro-Structure and Thermomechanical Properties of Crosslinked Epoxy Composite Modified by Nano-SiO2: A Molecular Dynamics Simulation. Polymers 2018, 10, 801. [Google Scholar] [CrossRef]
  45. Fontes, W.C.; de Carvalho, J.M.F.; Andrade, L.C.R.; Segadães, A.M.; Peixoto, R.A.F. Assessment of the use potential of iron ore tailings in the manufacture of ceramic tiles: From tailings-dams to “brown porcelain”. Constr. Build. Mater. 2019, 206, 111–121. [Google Scholar] [CrossRef]
  46. Pinto, D.; Bernardo, L.; Amaro, A.; Lopes, S. Mechanical properties of epoxy nanocomposites using titanium dioxide as reinforcement—A review. Constr. Build. Mater. 2015, 95, 506–524. [Google Scholar] [CrossRef]
  47. Brazilian Association of Ornamental Stones Industry–ABIROCHAS. Application Guide for Ornamental Stones; ABIROCHAS: Brasilia, Brazil, 2020. (In Portuguese) [Google Scholar]
  48. Carvalho, E.A.S.; Marques, V.R.; Rodrigues, R.J.S.; Ribeiro, C.E.G.; Monteiro, S.N.; Vieira, C.M.F. Development of Epoxy Matrix Artificial Stone Incorporated with Sintering Residue from Steelmaking Industry. Mater. Res. 2015, 18, 235–239. [Google Scholar] [CrossRef]
  49. Peixoto, J.; Carvalho, E.A.S.; Gomes, M.L.P.M.; Guimarães, R.d.S.; Monteiro, S.N.; de Azevedo, A.R.G.; Vieira, C.M.F. Incorporation of Industrial Glass Waste into Polymeric Resin to Develop Artificial Stones for Civil Construction. Arab. J. Sci. Eng. 2021, 47, 4313–4322. [Google Scholar] [CrossRef]
  50. Gomes, M.L.P.M.; Carvalho, E.A.S.; Demartini, T.J.C.; de Carvalho, E.A.; Colorado, H.A.; Vieira, C.M.F. Mechanical and physical investigation of an artificial stone produced with granite residue and epoxy resin. J. Compos. Mater. 2020, 55, 1247–1254. [Google Scholar] [CrossRef]
  51. Carvalho, E.A.S.; Vilela, N.d.F.; Monteiro, S.N.; Vieira, C.M.F.; da Silva, L.C. Novel Artificial Ornamental Stone Developed with Quarry Waste in Epoxy Composite. Mater. Res. 2018, 21, e20171104. [Google Scholar] [CrossRef]
  52. Gomes, M.L.P.M.; Carvalho, E.A.S.; Sobrinho, L.N.; Monteiro, S.N.; Rodriguez, R.J.S.; Vieira, C.M.F. Production and characterization of a novel artificial stone using brick residue and quarry dust in epoxy matrix. J. Mater. Res. Technol. 2018, 7, 492–498. [Google Scholar] [CrossRef]
  53. Carvalho, E.A.S.; Magalhães, J.P.B.; Rodriguez, R.J.S.; Carvalho, E.A.; Monteiro, S.N.; Vieira, C.M.F. Reuse of Quarry Waste in Artificial Stone Production with Using Vacuum, Compression, and Vibration. In Green Materials Engineering: An EPD Symposium in Honor of Sergio Monteiro; Springer International Publishing: New York, NY, USA, 2019; pp. 241–247. [Google Scholar] [CrossRef]
Figure 1. Particle size distribution of the industrial wastes: iron ore tailings (IOTs); quartzite waste (QTZ); steel slag (SS).
Sustainability 16 07715 g001
Figure 2. SEM images of the materials: (a,b) iron ore tailings, IOTs; (c,d) quartzite waste, QTZ; (e,f) steel slag, SS; (g,h) epoxy, EP.
Sustainability 16 07715 g002
Figure 3. Thermogravimetric analysis (TGA) curves of the materials and their derivative (DTG).
Sustainability 16 07715 g003
Figure 4. Polymeric composites’ physical and mechanical properties.
Sustainability 16 07715 g004
Figure 5. SEM images of the polymer composites: (a,b) 30I40Q30S 45 v/v % EP; (c,d) 90I10Q0S 55 v/v % EP; (e,f) 0I55Q45S 55 v/v % EP.
Sustainability 16 07715 g005
Figure 6. Thermogravimetric analysis (TGA) curves of the polymeric composites and their derivative (DTG).
Sustainability 16 07715 g006
Figure 7. Pictures of the AOS samples used in the flexural strength test.
Sustainability 16 07715 g007
Table 1. Composites’ mix proportions.
CompositeEP 2 Content (v/v %)IOTs 2 (v/v %)QTZ 2 (v/v %)SS 2 (v/v %)
30I40Q30S (7.68) 13519.5026.0019.50
4516.5022.0016.50
5513.5018.0013.50
90I10Q0S (9.33) 14549.505.50-
5540.504.50-
0I55Q45S (9.47) 135-35.7529.25
45-30.2524.75
55-24.7520.25
1 Deviation from the Modified Andreassen Curve. 2 EP: epoxy; IOTs: iron ore tailings; QTZ: quartzite waste; SS: steel slag.
Table 2. Industrial wastes’ chemical and mineral components.
Industrial Waste *Oxides (Content, %)Mineral Structures
IOTsFe2O3 (71.4)Goethite
Al2O3 (8.7)Hematite
SiO2 (8.4)Kaolinite
Other oxides (1.5)Gibbsite
LOI (10.0)Quartz
QTZSiO2 (93.6)Quartz
Al2O3 (4.6)
Other oxides (1.0)
LOI (0.8)
SSCaO (33.8)Brownmillerite
Calcite
Larnite
Wüstite
Fe2O3 (31.1)
SiO2 (16.1)
MgO (6.4)
Al2O3 (4.4)
Other oxides (6.4)
LOI (1.8)
* IOTs: iron ore tailings; QTZ: quartzite waste; SS: steel slag.
Table 3. Materials’ bulk density and water absorption.
Material *Bulk Density (g/cm3)Water Absorption (%)
IOTs3.6817.44
QTZ2.530.42
SS3.7115.16
EP1.140.07
* IOTs: iron ore tailings; QTZ: quartzite waste; SS: steel slag; EP: epoxy.
Table 4. Polymeric composites’ values of physical and mechanical properties.
Compositeρa (g/cm3)ηa (%)αa (%)σC (MPa)EC (GPa)σF (MPa)EF (GPa)
30I40Q30S35 v/v % EP2.4 ± 0.06.6 ± 0.62.8 ± 0.326 ± 30.65 ± 0.05NTNT
45 v/v % EP2.3 ± 0.01.0 ± 0.30.4 ± 0.175 ± 61.30 ± 0.0434 ± 41.51 ± 0.32
55 v/v % EP2.1 ± 0.01.1 ± 0.40.5 ± 0.263 ± 81.14 ± 0.09NTNT
90I10Q0S45 v/v % EP2.4 ± 0.04.5 ± 0.81.8 ± 0.324 ± 20.31 ± 0.04NTNT
55 v/v % EP2.3 ± 0.01.1 ± 0.10.5 ± 0.159 ± 70.97 ± 0.1123 ± 21.12 ± 0.15
0I55Q45S35 v/v % EP2.4 ± 0.00.9 ± 0.10.4 ± 0.064 ± 71.24 ± 0.08NTNT
45 v/v % EP2.3 ± 0.00.6 ± 0.20.3 ± 0.176 ± 61.27 ± 0.08NTNT
55 v/v % EP2.1 ± 0.00.3 ± 0.20.1 ± 0.188 ± 61.26 ± 0.0541 ± 41.72 ± 0.3
ρa: apparent density; ηa: apparent porosity; αa: water absorption; σC: uniaxial compressive strength; EC: compressive modulus of elasticity; σF: three-point flexural strength; EF: flexural modulus of elasticity; NT: not tested.
Table 5. Applicability of the polymeric composites as Artificial Ornamental Stones (AOSs).
Application Guide for Ornamental Stones—Requirements
PropertyClassParameter
Water absorption (%)A1≤0.4%
A2>0.4%
Three-point flexural strength (MPa)C1≥8.0
C2<8.0
Produced Polymeric Composites’ Classification
CompositeClassApplicability 1
30I40Q30S 45 v/v % EPA1C1
  • Internal and external wall cladding; no restrictions;
  • Tops/countertops; no restrictions.
90I10Q0S 55 v/v % EPA2C1
  • Internal wall cladding, with sealant in wet areas;
  • External wall cladding, with sealant;
  • Tops/countertops; eventual wetting.
0I55Q45S 55 v/v % EPA1C1
  • Internal and external wall cladding; no restrictions;
  • Tops/countertops, no restrictions.
1 Minimum thicknesses of the plates: 1 mm (wall cladding) and 2 mm (tops/countertops).
Table 6. Comparison of Artificial Ornamental Stones (AOSs) from the literature.
AuthorρA (g/cm3) 2ηA (%) 2αA (%) 2σF (Mpa) 2
Agrizzi et al. [27]2.4 ± 0.00.4 ± 0.20.2 ± 0.127.96 ± 1.86
Carvalho et al. [48]2.7 ± 0.00.5 ± 0.10.2 ± 0.057.57 ± 3.21
2.7 ± 0.00.6 ± 0.20.2 ± 0.141.70 ± 4.08
Barreto et al. [28]2.3 ± 0.00.2 ± 0.00.1 ± 0.033.54 ± 4.05
Peixoto et al. [49]1.8 ± 0.00.8 ± 0.00.4 ± 0.125.40 ± 0.90
Gomes et al. [50]2.3 ± 0.00.2 ± 0.00.1 ± 0.132.92 ± 2.92
Carvalho et al. [51]2.4 ± 0.10.8 ± 0.20.4 ± 0.130.00 ± 1.00
2.3 ± 0.00.6 ± 0.00.3 ± 0.032.00 ± 3.00
Gomes et al. [52]2.1 ± 0.00.2 ± 0.00.4 ± 0.130.00 ± 3.00
Carvalho et al. [53]2.3 ± 0.00.3 ± 0.00.1 ± 0.032.00 ± 1.98
Silva et al.
(This study)
30I40Q30S 45 v/v % EP 12.3 ± 0.01.0 ± 0.30.4 ± 0.133.67 ± 3.72
90I10Q0S 55 v/v % EP2.3 ± 0.01.1 ± 0.10.5 ± 0.122.64 ± 1.78
0I55Q45S 55 v/v % EP2.1 ± 0.00.3 ± 0.20.1 ± 0.141.25 ± 3.87
1 EP: epoxy. 2 ρA: apparent density; ηA: apparent porosity; αA: water absorption; σF: three-point flexural strength.
Disclaimer/Publisher’s Note: The statements, opinions and data contained in all publications are solely those of the individual author(s) and contributor(s) and not of MDPI and/or the editor(s). MDPI and/or the editor(s) disclaim responsibility for any injury to people or property resulting from any ideas, methods, instructions or products referred to in the content.

