
Single-Person Households among the Socially Vulnerable Elderly Population: A Comparative Study of Housing, Living Habits, and Social Environments in Selected Neighborhoods of Seoul for the Prevention of Solitary Deaths

Abstract
1. Introduction
1.1. Background and Purpose
1.2. Scope and Method
2. Previous Literature Review and Conducting a Research
2.1. Literature Review
2.2. Conducting a Survey Questionnaire
3. Analysis of Basic Survey Area Characteristics
3.1. Regional Characteristics
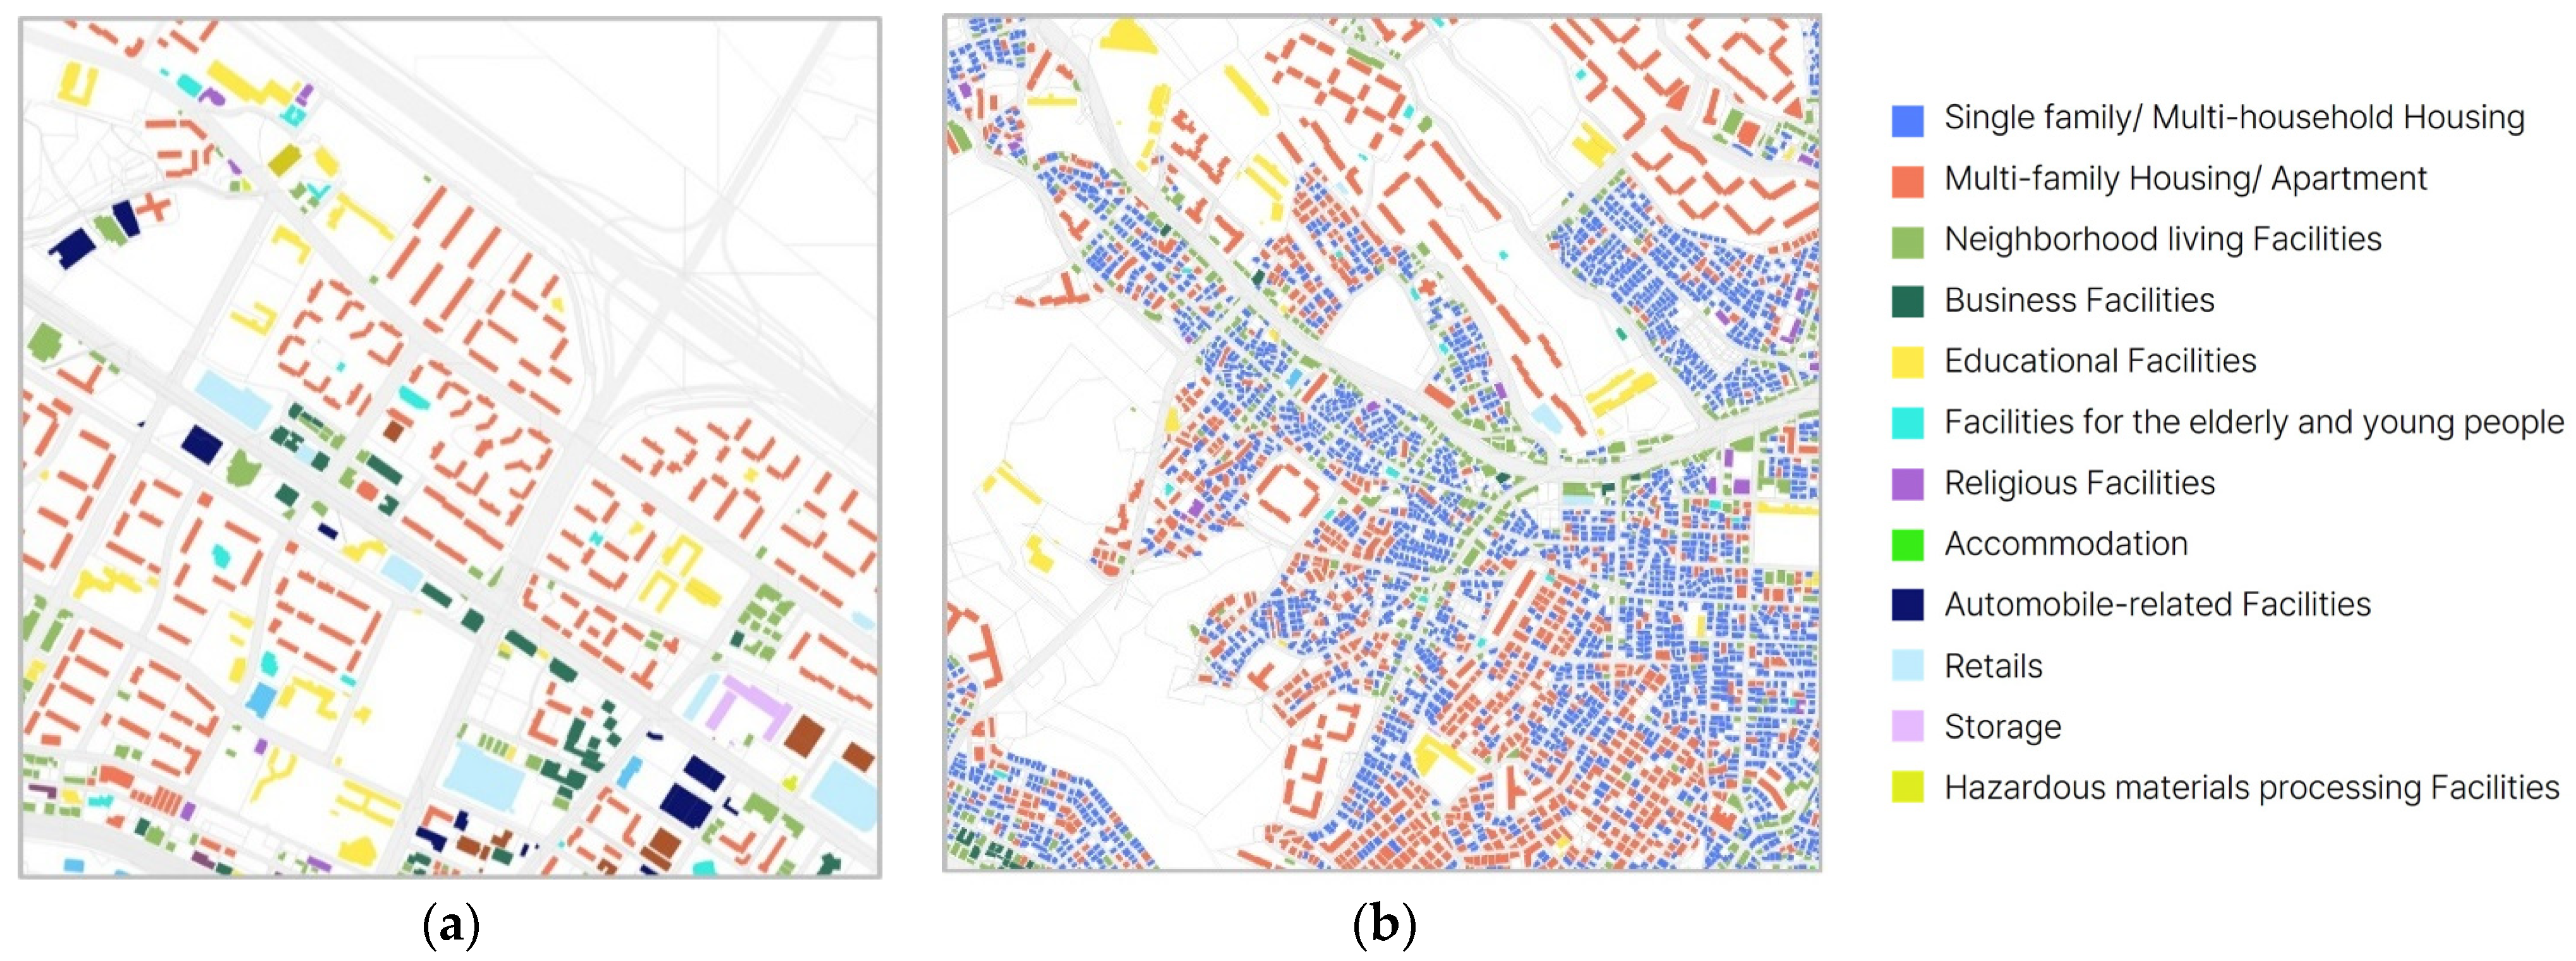
3.1.1. Building Usage
3.1.2. Building Aging and Condition
3.1.3. Building Height and Number of Floors
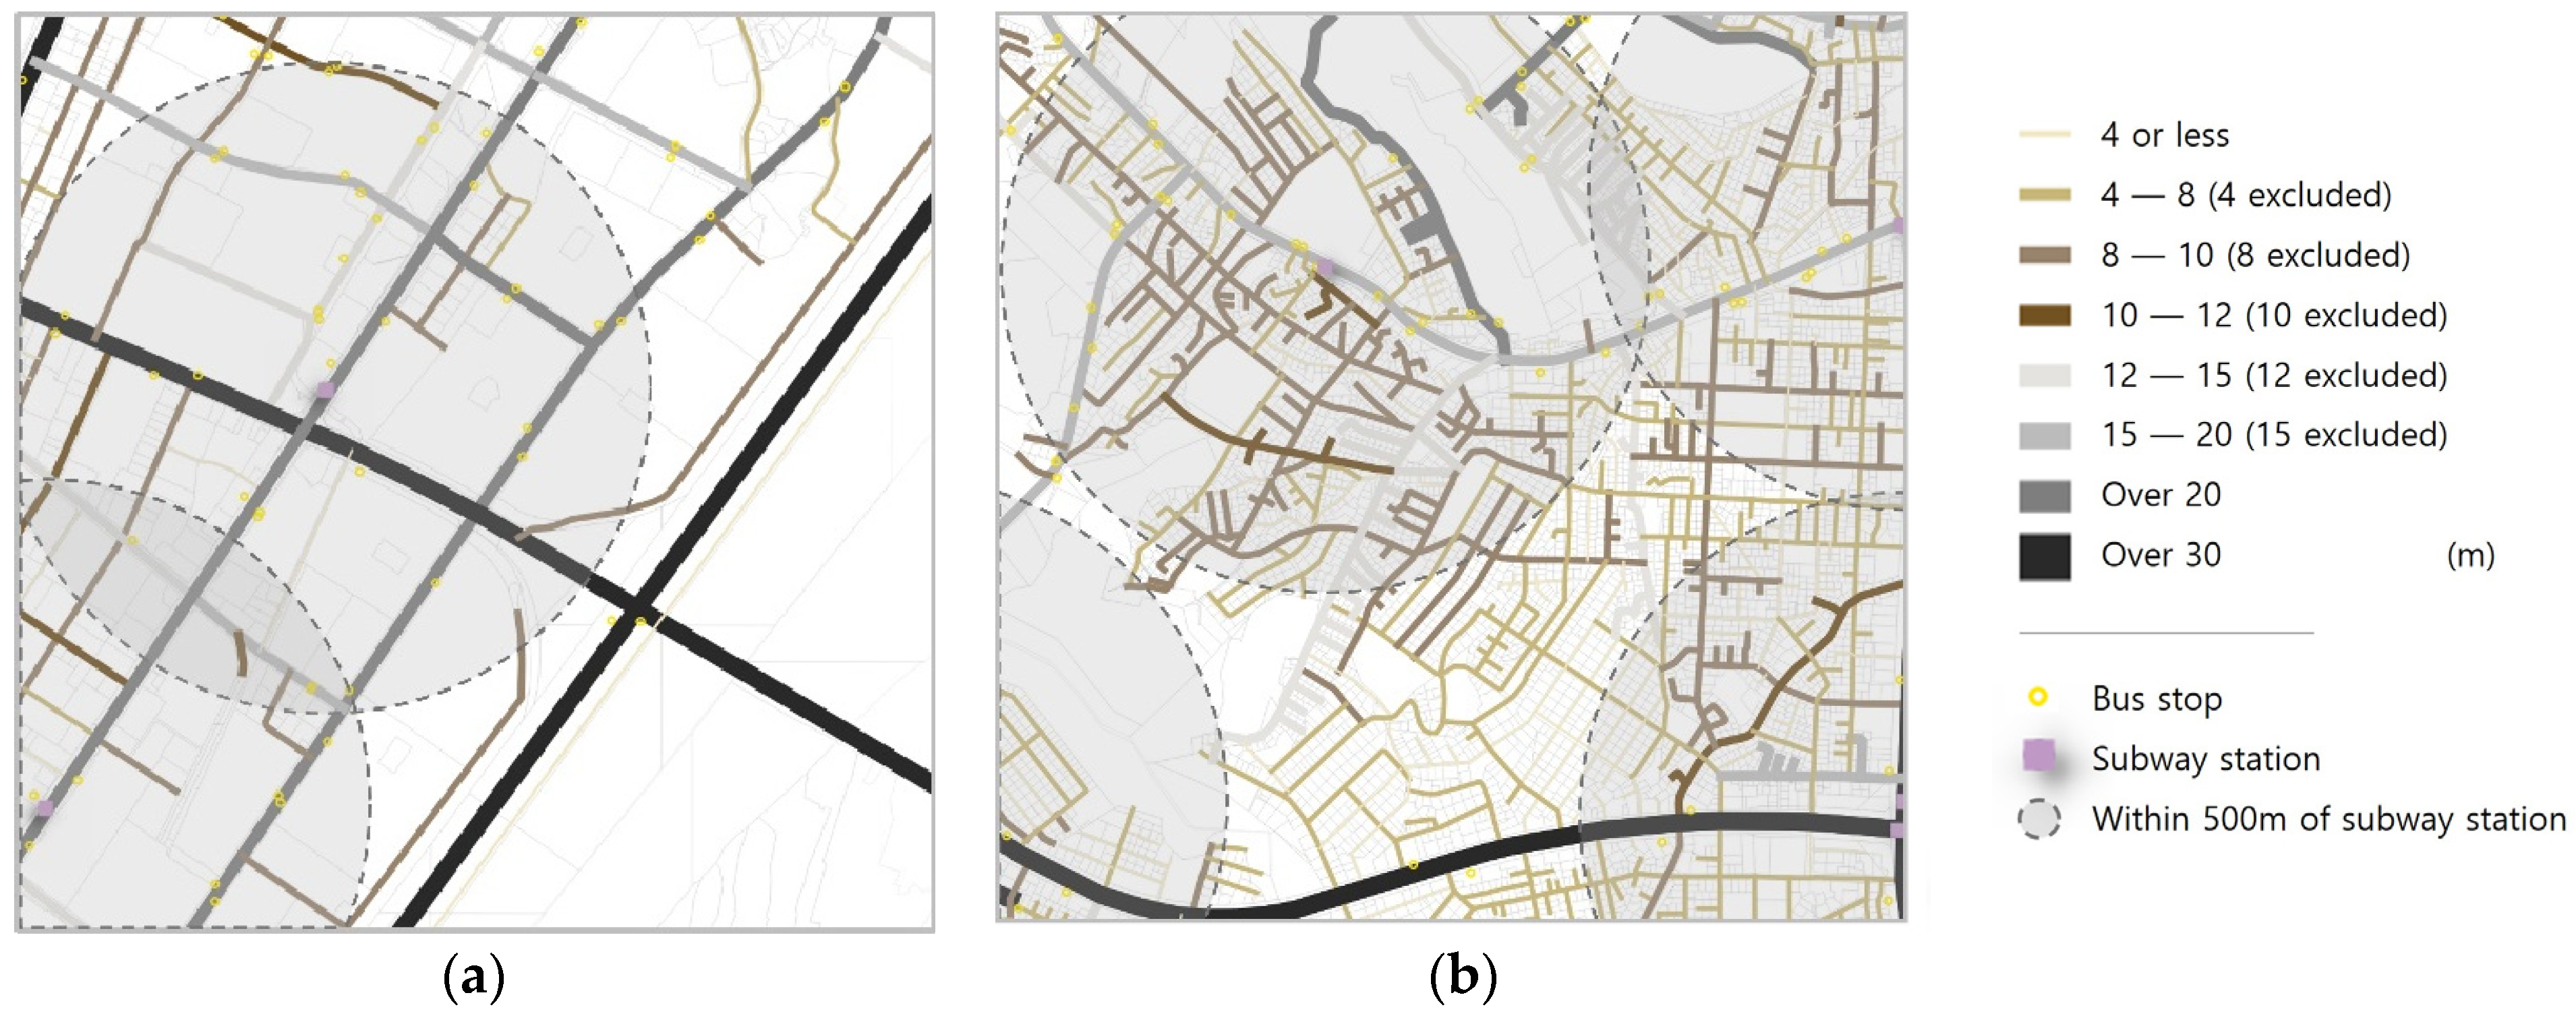
3.1.4. Street and Major Transit Systems
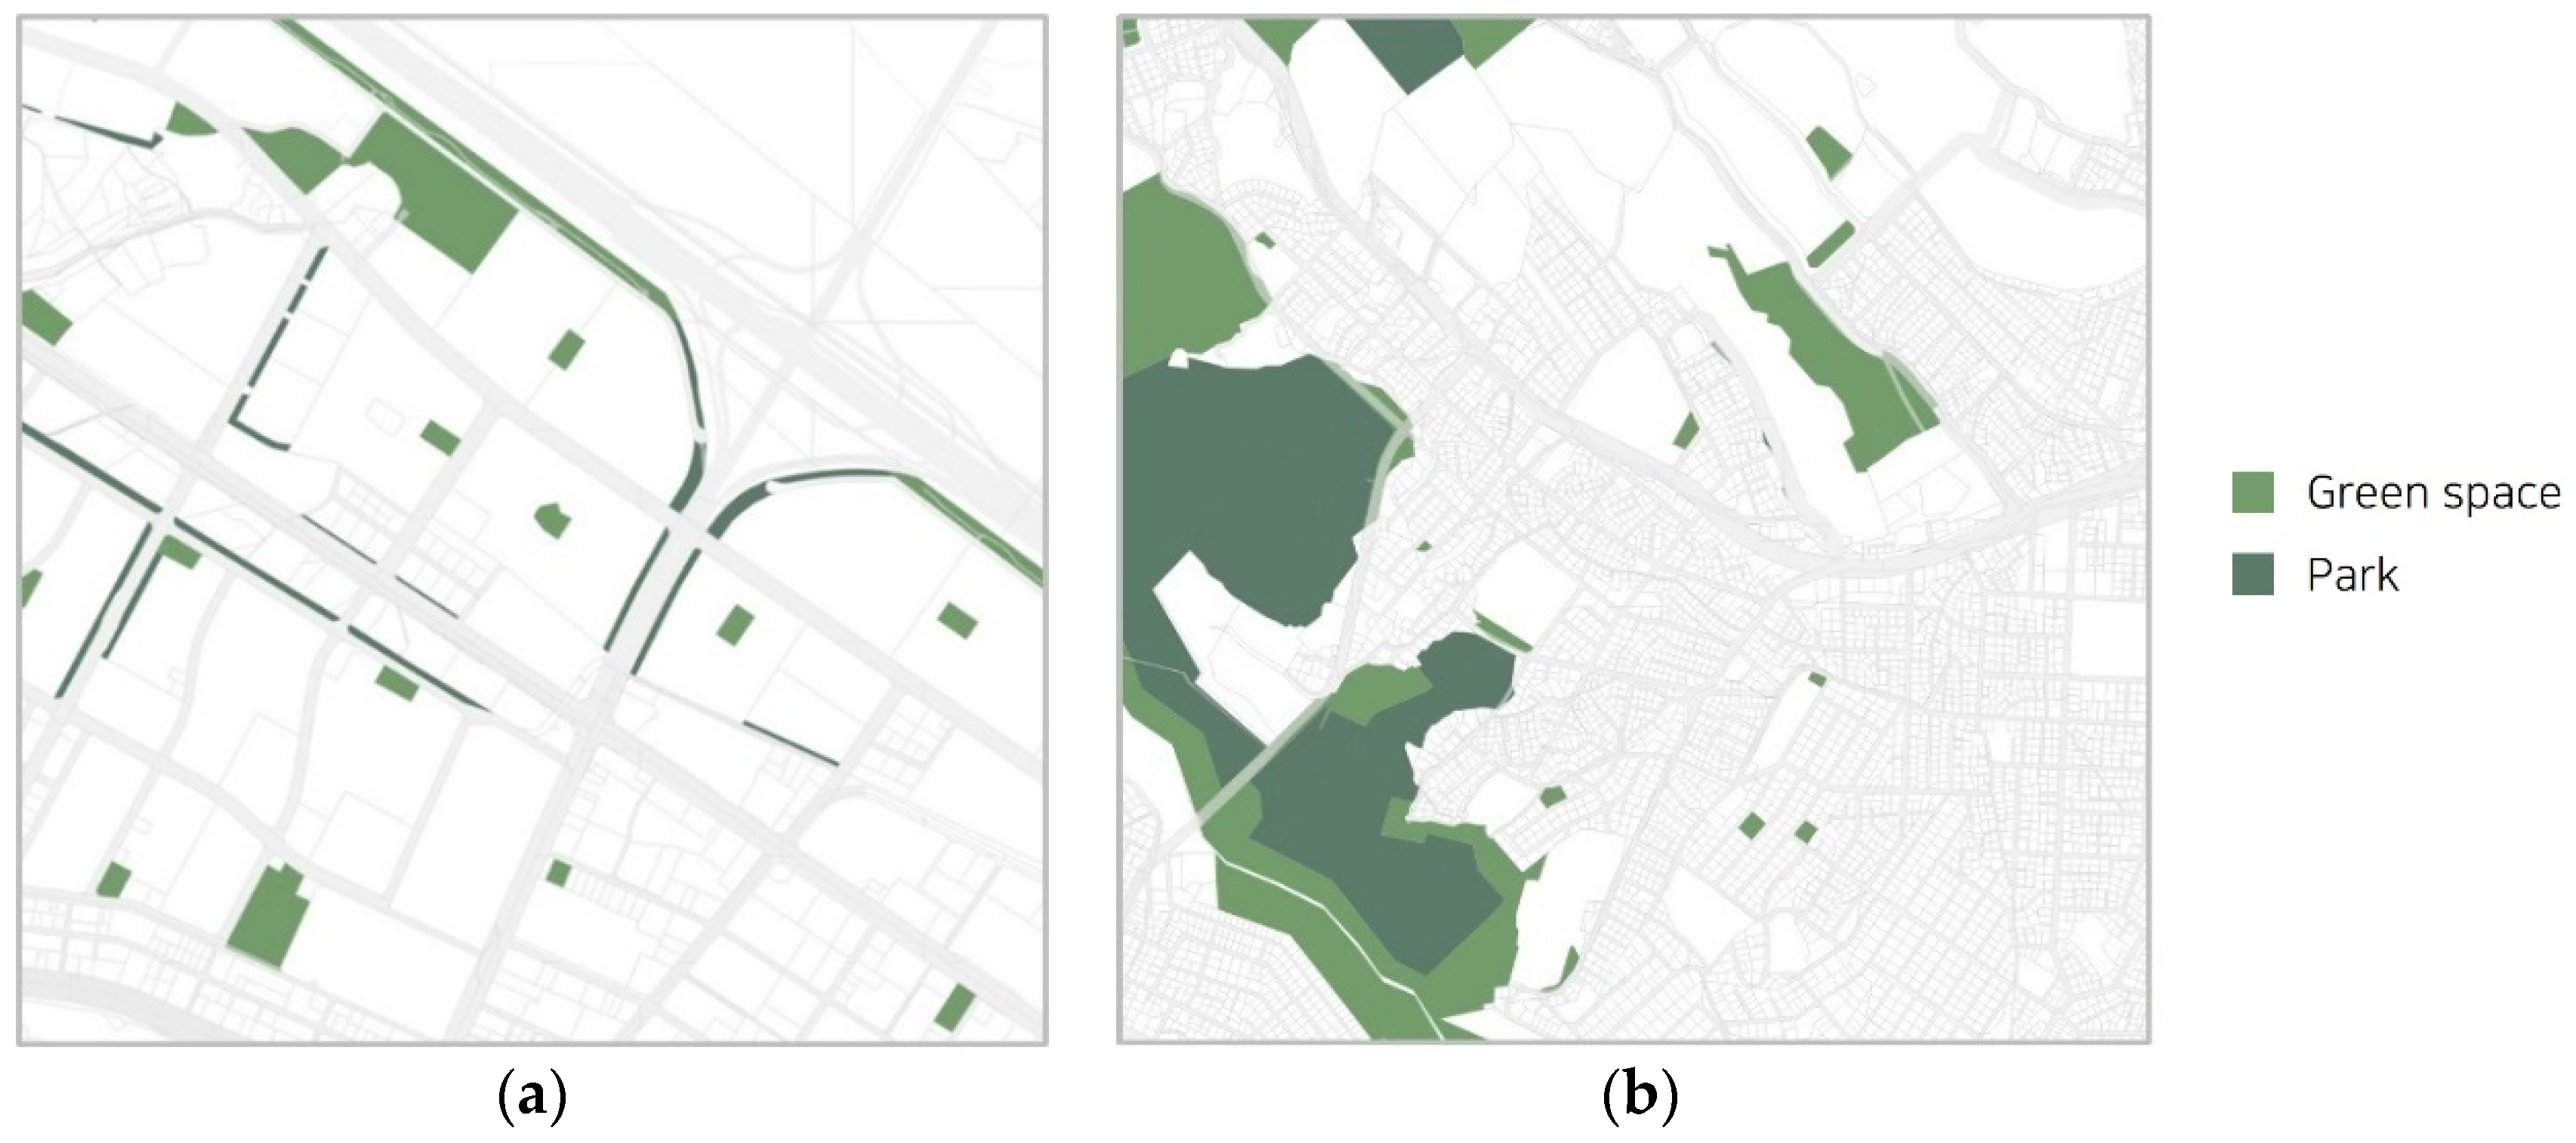
3.1.5. Park and Green Space
3.2. Key Characteristics of Residential Spaces
3.2.1. Gayang 5 Apartment Complex
3.2.2. Sadang 4-Dong Low-Rise Residential Area
4. Analysis of Survey Content by Region
4.1. Overview of Survey Organization and Statistical Analysis
4.2. Comparative Analysis of Respondent Characteristics
4.3. Living Space
4.3.1. General Information on Living Space
4.3.2. Satisfaction with Living Space
4.3.3. Satisfaction with Neighborhood
4.4. Understanding of Physical Health
4.5. Understanding of Overall Living Conditions
4.6. Understanding of Social Interactions
4.7. Understanding of Public Welfare
4.8. Intent to Use the AAL Support System
4.9. Analyzing Differences in Respondents by Gender
4.10. Key Insights from the Seoul Solitary Death Status and Survey for Achieving the UN Sustainable Development Goals (SDGs)
4.10.1. Identifying At-Risk Groups and Tailoring Support by Gender (Aligned with SDG 3, Good Health and Well-Being, and SDG 10, Reduced Inequalities)
4.10.2. Improving Living Environments and Housing Cost Support (Aligned with SDG 11, Sustainable Cities and Communities and SDG 3)
4.10.3. Customized Community Approaches and Strengthening Residential Welfare (Aligned with SDG 11 and SDG 10)
5. Conclusions
Author Contributions
Funding
Institutional Review Board Statement
Informed Consent Statement
Data Availability Statement
Acknowledgments
Conflicts of Interest
References
- The Law on Prevention and Management of Solitary Deaths (Abbreviation: Solitary Death Prevention Act); Article 2 Definition, Ministry of Health and Welfare (Division of Regional Welfare), Republic of Korea, 2023. Available online: https://www.law.go.kr/%EB%B2%95%EB%A0%B9/%EA%B3%A0%EB%8F%85%EC%82%AC%EC%98%88%EB%B0%A9%EB%B0%8F%EA%B4%80%EB%A6%AC%EC%97%90%EA%B4%80%ED%95%9C%EB%B2%95%EB%A5%A0 (accessed on 14 May 2023).
- Ministry of Health and Welfare. 2020 Solitary Death Survey. 2022; p. 9+77. Available online: https://www.mohw.go.kr/board.es?mid=a10503000000&bid=0027&tag=&act=view&list_no=374084&cg_code= (accessed on 13 October 2023).
- Han, J. Social Trends in Korea: The Status and Consequences of Social Isolation. In Gallup World Poll, 2008–2018; Gallup, Inc.: Washington, DC, USA, 2019; p. 341. [Google Scholar]
- Korea Institute of Public Administration. 2021 Social Integration Survey; Korea Institute of Public Administration: Seoul, Republic of Korea, 2022; p. 61. [Google Scholar]
- Song, I. Study on the Status of Solitary Death Risk in 2021; Seoul Welfare Foundation: Seoul, Republic of Korea, 2021. [Google Scholar]
- Seoul Think Tank Council 1st Policy Seminar. Analyzing the Current Status of Loneliness Risk in Seoul. 2022; p. 3. Available online: https://www.sit.re.kr/upload/report/20220620094307894910.pdf (accessed on 13 October 2023).
- Ministry of Health and Welfare. A Study on the Prevention and Discovery Support Measures Based on Data Analysis of High-Risk Groups for Lonely Deaths. J. Korean Soc. Inter. Des. 2019, 27, 37–53. Available online: https://www.khepi.or.kr/kps/rsrhBusnRept/view?menuId=MENU00894&rsrh_idx=1084 (accessed on 1 May 2023).
- Lee, J.; Kim, J. A study on the status of elderly people living alone in Seoul. Seoul Urban Res. 2013, 14, 191–211. Available online: https://www.dbpia.co.kr/pdf/pdfView?nodeId=NODE02266169 (accessed on 24 January 2024).
- Lim, H.; Lee, H. A Study on Solitary Elderly Management Service Using IT Technology-Focusing on Lifelogs of Elderly People Living Alone. 2018; p. 71. Available online: https://www.dbpia.co.kr/pdf/pdfView.do?nodeId=NODE07485440NODE07485440 (accessed on 24 April 2024).
- Shim, S. A Study on the Housing Support System for Vulnerable Groups Based on the IoT Environment. Converg. Inf. Pap. (Former. J. Soc. Small Medium Bus. Converg.) 2022, 12, 19–21. [Google Scholar] [CrossRef]
- Yoon, Y.; Kim, H.; Lee, S.; Pouri, S.S. Development and operation of remote lone-senior monitoring system based on heterogeneous IoT sensors and deep learning. J. Korea Converg. Soc. 2022, 13, 387–398. [Google Scholar] [CrossRef]
- Ministry of Health, Labor and Welfare. Study to Support the Establishment of Subordinate Legislation to the Act on Prevention and Management of Solitary Deaths. 2021; p. 31. Available online: https://www.klri.re.kr:9443/handle/2017.oak/9271 (accessed on 24 January 2024).
- Bureau of Social Welfare and Public Health Tokyo Metropolitan Government. A Guidebook for Residents to Watch over the Elderly and Other Residents–To Realize a Community Where Everyone Can Continue to Live with Peace of Mind; Bureau of Social Welfare and Public Health Tokyo Metropolitan Government: Tokyo, Japan, 2018. [Google Scholar]
- Lim, D. Japan’s Well-Being Services: The Potential for Layered Care Combining IoT and Humans. Int. Soc. Secur. Rev. 2020, 12, 90–103. [Google Scholar] [CrossRef]
- Králová, J. What is Social Death? Contemp. Soc. Sci. 2015, 10, 235–248. [Google Scholar] [CrossRef]
- Caswell, G.; O’Connor, M. Agency in the Context of Social Death: Dying Alone at Home. Contemp. Soc. Sci. 2015, 10, 249–261. [Google Scholar] [CrossRef]
- Helen, S.; Mary, G. Dementia and the Phenomenon of Social Death. Sociol. Health Illn. 1997, 19, 93–117. [Google Scholar]
- Timmermans, S.; Prickett, P.J. The Social Autopsy, Sociological Methods & Research; SAGE: Newcastle upon Tyne, UK, 2021; pp. 1–26. [Google Scholar]
- Card, C. Genocide and Social Death. Hypatia 2003, 18, 63–79. [Google Scholar] [CrossRef]
- White, S.C. Analysing Wellbeing: A Framework for Development Practice. Dev. Pract. 2010, 20, 158–172. [Google Scholar] [CrossRef]
- UK Department of Health. The Relationship between Wellbeing and Health. 2014. Available online: https://assets.publishing.service.gov.uk/government/uploads/system/uploads/attachment_data/file/295474/The_relationship_between_wellbeing_and_health.pdf (accessed on 12 February 2024).
- Jo cox. Combating Loneliness One Conversation at a Time. 2017; p. 4. Available online: https://www.kihasa.re.kr/api/kihasa/file/download?seq=2927 (accessed on 7 March 2024).
- Ministry of Health and Welfare. Solitary Death Survey Design Study; Ministry of Health and Welfare: Seoul, Republic of Korea, 2021; p. 113.
- Song, M. Establishment of Data-base Prediction Indicators for Risk Group of Elderly Living alone. Korean Gerontol. 2022, 42, 273–303. Available online: https://www.dbpia.co.kr/pdf/pdfView.do?nodeId=NODE11754832 (accessed on 24 January 2024). [CrossRef]


| Sections | Survey Items |
|---|---|
| Household and demographic characteristics | Household type |
| Age/Gender | |
| Life history changes | Experiencing changes in family relationships |
| Number of moves | |
| Number of job changes | |
| Residential vulnerability | Residence types/Housing ownership |
| Economic activity | Current status |
| Professional status | |
| Experience of business failure | |
| Economic situation | Degree of economic hardship (subjective) |
| Loans/Debt | |
| Unpaid utility and cell phone bills, etc. | |
| Illness and mental health | Chronic illnesses and diseases |
| Disability status | |
| Depressive disorders | |
| Health behaviors and psychological conditions | Nutritional intake levels |
| Alcohol-related disorders or alcohol dependence–addiction | |
| Psychiatric stress (work, school, etc.) | |
| Suicide-related behaviors, such as suicidal thoughts and attempts | |
| Perceived likelihood of solitary death | |
| Social networks | Relationship satisfaction |
| Interaction with family | |
| Having a counselor or financial support for non-family concerns | |
| Going out for non-essential purposes (a number of times) | |
| Number of people met, texted, or called outside of family | |
| Willingness to engage in social relationships | |
| Public services | Support for public services |
| Sections | Survey Items |
|---|---|
| Basic and personal information | Gender/Age |
| Neighborhood Area | |
| Years lived in a single-person household | |
| Employment status | |
| Reason for choosing current residence and desire to continue | |
| Residential space | Building Type/ownership |
| Year construction was completed | |
| Duration of residence | |
| Floor level of residence, size | |
| Living space info (orientation, number of rooms, size, windows, etc.) | |
| Heating/cooling methods and comfort level | |
| Satisfaction with physical convenience and comfort | |
| Residence and surrounding area | Satisfaction with safety |
| Satisfaction with convenience of location and access to facilities | |
| Satisfaction with comfort | |
| Health | Health conditions |
| Medication status | |
| Physical disability | |
| Possession of a long-term care license | |
| Dementia | |
| Number of hospital visits and presence of a companion | |
| Lifestyle in general | Primary living space |
| Frequency of going out | |
| Meal quality and regularity | |
| Alcohol, tobacco dependence | |
| Activity status | |
| Emotional status | |
| Emergencies response method | |
| Social interchange | Number of social interactions |
| Participation in group activities or gatherings | |
| Awareness of public welfare | Awareness of or participation in community programs |
| Desired welfare systems | |
| Satisfaction with public welfare | |
| Intention to use AAL support system services | Need for services |
| Ownership of smartphone/WIFI system | |
| Intention to use service | |
| Expectations |
| Q | Division | Frequency | Statistics |
|---|---|---|---|
| 1 | Gender |  | x2 = 0.6916 df = 1 p = 0.4056 |
| 2 | Age |  | x2 = 2.9929 df = 2 p = 0.2239 |
| 3 | Years lived in a single-person household |  | x2 = 2.874 df = 4 p = 0.5791 |
| 4 | Employment status |  | x2 = 5.189 df = 1 p = 0.0227 |
| 5 | Employment type |  | x2 = 7.388 df = 3 p = 0.061 |
| 6 | Main activity of work | 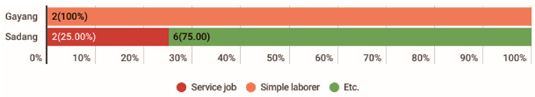 | x2 = 10.554 df = 3 p = 0.014 |
| 7 | Healthcare beneficiaries | 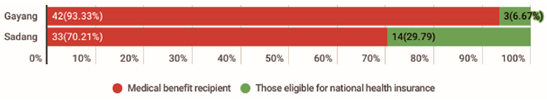 | x2 = 8.158 df = 1 p = 0.0043 |
| 8 | Reasons for choosing current residence (multiple answers allowed) |  | x2 = 35.189 df = 16 p = 0.004 |
| 9 | Desire to continued residence | 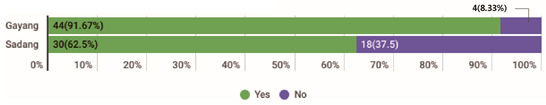 | x2 = 11.5577 df = 1 p = 0.0007 |
| 10 | Willingness to relocate | 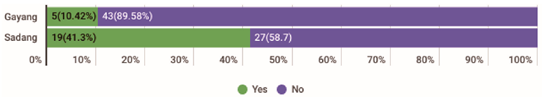 | x2 = 11.7866 df = 1 p = 0.0006 |
| 10-1 | Reason for wanting to relocate (multiple answers allowed) |  | x2 = 18.305 df = 7 p = 0.011 |
| Q | Division | Frequency | Statistics |
|---|---|---|---|
| 1 | Housing type |  | Fisher’s accurate appraisal p = < 0.0001 |
| 2 | Housing ownership | 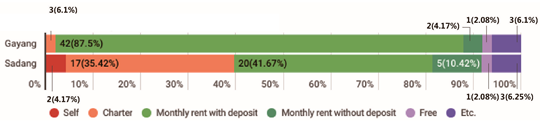 | Fisher’s accurate appraisal p = < 0.0001 |
| 3 | Year of construction | 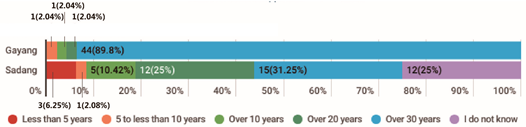 | Fisher’s accurate appraisal p = < 0.001 |
| 4 | Duration of residence |  | x2 = 21.0386 df = 4 p = 0.0003 |
| 5 | Floor level | 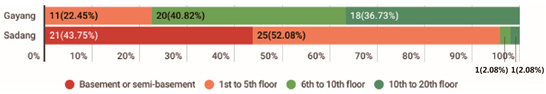 | x2 = 58.8414 df = 3 p = < 0.0001 |
| 6 | Size | 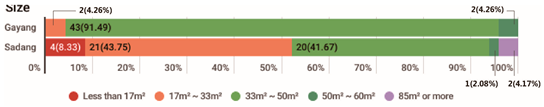 | Fisher’s accurate appraisal p = < 0.0001 |
| 7 | Main orientation |  | Fisher’s accurate appraisal p = < 0.001 |
| 8 | Number of rooms | 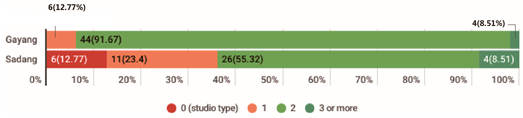 | Fisher’s accurate appraisal p = < 0.0001 |
| 8-1 | Presence of windows in studio |  | Fisher’s accurate appraisal p = 0.0895 |
| 8-2 | Presence of windows in living room |  | Fisher’s accurate appraisal p = < 0.0001 |
| 8-3 | ②, ③, ④ → Presence of windows in bedroom |  | Fisher’s accurate appraisal p = 0.1923 |
| 9 | Kitchen condition |  | Fisher’s accurate appraisal p = 0.0576 |
| 9-1 | ① → Presence of windows in kitchen |  | Fisher’s accurate appraisal p = 0.0109 |
| 10 | Bathroom location | 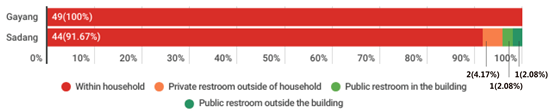 | Fisher’s accurate appraisal p = 0.0562 |
| 10-1 | ① → Presence of windows in bathroom |  | x2 = 57.2101 df = 1 p = 0.0001 |
| 11 | Heating method |  | x2 = 7.464 df = 3 p = 0.059 |
| 12 | Cooling method |  | x2 = 16.318 df = 6 p = 0.012 |
| 13 | Heating/cooling comfort level control |  | x2 = 8.9621 df = 1 p = 0.0028 |
| Q | Physical Convenience and Comfort | t | df | p | Average Satisfaction by Question (5-Point Scale) |
|---|---|---|---|---|---|
| 1 | Size of living space and number of rooms | −2.900 | 95 | 0.005 |  |
| 2 | Space arrangement and storage space | −3.459 | 95 | 0.001 | |
| 3 | Convenience of bathroom and kitchen | −1.809 | 94 | 0.074 | |
| 4 | Daylight | −4.133 | 95 | 0.000 | |
| 5 | Natural Ventilation | −4.066 | 95 | 0.000 | |
| 6 | Noise | −3.071 | 95 | 0.003 | |
| 7 | Physical performance insulation, condensation, and water leakage | −4.263 | 80.6 | 0.000 | |
| 8 | Air conditioning system | −2.950 | 94 | 0.004 | |
| 9 | Stairs, steps, and thresholds | −5.264 | 94 | 0.000 | |
| 10 | Interior finish and sanitary conditions | −3.401 | 95 | 0.001 | |
| 11 | Facility aging and breakdown | −1.837 | 95 | 0.069 | |
| 12 | Parking space | −5.902 | 95 | 0.000 | |
| 13 | Overall satisfaction with current living space | −3.821 | 93 | 0.000 |
| Question Number | Satisfaction with the Safety of Residence and Neighborhood | t | df | p | Average Satisfaction by Question (5-Point Scale) |
|---|---|---|---|---|---|
| 1 | Walking safety | −1.204 | 94 | 0.232 |  |
| 2 | Crime prevention facilities | −1.559 | 94 | 0.122 | |
| 3 | Soundproofing | −2.583 | 94 | 0.011 | |
| 4 | Privacy protection | −2.009 | 94 | 0.047 | |
| 5 | Satisfaction with safety near current residence | −2.127 | 93 | 0.036 |
| Q | Satisfaction with the Locational Convenience | t | df | p | Average Satisfaction by Question (5-Point Scale) |
|---|---|---|---|---|---|
| 1 | Ease of local accessibility | −4.172 | 95 | 0.000 | 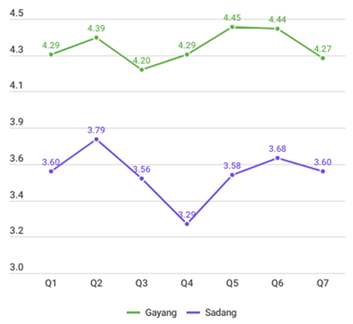 |
| 2 | Convenience of public transportation | −3.431 | 95 | 0.001 | |
| 3 | Distribution and number of commercial facilities | −3.492 | 95 | 0.001 | |
| 4 | Cultural facilities | −5.337 | 95 | 0.000 | |
| 5 | Medical facilities | −4.954 | 82.2 | 0.000 | |
| 6 | Welfare facilities and administrative facilities | −3.975 | 93 | 0.000 | |
| 7 | Satisfaction with the locational convenience of current residence and accessibility to facilities | −4.216 | 94 | 0.000 |
| Q | Satisfaction with the Comfort of Residence and Its Surroundings | t | df | p | Average Satisfaction by Question (5-Point Scale) |
|---|---|---|---|---|---|
| 1 | Street environment such as surrounding pedestrian paths | −2.749 | 95 | 0.007 | 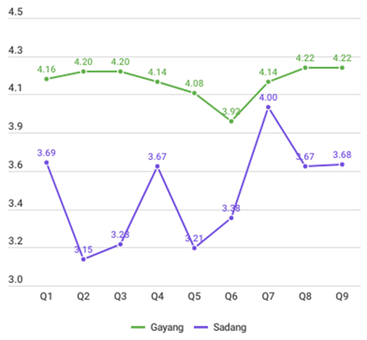 |
| 2 | Outside rest area | −5.132 | 95 | 0.000 | |
| 3 | Greenery | −4.976 | 95 | 0.000 | |
| 4 | Light environment (streetlights, surrounding signs, etc.) | −2.427 | 95 | 0.017 | |
| 5 | Vehicle entry and parking environment | −4.221 | 94 | 0.000 | |
| 6 | Common spaces such as hall/lobby/corridor space | −2.596 | 95 | 0.011 | |
| 7 | Garbage disposal method | −0.823 | 85 | 0.413 | |
| 8 | The overall environment around your residence | −3.173 | 95 | 0.002 | |
| 9 | Satisfaction with the comfort of residence and surroundings | −3.312 | 94 | 0.001 |
| Q | Division | Frequency | Statistics |
|---|---|---|---|
| 1 | Health condition | 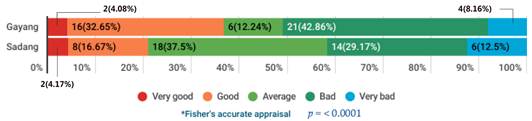 | * Fisher’s accurate appraisal p = < 0.0001 |
| 1-2 | Medication |  | x2 = 0.4499 df = 1 p = 0.5024 |
| 1-3 | Degree of limitation in daily life due to health condition |  | * Fisher’s accurate appraisal p = 0.0002 |
| 2 | Disability |  | x2 = 0.0861 df = 1 p = 0.7692 |
| 3 | Elderly long-term care grade holder |  | x2 = 1.1706 df = 1 p = 0.2793 |
| 3-1 | ① → Degree of limitation due to dementia |  | * Fisher’s accurate appraisal p = 0.129 |
| 4 | Number of hospital visits | 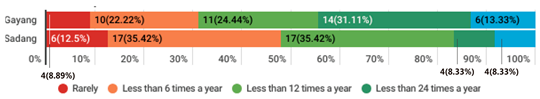 | x2 = 9.3691 df = 4 p = 0.0525 |
| 5 | Presence of someone to accompany in an urgent hospital visit |  | x2 = 1.7326 df = 1 p = 0.1881 |
| 5-1 | ① → Someone to accompany to urgent hospital visit (multiple answers allowed) | 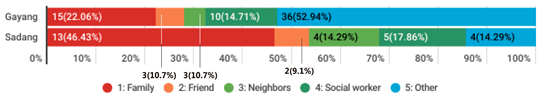 | x2 = 10.788 df = 10 p = 0.374 |
| Q | Division | Frequency | Statistics |
|---|---|---|---|
| 1 | Time spent in residence per day | 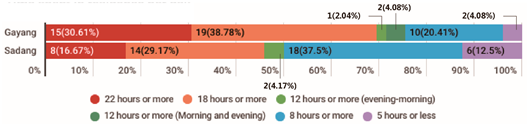 | Fisher’s accurate appraisal p = < 0.0001 |
| 2 | Frequency of going out per one week | 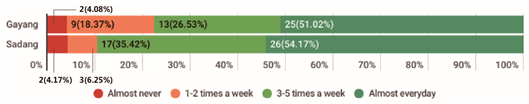 | Fisher’s accurate appraisal p = 0.0031 |
| 3 | Number of main meals per day | 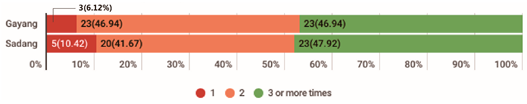 | Fisher’s accurate appraisal p = 0.0348 |
| 3-1 | Method of having meals (multiple answers allowed) |  | Fisher’s accurate appraisal p = < 0.0001 |
| 4 | Frequency of alcohol consumption | 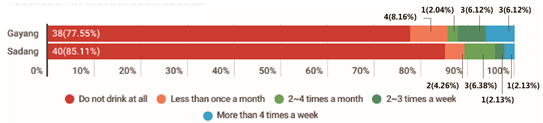 | Fisher’s accurate appraisal p = 0.004 |
| 4-1 | Amount of alcohol consumption | 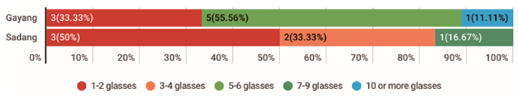 | Fisher’s accurate appraisal p = 0.004 |
| 4-2 | Frequency of consuming more than 1 bottle of soju or 4 bottles of beer |  | Fisher’s accurate appraisal p = 0.0112 |
| 4-3 | Frequency of inability to stop drinking once started over the past year |  | Fisher’s accurate appraisal p = 0.0256 |
| 4-4 | Frequency of inability to perform usual activities due to drinking over the past year |  | Fisher’s accurate appraisal p = 0.0294 |
| 5 | Smoking more than 5 packs (100 cigarettes) in your lifetime |  | Fisher’s accurate appraisal p = < 0.0001 |
| 5-1 (1) | Duration of smoking (if you are currently quitting smoking) | 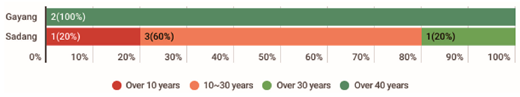 | Fisher’s accurate appraisal p = 0.0476 |
| 5-2 (1) | Duration of smoking (if you are currently smoking) | 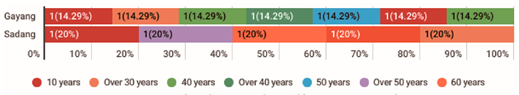 | Fisher’s accurate appraisal p = 0.0025 |
| 5-2 (2) | Average amount of smoking per day |  | Fisher’s accurate appraisal p = 0.599 |
| 6-1 | Number of times in a week engaging in in strenuous activities |  | Fisher’s accurate appraisal p = 0.0046 |
| 6-2 | Number of times in a week engaging in moderate activity |  | Fisher’s accurate appraisal p = 0.0004 |
| 6-3 | Number of times in a week engaging in walk at least 10 min |  | Fisher’s accurate appraisal p = < 0.0001 |
| 7-1 | Degree of memory decline compared to one year ago |  | Fisher’s accurate appraisal p = 0.0009 |
| 7-2 | Degree of decline in daily living compared to one year ago |  | Fisher’s accurate appraisal p = 0.0006 |
| 8-1 | Feeling distressed by daily activities compared to usual |  | Fisher’s accurate appraisal p = 0.0011 |
| 8-2 | Loss of appetite |  | Fisher’s accurate appraisal p = 0.0061 |
| 8-3 | Difficulty falling asleep, difficulty sleeping well, or sleeping too much |  | x2 = 1.0228 df = 3 p = 0.7957 |
| 8-4 | Depression/despair |  | Fisher’s accurate appraisal p = 0.0013 |
| 8-5 | A decrease in speed of movement/speech due to being nervous and restless. |  | Fisher’s accurate appraisal p = 0.003 |
| 8-6 | Difficulty of overcoming feelings of depression, even with help and support |  | Fisher’s accurate appraisal p = 0.0033 |
| 8-7 | Thoughts of self-harm or suicide |  | Fisher’s accurate appraisal p = 0.0027 |
| 9 | The most difficult aspect of living alone (multiple answers allowed) |  | Fisher’s accurate appraisal p = 0.007 |
| 10 | Experience with physical accidents/emergencies |  | x2 = 0.0124 df = 1 p = 0.9113 |
| 11 | Existence of emergency contact network |  | x2 = 1.3963 df = 1 p = 0.2373 |
| 11-1 | Availability of emergency contact person (multiple answers allowed) |  | Fisher’s accurate appraisal p = 0.589 |
| 12 | Fear and burden of handing emergencies | 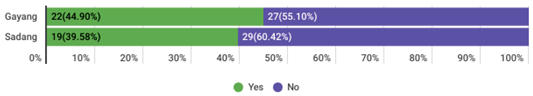 | x2 = 0.2807 df = 1 p = 0.5963 |
| 13 | Availability of acquaintances in case of problems | 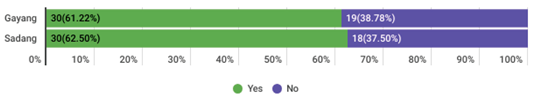 | x2 = 0.0167 df = 1 p = 0.8971 |
| Q | Division | Frequency | Statistics |
|---|---|---|---|
| 1 | Amount of time with family members or relatives | 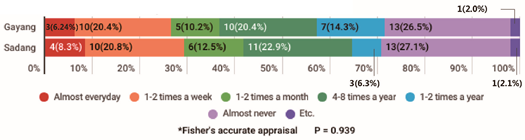 | * Fisher’s accurate appraisal p = 0.939 |
| 2 | Number of interactions with neighbors in your residence |  | * Fisher’s accurate appraisal p = < 0.0001 |
| 3 | Participating of organizations, meetings, or classes |  | x2 = 0.5343 df = 1 p = 0.4648 |
| 3-1 | Frequency | 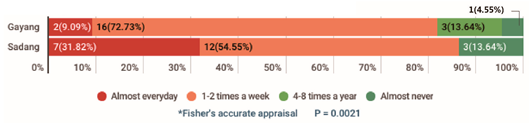 | * Fisher’s accurate appraisal p = 0.0021 |
| 4 | Number of interactions with acquaintances, excluding neighbors |  | x2 = 2.2286 df = 4 p = 0.6938 |
| 5 | Number of times neighbors/acquaintances visit your home or neighbors/acquaintances visit your home | 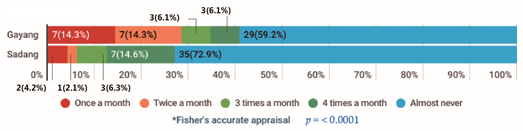 | * Fisher’s accurate appraisal p = < 0.0001 |
| Division | Frequency | Statistics | |
|---|---|---|---|
| 1 | Awareness of welfare systems and community programs for single-person households | 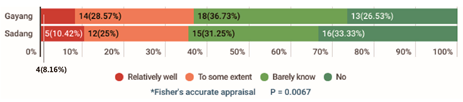 | * Fisher’s accurate appraisal p = 0.0067 |
| 2 | Utilization of welfare systems or community programs |  | x2 = 12.6472 df = 1 p = 0.0004 |
| 3 | Satisfaction level | 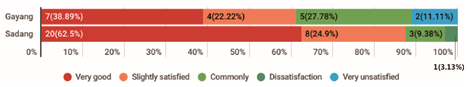 | t = 2.32 df = 48 p = 0.0025 |
| Division | Frequency | Statistics | |
|---|---|---|---|
| 1 | The need for IT-based emergency and safety services | 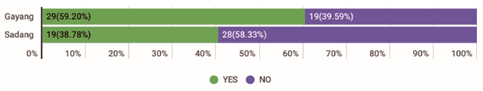 | x2 = 1.046 df = 1 p = 0.3064 |
| 2 | Use of smartphone | 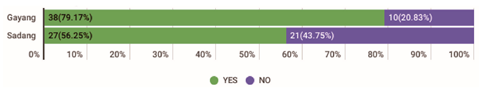 | x2 = 5.7648 df = 1 p = 0.0164 |
| 3 | Availability of WIFI at home |  | x2 = 2.7 df = 1 p = 0.1003 |
| 4 | Intension to use AAL services |  | * Fisher’s appraisal p = 0.096 |
| Q | Division | Frequency | Statistics |
|---|---|---|---|
| Understanding of Overall Life Additional Analysis of Items on Drinking, Smoking, Depression, etc. | |||
| 4 | Frequency of alcohol consumption |  | * Fisher’s accurate appraisal p = < 0.000 |
| 4-1 | Amount of alcohol consumption |  | * Fisher’s accurate appraisal p = < 0.000 |
| 4-2 | Frequency of consuming more than 1 bottle of soju or 4 bottles of beer |  | * Fisher’s accurate appraisal p = < 0.000 |
| 4-3 | Frequency of inability to stop drinking once started |  | * Fisher’s accurate appraisal p = < 0.000 |
| 4-4 | Frequency of inability to perform usual activities due to drinking |  | * Fisher’s accurate appraisal p = < 0.000 |
| 5 | Smoking more than 5 packs (100 cigarettes) in your lifetime | 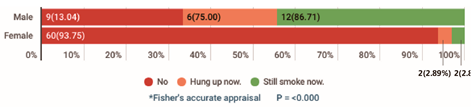 | * Fisher’s accurate appraisal p = < 0.000 |
| 5-1 (1) | Duration of smoking (if you are currently quitting smoking) | 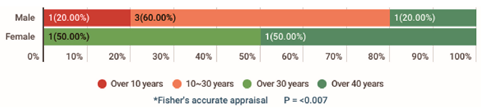 | * Fisher’s accurate appraisal p = < 0.007 |
| 5-2 (1) | Duration of smoking (if you are currently smoking) | 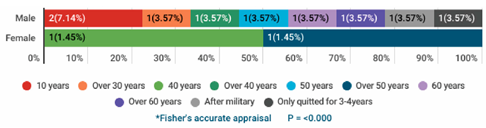 | * Fisher’s accurate appraisal p = < 0.000 |
| 5-2 (2) | Average amount of smoking per day | 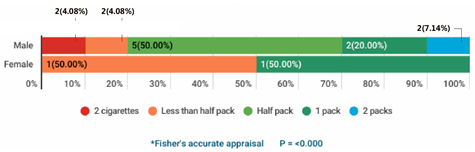 | * Fisher’s accurate appraisal p = < 0.000 |
| 8-1 | Feeling distressed by daily activities compared to usual |  | * Fisher’s accurate appraisal p = < 0.353 |
| 8-2 | Loss of appetite | 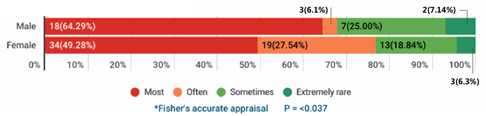 | * Fisher’s accurate appraisal p = < 0.037 |
| 8-3 | Difficulty falling asleep, difficulty sleeping well, or sleeping too much |  | * Fisher’s accurate appraisal p = < 0.765 |
| 8-4 | Depression/despair |  | * Fisher’s accurate appraisal p = < 0.303 |
| 8-5 | A decrease in speed of movement/speech | 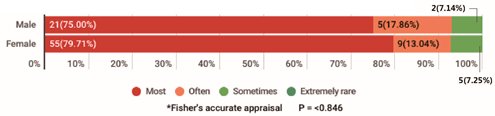 | * Fisher’s accurate appraisal p = < 0.846 |
| 8-6 | Difficulty overcoming feelings of depression and hopelessness, even with help and support |  | * Fisher’s accurate appraisal p = < 0.429 |
| 8-7 | Thoughts of self-harm or suicide |  | * Fisher’s accurate appraisal p = < 0.495 |
| 12 | Fear and burden of handing emergencies | 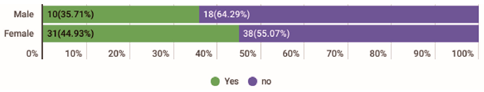 | x2 = 0.693 df = 1 p = 0.498 |
| Q | Division | Frequency | Statistics |
|---|---|---|---|
| Additional Analysis of Intention to Use AAL Support System Services | |||
| 4 | Intension to use AAL services |  | x2 = 0.004 df = 1 p = 0.563 |
Disclaimer/Publisher’s Note: The statements, opinions and data contained in all publications are solely those of the individual author(s) and contributor(s) and not of MDPI and/or the editor(s). MDPI and/or the editor(s) disclaim responsibility for any injury to people or property resulting from any ideas, methods, instructions or products referred to in the content. |
© 2024 by the authors. Licensee MDPI, Basel, Switzerland. This article is an open access article distributed under the terms and conditions of the Creative Commons Attribution (CC BY) license (https://creativecommons.org/licenses/by/4.0/).
Share and Cite
Kim, H.-J.; Park, J.-H.; Park, N.-Y.; Moon, H.J. Single-Person Households among the Socially Vulnerable Elderly Population: A Comparative Study of Housing, Living Habits, and Social Environments in Selected Neighborhoods of Seoul for the Prevention of Solitary Deaths. Sustainability 2024, 16, 7740. https://doi.org/10.3390/su16177740
Kim H-J, Park J-H, Park N-Y, Moon HJ. Single-Person Households among the Socially Vulnerable Elderly Population: A Comparative Study of Housing, Living Habits, and Social Environments in Selected Neighborhoods of Seoul for the Prevention of Solitary Deaths. Sustainability. 2024; 16(17):7740. https://doi.org/10.3390/su16177740
Chicago/Turabian StyleKim, Ho-Jeong, Joo-Ho Park, Na-Yeon Park, and Hyeun Jun Moon. 2024. "Single-Person Households among the Socially Vulnerable Elderly Population: A Comparative Study of Housing, Living Habits, and Social Environments in Selected Neighborhoods of Seoul for the Prevention of Solitary Deaths" Sustainability 16, no. 17: 7740. https://doi.org/10.3390/su16177740
APA StyleKim, H.-J., Park, J.-H., Park, N.-Y., & Moon, H. J. (2024). Single-Person Households among the Socially Vulnerable Elderly Population: A Comparative Study of Housing, Living Habits, and Social Environments in Selected Neighborhoods of Seoul for the Prevention of Solitary Deaths. Sustainability, 16(17), 7740. https://doi.org/10.3390/su16177740