Article

Detection of Methane Leaks via a Drone-Based System for Sustainable Landfills and Oil and Gas Facilities: Effect of Different Variables on the Background-Noise Measurement

by
Giuseppe Tassielli
1,*,
Lucianna Cananà
2 and
Miriam Spalatro
1
1
Department of Physics, University of Bari “Aldo Moro”, Via Orabona 4, 70124 Bari, Italy
2
Ionian Department of Law, Economics and Environment, University of Bari “Aldo Moro”, Via Lago Maggiore Ang. Via Ancona, 74121 Taranto, Italy
*
Author to whom correspondence should be addressed.
Sustainability 2024, 16(17), 7748; https://doi.org/10.3390/su16177748
Submission received: 24 July 2024 / Revised: 31 August 2024 / Accepted: 3 September 2024 / Published: 5 September 2024

Abstract

:
In recent years, thanks to the great diffusion of drone technology and the development of miniaturized sensors that can be connected to drones, in order to increase the sustainability of landfills and oil and gas facilities, interest in finding methane leaks and quantifying the relative flow has grown significantly. This operation requires the methane background concentration to be subtracted from the calculations. Therefore, in order to proceed with a right estimate of CH4 flows emitted, the possibility of correctly measuring or estimating the background level becomes crucial. The present work intends to illustrate the effects of different variables on the background-noise measurement in a drone-based system that uses a tunable diode laser absorption spectrometer (TDLAS). The methodology used is that of field testing; the data acquisition campaign consisted of the execution of 80 flights during which different flight variables (drone speed, flight altitude) were tested; the flights were repeated in different weather and climate conditions both during the same day and in different periods of the year. Different surfaces, similar to those found in landfill or natural gas sites, were also tested. In some of the field trials, a controlled methane release test was performed in order to verify how much the quantification of the methane flow can vary depending on the background level used. The results of the different field trials highlighted the best conditions under which to measure methane emissions with a TDLAS sensor in order to minimize the number of outliers: flight altitude not exceeding 15 m above ground level; the drone speed appears to have less impact on the results, however, it is optimal between 1 and 2 ms−1; a very sunny day produces much higher methane background levels than a cloudy one. The type of surface also significantly affects the measurement of background noise. Finally, tests conducted with a controlled methane release highlighted that different levels of background have a significant impact on the estimation of the methane flux emitted.

1. Introduction

To tackle climate change, greater knowledge of the phenomena that determine it and correct quantification of global warming gas emissions are necessary. Many European legislative documents report this need, in particular in relation to methane given its extreme importance as a greenhouse gas. Methane, in fact, is the second gas in terms of contribution to climate change after carbon dioxide. It has a global warming potential 27.9 times greater than that of carbon dioxide over a 100-year period [1] and is a powerful precursor of air pollution, contributing to the formation of ozone, which in turn is harmful to human health.
The EU Methane Strategy to reduce methane emissions [2] reported that approximately 41% of global methane emissions come from natural sources, such as wetlands or fires. The remaining 59% is the result of human (anthropogenic) activity, of which the major sources are agriculture (40–53%), the production and use of fossil fuels (19–30%), and waste (20–26%). In the EU, 53% of anthropogenic methane emissions come from agriculture, 26% from waste, and 19% from energy. The document reports among the intersectoral actions that a priority objective of the strategy is to ensure that companies apply, in the various sectors, methodologies for measuring and communicating methane emissions that are much more accurate than is currently the case. This will contribute to a better understanding of the problem and better guide subsequent mitigation measures.
Key to delivering the EU Methane Strategy, the EU Regulation on methane emissions reduction in the energy sector was adopted in May 2024. It aims to reduce the emissions of methane into the atmosphere and to minimize leaks coming from fossil energy companies operating in the EU. The main rules introduced by the regulation include improved measurement, reporting, and verification of energy sector methane emissions in order to help understand the exact locations and volumes of methane emitted, allowing a shift from estimates to direct measurements. The regulation requires the use of increasingly standardized measurement methods including site-level measurement using sensors mounted on unmanned aerial systems (UASs).
In recent years, thanks to the great diffusion of drone technology and the development of miniaturized sensors that can be connected to drones, numerous applications of drones have emerged in the field of environmental monitoring [3] and in particular of methane emissions [4]. A thriving research stream is devoted to the setup of gas sensors [5,6,7] or the use of nanomaterials for sensor optimization [8,9]. Numerous studies dedicated to the search for and quantification of methane leaks are reported in the literature. The sectors most affected are those of waste landfills and natural gas supply chain [10].
The use of drone-based systems for methane leak detection appears to be an attractive solution even compared to traditional methods due to the numerous advantages that this technology offers. The speed of the system, understood as the speed of both the UAS and the data acquisition and processing by the sensor, guarantees the immediacy of the survey results. This feature allows for monitoring large surfaces in short periods of time, achieving not only greater productivity but also the possibility of immediately tracking potentially dangerous situations. The UAS’s flexibility is needed for its use in various scenarios: landfills with poor accessibility, irregular morphology, and difficulty in reaching some areas. The instrument also offers the possibility of carrying out close and constant screening over time in order to implement more widespread monitoring. Finally, the safety of the operators must not be underestimated, since a survey via drone avoids physically carrying out the landfill plan for a walkover survey. Naturally, the potential limitations inherent in the proposed technology must not be overlooked to avoid nullifying the obtainable advantages. In particular, it is necessary to proceed with an in-depth planning of the intervention and an adequate management of the UAS in reference to the flight times that, on average, are around 30 min per set of batteries. Furthermore, the development of sensors is at a stage in which the detection equipment could suffer from some reliability problems if not operated and maintained correctly. Finally, the intervention approach in the field must be entirely designed in terms of the available drone and payload, requiring many months for the correct setting of the equipment and the survey procedure in terms of the site and the activities to be carried out.
Many experiences are recorded in the literature aimed at identifying and quantifying the biogas emitted from landfills in the form of fugitive emissions and in particular the methane component through the use of sensors mounted on drones.
We therefore find several application examples ranging from the search for emission points [11,12,13,14] to the quantification of the methane flux emitted from landfills located in various countries [15,16,17]. Other authors have carried out controlled methane release tests to optimize flow quantification models [18] or to study some parameters of such models [19,20,21].
The oil and gas industries, which handle large quantities of methane, must continuously address their emissions and leakage into the atmosphere. Rapid identification of these leaks is crucial. In this sector there is a growing interest in emissions measurements made via drone on natural gas infrastructure. In [22] the authors describe a measurement technique needed to accurately quantify and mitigate greenhouse gas emissions. A miniature tunable diode laser absorption spectrometer (TDLAS), mounted on both fixed-wing and multi-rotor unmanned aerial vehicles, was employed to accurately quantify methane emissions from oil and gas assets. Another study [23] focused on the applications of air-borne methods for inspections of natural gas pipelines. The main goal of their study was to test an unmanned aerial vehicle (UAV), equipped with a remote sensing methane detector, for detection of natural gas leaks coming from the pipeline network. A study [24] explores source detection of a drone-based system with controlled releases. The authors examine different detection algorithm parameters to understand trade-offs between the false positive rate and detection probability.
For the quantification of the methane flow emitted from a landfill or a natural gas facility, many intervention models have been developed, which are essentially based on the mass balance approach or on the Gaussian plume inversion model. Both methodological approaches require the methane background concentration to be subtracted from the estimated emission flows.
Therefore, in order to proceed with a right estimate of the methane flows emitted, correctly measuring or estimating the background level becomes crucial. In general, this aspect is considered secondary and the main focus is on the definition of the estimation model or on the best interpolation method. The effects that background can have in this exercise are often underestimated but, as demonstrated below, can be very significant. Regarding measurement techniques, the background level is measured by carrying out one or more upwind flights outside of the emission plume. For example, in [19] the authors sample different vertical heights to ensure sampling of local background values, using a quantum cascade laser spectrometer (QCLAS); local variation of measured background values was then corrected using the robust extraction baseline signal algorithm developed by [25].
In [26], instead, the background is estimated starting directly from the measurement data collected on a landfill using a sensor based on off-axis integrated cavity output spectroscopy (OA-ICOS); since most of the points measured on the site do not contain methane emissions, the mode of measurements is considered to be a representative mean of the methane background concentration.
The sensors mentioned measure the concentration values directly at the points crossed by the UAV. The situation is very different when using a sensor based on tunable diode laser absorption spectroscopy. In this case, the laser emits light (spectral range of 1.65 µm), which reflects from the ground and is captured by the sensor. The outgoing and incoming signals are compared with the built-in reference cell. If methane is present along the laser path, the laser light is partially absorbed. An algorithm calculates the gas concentration in parts per million multiplied by meter (ppm*m). This type of sensor therefore does not measure a concentration along the path of the drone at the altitude at which it is located but instead measures the column of methane between the drone and the ground. This type of measurement is therefore affected not only by the actual concentration of methane present in the background but also by the way in which the light emitted by the laser is reflected and then absorbed by the sensor, generating background noise.
Using a TDLAS sensor, therefore, the methane background measurement contains both the actual methane concentration present in the atmosphere and the background noise of the sensor.
The present work intends to illustrate the effects of different variables on the background-noise measurement in a drone-based system that uses a sensor based on tunable diode laser absorption spectroscopy. Since this technology has an ever-increasing number of users engaged in estimating methane flows emitted from landfills or gas supply chain plants, it is important to know the advantages and limitations of this technology and the variables that affect the measurements carried out with this type of sensor. The objective is to identify the most suitable flight setup when using this type of sensor which allows for obtaining the best-quality measurement data for the purpose of subsequent post-processing for estimating the flow of methane emitted. The work tries to isolate the variables observed in situations not contaminated by methane emissions so that the results can then be extended to landfill or oil and gas sites.
The paper is organized as follows: firstly, the methodology used is described, which consists of carrying out a series of field test campaigns; the equipment used and the rationale for the survey are presented. This is followed by the section in which the results of the tests performed are presented, then they are discussed in the light of other experiences found in the literature. The main findings and future research conclude the work.

2. Materials and Methods

To evaluate the different effects of some variables on the measurement via TDLAS of the methane background level, various survey campaigns were conducted via drone which allowed the collection of experimental data in different ambient situations. The data acquisition campaign consisted of the execution of 80 flights during which different flight variables (UAV speed, flight height) were tested.

2.1. Surveys Design and Locations

The surveys were carried out in areas where there were no methane emissions; in particular, the chosen areas are in Apulia (Italy) (Figure 1a) and are represented by:
-
a suburban area (SA) on the outskirts of the city: the area is characterized by the presence of buildings surrounded by concrete surfaces and green areas (Figure 1b);
-
an industrial area (IA): dedicated mainly to metalworking production; an area characterized by a gravel covering was chosen (Figure 1d);
-
an agricultural area (AA) dedicated to the production of durum wheat (Figure 1c).
-
The surveys were designed to test the following controllable variables:
-
various flight altitudes: heights of 7, 10, 15, 20 m above ground level (AGL) were generally tested; in some cases even higher heights were tested (25, 30, 40 m AGL);
-
various UAV speeds: speeds of 1, 2, 3, 4 ms−1 were generally tested; in some cases the flight was carried out when hovering or at the very low speed of 0.5 ms−1;
-
various overflight surfaces: areas covered with very short grass or tall grasses were flown over, others were made up of concrete bricks or white gravel. The former surfaces can typically be found in waste landfills while the latter in sites hosting gas infrastructure.
A non-negligible disturbance component linked to different factors is expected in the measurements taken by the drone; in fact, from the point of emission (soil), the original emission signal (i.e., the concentration at the soil–atmosphere interface) can be altered by weather–climatic conditions (e.g., windiness, humidity, temperature, etc.).
Therefore, some of the surveys were repeated on the same sites to consider the variation of the following elements:
-
time of day at which to carry out the survey: different hours of the day correspond to different solar radiation present on the site which can affect the reflection of the laser light; even the presence or absence of shading at different times can have the same effect;
-
degree of sky coverage: the presence or absence of clouds in the sky also affects the reflected radiation that backscatters to the sensor; a survey was repeated on a day characterized by a sky completely covered by clouds;
-
wind intensity: the wind can cause different stresses to the drone during flight, determining a different level of oscillation which in turn affects the oscillation of the beam transmitted by the laser; even the cover on the ground can move in the presence of wind (think, for example, of tall grasses) and this can affect the return reading to the sensor.

2.2. Instrumentation

The instrumentation used consists of a monitoring system composed of two main components: the aerial platform and the payload.
The aerial platform consists of a rotary wing drone, characterized by technical and technological choices capable of guaranteeing the precision of the surveys: adoption of an RTK system on the drone, interconnection of payload and drone via SDK ports, use of multi-frequency radio control for the management of the drone in flight, intelligent power system.
The payload mounted on the UAV is represented by a laser absorption spectrometer for methane measurement using tunable diode laser absorption spectroscopy (TDLAS). The laser is set to a data acquisition rate of 10 Hz; flying at a speed of 2 ms−1 this means that a spatial resolution of 0.2 m is obtained.
In each test campaign, environmental context data were also collected through a portable weather station on the site; the monitored parameters were wind speed and direction, atmospheric pressure, humidity, and air temperature; the weather–climatic context in which the tests were carried out was also defined in descriptive terms.
In each survey the flight is conducted on the same straight path which is traveled forwards and backwards several times in order to collect as much information as possible. For the purpose of data analysis, the initial and final parts of the flight (acceleration and braking) are then omitted; in fact, only the data set in which the drone had a constant speed is considered.
The areas surveyed were considered to be definitely not emitting methane. In any case, an on-ground survey was preliminarily carried out to ascertain this condition; the area that would be overflown by the detector was scanned using a hand-held instrument. A portable multi-function gas detector was used for the search for, localization, and classification of gas-emitting points with selective sensors. This instrument uses a hybrid technology consisting of a first range 0–1000 ppmv semiconductor technology and then uses IR technology for measurements of higher concentrations (0.1–100% by volume). No trace of methane emissions was found with this test.

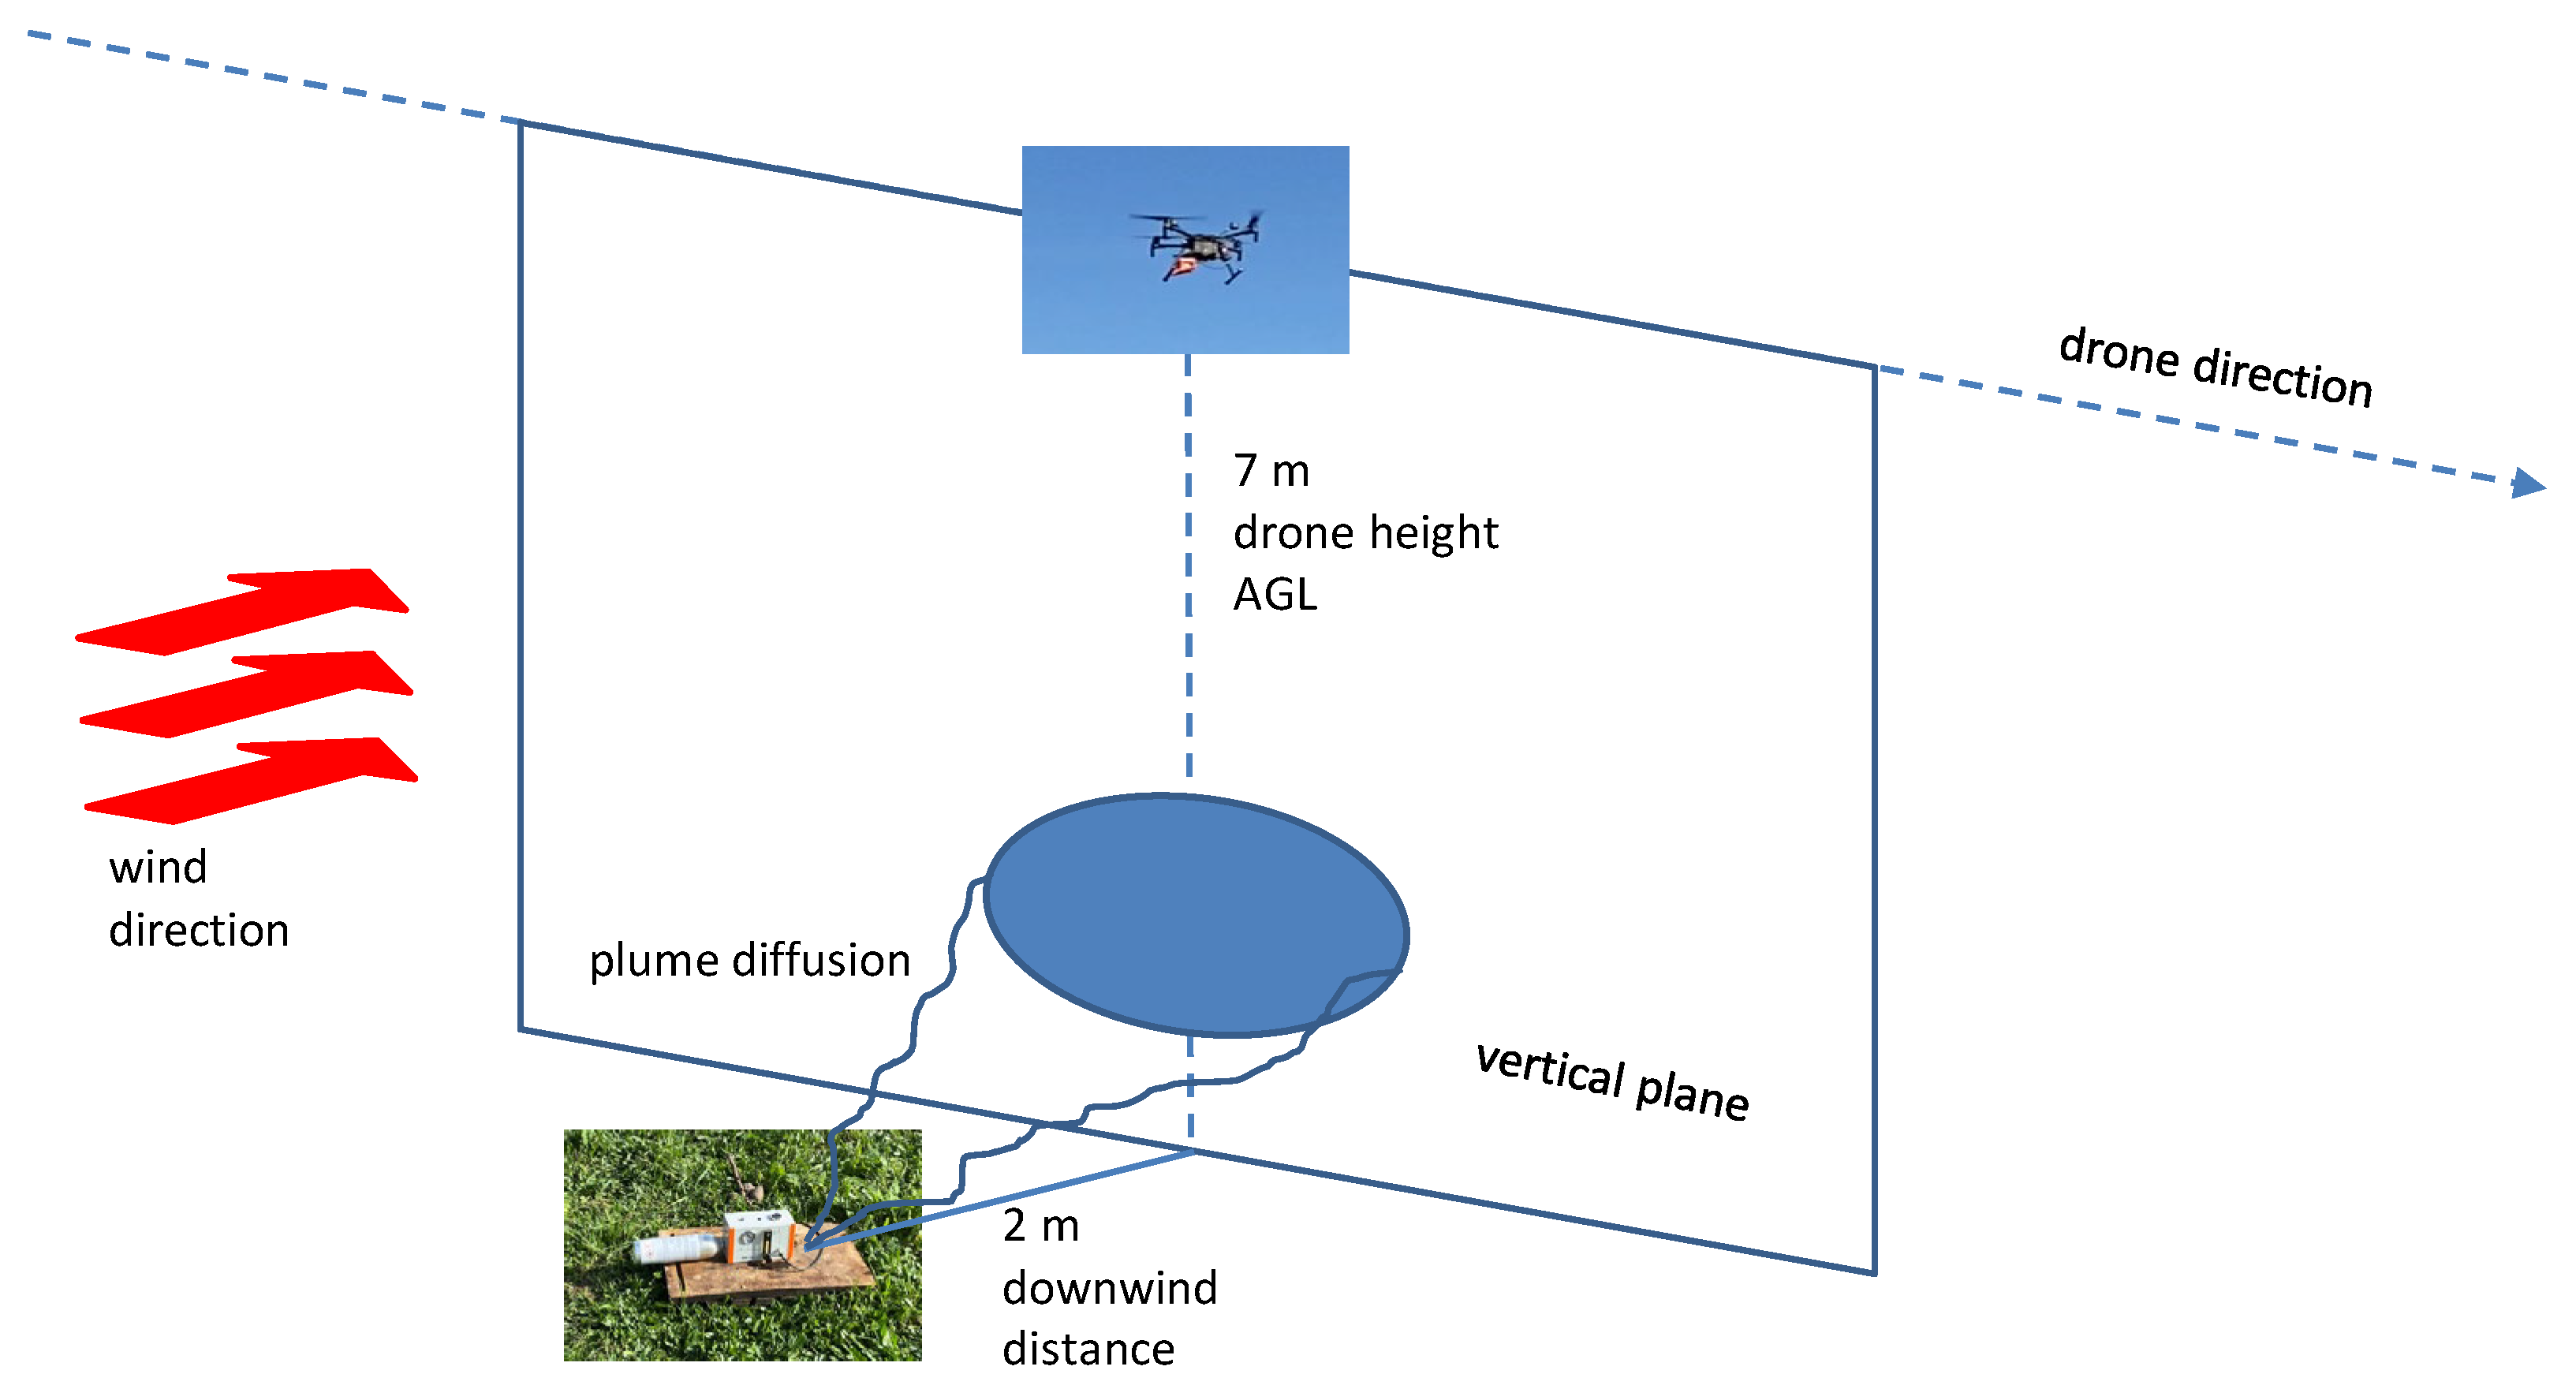
2.3. Controlled Methane Release Tests

In some of the field trials, a controlled methane release test was performed in order to verify if the use of a different level of background in estimating the methane flows emitted, as the specific conditions in which the measurement took place can lead to different results.
In this case the instrumentation used was characterized by a test set equipped with:
  • manometer (0–16 bar) for the display of the test gas can’s pressure;
  • adjustable flowmeter (0–80 Lh−1);
  • connection for all test gas cans.
A can containing 99.5% CH4 gas is connected to the test set.
Figure 2 shows the scheme used to carry out the controlled methane release test. The CH4 flow was kept at the maximum possible for the flowmeter used, i.e., at 80 Lh−1 (~3 standard cubic feet per hour—SCFH), while the flight was carried out downwind at a height of 7 m AGL and at a horizontal distance from the release point of 2 m; the UAV speed was 1 ms−1 and the data acquisition frequency set to 10 Hz (this gives a spatial resolution of 0.1 m).
The controlled methane release tests were conducted at a single flow rate; this flow can be low but in many cases it can be compared to the fugitive emission of biogas from the collar of a capture well in a waste landfill. The choice of a low rate lies in verifying the functioning of the detection system when operating close to the measurement limit of the instrumentation.
Once collected, data were analyzed in the post-processing phase according to the following scheme:
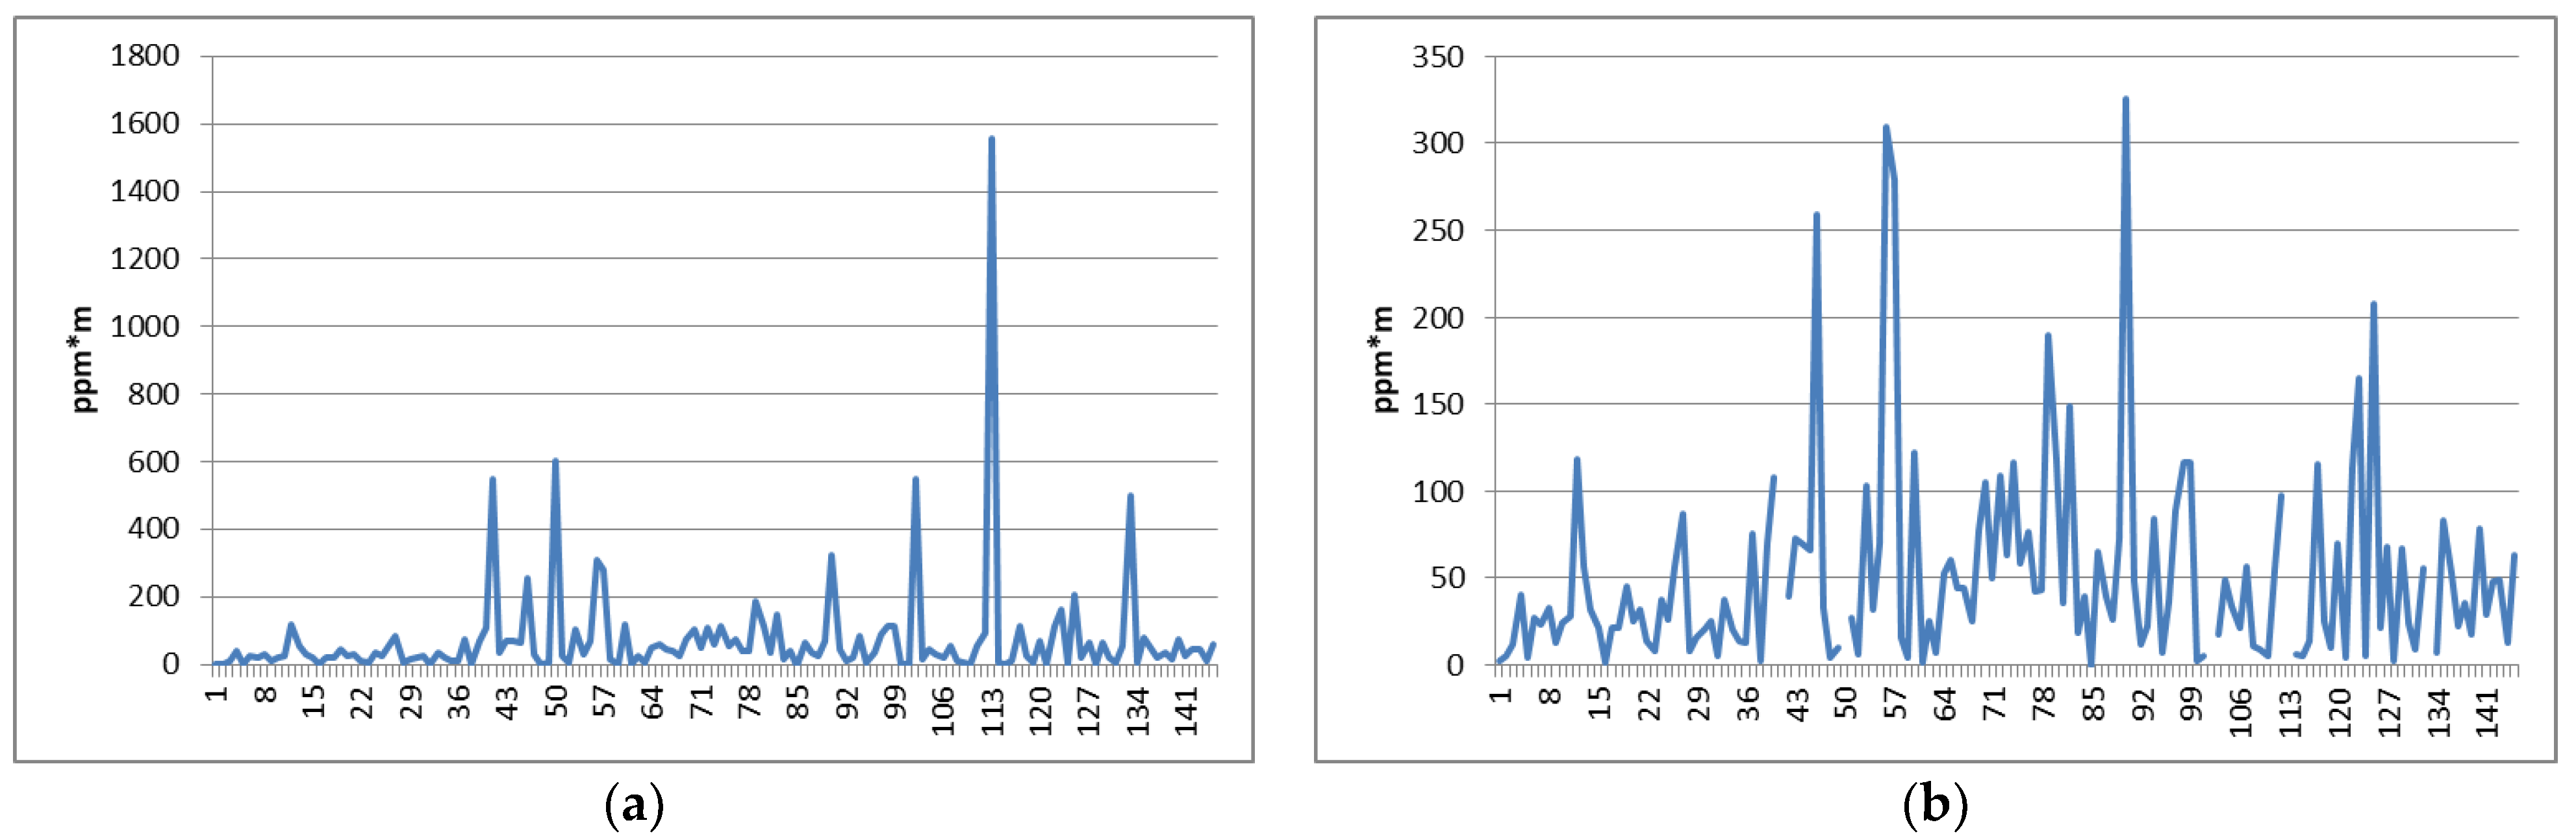
  • basic statistics of the data collected during drone flights as a function of the flight characteristics;
  • application of specific functions or algorithms for correcting false positives;
  • analysis of the differences found in the various cases.

3. Results

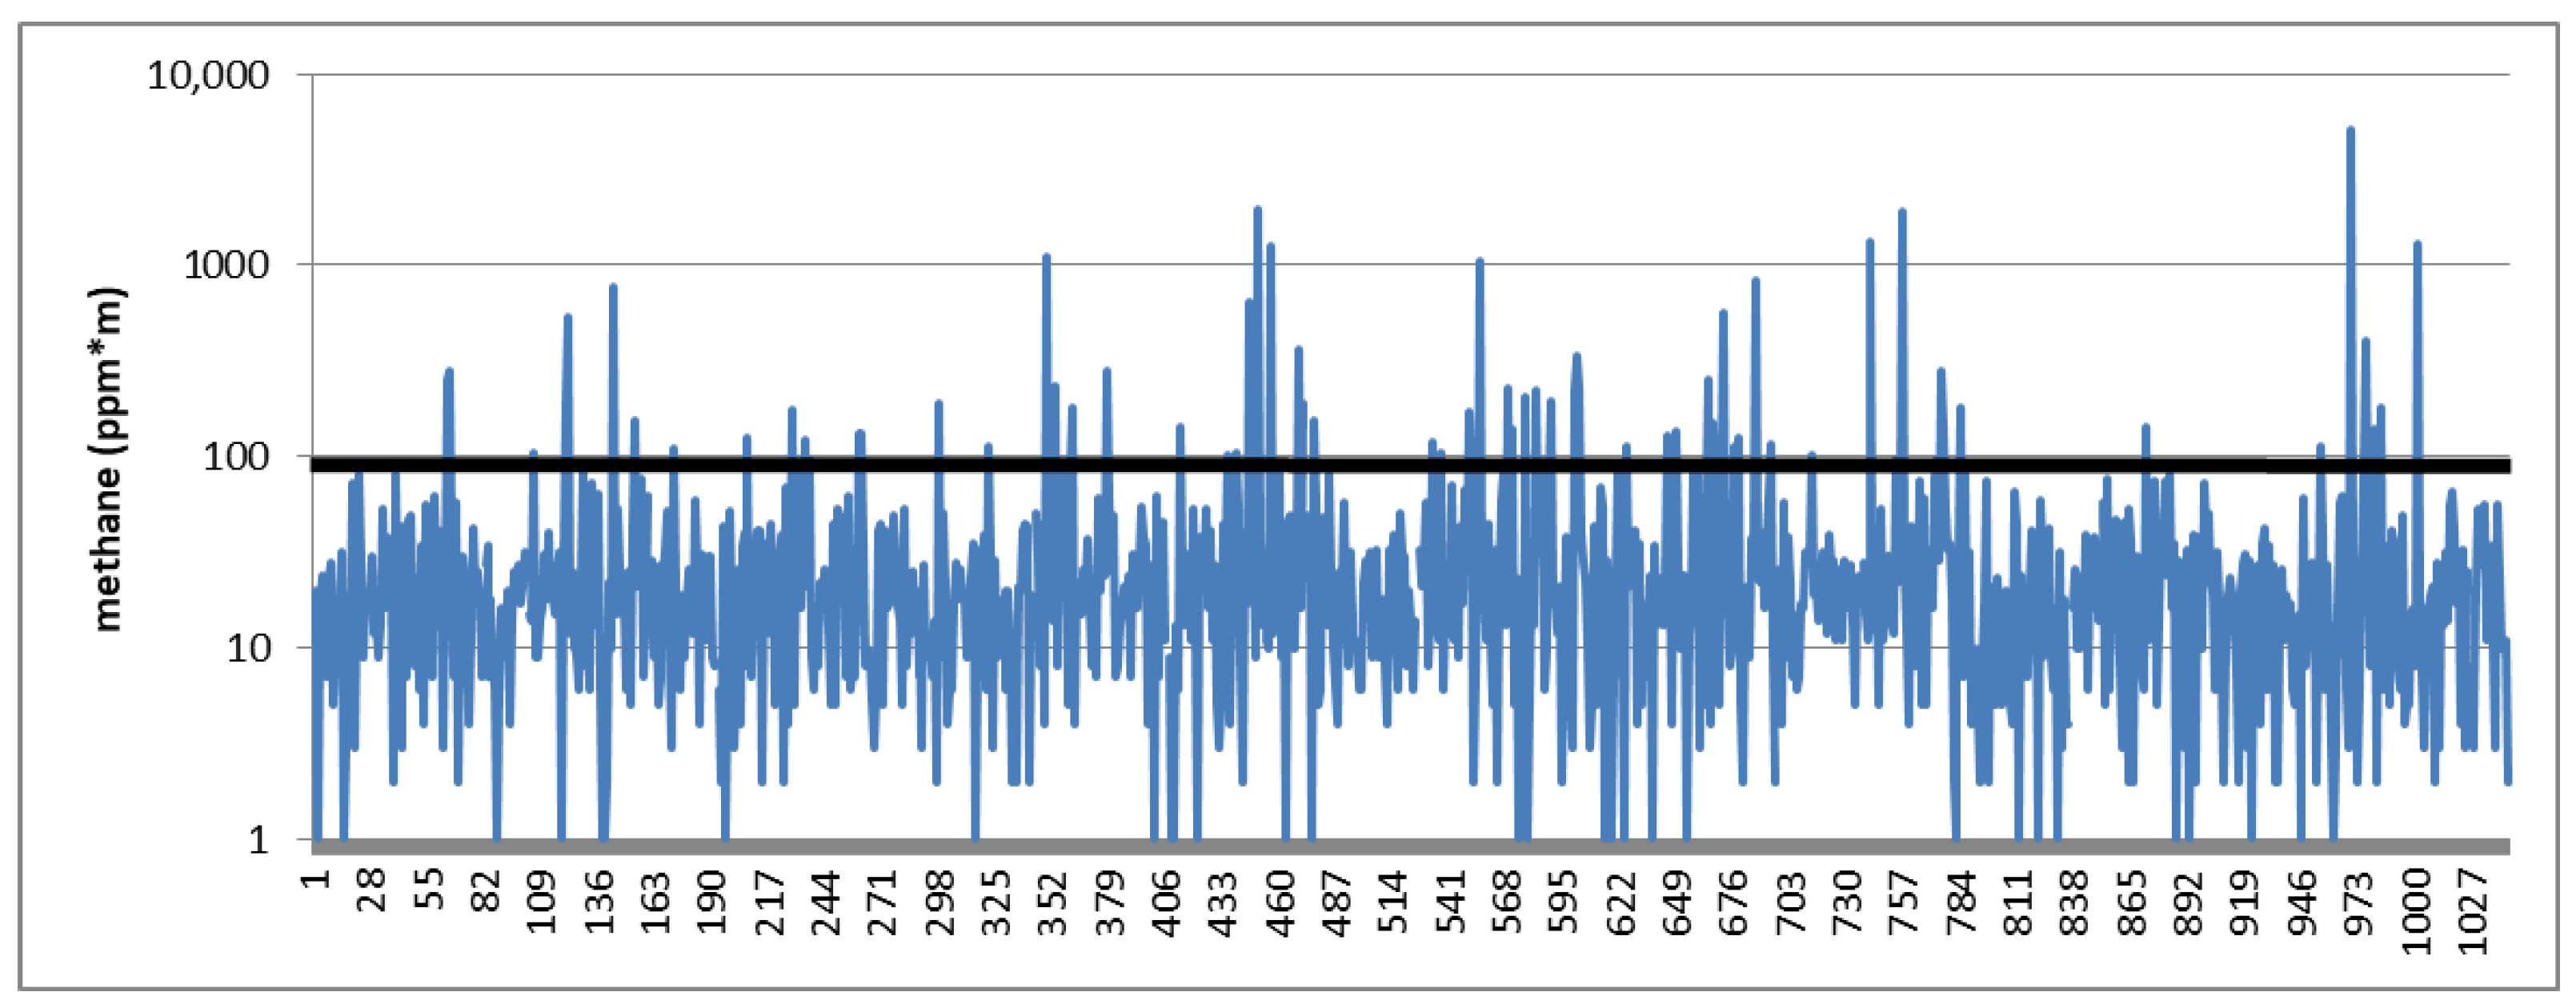
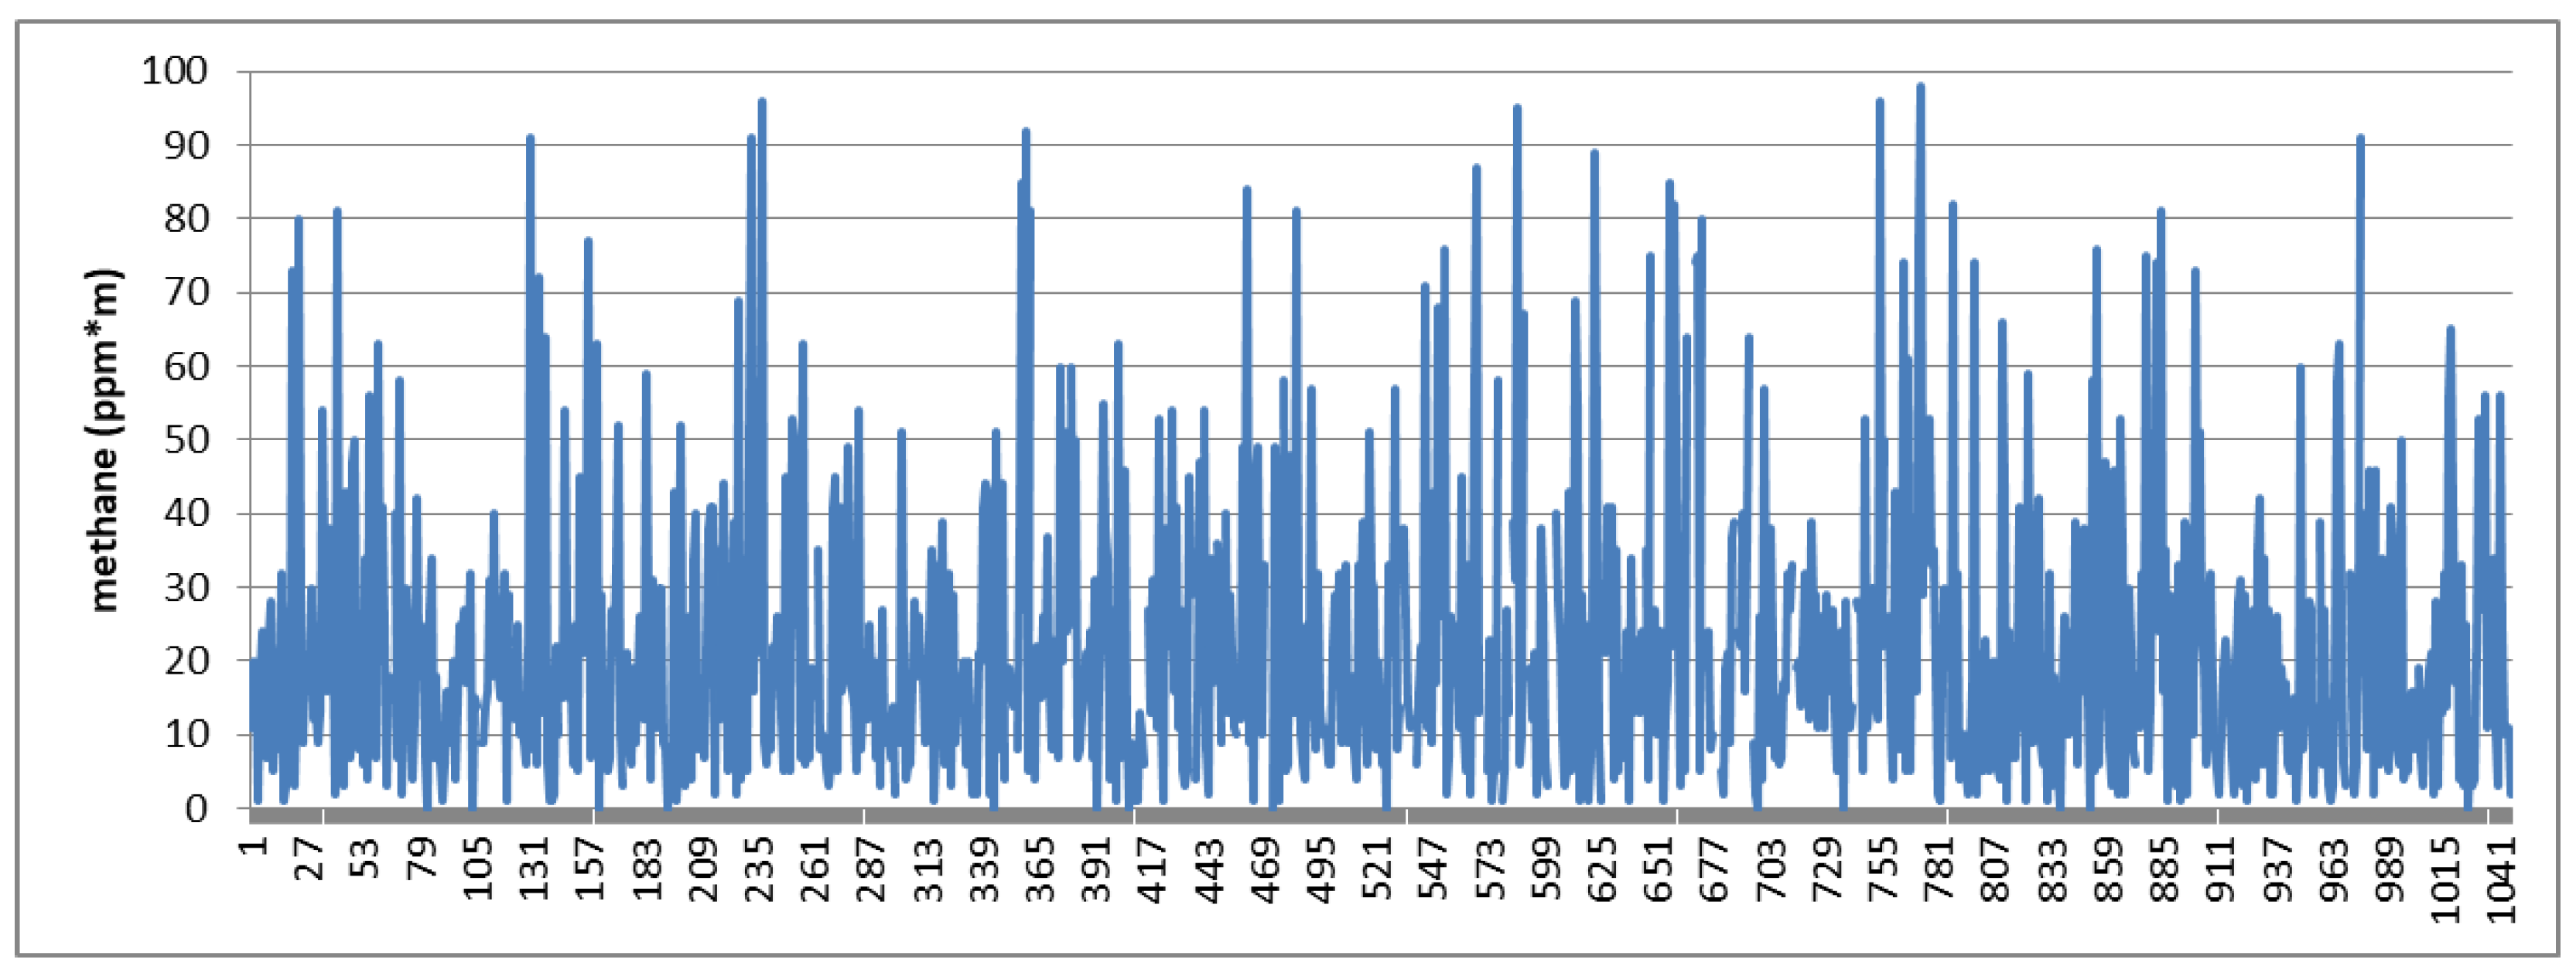
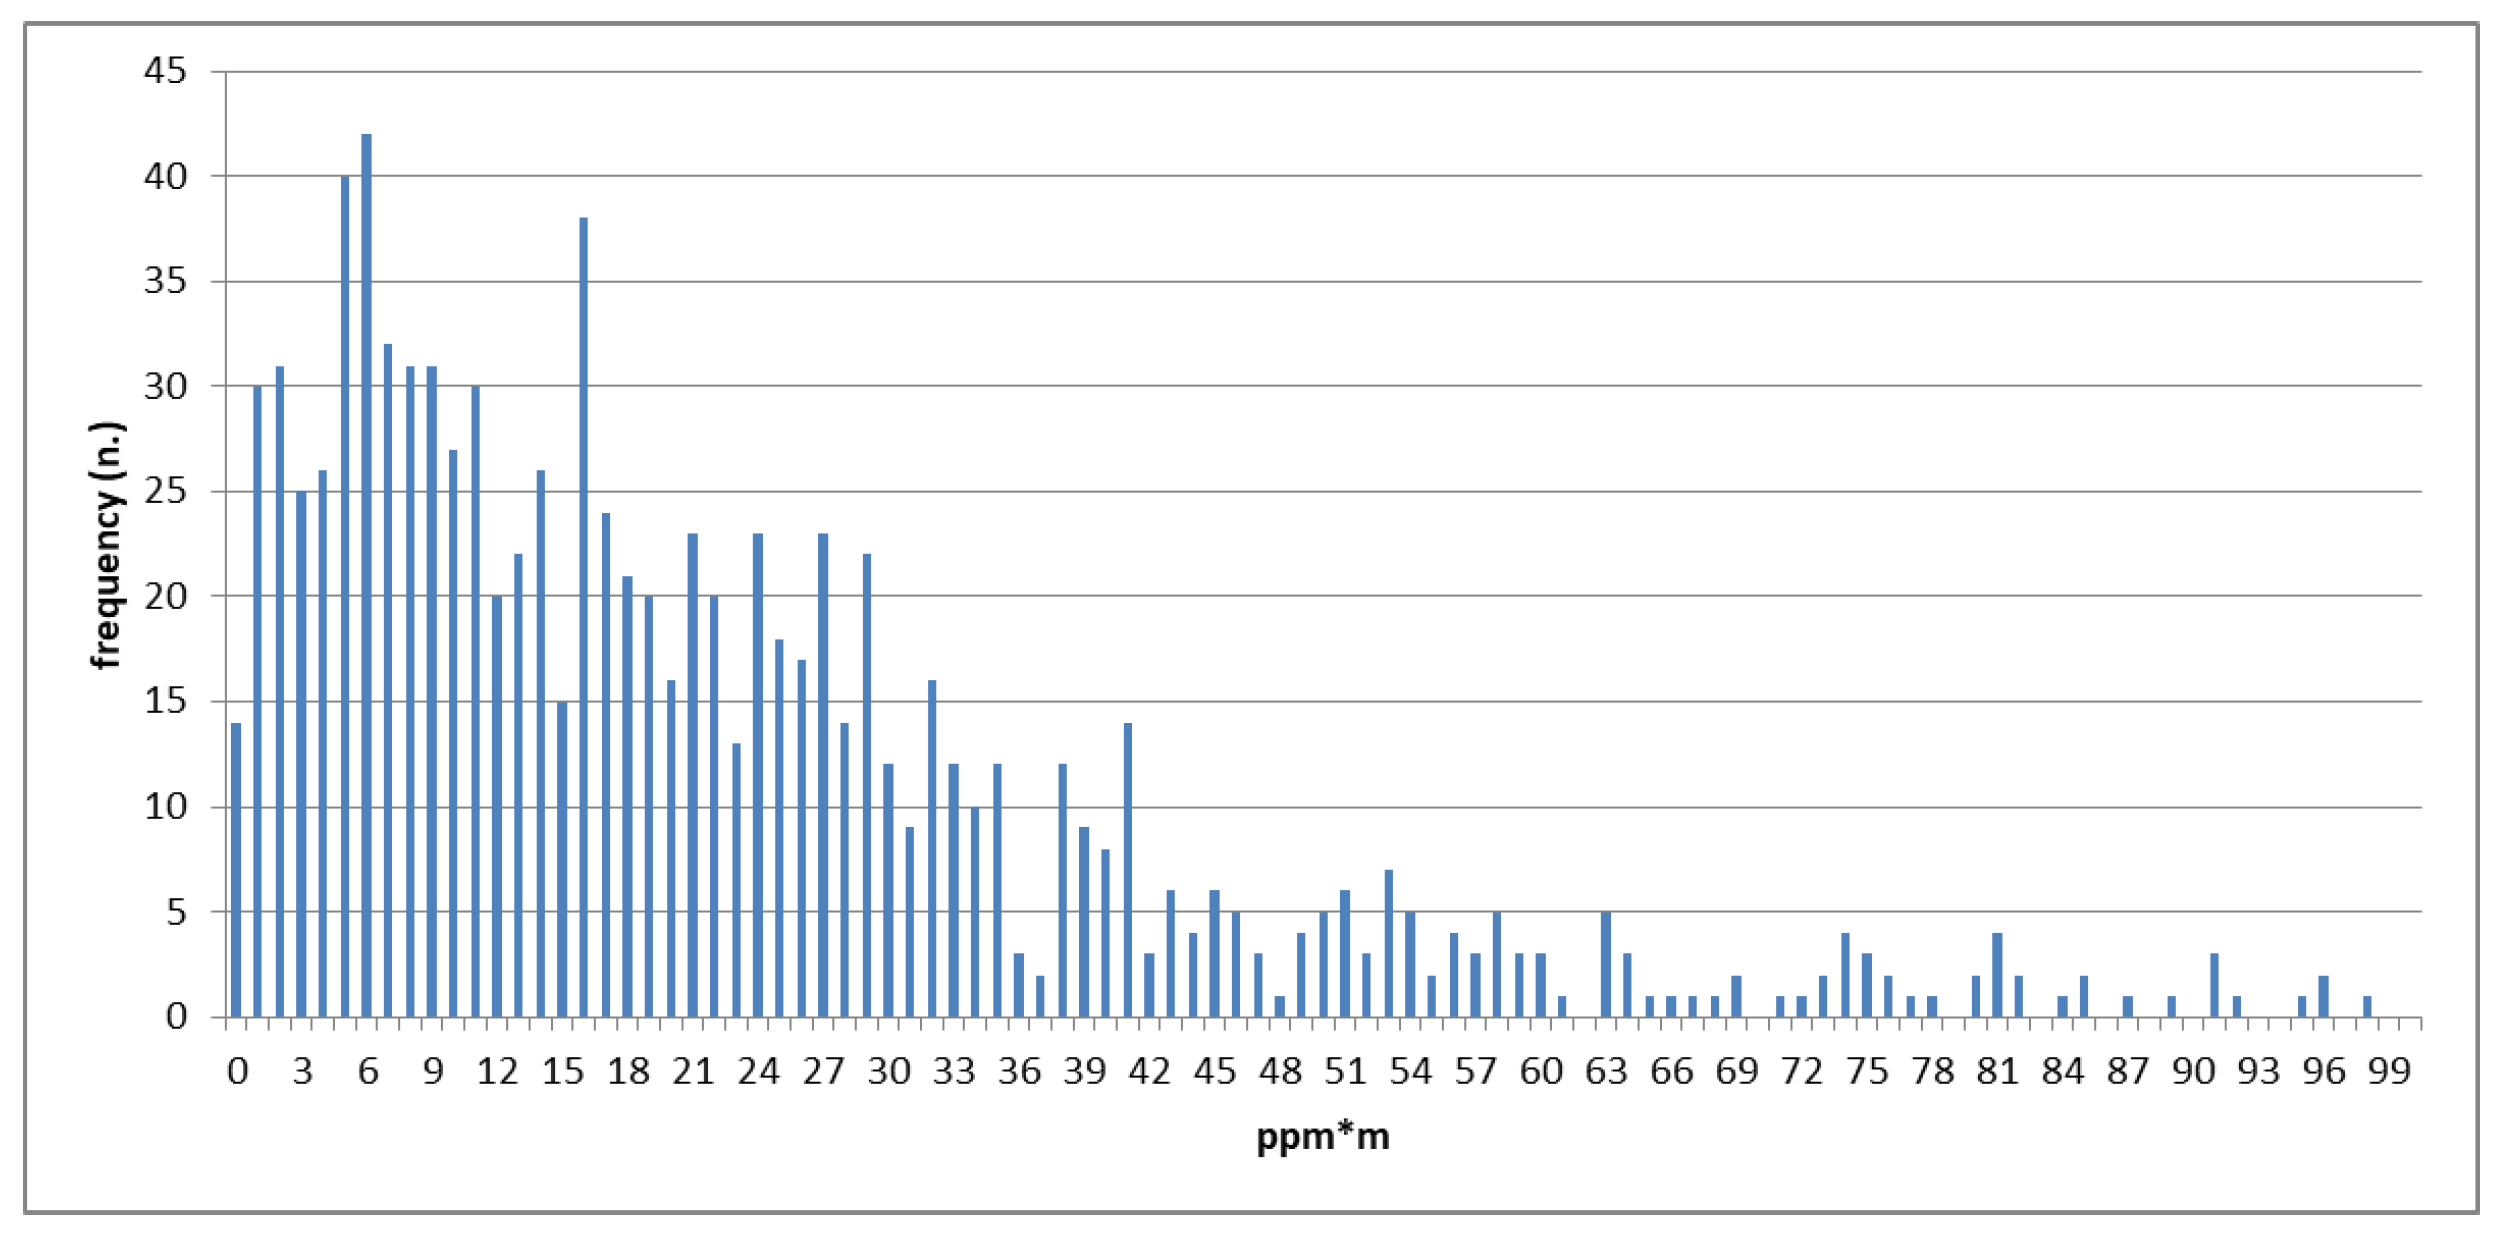
3.1. Results and Elaborations of a Specific Survey

The rationale used for planning the surveys was to carry out the flights in different seasons, repeat them on different days or at different times of the same day, and repeat them on the same day flying over different surfaces, similar to those found in landfill or gas sites. This type of approach allows us to isolate individual parameters, all other conditions being equal; for example, it is possible to compare flights carried out at the same speed and at the same altitude with similar meteorological conditions on the same surface but carried out at a different time on the same day to check whether this factor can lead to a variation in the results and in particular a different degree of measurement error. Table 1 reports the summary of the surveys carried out with an indication of the flight parameters, the atmospheric conditions present at the time of the survey, and the surfaces flown over. From the table we can see that the tests were carried out in different seasons. In the tests carried out in the campaigns following the first one, it was decided to repeat the flights only at the UAV speeds of 1 and 2 ms−1, as well as when hovering. This choice was derived from the analysis of the data obtained in the first tests, which are better explained below.
Various factors can affect the sensor’s ability to carry out a correct measurement and, therefore, in every test the presence of a certain number of outliers is found which must be eliminated with specific correction algorithms. It should be noted that some TDLAS sensors exhibit this behavior and, therefore, the problem of identifying outliers arises. In these cases, the application of a correction algorithm can be useful. Figure 3 reports the measurements on a logarithmic scale, in chronological order, of one of the flights carried out for background measurement at a height of 10 m AGL and at a drone speed of 2 ms−1 in Survey n. 1; the presence of several methane peaks can be noted, which certainly represent sensor reading errors which sometimes exceed 5000 ppm*m.
The main reason for the generation of false positive measurements lies in the scanning of non-homogeneous surfaces: the detector moves on a horizontal line where the continuous change in the reflectance of the target surface can cause errors in the backscatter beam reading. This error is amplified by the presence of sunlight. Even sudden correction movements of the drone oscillations in the air, due to strong winds, produce the same effect. These topics will be further addressed in the Discussion section.
For the purposes of subsequent analyses, incorrect readings must be identified and deleted; to this end, a procedure was adopted which in an iterative process uses a threshold of 2σ above the mean to eliminate false positives [27]. The black line in Figure 3 represents the threshold above which the values are considered outliers (98 ppm*m).
In the case examined previously, the acceptable measurements representing the background become those shown in Figure 4, where the high peaks are no longer present.
This procedure appears to be the most effective in eliminating an adequate number of outliers, compared to other tested procedures, in the case of measurements carried out with a TDLAS sensor; in fact, although, as shown in Figure 5, the frequency of the values cannot be perfectly assimilated to a Gaussian curve and the skewness is actually equal to 1.44, at the same time the algorithm used allows balancing of the need to eliminate an adequate number of outliers with that of not reducing the background value too much which would lead to the creation of a large number of false positives in the next steps of the analysis.

3.2. Basic Statistics of the Tests Carried Out

Figure 6 shows the processed methane background data measured in the various tests performed in the suburban area; the figure shows for each test the mean and standard deviation of the concentrations detected during the survey. The parameters that vary are the flight altitude and the drone speed as well as the time of execution of the survey and the type of surface flown over. It can be noted that in many cases the standard deviation exceeds the mean, indicative of a strong variability of the measurements due to the presence of many outliers.
Figure 7 shows the reprocessed results applying the developed correction algorithm; it can be noted, in general, that all indicators are reduced with the consequent reduction in variability.
Table 2 reports the basic statistics of the data collected during the flights undertaken in the field trials carried out in the suburban area at a speed of 1 ms−1. The indicators show that there is a strong variability in the measurements with very high values of both the coefficient of variability and the skewness. A study [28] indicates that the skewness is a promising indicator to clarify the zero-leak cases and positive leak cases. In their tests they calculated that all zero-leak cases have skewness values less than 0.5 while all of the positive leak cases tend to have larger skewness with values above 0.5. In our case, despite being in the presence of a situation of zero-leak cases, the skewness values are all higher than 0.5 in the initial registration, therefore highlighting the presence of measurement errors. The table also shows the results after the application of the iterative algorithm based on the 2σ threshold of measured observations. Indicators decrease, with the elimination of more than 5% of outliers in some cases.
With the application of this first threshold, the skewness does not reach 0.5, highlighting that for the calculation of the correct background level the iterative process of reducing the 2σ threshold should be repeated further until the skewness of 0.5 is reached; this involves the elimination of a greater percentage of false positives when estimating the background.
However, the identification of a lower threshold of the background level becomes problematic in the subsequent phase of the search for methane leaks because many false positive values can be mistaken for real leaks. In this specific case, it was decided to maintain a higher background level to avoid the risk of incurring false readings of methane releases, as also underlined in [27].
It is beyond the scope of this work to demonstrate the effectiveness of various algorithms in background estimation and methane leak detection. Anyway, this issue highlighted that the search for the right combination of instrument noise and flight elevation is a difficult exercise for this system and that we must accept the presence of some false positives in the estimation of background to avoid obtaining false positives in the subsequent scan of a landfill or natural gas plant [24].
Starting from corrected values it is possible to obtain the calibration curves of the methane background as a function of the flight height, as represented in Figure 8 referring to Survey n. 1. This operation is necessary in data post-processing when the survey is conducted on non-homogeneous surfaces and a terrain-following system, that allows maintaining a constant height of the drone from the ground, was not available. This is the case of the lateral slopes of a waste landfill. In the case of the tests carried out, the mounted terrain-following system came into conflict with the data acquisition and storage system; it was therefore decided to detach the altimeter and conduct the flight in manual mode. This choice did not significantly influence the results since the surfaces chosen to carry out the tests were all perfectly flat and once the flight altitude was reached we only had to worry about following a straight direction. This situation is difficult to find in the field and, therefore, very often it will be necessary to resort to manual flight. It also keeps obstacles more easily under control which frequently arise when flying at such low altitudes. In such cases, despite the pilot’s skill, with a drone flying hundreds of meters away from it and with the effects of perspective, it will be very difficult to maintain a constant altitude above the ground and, therefore, it will be necessary in the data post-processing phase to calculate the right background level based on the height to which the individual datapoints refer. To this end, it is necessary to build the calibration curves as represented in Figure 8; the curves present a correlation coefficient in many cases almost equal to 1, demonstrating an excellent level of approximation.
Figure 9 and Figure 10 show the methane background indicators referring to the tests performed in the AA and IA, respectively. As already reported, in the tests carried out in the campaigns following the first one, it was decided to repeat the flights only at the UAV speeds of 1 and 2 ms−1, as well as when hovering. This choice was derived from the analysis of the data obtained in the first tests.
Even for these tests the indicators shown lead to high coefficients of variability. In particular, the tests conducted in the AA were carried out in the presence of strong winds (4.0–4.2 ms−1). The effect of the sustained wind on the oscillations of the drone and on the movement of the stems of the wheat plants produced average concentration results significantly higher than in all the other tests, with values even 5 times higher than the tests conducted in the SA at the same UAV heights and speed. For example, as can be seen from the figures, the flight performed at 7 m AGL at a speed of 1 ms−1 reports an average concentration of methane in the column equal to 84.4 ppm*m in the AA and 26.2 ppm*m in the SA. This implies the presence of an even higher number of outliers in the first case compared to the second.

3.3. Controlled Methane Release Tests Results

As reported in the Materials and Methods, in some of the field trials, a controlled methane release test was conducted to verify how the data appear in the presence of different background conditions and proceed, where possible, to estimate the methane flow.
Figure 11 and Figure 12 show the results of the tests performed in the SA and AA, respectively. Two tests were chosen and carried out in very different conditions. The SA test was carried out flying over short grass in winter with moderate winds and clear skies; in the AA test, however, performed in spring, we flew over tall vegetation in the presence of consistent wind with clear or slightly cloudy skies.
Figure 11 shows how the methane peak is easily recognizable, taking on a basically Gaussian shape, with values that exceed the background level. By applying a methane flow estimation model to the data collected based on the mass balance [29] we arrive at an estimated flow of 68.7 Lh−1 equal to 86% of the actual flow.
Figure 12a shows the raw data collected during the AA flight: in this case there are various measurement peaks but it is not possible to recognize the typical trend of methane emission.
By applying a detection algorithm which includes the background threshold obtained through the correction algorithm (Figure 12b) many peaks are eliminated but the release remains within the background; the emission zone should be approximately between points n. 69 and 88 but is indistinguishable from the rest of the data. In this case the calculated methane flow is zero. The air turbulence and the movement of the wheat plant stems have generated a very high background level which does not allow us to appreciate the presence of methane emission (in the presence of a low flow).
Alternatively, it is possible to reduce the background threshold to a more realistic level, proceeding to correct the sigma value obtained in the preliminary background survey with more iterations and eliminating a greater number of outliers, proceeding until the residual data show a skewness of 0.5. In this specific case, the background value is reduced from 101 to 63 ppm*m. Figure 13 shows the values, after subtracting the background, validated by the detection algorithm as methane emissions. The rectangle represented in the figure corresponds to the actual release but, having reduced the background threshold, some false positives are also validated by the algorithm.
By applying the methane flow estimation model we arrive at an estimated flow of 131.7 Lh−1 equivalent to a 65% overestimation of the actual flow. The area corresponding to the actual emission is equivalent to a flow of 60.4 Lh−1.
In conclusion, depending on the background level used, the same methane release rate in the first case is confused with the background while in the other one it is recognizable and evaluable although it also involves the validation of false positives. This is the system-balancing issue highlighted in the previous section.
This problem arose due to the environmental conditions in which the detection of both the background and the controlled methane release tests were carried out, in the presence of a low emission flow.
This confirms how important it is to know the right conditions in which to carry out the detections, especially in the case in which one wants to discover leaks at low flows, and how much the identified background threshold can influence the results.

4. Discussion

In the previous section, the representative indicators of the methane background measured through a TDLAS sensor mounted on a UAV in various trials carried out in variable conditions were illustrated.
The following observations can be deduced from the graphs shown.
-
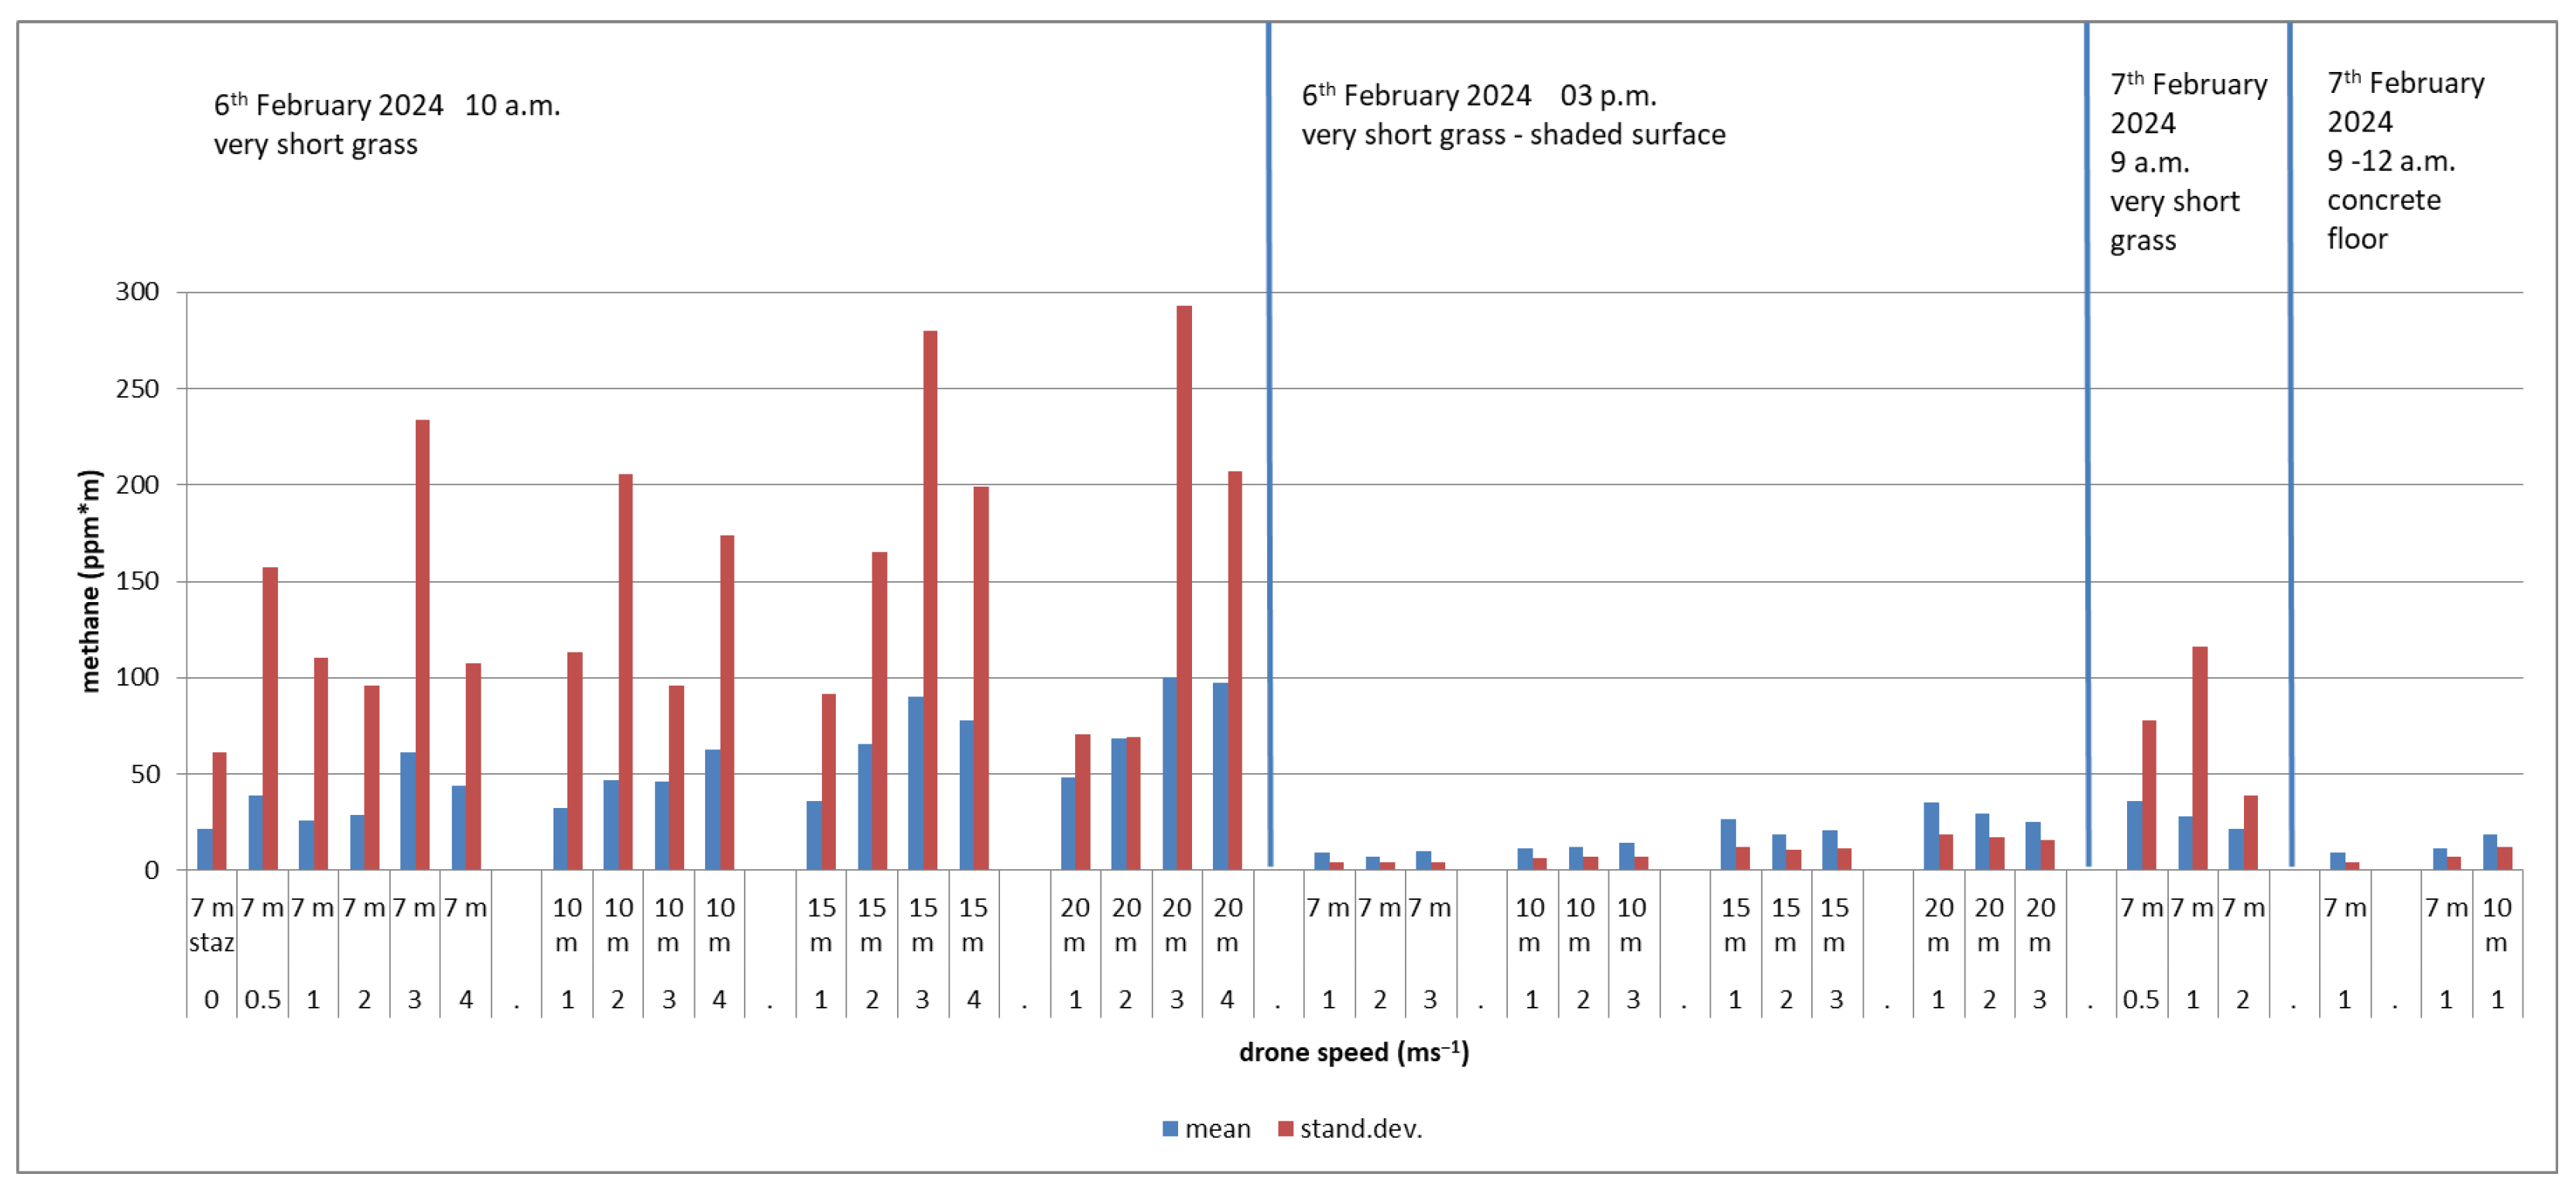
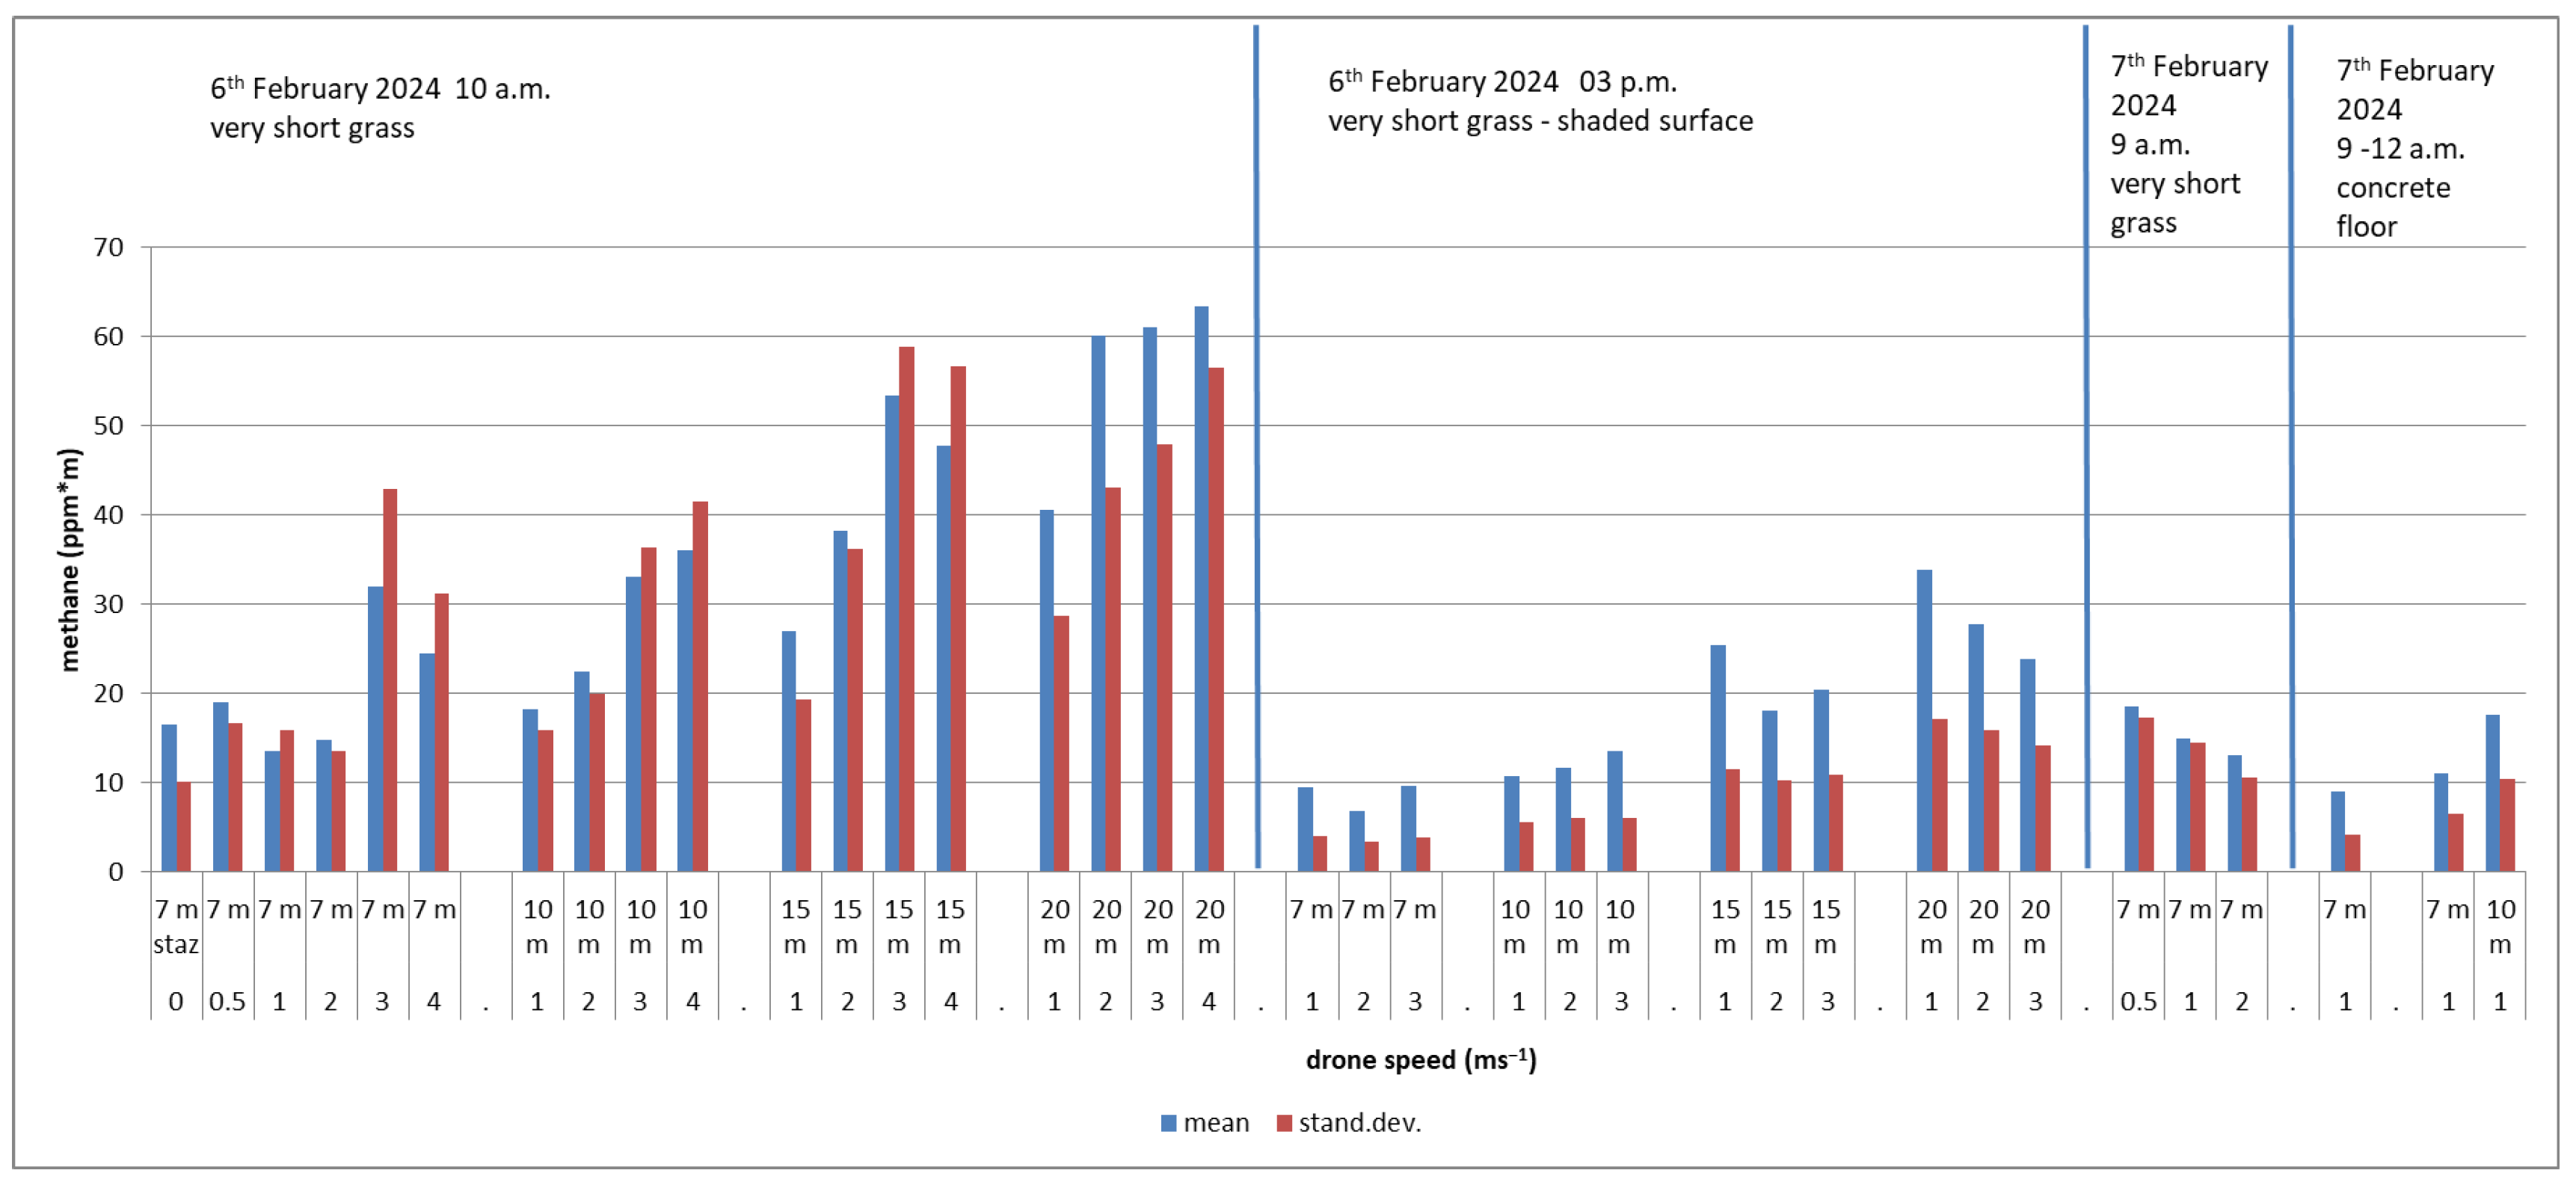
Flight heights: flights at a height of 20 m AGL produce background values up to three times those found at a height of 7 or 10 m AGL; at higher heights the situation worsens further; it can be deduced that the best flight heights, using the TDLAS sensor, are between 7 and 10 m AGL.
-
UAV speed: higher speeds correspond to greater variability of the background measurements; the same result is obtained by flying very slowly (0.5 ms−1); the lowest background values are found at speeds of 1 and 2 ms−1.
-
Hovering flight: the values found in stationary flight are in line with those recorded at speeds of 1 and 2 ms−1 at the various heights; no advantage is observed in terms of lower background while remaining still when hovering at individual monitoring points.
-
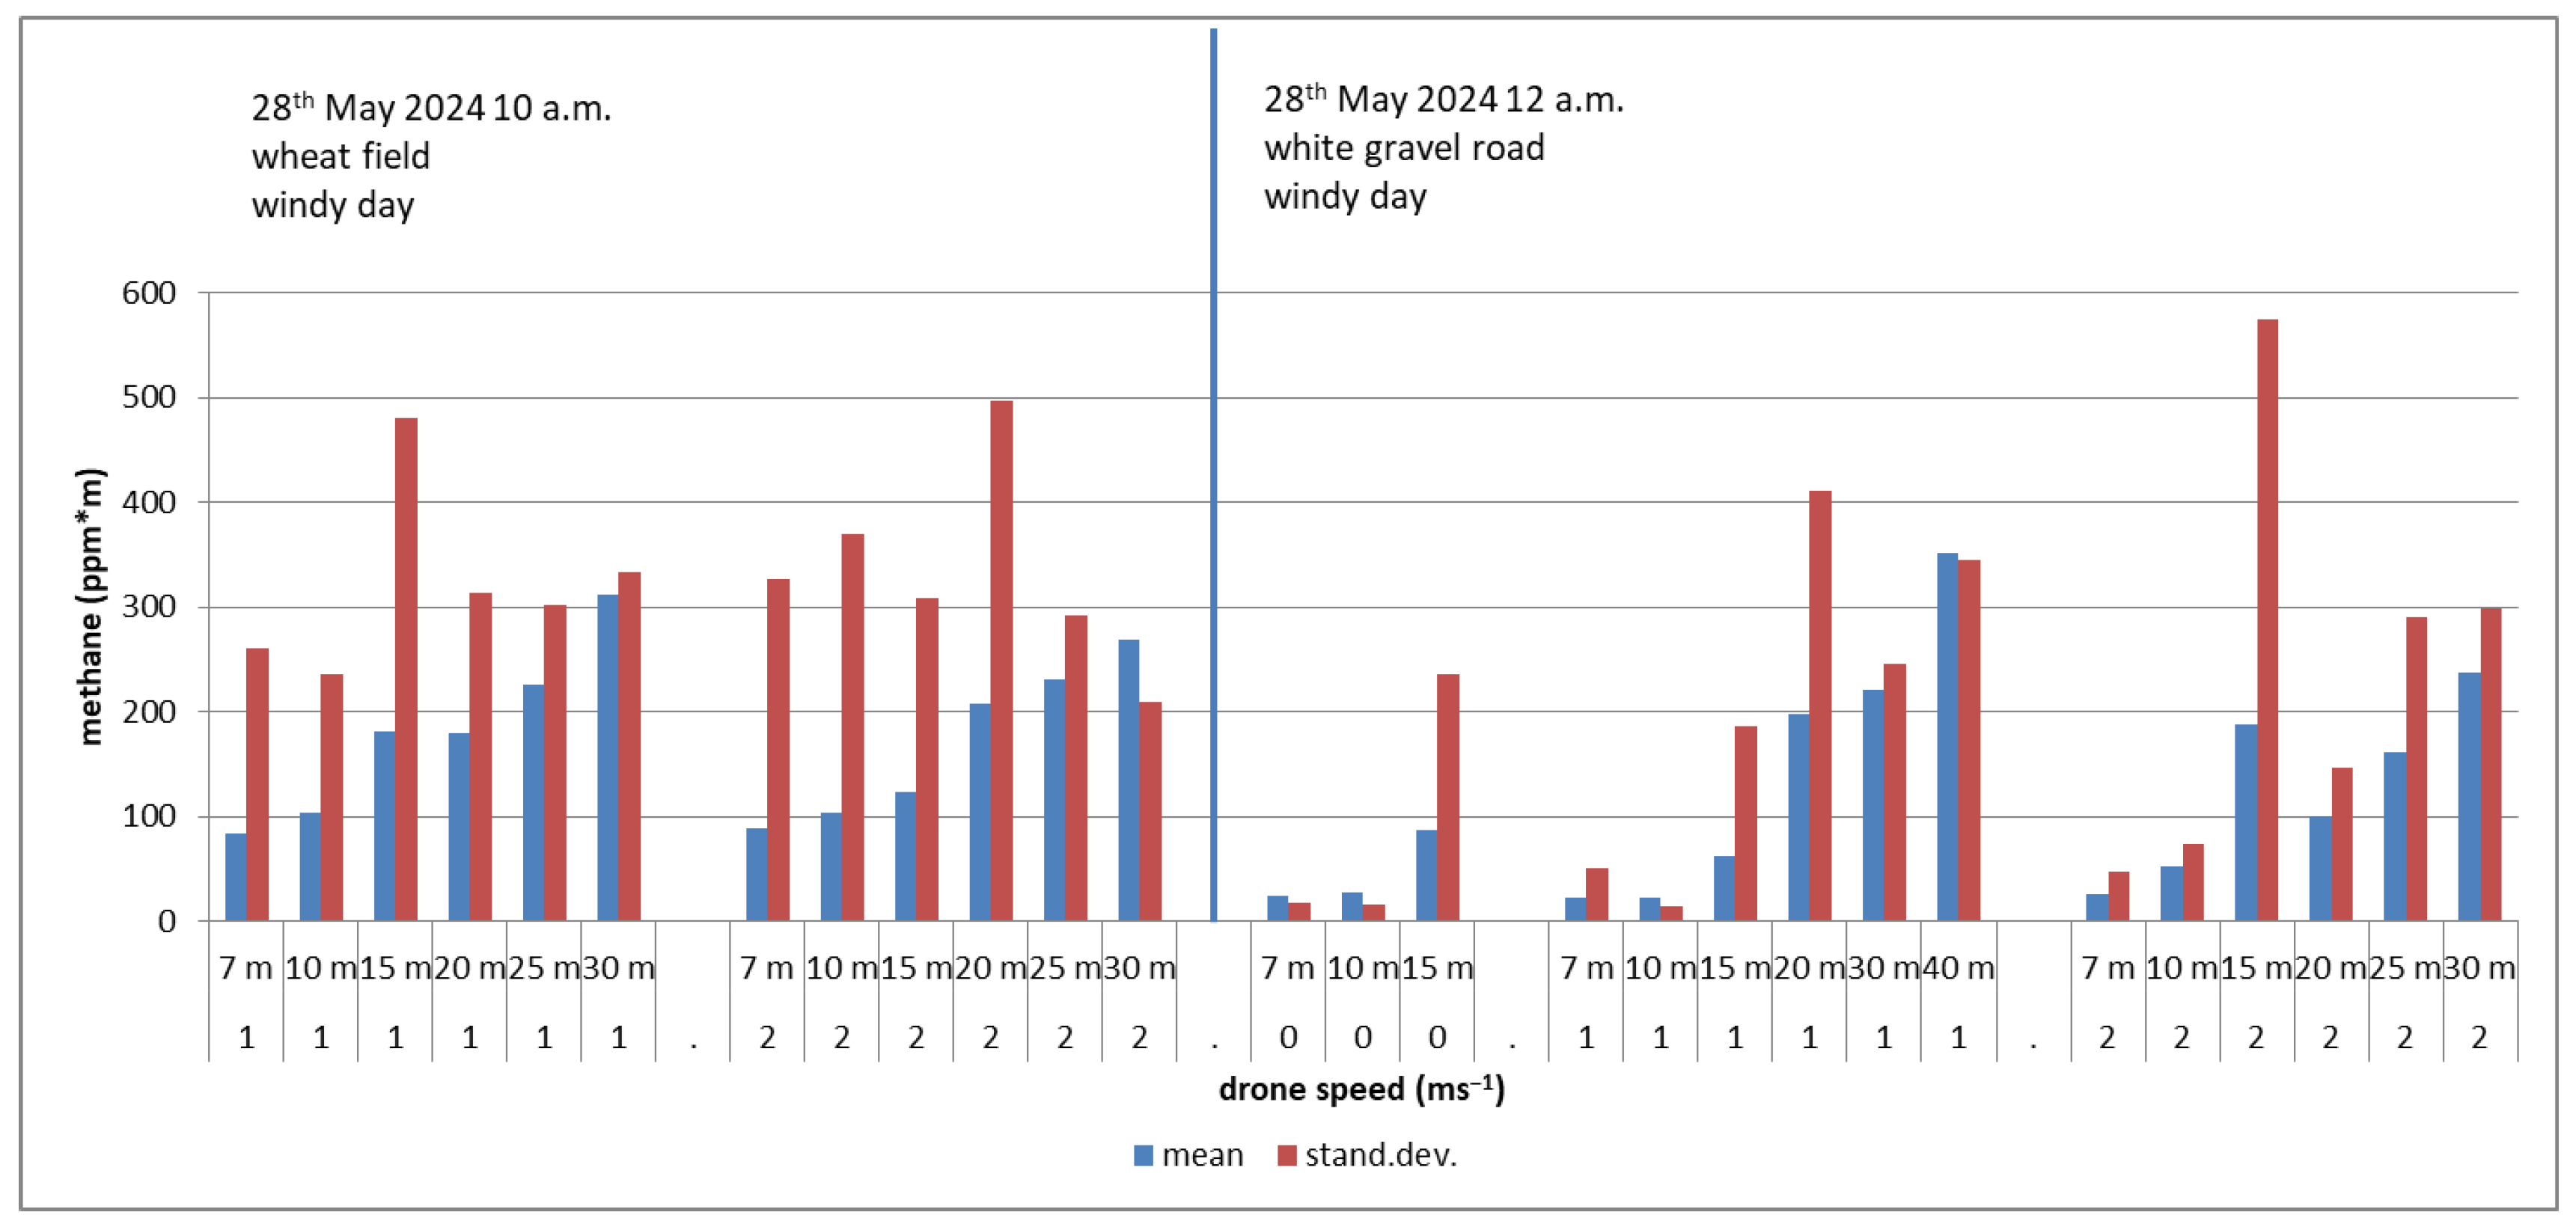
Surfaces flown over: homogeneous surfaces such as those represented by concrete floors or gravel roads return lower background values compared to more discontinuous surfaces such as those made up of grass, all other conditions being equal. This can be seen by comparing the flights at 7 m AGL and at a speed of 1 ms−1 in Survey n. 3 and 4 in SA, where a 60% lower average concentration was recorded in flights performed over concrete floors compared to flights over short grass; also in Survey n. 5 and 6 the same phenomenon is noted with values of flights carried out on white gravel reduced within a range of 50–78% compared to flights over tall vegetation (there is also a flight with very anomalous values carried out over a white gravel road at a height of 15 m AGL, most likely due to the strong oscillations of the drone to counterbalance the strong wind gusts).
-
Repeated flights in the same atmospheric conditions at approximately the same time: similar background values with a variation of ±10% are shown.
-
Wind speed: this does not significantly influence the variation of average background concentrations for winds up to approximately 3 ms−1; with more intense winds, over 4 ms−1, even in the presence of gusts, the drone is subject to greater oscillations that need to be corrected suddenly, which very often cause false positive readings. Furthermore, if the surface flown over is covered by a layer of grass, it happens that with more intense winds the stems of the plants sway more, generating greater difficulty in interpreting the laser beam backscatter by the sensor, with consequent measurement errors.
-
Reflectance of surfaces in the presence of sunlight: a critical feature of the drone–TDLAS system is represented by the continuous change in the reflectance of the targeted surface from which the backscatter signal is received in a mobile system. This criticality is amplified in the presence of sunlight; this appears clear in the comparison between the results of Survey n. 2 compared to n. 1. In fact, Survey n. 2 simply constitutes a repetition of Survey n. 1 performed on the same surface at a different time; in the afternoon the surface flown over was in the shade compared to the morning, as can be seen in Figure 1b, and the average concentrations are all much lower than those recorded in the morning in the presence of direct sunlight on the surface on which the laser is fired. The same results are achieved by simply “obscuring” direct sunlight with clouds. Survey n. 7 and 8 were carried out on different days, the first one was completely sunny while on the second day the sky was entirely overcast. The effect obtained is the same as the previous case: the average methane background concentrations are all 31 to 46% lower in the presence of overcast skies, despite there also being a higher wind intensity.
The results obtained are often in line with the considerations made in other studies in the literature. Regarding the ideal flight height using a TDLAS sensor, set at 7–10 m AGL, these data are confirmed in various studies.
In a study [28] the authors use a TDLAS sensor to model natural gas fugitive leaks according to a mass balance approach. In the field tests, they found that the intended survey altitude is around 10 m, at which height the signal of the background level CH4 is relatively stable and low. The influence of the background CH4 signal increases noticeably with flight altitude above 10 m.
In another study [30] the authors, who deal with the flight mission design for the search for fugitive methane leaks using a TDLAS sensor, found that the altitude required for detection (depending on atmospheric stability) may be quite low (10 m range).
A study [31], again carried out with the use of a TDLAS sensor, reports that the variance in the gas measurements increases as the measuring height increases, corresponding to the expected decrease in the intensity of the received laser beam.
It is important to note that by flying at this height near the point source of methane emission the survey manages to capture the entire plume. In fact, many plumes do not lift high above the surface if released at ambient temperature [32,33]. Further, the vertical pattern of typical concentration enhancements in plumes, as evidenced by models such as the Gaussian plume model, suggests that detection at higher elevations is less probable. This consideration is also confirmed by [24,30] in which the authors found that a curve depicted in the fraction detected versus altitude plot shows a dramatic cut-off at 10 m. Conservatively, the plume rise can be neglected and the minimum height can be set to the lowest possible altitude safely attainable, 10 m in this case.
In another study [34], for the vertical plane flight tracks, the UAV was flown at a maximum altitude of 7 m to increase the signal-to-noise ratio of the mapping. The authors found that there was a large variation in CH4 concentrations up to a height of about 7–8 m, with background concentrations at higher altitudes. This justifies the selected maximum altitude used in their vertical cross-sections, indicating that the cross-sections of about 7–8 m capture the total emission from the enclosed area.
Furthermore, flying at low altitude could cause the down-washing effect of the propellers and alter the flow. However, a study [35] examined flow disturbances around a small rotary platform using measurements and a CFD model and concluded that this may require up to 2.5 times the rotor diameter to ensure flow invariance.
Regarding the UAV speed, a study [36] indicates that the speed of the vehicle and temporal speed of the sensor control the spatial resolution of measurements, influencing detection probability. Insufficient sampling speed or excessively fast vehicle travel can miss plumes. As such, laboratory tests can easily be misrepresentative and field testing is required [24]. In a study [34] the UAV was flown manually, at a set speed of 1 ms−1 for precision flight, to safely avoid obstacles and to map CH4 at a high spatial resolution. In another study [26] velocity on horizontal transects was typically around 2 ms−1.
Studies described in [28,31] found variability in the background measurement due to the signal returning from the ground suffering interference in the reflectance, which was dependent on the moving system. A study [31] investigated the reflectivity properties of different surfaces typical for landfills (bright sand, dark sand, and vegetation) at different measuring distances (10, 15, and 20 m).
The wind speed values illustrated in the present study are also in line with those of other studies. A study [24] found that there is a peak in detection probability with wind speeds ~2.5 ms−1. Stronger wind speeds may show lower detection probabilities as the plume may be less likely to mix upwards in daytime conditions. In another study [28] a good wind condition is defined as both a wind speed that is greater than 2.3 ms−1 and steady wind direction, of which the standard deviation is smaller than 33.1 degrees, whereas a bad wind condition does not meet one or both criteria.
In conclusion, the trials carried out made it possible to characterize the controllable flight variables to identify for which values of them a better reading of the CH4 background is obtained and a lower number of false positives is produced. Furthermore, tests highlighted how non-controllable environmental variables influence background measurements and which situations are optimal.
As regards controlled methane release tests, it can be observed how important the measurement of the average background concentration is and how much this can influence the possibility of estimating the flow of methane released. The tests carried out demonstrate that it is essential to carry out the survey, not only at controlled UAV heights and speeds, but also in environmental conditions suitable for identifying methane emissions. Especially if the flow of methane released into the atmosphere is quite low, as in the tests performed with a release of around 3 SCFH, the ability to detect the methane leak lies largely in keeping the background level low and this certainly depends on complete knowledge of the ideal operating (controllable) and environmental (non-controllable) conditions.
In a study [28] it was found that the signal of elevated CH4 was more obvious in the larger leaks, and the influence of background noise was more crucial in small leak cases. In addition, the largest errors were associated with extremely small leak rates. In a study [37] the modeled system was found to reliably distinguish between cases with and without a methane release down to 2 SCFH (0.011 gs−1). On the contrary, in another study [24], since a fixed-wing long-range drone is used, the authors tested a range of leak rates that are high, generally within the “super-emitter” range: 5.35, 10.71, 16.06, 21.42, and 32.13 g·s−1. They did not test lower release rates as they knew from previous tests that the system would not detect the plume.
In other words, it is essential to adopt a strategy for choosing the best conditions in which to carry out the survey; therefore, it would be advisable to plan surveys when there are favorable weather conditions [26]. In the case of measurements made with a TDLAS sensor near a methane leak, these conditions are found on cloudy days with low solar insolation or in the early morning. Low wind speeds (1.5–3 ms−1) are preferable in a system like the one examined here.
Planning can also concern verifying the state of the places to be analyzed; for example, if a landfill covered by a layer of grass is analyzed it is preferable to intervene only when the grass has been cut and not when the vegetation is tall.
The illustrated tests, in fact, show that it was possible to estimate the methane flow (even if underestimated by 14%) in the case of low-vegetation surfaces and under favorable environmental conditions, which determined a low level of methane background. In the second test, the presence of an intense wind with associated gusts, over a surface characterized by tall plants, determined a high average concentration of methane background within which the actual gas release measurements were confused. Under these conditions it was difficult to estimate the flow of gas released and it is easier to obtain false positives. It is evident how measurement performance improvements can be realized by carefully determining the background CH4 concentrations [38].
Furthermore, the search for methane leaks using drones poses numerous operational challenges. Scanning large areas requires the availability of a significant number of batteries, given their limited autonomy; in addition, the possibility of recharging them on site is needed, but this is not always available in open areas far from the electrical grid. Survey planning should follow careful supervision of the locations to check if there are obstacles to flight, especially when flying at low altitudes as in this case. Flight limitations constitute an important constraint on operations (areas where flying is prohibited are widespread) and in this case it is possible to operate only in specific or standard scenarios that can affect the way in which the survey is carried out. Further limitations derive from the safety and security regulations required for the use of drones, such as privacy concerns. There is also the need for trained operators who are instructed on how to correctly carry out the survey in order to obtain useful measurements for subsequent post-processing.
Ultimately, the search for methane leaks using sensors mounted on drones requires, in addition to careful operational planning, a considerable effort in the implementation of estimation models and related measurement systems.

5. Conclusions

The reduction of emissions of global warming gases such as methane involves the right emissions measurement systems that allow us to acquire greater awareness of the problems.
In the present study, we conducted a field campaign aimed at verifying the parameters that influence the measurement of methane background using a drone-mounted TDLAS sensor. This measurement is crucial for both the localization of leaks and the correct quantification of the flow of methane emitted, once actually at a landfill site or natural gas infrastructure.
The results of the different field trials highlighted the best conditions under which to measure methane emissions with a TDLAS sensor in order to minimize the number of outliers: flight altitude not exceeding 15 m above ground level; the UAV speed appears to have less impact on the results, however, it is optimal between 1 and 2 ms−1; a very sunny day produces much higher methane background levels than a cloudy one. The type of surface also significantly affects the measurement of background noise. Finally, tests conducted with a controlled CH4 release highlighted that different levels of background have a significant impact on the estimation of the methane flux emitted.
The discussion of the main results, in comparison with what is already present in the literature, highlighted the importance of a precise definition of the parameters which can take on specific trends depending on the technology used. A survey for the identification of methane leaks with a TDLAS sensor must be performed in a very different way from the same survey performed with a quantum cascade analyzer. Therefore, every detail of the survey must be studied in depth to have perfect control. Among the crucial aspects for the success of a survey is the need for a stable background, possibly kept at low levels, in the order of 20 ppm*m. Not only do controllable factors have a significant impact on this success but atmospheric and environmental conditions also have a decisive influence, therefore, planning the survey with a strategy that also takes these aspects into account can be successful.
It must not be forgotten that the methane background measurements are part of a single system of platform, sensor, measurement, survey, processing, algorithm, and operator which must be designed in its entirety. From this perspective, future work will have to include the integration of these measurements into further algorithms for optimizing the estimation of methane flux. The estimation of the methane flux can be considered a multi-step exercise: the first step is represented by the definition of an algorithm for the estimation of the background and the correction of the outliers. Secondly, it is necessary to define an algorithm for the validation of the emission data of the field survey; this algorithm uses the background data previously defined. These processes must be integrated with each other in a coherent system. Also, the different methods of calculating the integrals in systems characterized by the presence of discontinuous measurements affect the results of the flux estimation and therefore it is necessary to look for the method that best adapts to the previous algorithms.
Finally, the present work aimed to verify how the measurement of the methane background influences the estimation of the methane flux in the presence of a low flow, using a single flow rate. As a further future work it would be necessary to verify this influence in the presence of differentiated flows, carrying out further controlled release tests with higher flow rates.

Author Contributions

Conceptualization: G.T., L.C., M.S.; methodology: G.T.; software, G.T.; validation: G.T., L.C., M.S.; formal analysis, G.T.; investigation, G.T.; resources, G.T.; data curation, G.T.; writing—original draft preparation: G.T.; writing—review and editing, G.T., L.C., M.S.; visualization, G.T., L.C., M.S.; supervision, G.T.; project administration, G.T.; funding acquisition, G.T. All authors have read and agreed to the published version of the manuscript.

Funding

This article is part of the results of the research project “Integrated environmental monitoring via the use of Unmanned Aerial Systems (drones), environmental management systems and Life Cycle Assessment (LCA): set-up for improving the environmental profile of landfill sites and industrial plants”. PRIN—Progetti di Rilevante Interesse Nazionale 2022—Prot. 2022FPFPT5, settore ERC SH7—CUP H53D23004920006. Ministry of University and Research. Funded by European Union—Next Generation EU.

Institutional Review Board Statement

Not applicable.

Informed Consent Statement

Not applicable.

Data Availability Statement

The original contributions presented in the study are included in the article, further inquiries can be directed to the corresponding author.

Conflicts of Interest

The authors declare no conflicts of interest.

References

  1. IPCC. Climate Change 2021: The Physical Science Basis. AR6. Working Group I Contribution to the Sixth Assessment Report of the Intergovernmental Panel on Climate Change; IPCC: Geneva, Switzerland, 2021. [Google Scholar]
  2. COM(2020) 663 Final; Communication from the Commission to the European Parliament, the Council, the European Economic and Social Committee and the Committee of the Regions on an EU Strategy to Reduce Methane Emissions. European Union: Brussels, Belgium, 2020.
  3. Manfreda, S.; McCabe, M.F.; Miller, P.E.; Lucas, R.; Madrigal, V.P.; Mallinis, G.; Ben Dor, E.; Helman, D.; Estes, L.; Ciraolo, G.; et al. Review. On the Use of Unmanned Aerial Systems for Environmental Monitoring. Remote Sens. 2018, 10, 641. [Google Scholar] [CrossRef]
  4. Jońca, J.; Pawnuk, M.; Bezyk, Y.; Arsen, A.; Sówka, I. Drone-assisted monitoring of atmospheric pollution—A comprehensive review. Sustainability 2022, 14, 11516. [Google Scholar] [CrossRef]
  5. Li, Y.; Li, W.; Jin, Z.; Luo, X.; Xie, G.; Tai, H.; Jiang, Y.; Yang, Y.; Su, Y. Ternary ordered assembled piezoelectric composite for self-powered ammonia detection. Nano Energy 2024, 122, 109291. [Google Scholar] [CrossRef]
  6. Chen, C.; Xie, G.; Dai, J.; Li, W.; Cai, Y.; Li, J.; Zhang, Q.; Tai, H.; Jiang, Y.; Su, Y. Integrated core-shell structured smart textiles for active NO2 concentration and pressure monitoring. Nano Energy 2023, 116, 108788. [Google Scholar] [CrossRef]
  7. Su, Y.; Chen, S.; Liu, B.; Lu, H.; Luo, X.; Chen, C.; Li, W.; Long, Y.; Tai, H.; Xie, G.; et al. Maxwell displacement current induced wireless self-powered gas sensor array. Mater. Today Phys. 2023, 30, 100951. [Google Scholar] [CrossRef]
  8. Dai, J.; Xie, G.; Chen, C.; Liu, Y.; Tai, H.; Jiang, Y.; Su, Y. Hierarchical piezoelectric composite film for self-powered moisture detection and wearable biomonitoring. Appl. Phys. Lett. 2024, 124, 053701. [Google Scholar] [CrossRef]
  9. Zhang, Q.; Xie, G.; Duan, M.; Liu, Y.; Cai, Y.; Xu, M.; Zhao, K.; Tai, H.; Jiang, Y.; Su, Y. Zinc Oxide Nanorods for Light-Activated Gas Sensing and Photocatalytic Applications. ACS Appl. Nano Mater. 2023, 6, 17445–17456. [Google Scholar] [CrossRef]
  10. Sliusar, N.; Filkin, T.; Huber-Humer, M.; Ritzkowski, M. Drone technology in municipal solid waste management and landfilling: A comprehensive review. Waste Manag. 2022, 139, 1–16. [Google Scholar] [CrossRef]
  11. Soskind, M.G.; Li, N.P.; Moore, D.P.; Chen, Y.; Wendt, L.P.; McSpiritt, J.; Zondlo, M.A.; Wysocki, G. Stationary and drone-assisted methane plume localization with dispersion spectroscopy. Remote Sens. Environ. 2023, 289, 113513. [Google Scholar] [CrossRef]
  12. Daugela, I.; Visockiene, J.S.; Kumpiene, J. Detection and analysis of methane emissions from a landfill using unmanned aerial drone systems and semiconductor sensors. Detritus 2020, 10, 127–138. [Google Scholar] [CrossRef]
  13. Fjelsted, L.; Christensen, A.G.; Larsen, J.E.; Kjeldsen, P.; Scheutz, C. Assessment of a landfill methane emission screening method using an unmanned aerial vehicle mounted thermal infrared camera—A field study. Waste Manag. 2019, 87, 893–904. [Google Scholar] [CrossRef] [PubMed]
  14. Emran, B.J.; Tannant, D.D.; Najjaran, H. Low-Altitude Aerial Methane Concentration Mapping. Remote Sens. 2017, 9, 823. [Google Scholar] [CrossRef]
  15. Elpelt-Wessel, I.; Reiser, M.; Morrison, D.; Kranert, M. Emission Determination by Three Remote Sensing Methods in Two Release Trials. Atmosphere 2022, 13, 53. [Google Scholar] [CrossRef]
  16. Olaguer, E.P.; Jeltema, S.; Gauthier, T.; Jermalowicz, D.; Ostaszewski, A.; Batterman, S.; Xia, T.; Raneses, J.; Kovalchick, M.; Miller, S.; et al. Landfill Emissions of Methane Inferred from Unmanned Aerial Vehicle and Mobile Ground Measurements. Atmosphere 2022, 13, 983. [Google Scholar] [CrossRef]
  17. Allen, G.; Hollingsworth, P.; Kabbabe, K.; Pitt, J.R.; Mead, M.I.; Illingworth, S.; Roberts, G.; Bourn, M.; Shallcross, D.E.; Percival, C.J. The development and trial of an unmanned aerial system for the measurement of methane flux from landfill and greenhouse gas emission hotspots. Waste Manag. 2019, 87, 883–892. [Google Scholar] [CrossRef]
  18. Darynova, Z.; Blanco, B.; Juery, C.; Donnat, L.; Duclaux, O. Data assimilation method for quantifying controlled methane releases using a drone and ground-sensors. Atmos. Environ. 2023, X 17, 100210. [Google Scholar] [CrossRef]
  19. Morales, R.; Ravelid, J.; Vinkovic, K.; Korbe, P.; Tuzson, B.; Emmenegger, L.; Chen, H.; Schmidt, M.; Humbel, S.; Brunner, D. Controlled-release experiment to investigate uncertainties in UAV-based emission quantification for methane point sources. Atmos. Meas. Tech. 2022, 15, 2177–2198. [Google Scholar] [CrossRef]
  20. Hollenbeck, D.; Zulevic, D.; Chen, Y.Q. Advanced leak detection and quantification of methane emissions using sUAS. Drones 2021, 5, 117. [Google Scholar] [CrossRef]
  21. Kim, Y.M.; Park, M.H.; Jeong, S.; Lee, K.H.; Kim, J.Y. Evaluation of error inducing factors in unmanned aerial vehicle mounted detector to measure fugitive methane from solid waste landfill. Waste Manag. 2021, 124, 368–376. [Google Scholar] [CrossRef]
  22. Corbett, A.; Smith, B. A Study of a Miniature TDLAS System Onboard Two Unmanned Aircraft to Independently Quantify Methane Emissions from Oil and Gas Production Assets and Other Industrial Emitters. Atmosphere 2022, 13, 804. [Google Scholar] [CrossRef]
  23. Iwaszenko, S.; Kalisz, P.; Słota, M.; Rudzki, A. Detection of Natural Gas Leakages Using a Laser-Based Methane Sensor and UAV. Remote Sens. 2021, 13, 510. [Google Scholar] [CrossRef]
  24. Barchyn, T.E.; Hugenholtz, C.H.; Fox, T.A. Plume detection modeling of a drone-based natural gas leak detection system. Elem. Sci. Anthr. 2019, 7, 41. [Google Scholar] [CrossRef]
  25. Ruckstuhl, A.F.; Henne, S.; Reimann, S.; Steinbacher, M.; Vollmer, M.K.; O’Doherty, S.; Buchmann, B.; Hueglin, C. Robust extraction of baseline signal of atmospheric trace species using local regression. Atmos. Meas. Tech. 2012, 5, 2613–2624. [Google Scholar] [CrossRef]
  26. Yong, H.; Allen, G.; Mcquilkin, J.; Ricketts, H.; Shaw, J.T. Lessons learned from a UAV survey and methane emissions calculation at a UK landfill. Waste Manag. 2024, 180, 47–54. [Google Scholar] [CrossRef] [PubMed]
  27. Tassielli, G.; Cananà, L. Environmental monitoring via drone: Development of algorithms for correcting background measurements. In Proceedings of the XXXII National Congress on Commodity Science, Lecce, Italy, 19–20 September 2024. [Google Scholar]
  28. Yang, S.; Talbot, R.W.; Frish, M.B.; Golston, L.M.; Aubut, N.F.; Zondlo, M.A.; Gretencord, C.; McSpiritt, J. Natural Gas Fugitive Leak Detection Using an Unmanned Aerial Vehicle: Measurement System Description and Mass Balance Approach. Atmosphere 2018, 9, 383. [Google Scholar] [CrossRef]
  29. Shaw, J.T.; Shah, A.; Yong, H.; Allen, G. Methods for quantifying methane emissions using unmanned aerial vehicles: A review. Philos. Trans. R. Soc. A 2021, 379, 20200450. [Google Scholar] [CrossRef]
  30. Hollenbeck, D.; Dahabra, M.; Christensen, L.E.; Chen, Y.Q. Data quality aware flight mission design for fugitive methane sniffing using fixed wind sUAS. In Proceedings of the 2019 International Conference on Unmanned Aircraft Systems (ICUAS), Atlanta, GA, USA, 11–14 June 2019. [Google Scholar]
  31. Neumann, P.P.; Kohlhoff, H.; Hüllmann, D.; Krentel, D.; Kluge, M.; Dzierliński, M.; Lilienthal, A.J.; Bartholmai, M. Aerial-based gas tomography—From single beams to complex gas distributions. Eur. J. Remote Sens. 2019, 52 (Suppl. 3), 2–16. [Google Scholar] [CrossRef]
  32. Brantley, H.L.; Thoma, E.D.; Squier, W.C.; Guven, B.B.; Lyon, D. Assessment of methane emissions from oil and gas production pads using mobile measurements. Environ. Sci. Technol. 2014, 48, 14508–14515. [Google Scholar] [CrossRef] [PubMed]
  33. Yacovitch, T.I.; Neininger, B.; Herndon, S.C.; Denier van der Gon, H.; Jonkers, S.; Hulskotte, J.; Roscioli, J.; Zavala-Araiza, D. Methane emissions in the Netherlands: The Groningen field. Elem. Sci. Anthr. 2018, 6, 57. [Google Scholar] [CrossRef]
  34. Gålfalk, M.; Påledal, S.N.; Bastviken, D. Sensitive drone mapping of methane emissions without the need for supplementary ground-based measurements. ACS Earth Space Chem. 2021, 5, 2668–2676. [Google Scholar] [CrossRef]
  35. Pätzold, F.; Bauknecht, A.; Schlerf, A.; Sotomayor Zakharov, D.; Bretschneider, L.; Lampert, A. Flight Experiments and Numerical simulations for investigating multicopter flow field and structure deformation. Atmosphere 2023, 14, 1336. [Google Scholar] [CrossRef]
  36. Nathan, B.J.; Golston, L.M.; O’Brien, A.S.; Ross, K.; Harrison, W.A.; Tao, L.; Lary, D.J.; Johnson, D.R.; Covington, A.N.; Clark, N.N.; et al. Near-field characterization of methane emission variability from a compressor station using a model aircraft. Environ. Sci. Technol. 2015, 49, 7896–7903. [Google Scholar] [CrossRef] [PubMed]
  37. Golston, L.M.; Aubut, N.F.; Frish, M.B.; Yang, S.; Talbot, R.W.; Gretencord, C.; McSpiritt, J.; Zondlo, M.A. Natural Gas Fugitive Leak Detection Using an Unmanned Aerial Vehicle: Localization and Quantification of Emission Rate. Atmosphere 2018, 9, 333. [Google Scholar] [CrossRef]
  38. Cambaliza MO, L.; Shepson, P.B.; Caulton, D.R.; Stirm, B.; Samarov, D.; Gurney, K.R.; Turnbull, J.; Davis, K.J.; Possolo, A.; Karion, A.; et al. Assessment of uncertainties of an aircraft-based mass balance approach for quantifying urban greenhouse gas emissions. Atmos. Chem. Phys. 2014, 14, 9029–9050. [Google Scholar] [CrossRef]
Figure 1. Places where the surveys were carried out located in Apulia (Italy): (a) map of towns of Apulia where the areas are located; (b) suburban area; (c) agricultural area; (d) industrial area.
Sustainability 16 07748 g001
Figure 2. Controlled release methane flow measurement test scheme.
Sustainability 16 07748 g002
Figure 3. Measurements obtained in one of the flights carried out for background measurement at a height of 10 m AGL and at a drone speed of 2 ms−1 with the presence of a notable number of outliers (logarithmic scale). Black line represents the threshold above which the values are considered outliers.
Sustainability 16 07748 g003
Figure 4. Flight measurements at 10 m AGL and at a speed of 2 ms−1 corrected with the application of a specific algorithm.
Sustainability 16 07748 g004
Figure 5. Frequency of corrected methane background measurements of the flight conducted at 10 m AGL and a speed of 2 ms−1.
Sustainability 16 07748 g005
Figure 6. Methane background measurements (mean and standard deviation) in the various tests performed in suburban area.
Sustainability 16 07748 g006
Figure 7. Methane background measurements (mean and standard deviation) in the various tests performed in suburban areas after the application of the outlier correction algorithm.
Sustainability 16 07748 g007
Figure 8. Average methane background curves as a function of the flight height and speed of the drone, referring to Survey n. 1 conducted in a suburban area, obtained after the application of the data correction algorithm.
Sustainability 16 07748 g008
Figure 9. Methane background measurements (mean and standard deviation) in the various tests performed in the agricultural area.
Sustainability 16 07748 g009
Figure 10. Methane background measurements (mean and standard deviation) in the various tests performed in the industrial area.
Sustainability 16 07748 g010
Figure 11. Data recorded during a controlled methane release test in SA (flight height AGL = 7 m; drone speed = 1 ms−1; wind speed = 2.2 ms−1).
Sustainability 16 07748 g011
Figure 12. Data recorded during a controlled methane release test in AA (flight height AGL = 7 m; drone speed = 1 ms−1; wind speed = 4.2 ms−1). (a) Original data. (b) Data after the application of the detection algorithm.
Sustainability 16 07748 g012
Figure 13. Validated data as methane emissions, after reducing the background level by applying an iterative estimation process. The rectangle corresponds to the actual release, the others are false positives.
Sustainability 16 07748 g013
Table 1. Summary information of the surveys carried out (Survey n. 1–8).
ParametersSurvey n. 1Survey n. 2Survey n. 3Survey n. 4
Date6 February 20246 February 20247 February 20247 February 2024
Survey start time10:0015:009:0012:30
Area *SASASASA
Type of surfaceShort vegetationShort vegetationShort vegetation
Concrete floor
Concrete floor
Flight altitude7, 10, 15, 20 m7, 10, 15, 20 m7 m7, 10 m
UAV speed0.5, 1, 2, 3, 4 ms−11, 2, 3 ms−10.5, 1, 2 ms−11 ms−1
Weather conditionClear skyClear skyClear skyClear sky
Average wind speed2.2 ms−11.6 ms−11.7 ms−13.2 ms−1
Notes
-
It is the repetition of the test performed in the morning
-
The laser beam falls into shadow (Figure 1b)
-
It is the repetition of the test performed on the previous day (Survey n. 1)
-
Similar weather conditions to the day before
-
Even on concrete floor surfaces
-
It is the repetition of the test performed in the previous survey (Survey n. 3)
ParametersSurvey n. 5Survey n. 6Survey n. 7Survey n. 8
Date28 May 202428 May 20242 July 20245 July 2024
Survey start time10:0012:0010:0010:00
Area *AAAAIAIA
Type of surfaceWheat field with tall plantsWhite gravel roadGravelGravel
Flight altitude7, 10, 15, 20, 25, 30 m7, 10, 15, 20, 30, 40 m7, 10, 15, 20, 25 m7, 10, 15, 20 m
UAV speed1, 2 ms−10, 1, 2 ms−11, 2 ms−12 ms−1
Weather conditionClear, partly cloudy skyClear, partly cloudy skyClear skyCompletely overcast sky
Average wind speed4.2 ms−14.0 ms−12.2 ms−13.1 ms−1
Notes
-
Similar weather conditions to the previous survey (n. 5)
-
The underlying surface changes
-
It is the repetition of the test performed in the previous survey (Survey n. 7) but with completely overcast skies
* SA = Suburban area. AA = Agricultural area. IA = Industrial area.
Table 2. Survey n. 1; flights at a speed of 1 ms−1; various altitudes. Statistical data of initial recorded measurement vs. results after the application of the iterative algorithm based on the 2σ threshold of measured observations.
Statistical IndicatorUnitInitial Data of the Methane BackgroundFinal Indicators of the Methane Background after Applying the Correction Algorithm
7 m10 m15 m20 m7 m10 m15 m20 m
Meanppm*m26.2132.3236.3748.3013.5018.1726.9840.53
SDppm*m110.14113.1191.4170.5715.8715.8319.2428.65
CV%420%350%251%146%118%87%71%71%
Skewness 16.1515.9722.5015.262.811.670.660.65
Num. Obs.n.16101450152012201548137414431162
Num. Outliersn.----62767758
% Outliers%----3.9%5.2%5.1%4.8%
Disclaimer/Publisher’s Note: The statements, opinions and data contained in all publications are solely those of the individual author(s) and contributor(s) and not of MDPI and/or the editor(s). MDPI and/or the editor(s) disclaim responsibility for any injury to people or property resulting from any ideas, methods, instructions or products referred to in the content.

