Article

Effects of Nutrient Accumulation and Microbial Community Changes on Tomato Fusarium Wilt Disease in Greenhouse Soil

1
College of Land and Environment, Shenyang Agricultural University, Shenyang 110866, China
2
Shandong Peanut Research Institute, Qingdao 266100, China
*
Authors to whom correspondence should be addressed.
Sustainability 2024, 16(17), 7756; https://doi.org/10.3390/su16177756
Submission received: 2 August 2024 / Revised: 4 September 2024 / Accepted: 4 September 2024 / Published: 6 September 2024

Abstract

:
Fusarium wilt caused by Fusarium oxysporum f. sp. lycopersici has severely threatened sustainable greenhouse tomato production. However, the effects of nutrient enrichment due to excessive fertilization on Fusarium wilt remain unclear. This study aimed to investigate the relationships among soil nutrient enrichment, microbial community structure, and the occurrence of Fusarium wilt under greenhouse conditions. This study used chemical analysis and microbiological techniques to analyze rhizosphere soil samples from greenhouse tomato production areas with varying degrees of Fusarium wilt. The results showed that, as compared with the Health group, the rhizosphere soil of Disease group has a significant nutrient enrichment, which significantly influences bacterial diversity and structure. Particularly when soil NO3–N content exceeds 170.43 mg kg−1, there was a significant reduction in the relative abundance of key biocontrol bacteria such as Bacillus and Lysinibacillus. This reduction indirectly contributes to an increase in Fusarium oxysporum abundance, subsequently elevating the likelihood of pathogen infection. Furthermore, the Disease group also exhibited a simplified co-occurrence network with a 22.37% reduction in competitive interactions between bacteria and fungi. These changes might collectively increase the risk of tomato Fusarium wilt infection. Meanwhile, the relative abundance of bacteria carrying antibiotic resistance genes significantly increased in the Disease group, which also reduced soil resistance. Together, the results presented here not only uncover the effect of long-term excessive fertilization on the occurrence of Fusarium wilt but also advance our understanding of the interactions among soil nutrient management and microbial communities in the tomato rhizosphere, which provides a scientific basis for formulating strategies to prevent soil-borne diseases in greenhouse tomatoes.

1. Introduction

Tomato (Solanum lycopersicum L.) is one of the most extensively grown and consumed greenhouse vegetables worldwide [1]. In 2021, tomato production in China amounted to 66.6 million tons, thereby representing a pillar industry for agricultural development and increasing farmers’ income [2]. However, tomato yields are currently severely threatened by Fusarium wilt, caused by Fusarium oxysporum f. sp. lycopersici (Fol), one of the most destructive and aggressive soil-borne diseases in global agriculture [3,4]. Fusarium wilt has an incidence rate of 20% to 40% and is particularly severe in greenhouse agriculture, with severe infections resulting in yield losses exceeding 80% [5,6,7]. Therefore, it is crucial to explore the factor contributing to greenhouse tomato Fusarium wilt in order to ensure the sustainable development of the tomato industry.
In greenhouse agriculture, to ensure high yields of tomatoes, fertilization is frequently executed beyond recommended levels, which leads to the accumulation of nutrients in the soil [8]. The concentration of available nitrogen (N), phosphorus (P), and potassium (K) in greenhouse vegetable soils is 1.81–18.19-, 2.09–16.45-, and 1.66–4.96 times that in open-field agricultural soils, respectively [8,9]. Appropriate nutrient supply is beneficial for crop growth and health and can decrease the occurrence of wilt diseases [10,11]. However, excessive nutrient supply can lead to a higher incidence of diseases and more severe symptoms [12]. In the study by Gu et al. [11], compared with no nitrogen treatment, the low concentration NO3–N treatment (0.24 g kg−1, similar to the nitrogen levels in open-field soils) significantly reduced the abundance of Fusarium oxysporum, thereby effectively suppressing the incidence of cucumber Fusarium wilt disease. In contrast, Easterday et al. [13] suggested that long-term nitrogen enrichment reduces the soil’s capacity to suppress pathogens, which increases the incidence of plant diseases. The findings of this research indicate that Fusarium wilt responds differently to nutrient-rich and nutrient-poor soil conditions. Therefore, we hypothesize that the frequent occurrence of Fusarium wilt in greenhouses is associated with soil nutrient accumulation.
Soil nutrient enrichment not only affects pathogens but also alters the structure of microbial communities, which play a crucial indirect role in controlling pathogen infections [13]. During the initial construction of greenhouses, the soil microbial community structure typically has a positive effect on crop health. Especially some microorganisms with biocontrol functions against Fol, including Trichoderma and Bacillus, effectively inhibit Fol infection [14,15]. Even an increase in Fol abundance does not necessarily lead to disease occurrence [16]. However, over the years of greenhouse cultivation, the native structure of the soil microbial community is disrupted, weakening its capacity to inhibit Fol infection in plants [17]. Easterday et al. [13] and Gosling et al. [18], respectively, found that under conditions of high nitrogen and high phosphorus, the suppressive effect of microbial communities on pathogens diminishes. Watanabe et al. [19] observed the same phenomenon in acidic soils with a pH range of 4.5–5.5. These findings indicate that Fusarium wilt exhibits different responses under nutrient-rich and nutrient-poor soil conditions. Moreover, excessive fertilizer application may reduce signal transduction, disrupt bacterial and fungal interactions, and lower microbial community network connectivity and complexity, thereby weakening resistance to pathogen invasion [20,21,22]. However, a consensus has not been reached on the relationship between the changes in soil microbial characteristics due to soil nutrient accumulation and the occurrence of soil-borne diseases [23], indicating the need for further research to explore and summarize the associated patterns and mechanisms.
In this study, we hypothesized that excessive fertilization leads to nutrient enrichment in the soil, thereby altering the microbial community characteristics in the rhizosphere of greenhouse tomatoes and serving as the main cause of Fusarium wilt. To test this hypothesis, we collected rhizosphere soil samples from tomato greenhouses with varying degrees of Fusarium wilt severity and determined the Fusarium wilt disease index (DI) and yield in these greenhouses. Soil chemical properties were measured, and the abundance of Fol, along with the abundance and composition of bacterial and fungal communities, were analyzed using absolute quantification PCR (AQ-PCR) and Illumina MiSeq sequencing. This study assessed the soil drivers affecting Fusarium wilt in greenhouse tomatoes by (a) comparing the chemical and microbial characteristics of tomato rhizosphere soil from Health and Disease groups, (b) exploring whether these factors effect Fol abundance, and (c) analyzing the relationship between microbial co-occurrence networks and Fusarium wilt. Through this work, we aimed to further understand the interactions among soil nutrient enrichment, microbial communities, and pathogens. This study will provide scientific fertilization guidelines for greenhouse agriculture and lay the foundation for developing effective disease management and prevention strategies, thereby ensuring the sustainable development of greenhouse tomato cultivation.

2. Materials and Methods

2.1. Site Description and Soil Sampling

Soil samples were collected from Beizhen (121°88′ E, 41°56′ N) and Beipiao (120°72′ E, 41°83′ N), which are the main greenhouse tomato production districts in Liaoning Province, China, with planting years ranging from 5 to 20 years. These districts experience tomato Fusarium wilt frequently. The soil is classified as Luvisols according to the FAO classification of these districts [24]. All greenhouses had an area of 60 × 15 m2. A three-crop rotation system of tomato-bean-tomato was implemented annually, with consistent varieties. Tomatoes were planted from February to May and September to December each year, whereas beans were planted from June to August. The average daytime and nighttime temperatures were 22–36 °C and 15–20 °C, respectively. The collected greenhouse soils were treated with mixed organic fertilizers of cow and sheep manure at a rate of 45,000–75,000 kg ha−1 year−1 (fresh). Chemical fertilizers were applied at rates of 250–400 kg ha−1 year−1 N, 250–500 kg ha−1 year−1 P2O5, and 225–400 kg ha−1 year−1 K2O.
Soil samples were collected from 21 greenhouses in May 2021. In each greenhouse, rhizosphere soil from 20 tomato plants, from a depth of 0–20 cm, was collected in an ‘S’ shaped pattern and thoroughly mixed to form a representative sample for each greenhouse. Thus, a total of 21 representative soil samples, one from each greenhouse, were collected. The collected soil samples were cleared of roots, stones, and other debris. One portion was stored at −80 °C for the molecular biology analysis, whereas the other portion was stored at 4 °C for the ammonium nitrogen and nitrate nitrogen content analyses.

2.2. Statistics and Calculation of Tomato Fusarium Wilt Disease Index and Yield

In each of the 21 greenhouses, we recorded data from 20 tomato plants whose rhizosphere soil was collected, including the disease grade and the yield from the aboveground parts of each plant. These 20 individual measurements in each greenhouse were used to comprehensively calculate the tomato Fusarium wilt DI and yield for that specific greenhouse, thereby providing representative data for all 21 greenhouses. Fusarium wilt in tomato plants was categorized based on the following five scales: 0 for plants with no leaf wilting and normal growth, 1 for plants with 1–25% leaf wilting, 2 for plants with 26–50% leaf wilting, 3 for plants with 51–75% leaf wilting, and 4 for plants with 76–100% leaf wilting, including dead plants. We evaluated the disease index and severity of wilt disease based on these scales. The DI for tomato Fusarium wilt in each greenhouse was calculated using the following formula: DI (%) = [Σ (each scale × number of plants in corresponding scale)/(total number of plants × maximal scale)] × 100 [25]. Based on data from approximately 82,500 tomato plants per hectare, we estimated the total tomato yield per hectare using the average yield of these 20 plants [26].

2.3. Determination of Soil Physical and Chemical Properties

The ammonium nitrogen (NH4+–N) and nitrate nitrogen (NO3–N) contents in the soil were measured by extracting fresh soil samples with a 0.01 mol L−1 CaCl2 solution (10:1 v/w) and analyzing them using an Autoanalyzer III continuous flow analyzer (Bran&Luebbe, Norderstedt, Germany). Soil pH and electrical conductivity (EC) were determined using a Thermo Orion Star A211 pH meter and a DDS–307A Leici conductivity meter (Shanghai, China) in soil-water mixtures, with soil-to-water ratios of 2.5:1 and 5:1, respectively. Alkali-hydrolyzable nitrogen (AN) was determined by the alkali diffusion method. Available phosphorus (AP) was extracted with 0.5 mol L−1 NaHCO3 (pH 8.5) solution from soil and determined by the molybdenum-antimony colorimetric method [27]. Available potassium (AK) was extracted with a 1 mol L−1 neutral CH₃COONH4 solution from soil and then determined using flame photometry. Soil total nitrogen (TN) content was determined using an automatic Kjeldahl analyzer (FOSS KJELTCE 8420, Copenhagen, Denmark) with the semi-micro Kjeldahl method [27].

2.4. Soil DNA Extraction and Absolute Quantification PCR

DNA was extracted from the soil samples (approximately 0.25–0.5 g) using the Omega M5635-02 Mag-Bind Soil DNA Kit 200 (Beijing, China) following the manufacturer’s protocol. The quality of the extracted DNA was checked on a 1.20% agarose gel, and quality control was further performed using a spectrophotometer (NanoDrop 2000, Thermo Scientific, Waltham, Massachusetts, USA). Subsequently, the DNA samples were stored at –20 °C until AQ-PCR and Illumina MiSeq sequencing analyses.
The absolute abundance of bacterial 16S rDNA, fungal internal transcribed spacer (ITS) region, and Fol were determined via AQ-PCR using stored DNA as a template and specific primers. Bacteria were analyzed using the primer pair 338F (5’-ACTCCTACGGGAGGCAGCAG-3’) and 806R (5’-GGACTACHVGGGTWTCTAAT-3’) [28]. Fungi were analyzed using the primer pair ITS1F (5’-CTTGGTCATTTAGAGGAAGTAA-3’) and ITS4 (5’-TCCTCCGCTTATTGATATGC-3’) [29]. Fol was analyzed using the primer pair 5′-CCGAATTGAGGTGAAGGACAG-3′ and 5′-CCGAAGTACCCATTGAGAGTG-3′ [30].
The AQ-PCR mixture included 8 μL of mixture A (10 μL 2 of ×SYBR real-time premixture, 0.4 μL of 10 μM forward, and 0.4 μL of 10 μM reverse primers) and 8 μL of gene template dilution (diluted to 20 ng μL−1). Standard curves were prepared using standards with known copy numbers. PCR assays were performed using a real-time PCR system (Suzhou Molarray Biotechnology Co., Ltd., Suzhou, China). The reaction protocol involved initial denaturation at 95 °C for 5 min, followed by 40 cycles of 95 °C for 15 s and 60 °C for 30 s [31]. The gene copy numbers for each target group in the reaction system were determined using the standard curve. The results are presented as the number of copies of the target gene per gram of soil.

2.5. Gene Sample Amplification and Illumina MiSeq Sequencing

DNA from each soil sample was used as the amplification template, with the primers 338F/806R used to amplify the V3–V4 regions of the bacterial 16S rDNA [28] and the primers ITS1F/ITS4 used to amplify the ITS1 region of fungal ITS genes [29]. PCR amplification was performed using a 25 μL reaction mixture. The reaction mixture was as follows: 2 μL of DNA template dilution (diluted to 20 ng μL−1), 2 μL of dNTP (2.5 mM), 5 μL of 5 × reaction buffer, 5 μL of 5 × GC buffer, 1 μL of forward primer (10 µM), 1 μL of reverse primer (10 µM), 8.75 μL of ddH2O, and 0.25 μL of Q5 DNA polymerase. The amplification parameters were as follows: an initial denaturation at 98 °C for 2 min, followed by 25–30 cycles of denaturation at 98 °C for 15 s, annealing at 55 °C for 30 s, and extension at 72 °C for 30 s, with a final extension at 72 °C for 5 min. Paired-end 16S and ITS gene sequencing was conducted by Personal Biotechnology Co., Ltd. (Shanghai, China) using the NovaSeq-PE250 sequencing platform (Illumina, Inc., San Diego, CA, USA).

2.6. Sequence Processing and Bioinformatic Analyses

Quantitative Insights Into Microbial Ecology 2 (QIIME2) was used to perform initial quality control on raw sequence reads to remove chimeras and sequence fragments [32]. Following the initial quality filtering, raw sequences were sorted based on index and barcode information into libraries and samples, and the barcode sequences were subsequently removed. Sequence denoising was performed using the QIIME2 divisive amplicon denoising algorithm 2 (DADA2) pipeline to remove sequencing errors, resulting in the identification of unique sequences, each referred to as an amplicon sequence variant (ASV). Trimmed sequences were aligned using the classify-sklearn algorithm with the Silva_132 (bacteria) and UNITE_8 (fungi) databases [33]. The taxonomic identities of the ASVs were determined using a naïve Bayes classifier, and the specific composition of each sample at different taxonomic levels is presented.
After standardizing all the samples to the minimum sequencing depth, the alpha diversity of each sample was evaluated by calculating the Chao1, Pielou_e, Shannon, and Simpson indices using QIIME2 [32]. Redundancy analysis (RDA) was performed using the ‘vegan’ package in R (version 3.2.2) to examine the relationships between the soil bacterial and fungal genera and soil characteristics based on the Bray–Curtis distance. Additionally, permutational multivariate analysis of variance (PERMANOVA) with 999 permutations was performed in R to analyze the significance of differences. The correlations between the selected soil characteristics and microbial genera relative abundance were analyzed by the Mantel test with the ‘ggcor’ package.
The Linear Discriminant Analysis Effect Size (LEfSe) method for interspecies difference analysis was performed using the online tool Galaxy (http://huttenhower.sph.harvard.edu/galaxy/ (accessed on 5 April 2024)) to analyze the microbial communities in the soil samples and identify biomarker bacteria and fungi that showed statistically significant differences among the different groups. In the analysis, the Kruskal–Wallis and Wilcoxon tests were set to alpha = 0.05, the linear discriminant analysis (LDA) score threshold was set to 3.5, and a multiclass analysis comparison strategy (all-against-all, more strict) was applied. Microbial species analysis covered multiple taxonomic levels from phylum to genus, and the final visualization was presented through a cladogram.
To explore the microbial co-occurrence networks between observable species, a molecular ecological network was constructed using an integrated network analysis pipeline (iNAP, http://mem.rcees.ac.cn:8081 (accessed on 25 May 2024)) [34]. For network construction, Spearman correlations were calculated based on the microbial ASV relative abundance (RA), with strong correlations (|Spearman’s ρ| > 0.84) and significant correlations (p < 0.01) preserved. Co-occurrence networks were illustrated using Gephi. The LEfSe and network construction excluded bacteria and fungi with a mean RA of < 0.1%. This value was set at 50% of the sample number to filter out bacteria and fungi that were less frequently detected among all samples.

2.7. Statistical Analyses

Statistical analyses were performed using IBM SPSS Statistics 22 software (IBM, Armonk, New York, USA). Significant differences among groups were tested using one-way analysis of variance (ANOVA) with Tukey’s HSD post hoc test for multiple comparisons. A significance level of p < 0.05 was used.
Random forest analysis, as described in Delgado-Baquerizo et al. [35], was performed using the ‘randomForest’ package in R version 4.3.2 to identify key microbial predictors associated with Fol abundance. A random seed was set to ensure the reproducibility of results. The model was constructed using 1000 trees to optimize predictive performance and model stability, and the importance of each variable was assessed using 1200 permutations. The microbial families and genera included in the analysis were selected based on cross-validation mean-squared error (MSE). The statistical significance of the mean predictor importance for each microbial predictor was evaluated using the ‘rfpermute’ package in R. Significance levels were categorized based on p-values: predictors with p < 0.001 were marked as ‘***’ (highly significant), those with p-values between 0.001 and 0.01 were marked as ‘**’, p-values between 0.01 and 0.05 were marked as ‘*’, indicating significance, and predictors with p ≥ 0.05 were considered not significant and left unmarked. Finally, significant microbial predictors identified by the random forest model were selected for further modeling.
The partial least squares structural equation model (PLS-SEM) was used to explore the chemical properties of the greenhouse soil (pH, EC, TN, NH4+–N, NO3–N, AN, AK, and AP content), microbial alpha diversity (bacterial and fungal Chao1, Pielou_e, Shannon, and Simpson indices), and direct and indirect effects of significant microbial predictors (RA of bacterial and fungal species) on the abundance of soil Fol (Fol copy number). Based on our hypotheses, we constructed an a priori model (Figure S1). Subsequently, the model was modified and simplified based on the external model quality (heterotrait–monotrait ratio of correlations, composite reliability, Cronbach’s alpha, and convergent validity), internal model quality (explained variance, R2), and model fit (standardized root mean square residual [SRMR]) [36]. The R package ‘plspm’ was used to construct the model [37].

3. Results

3.1. Tomato Fusarium Wilt Incidence Index and Yield in Greenhouses of Different Planting Years

In the 21 sampled greenhouses, the DI of tomato Fusarium wilt showed a monotonically increasing trend with increasing planting years (Figure 1a). Compared with greenhouses planted for 3–8 years (12.50–37.50%), the DI of greenhouses planted for 10–20 years increased significantly (57.50–82.50%) by 34.00–59.00% (p < 0.05). Simultaneously, the average yields of tomato greenhouses planted for 3–8 years and 10–20 years were 156.88 t ha−1 and 105.35 t ha−1, respectively, which represented a significant decrease of 29.45–36.97% (p < 0.05) (Figure 1b). Despite exhibiting mild symptoms of leaf wilting, tomato plants in greenhouses planted for 3–8 years did not experience significant yield reductions (139.01–174.82 t ha⁻¹). This phenomenon is termed ‘tolerance’ in plant pathology, which means that plants can endure pathogen infection without significant yield reduction. Therefore, based on the DI and yield, greenhouses cultivated for 3–8 years were classified as the Health group, exhibiting lower Fusarium wilt DI (below 38%) and maintaining yields above 139 t ha⁻¹, the standard for tomato production in the sampled region. In contrast, greenhouses cultivated for 10–20 years, which showed higher DI (above 57%) and yields below 124 t ha⁻¹, were classified as the Disease group.

3.2. Differences in Soil Properties between Health and Disease Groups of Tomatoes

Soil properties, including pH, TN, NO3–N, AN, and AP, significantly differed between the Disease and Health groups (Table 1). The soil pH of the Disease group was significantly lower than that of the Health group, with a difference of 0.54 units (p < 0.05). The average contents of TN, NO3–N, AN, and AP in the soil of the Disease group were significantly higher than those of the Health group (p < 0.05), with increases of 50.41%, 150.65%, 63.77%, and 33.60%, respectively. No significant differences in EC and AK were observed between the two groups (p > 0.05), although the Disease group had higher values than the Health group (Table 1). Significant nutrient accumulation was observed in the soil of the Disease group. The NH4+–N content in the soil of both groups was significantly lower than that of the other available elements, and no significant differences were observed between the two groups.

3.3. Differences in Soil Microbial Abundance and Alpha Diversity between the Health and Disease Groups

Using AQ-PCR, a quantitative analysis of bacteria, fungi, and Fol was performed to explore the differences in microbial abundance between the soils of the Health and Disease tomato groups (Table 2). Gene copies per gram of rhizosphere soil were 2.55 × 10⁹–1.77 × 10¹⁰, 1.89 × 10⁸–1.38 × 10⁹, and 3.82 × 10⁴–2.30 × 10⁵ for bacterial 16S rRNA, fungal ITS, and Fol, respectively. The gene copy number of Fol in the rhizosphere soil of the Healthy group (p < 0.05) was significantly lower than that in the Disease group, whereas no significant difference was found in the gene copy numbers of fungi and bacteria between the two groups (p > 0.05). Illumina MiSeq sequencing analysis of microbial community alpha diversity indicated that the bacterial Pielou_e, Shannon, and Simpson indices in the soils of the Health group were significantly higher than those in the Disease group (p < 0.05), with no significant differences observed in fungal diversity indices between the two groups (p > 0.05) (Table 2). Overall, the differences in bacterial diversity and Fol abundance between the Health and Disease groups were significant.

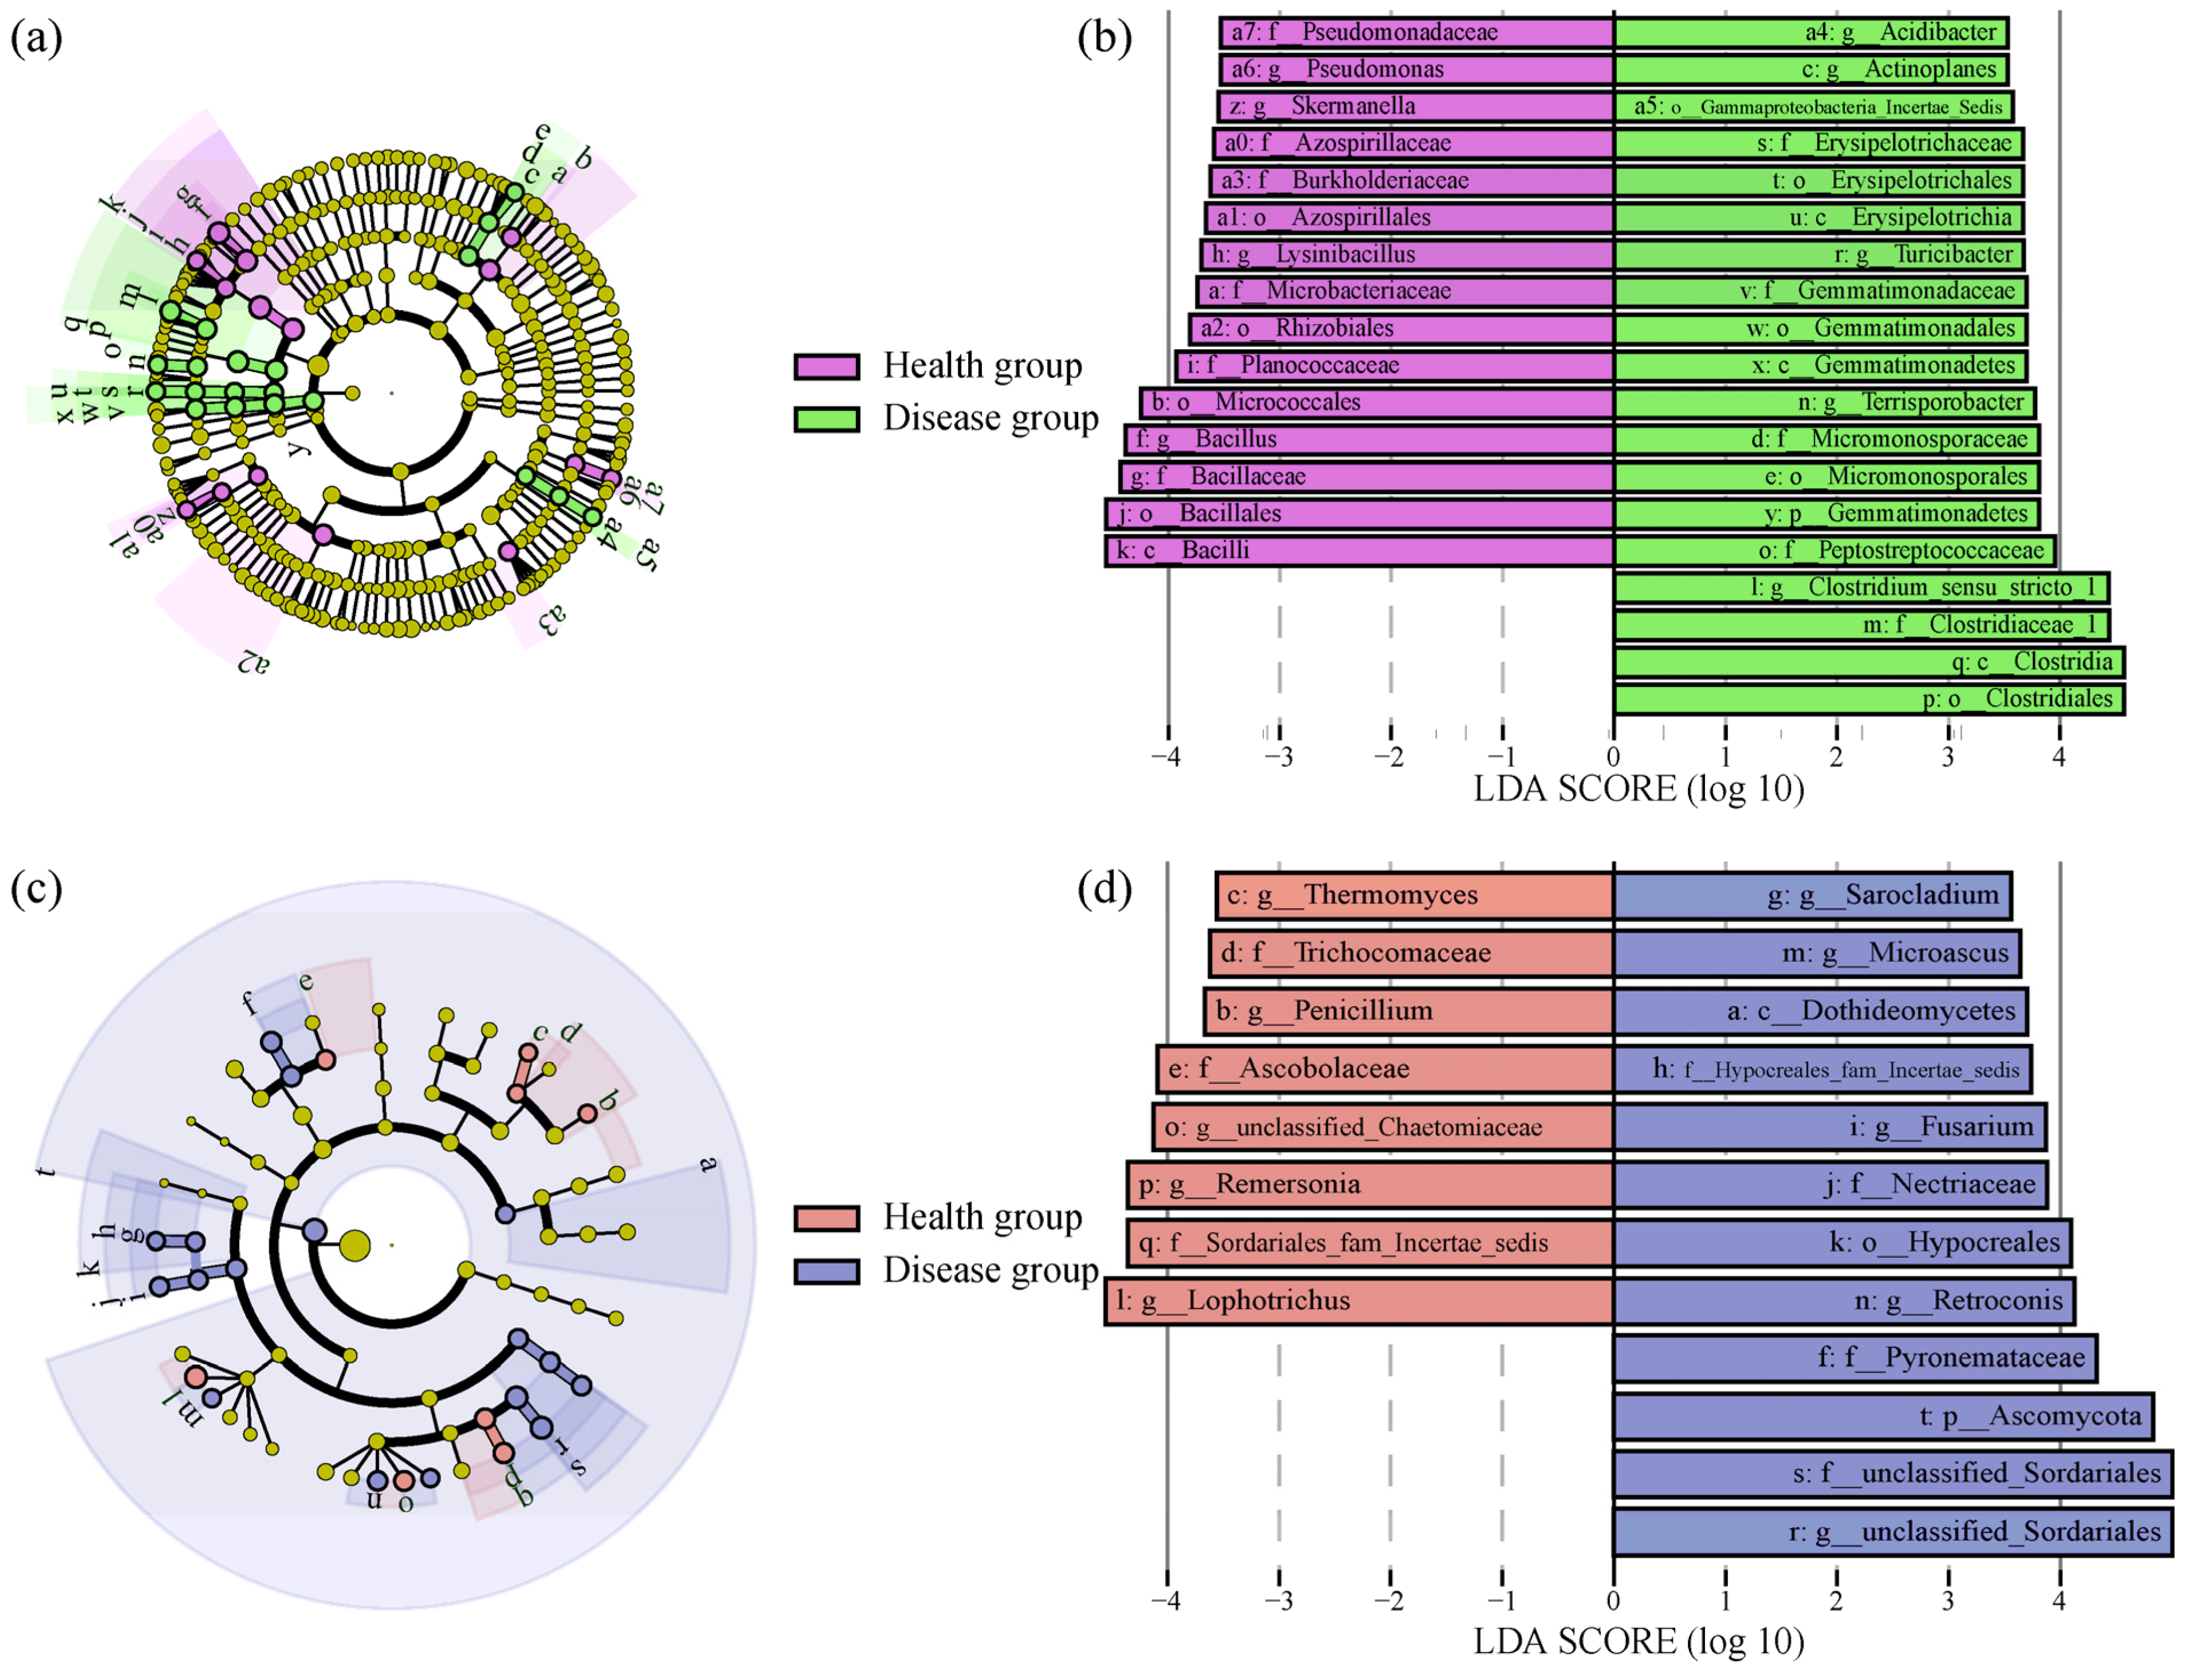
3.4. Differences in Soil Microbial Community Composition between Health and Disease Groups

Nine bacterial phyla with RA ≥ 0.5% were detected in the 21 soil samples. The most abundant sequences belonged to Proteobacteria (RA for 29.65–45.46%), Firmicutes (8.69–35.86%), and Actinobacteria (16.55–29.25%). The RA of Proteobacteria in the rhizosphere soil of the Health group was significantly higher than that of the Disease group, whereas the RA of Chloroflexi and Gemmatimonadetes was significantly lower in the Health group compared with that in the Disease group (p < 0.05) (Figure S2a).
Three fungal phyla with RA ≥ 0.5% were detected, with Ascomycota (46.58–97.62%) the most dominant and Mortierellomycota (0.18–17.27%) and Basidiomycota (0.06–4.07%) being relatively less abundant. The RA of Ascomycota in the rhizosphere soil of the Health group was significantly lower than that in the Disease group, whereas that of Mortierellomycota and Basidiomycota was significantly higher in the Health group compared with the Disease group (p < 0.05) (Figure S2b).
The specific bacterial and fungal taxa in the soils of the Health and Fusarium wilt Disease groups of greenhouse tomatoes were evaluated based on the LEfSe method, and the phylogenetic dendrograms are shown in Figure 2a,c. The LDA scores of the different biomarker bacteria and fungi are shown in Figure 2b,d. When the LDA effect size threshold was set to 3.5, significant differences were observed in the RA of 34 bacterial taxa and 20 fungal taxa between the soils of the Health and Disease groups (p < 0.05) (Figure 2a,c). At the genus level, the bacteria Bacillus, Lysinibacillus (belonging to Firmicutes), Skermanella, and Pseudomonas (belonging to Proteobacteria) and the fungi Thermomyces, Penicillium, unclassified_Chaetomiaceae, Remersonia, and Lophotrichus (all belonging to Ascomycota) were highly abundant in the Health group.
In the Disease group, the bacteria Acidibacter (belonging to Proteobacteria), Actinoplanes (belonging to Actinobacteria), Turicibacter, Terrisporobacter, and Clostridium_sensu_stricto_1 (belonging to Firmicutes) and fungi Sarocladium, Microascus, Fusarium. Retroconis and unclassified_Sordariales (all belonging to Ascomycota) were highly abundant. At the class level, the bacteria Bacilli were highly abundant in the Health group, whereas the bacteria Erysipelotrichia, Gemmatimonadetes, and Clostridia and the fungi Dothideomycetes were highly abundant in the Disease group. The bacterial phylum Gemmatimonadetes and fungal phylum Ascomycota were abundant in the Disease group (Figure 2a,c), which was consistent with the observations in Figure S2. We believe that these biomarkers are potentially related to tomato Fusarium wilt.

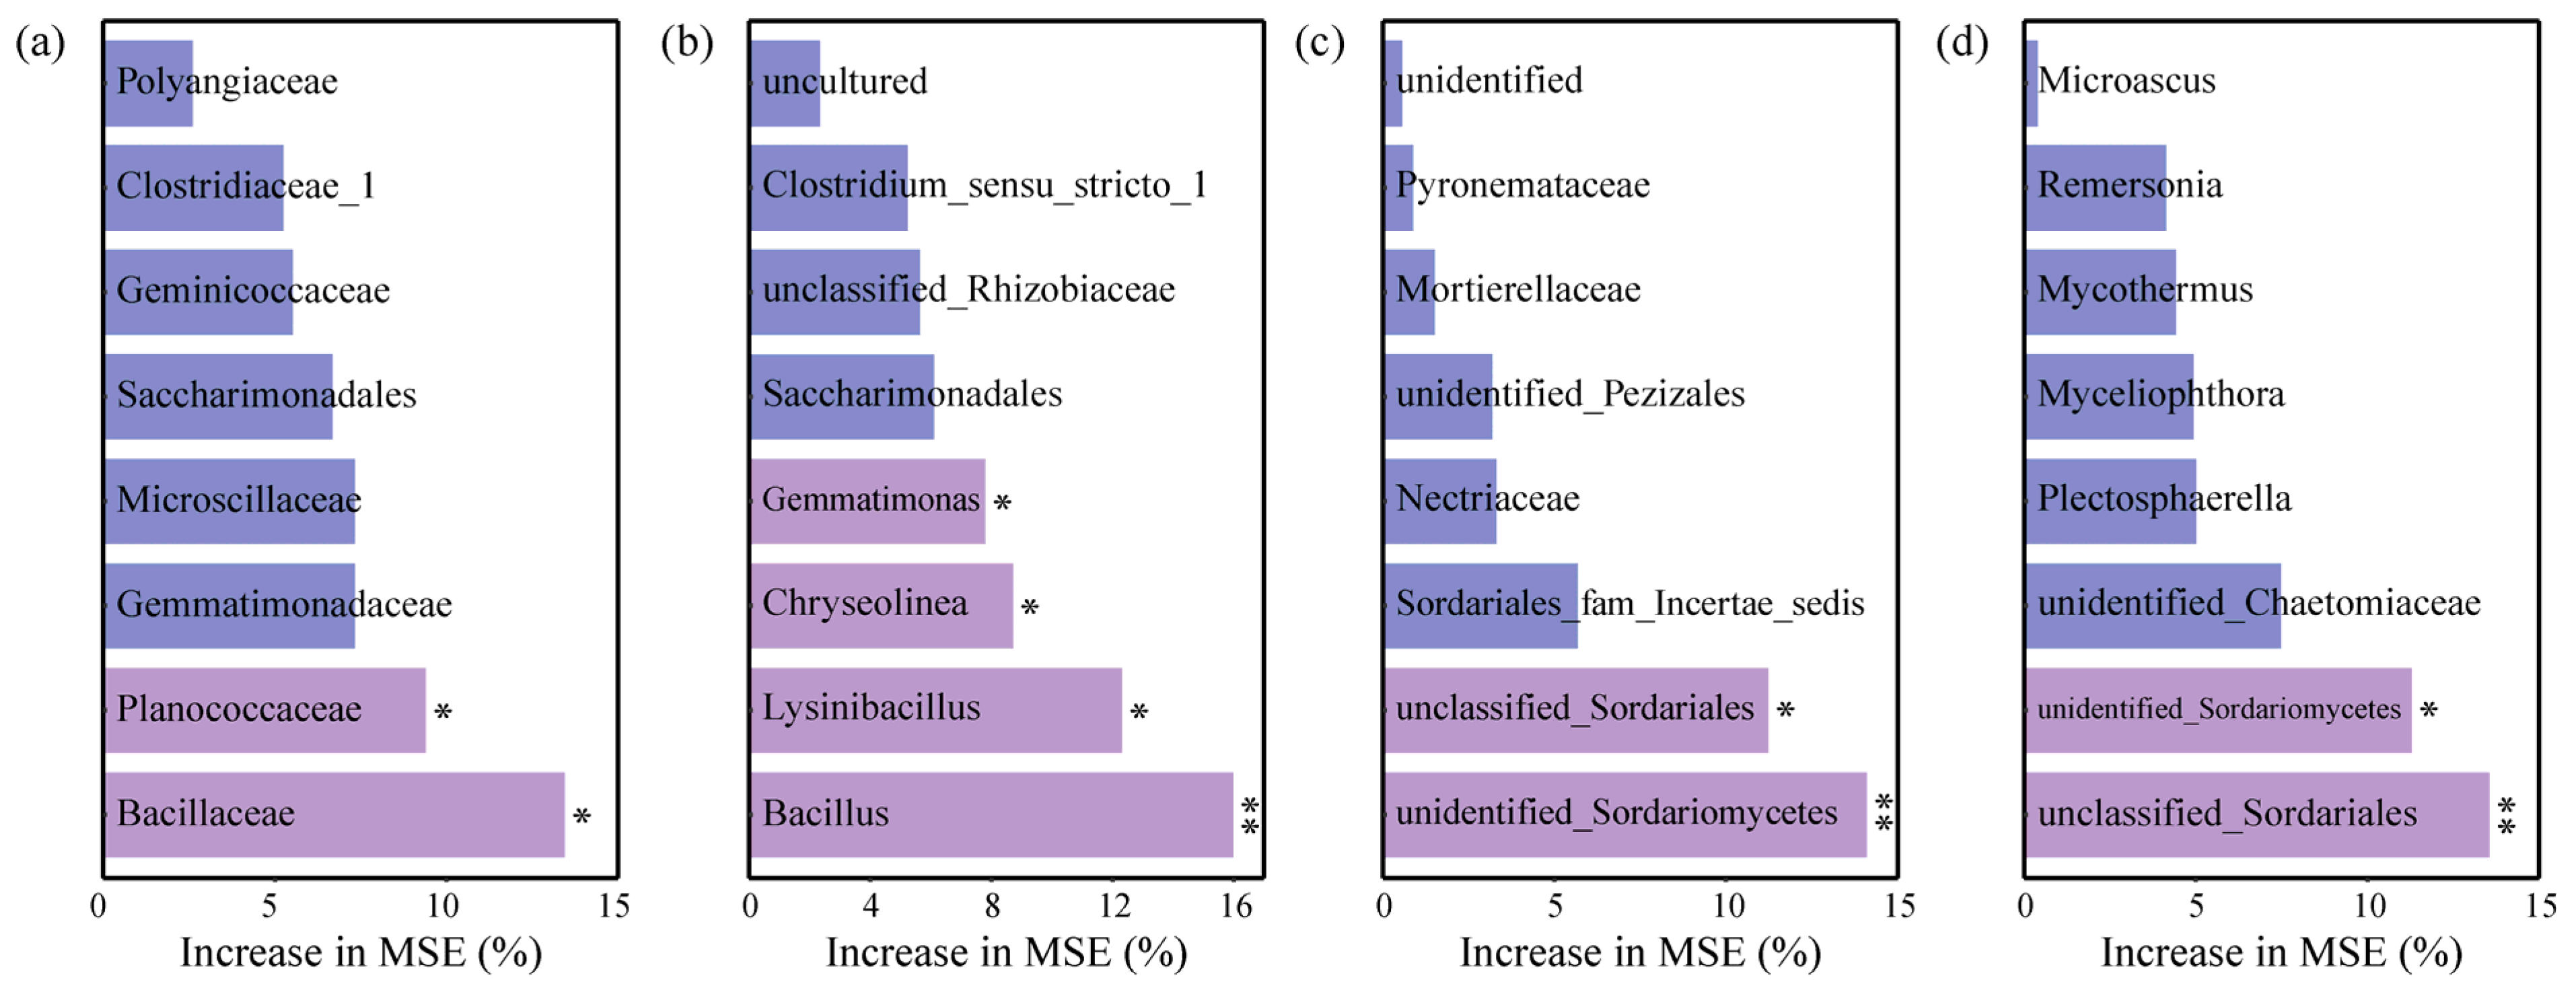
3.5. Effects of Soil Chemical Properties on Microbial Taxa in Greenhouse Tomato Soils

RDA was performed on the bacterial and fungal genera in the soils of the Health and Disease groups of greenhouse tomatoes based on the selected soil chemical properties. The selected chemical properties, particularly the pH and NO3–N content, were significantly correlated with the variance in bacterial genera (permutation test, p = 0.001). A total of 43.10% of the bacterial variance could be explained by the selected variables, with an evident distinction observed between the bacterial communities of the Health and Disease groups. Clostridium_sensu_stricto_1, Bacillus, Turicibacter, Lysinibacillus, and Terrisporobacter were the main bacterial genera distinguishing the two groups (Figure 3a). The selected chemical properties showed a weak correlation with the variance in fungal genera (permutation test, p = 0.174). Only 27.23% of the fungal variance could be explained by the selected variables. Additionally, the distribution of fungal genera in the Health and Disease groups overlapped, indicating similar fungal genus structures (Figure 3c). Furthermore, the Mantel test revealed that the RA of the top five bacterial genera with the highest goodness-of-fit values was significantly correlated with the selected chemical properties. Among these, the RA of the bacterial genera Bacillus and Lysinibacillus were most strongly correlated with the chemical properties of greenhouse soils (Mantel’s p < 0.01). In contrast, the RA of the fungi genera Pseudallescheria, Retroconis, and Remersonia showed correlations with EC, AP, TN, and pH (Mantel’s p < 0.05). Based on the correlation coefficients (Mantel’s r) and significance levels (Mantel’s p), the correlations between soil chemical properties and fungal genera RA were lower compared with those with the bacterial genera RA (Figure 3b,d).

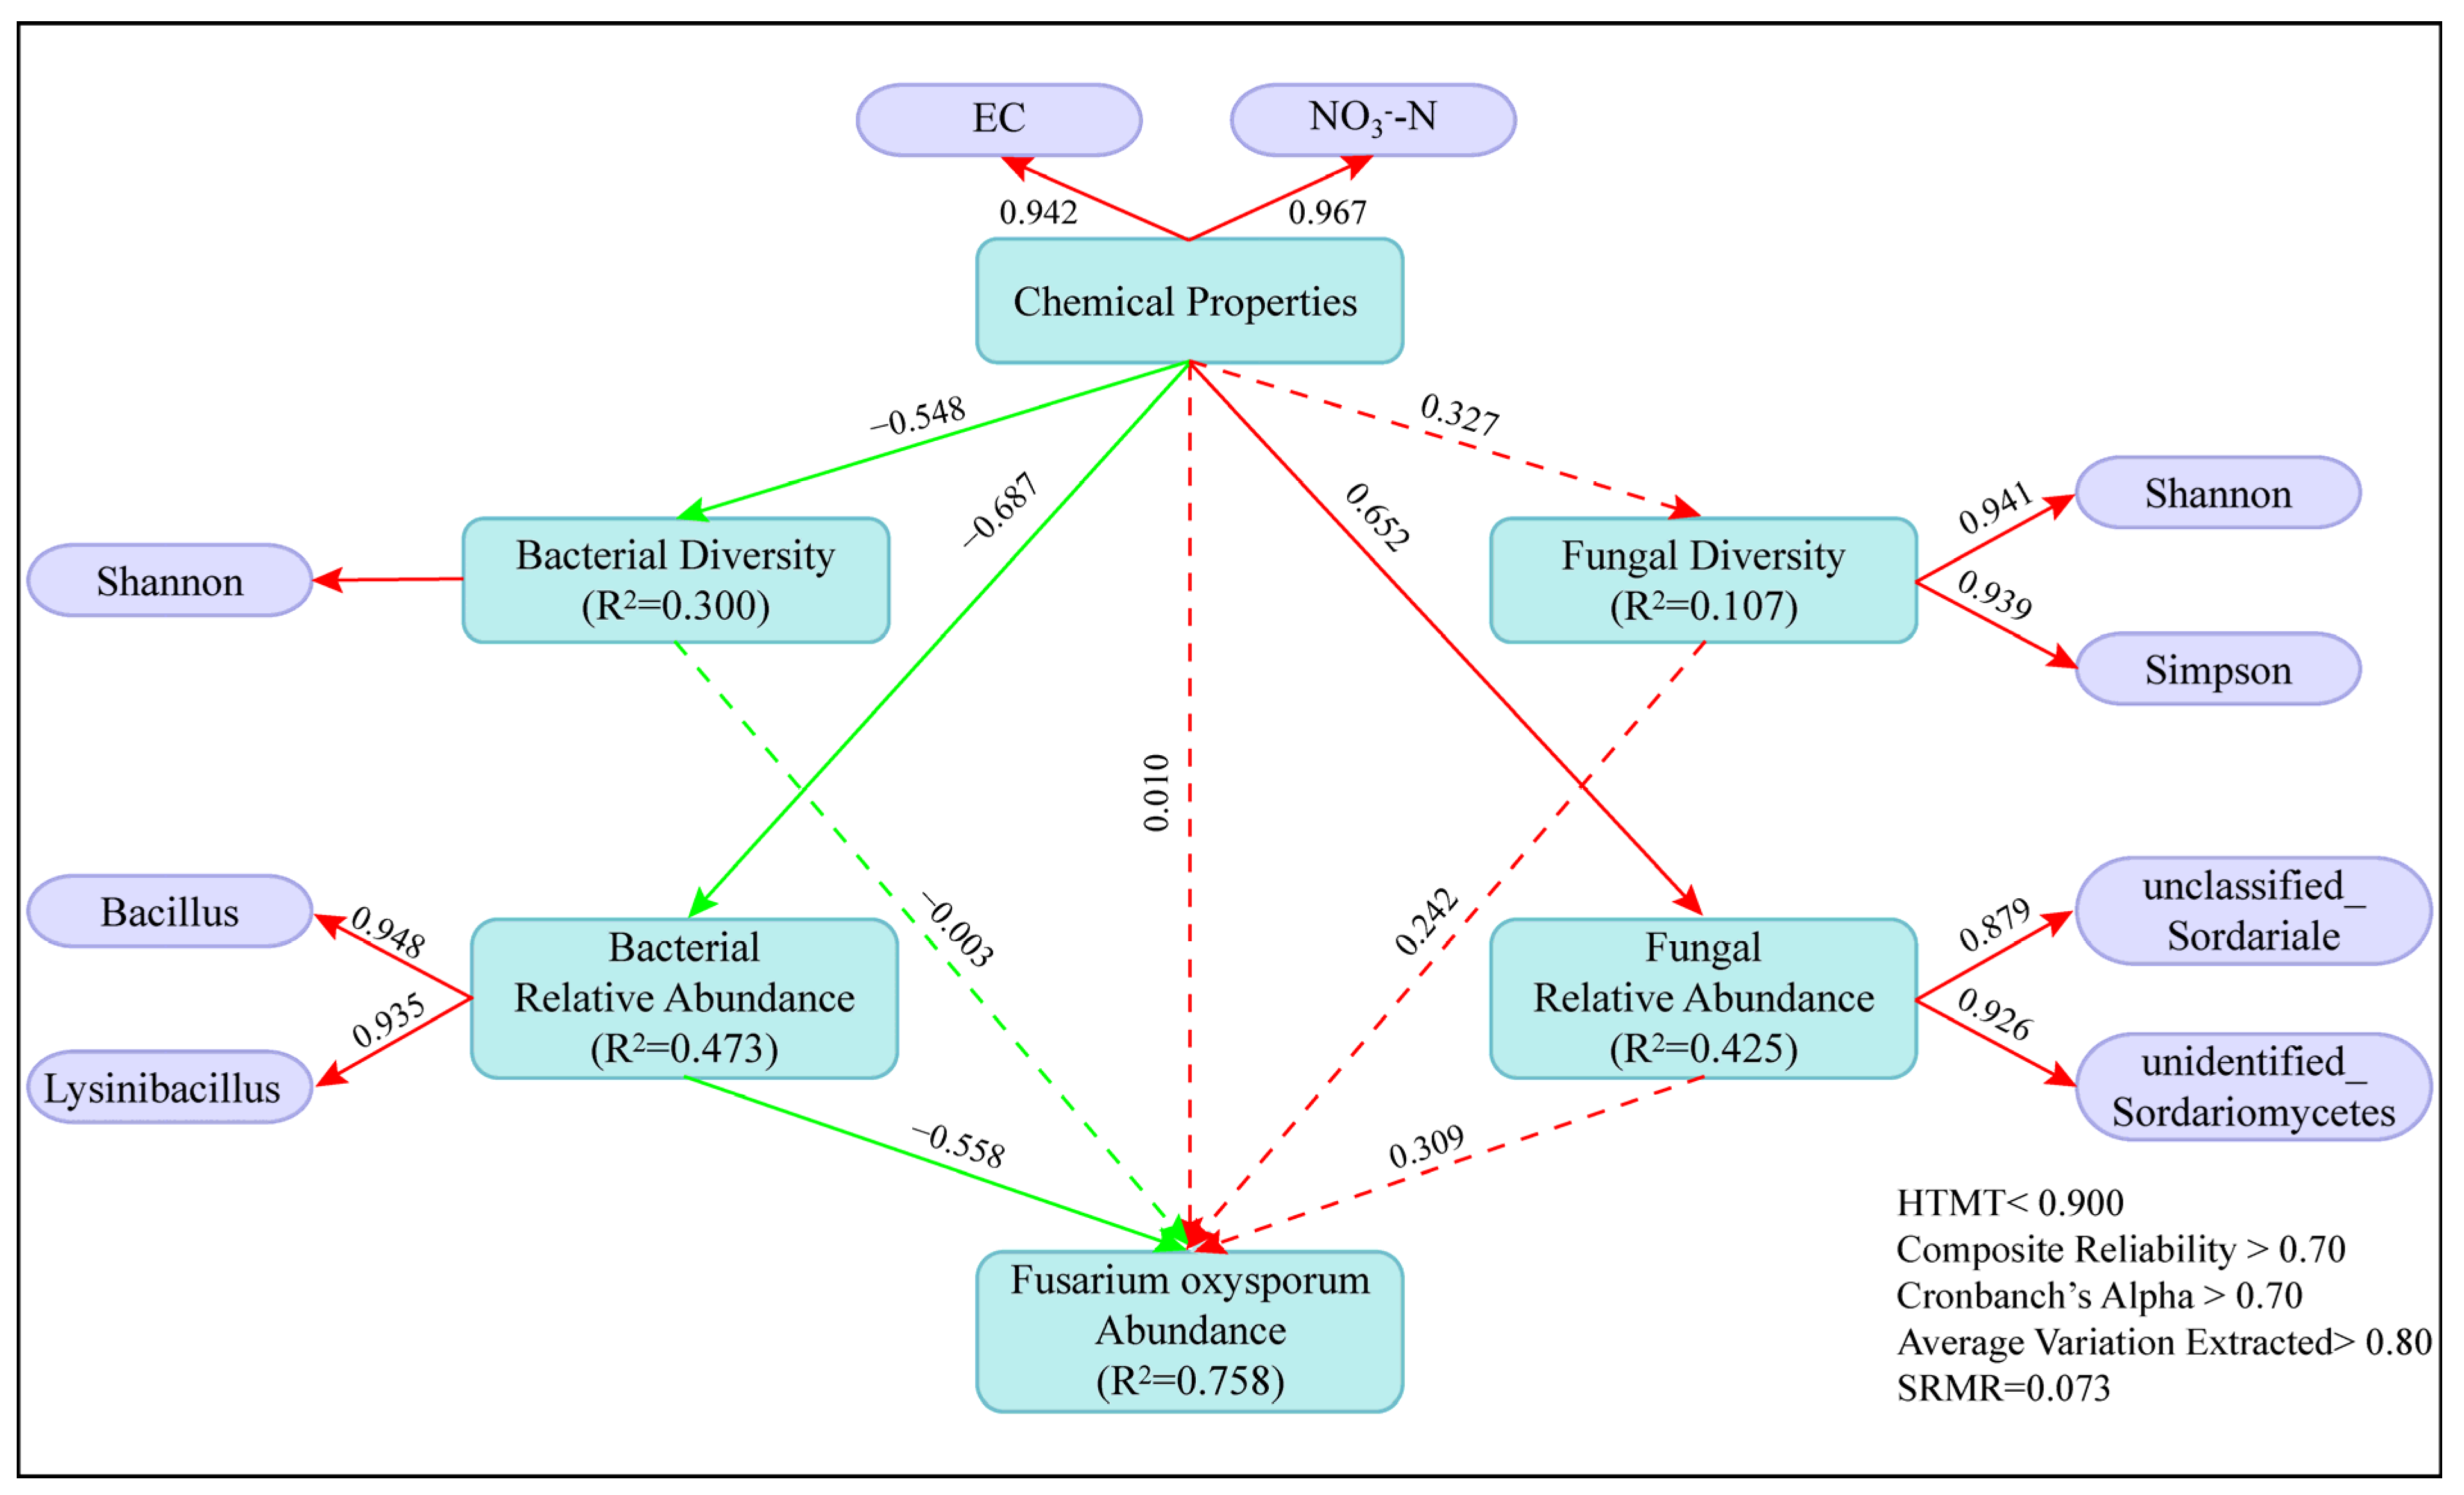
3.6. Direct and Indirect Effects of Soil Factors on the Abundance of Pathogen Fusarium Oxysporum in Greenhouse Tomato Soils

Pearson correlation analysis showed that the copy number of Fol in greenhouse tomato soil was significantly positively correlated with the EC, NO3–N, AN, and AK content and significantly negatively correlated with pH (Figure S3). The main microbial predictors related to Fol abundance were identified using the random forest analysis. Bacillaceae and Planococcaceae, belonging to the phylum Firmicutes, were the most important bacterial predictors at the family level (Figure 4a). Bacillus and Lysinibacillus (Firmicutes) and Chryseolinea and Gemmatimonas (Gemmatimonadetes) were the most important bacterial predictors at the genus level (Figure 4b). Unidentified_Sordariomycetes and unclassified_Sordariales, belonging to the phylum Ascomycota, were the most important fungal predictors at the family and genus levels, respectively (Figure 4c,d).
Fol abundance was positively correlated to Fusarium wilt incidence in greenhouse tomatoes (Figure S4). To further understand how soil chemical and microbial properties influence the Fol abundance in greenhouse soils and consequently regulate Fusarium wilt in greenhouse tomatoes, we constructed a PLS-SEM (Figure 5). The primary microbial predictors identified by random forest analysis were used to construct the model. The model fit indices indicated that the measurement model was reliable and valid and the structural model had a good fit. The SEM explained 75.8% of the variance in the RA of Fol in the greenhouse soils of planted tomatoes. The EC and NO3–N content in greenhouse soils were the main chemical properties affecting Fol abundance, although they did not have a significant direct impact on Fol abundance. Rather, they significantly and indirectly influenced Fol abundance by affecting the bacterial composition. An increase in the RA of Bacillus and Lysinibacillus significantly reduced Fol abundance. Soil chemical properties also significantly affected bacterial community alpha diversity and the RA of unidentified_Sordariomycetes and unclassified_Sordariales, although these factors were not significantly correlated with Fol abundance.

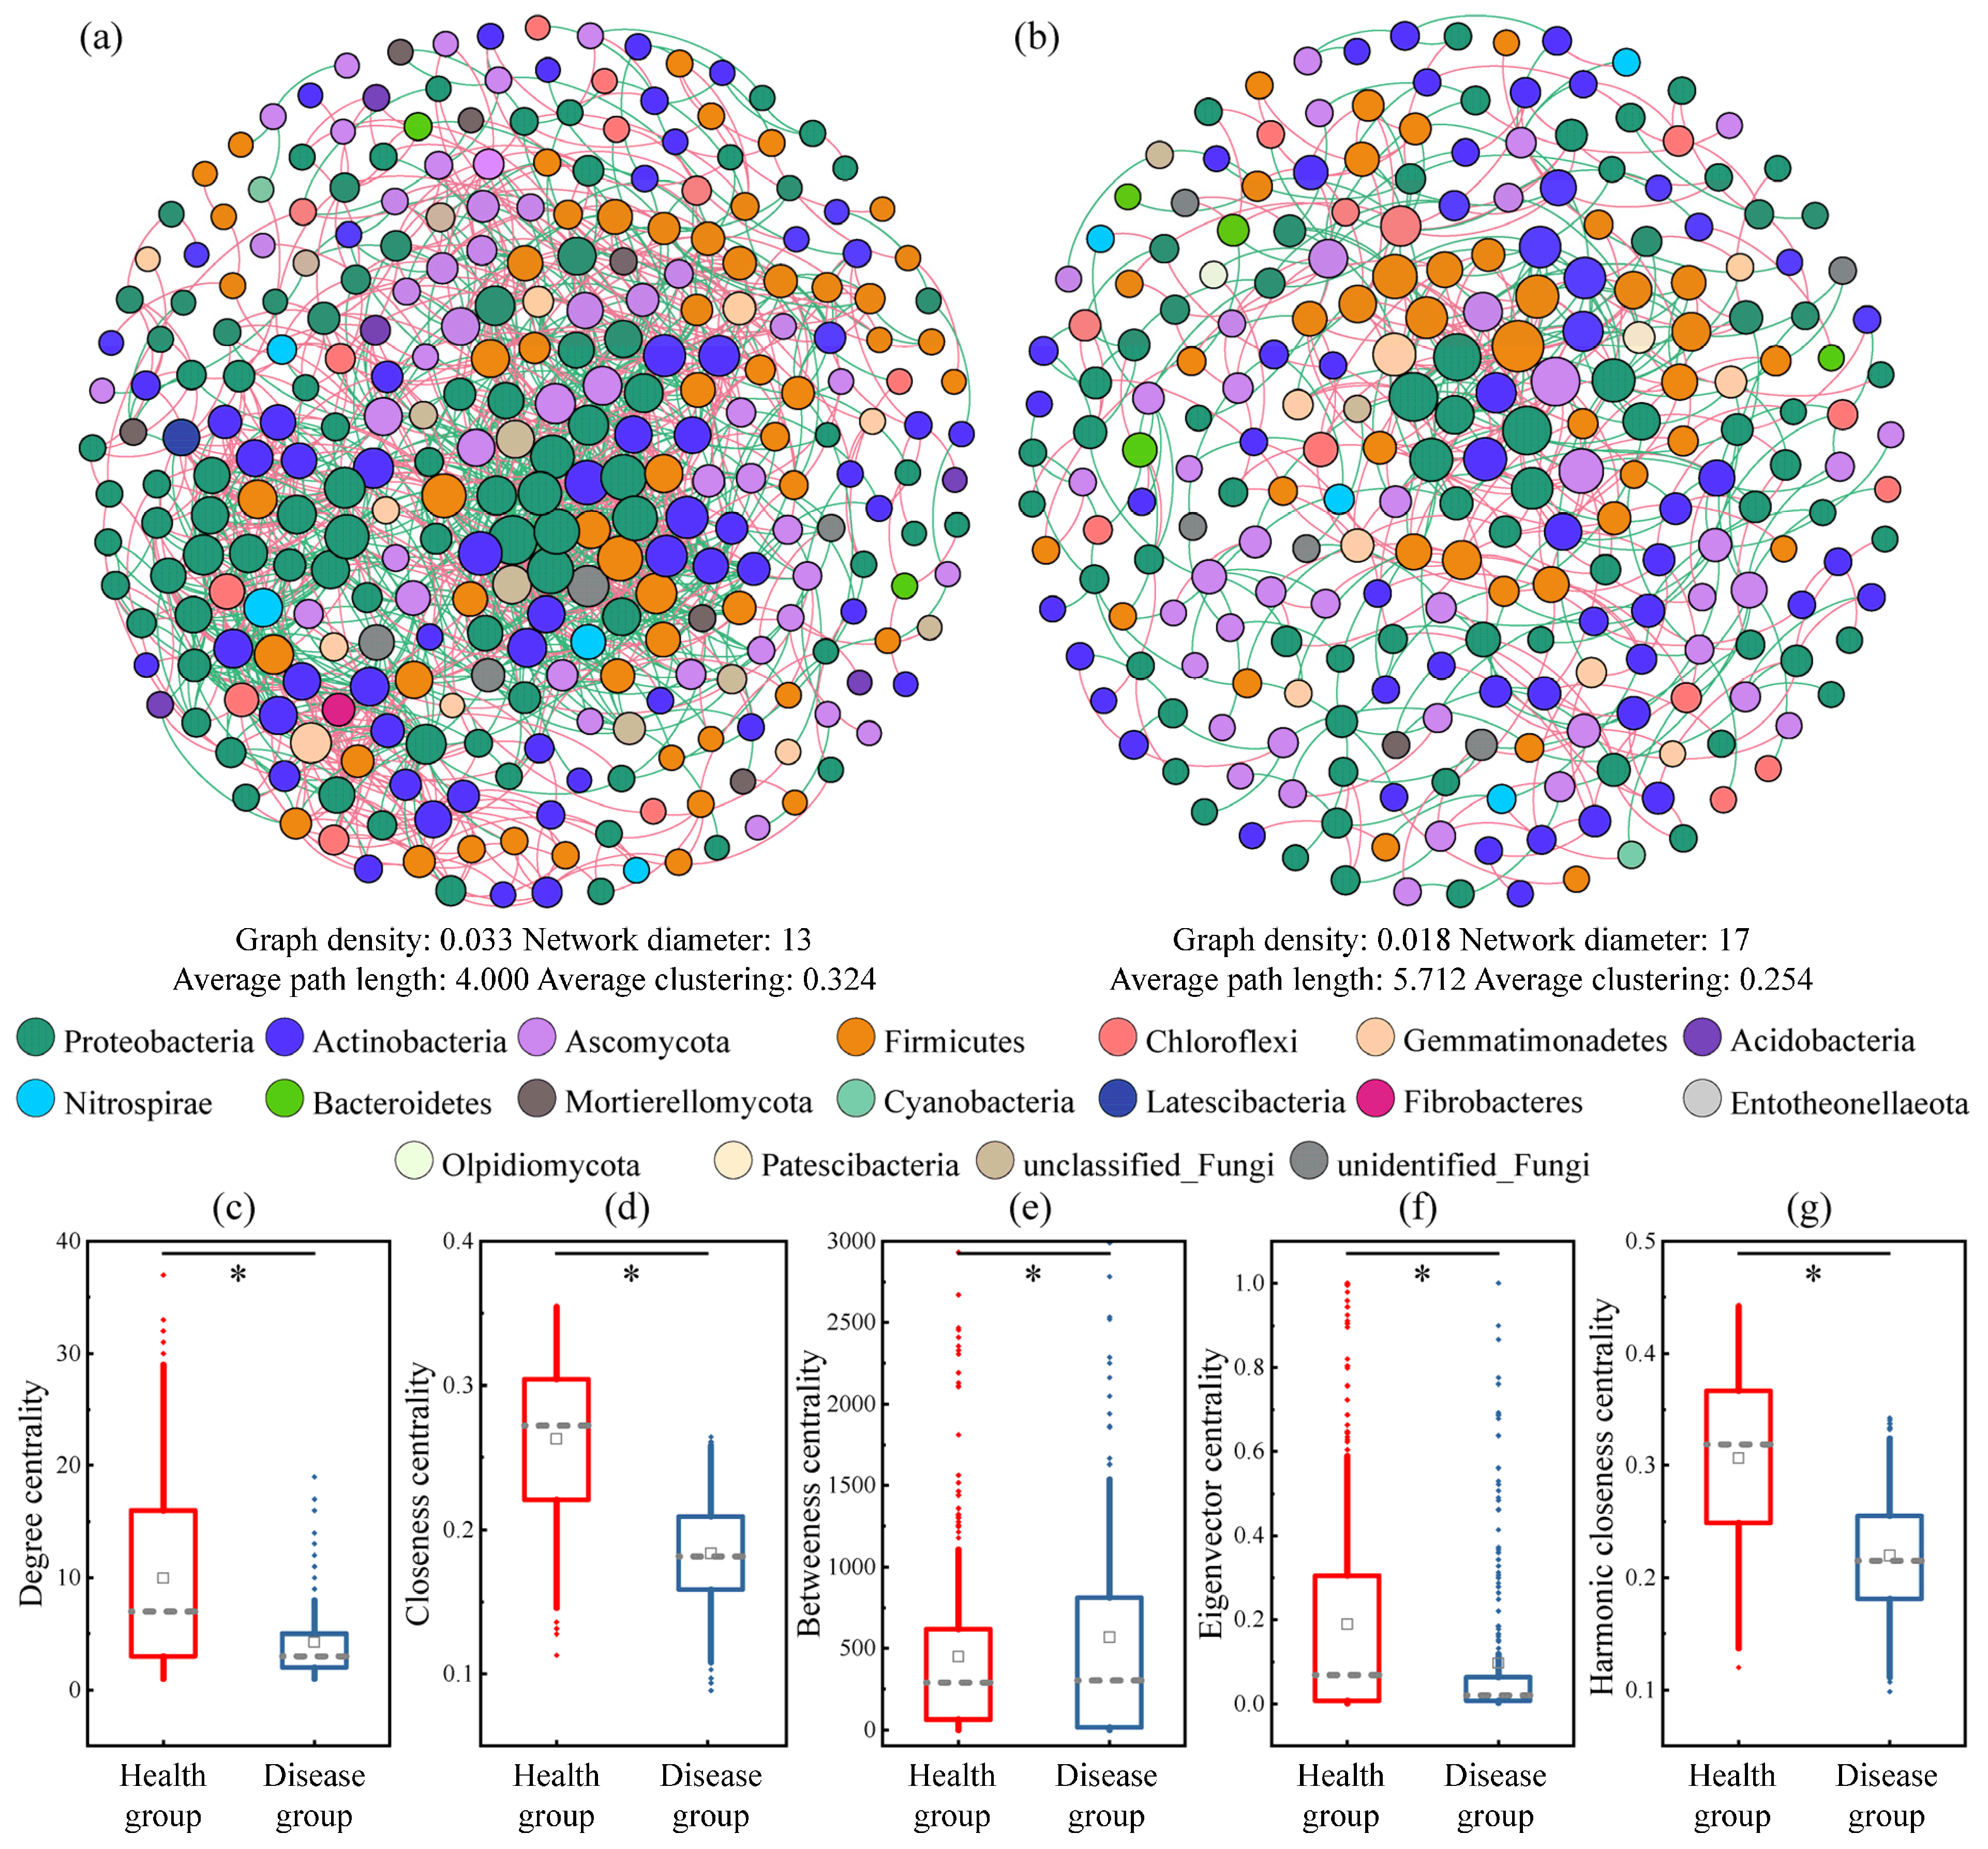
3.7. Differences in Co-Occurrence Networks of Soil Microbial Communities between the Health and Disease Groups of Greenhouse Tomatoes

To explore the response of the microbial co-occurrence network to Fusarium wilt in greenhouse tomatoes, we constructed ASV co-occurrence networks of bacteria and fungi for the Health and Disease groups (Figure 6a,b) and analyzed the fungi–fungi, bacteria–bacteria, and bacteria–fungi interaction characteristics. The Health group network consisted of 299 nodes (79.60% bacteria, 20.40% fungi) and 1487 edges (74.65% bacteria–bacteria, 7.80% fungi–fungi, and 17.55% bacteria–fungi), with 49.56% of the edges being negatively correlated. The Disease group network consisted of 241 nodes (79.25% bacteria and 20.75% fungi) and 513 edges (69.01% bacteria–bacteria, 5.26% fungi–fungi, and 25.73% bacteria–fungi), with 46.01% of the edges negatively correlated. Among the bacteria–bacteria, fungi–fungi, and bacteria–fungi interactions, the most significant change in the ratio of positive/negative correlations was observed for bacteria–fungi interactions. The proportion of negative correlations in bacteria–fungi interactions decreased by 22.37% in the Disease group compared with the Health group (Table 3). The average clustering coefficients of the networks for the Health and Disease soils were 0.324 and 0.254, with average path lengths of 4.000 and 5.712, respectively. Network centrality measures, including degree, closeness, eigenvector, and harmonic closeness centralities, were significantly higher in the Health group than in the Disease group (Figure 6c,d,f,g; p < 0.05), whereas the betweenness centrality was significantly lower in the Health group compared with the Disease group (Figure 6e).

4. Discussion

4.1. Effect of Soil Nutrient Enrichment on Tomato Fusarium Wilt in Greenhouses

In this study, we observed significant nutrient accumulation in the soil of the tomato Fusarium wilt Disease group. Compared with the Health group, the contents of TN, NO3–N, AN, and AP in the soil of the Disease group significantly increased by 68.23–73.53%, 168.83–185.58%, 59.65–82.49%, and 12.63–13.69%, respectively. Moreover, NO3–N showed the most significant increase (Table 1). The number of greenhouse cultivation years in the Disease group was generally greater than that in the Health group, resulting in a higher total fertilizer input and soil nutrient accumulation [8]. In greenhouse tomato cultivation, considering the cost and efficiency, the inputs of nitrogen and phosphorus fertilizers are usually increased, whereas the use of potassium fertilizer is relatively low [38]. This resulted in no significant differences in the AK content but obvious differences in N and p contents between the Health and Disease groups (Table 1). Under greenhouse cultivation conditions, a high-temperature and humid environment rapidly facilitates the conversion of NH4+–N and urea into NO3–N (not exceeding two weeks) [39]. Therefore, the readily available nitrogen in greenhouse soils primarily exists as NO3–N, and no significant differences in the NH4+–N content were observed between the Health and Disease groups (Table 1). Nitrogen is converted to NO3–N through nitrification, which releases H+, thereby increasing soil acidity [40]. Therefore, NO3–N accumulation was one of the reasons for the significantly lower soil pH in the Disease group compared with that in the Health group. In addition, a significant decrease in pH was associated with salt ion content (EC and K+) (Figure 3). Increased salt concentrations in the soil solution cause a salinity effect, thereby displacing other cations, such as Ca2+ and Mg2+, which also leads to soil acidification [41,42]. Soil EC is an important indicator of the total salt concentration in soil solutions. In the present study, the soil of the Disease group had a higher salt concentration than that of the Health group, although large fluctuations in EC did not cause significant differences between the groups. The drip irrigation system reduced salt accumulation in the topsoil; however, high transpiration rates in greenhouse agriculture caused some salts to reaccumulate in the surface soil with moisture movement [43,44]. Thus, the interaction of these factors leads to fluctuations in soil salinity (EC) in greenhouses.
Soil physicochemical properties are crucial driving factors that shape rhizosphere microbial communities [45]. According to the RDA and Mantel results, NO3–N content and pH in soil were the primary factors influencing the bacterial distribution between the Disease and Health groups, although these two factors showed weak correlation with the fungal distribution. The pH values of the greenhouse soils collected in this study were 6.44–7.56, classifying them as neutral soils [46]. In a neutral pH environment, the diversity, structure, and function of microbial communities are relatively stable [47,48]. The decrease in pH in the Disease group was merely a manifestation of the NO3–N or salt ion accumulation and may not have caused Fusarium wilt. This was also supported by the PLS-SEM. In this model, the chemical factors associated with Fol abundance were soil EC and NO3–N content. In greenhouse cultivation, excessive application of nitrogen fertilizer is the main factor leading to NO3–N accumulation and salinity [49]. In the present study, the NO3–N content in the Health group was 46.19–110.83 mg kg−1, which promoted and stabilized production. The likelihood of Fusarium wilt increased when the NO3–N content exceeded 170.43 mg kg−1. Therefore, the accumulation of NO3–N in the soil represents a key chemical factor causing the occurrence of Fusarium wilt in greenhouse tomatoes. Thus, maintaining appropriate NO3–N levels helps preserve the soil microbial balance and prevent increased disease risk due to excessive nitrogen.

4.2. Relationship between Fusarium Wilt of Greenhouse Tomatoes and the Diversity and Composition of Rhizosphere Soil Microorganisms

Reduced soil diversity increases the risk of plants getting infected by pathogens. For example, the rhizosphere soil microbial diversity of plants affected by F. oxysporum-induced banana Fusarium wilt and Ralstonia-induced tobacco bacterial wilt was significantly lower than that of healthy plants [50,51]. Our study also revealed that the richness and evenness of bacterial communities in the rhizosphere soil of the Disease group were significantly lower than those of the Health group, whereas the richness and evenness of the fungal community did not significantly differ between the two groups. However, other studies have reported a positive correlation between microbial diversity and soil-borne diseases. For instance, Huang et al. [52] found that the rhizosphere soil of Eustoma grandiflorum affected by Fusarium wilt showed significantly higher bacterial diversity. Additionally, Zhao et al. [53] found that the incidence of tomato Fusarium wilt was not correlated with fungal diversity and only had a marginal relationship with bacterial diversity. They suggested that the inhibition of pathogens by the ecosystem may be related to the RA of a few microbial groups rather than the overall diversity. Minor changes in the soil environment can cause fluctuations in microbial diversity, particularly that of bacteria. Thus, diversity may not be a determining factor for soil-borne diseases [54]. In our study, heavy fertilization resulted in significant short-term changes in the soil environment. In addition, the accumulation of allelochemicals released by plant roots may inhibit the growth of some bacteria, leading to decreased bacterial diversity [55,56]. Therefore, changes in bacterial diversity are a response to alterations in the soil environment but are not a necessary factor underlying tomato Fusarium wilt. The occurrence of tomato Fusarium wilt was more likely to be associated with the specific composition of bacterial communities.
The rhizosphere soil of the Health group contained more biomarkers associated with soil-borne diseases and plant health, whereas that of the Disease group contained more pathogens and biomarkers that decreased the soil antibacterial function (Figure 2). The bacterial community of the Health group contained more bacteria with biocontrol potential, including Bacillus [57], Lysinibacillus [58], Rhizobiales [59], Pseudomonas [60], Burkholderiaceae [61], and Microbacteriaceae [62]. Additionally, the Health group had a higher RA of Skermanella, which plays a crucial role in nitrogen cycling through ammonia oxidation and nitrification [63]. The rhizosphere soil of the Disease group contained more intestinal bacteria, such as Turicibacter, Terrisporobacter, and Clostridium_sensu_stricto_1, which were introduced through manure application. These bacteria can transfer antibiotic resistance genes (ARGs) to other microorganisms via transposons, thereby weakening the soil’s natural biological defenses and the effectiveness of pathogen control methods [64]. Actinoplanes modulate plant hormones to promote growth and alleviate stress, thereby enhancing plant adaptability and survival ability [65]. However, the RA of this genus was higher in the Disease group. This occurs when plant roots adjust their exudates to recruit beneficial microorganisms when attacked by soil-borne pathogens [66], which may explain the higher abundance of Actinoplanes in the Disease group. However, the role of this bacterium was insufficient to suppress Fusarium wilt in tomatoes. At present, Acidibacter does not directly cause plant diseases but shows environmental resilience and can thrive in the nutrient-rich Disease group soils [67].
In the fungal community, the RA of Penicillium and unclassified Chaetomiaceae in the Health group was significantly higher than that in the Disease group. These genera are known for their antibiotic production and antifungal activity [68,69]. The RA of Sarocladium and Fusarium was significantly higher in the Disease group than the Health group. These fungi are known plant pathogens that can cause various plant diseases, including sheath rot and Fusarium wilt [5,70]. In addition to the above-mentioned disease-related fungi, the Health group exhibited a greater abundance of Thermomyces, Remersonia, Penicillium, and Lophotrichus. The Disease group showed a higher abundance of Microascus, Retroconis, and Sordariales. These fungi are primarily involved in the degradation of organic substances, such as cellulose and lignin, and less directly associated with plant diseases [71,72]. The results indicate that the rhizosphere soil of the Health group contains a higher abundance of antibiotic-producing fungi, while the Disease group has a higher abundance of pathogenic fungi. This variation in fungal populations may be the reason for the higher disease incidence observed in the tomatoes of the Disease group compared with those in the Health group.
By analyzing the functions of biomarkers between the two groups, we found that the occurrence of Fusarium wilt in greenhouse tomatoes may be related to the specific composition of the bacterial communities and their biocontrol effects. The RA of biocontrol microorganisms was higher in the rhizosphere soil of most healthy plants; however, the specific species have varied among different studies [16,51,62]. These differences may be related to the type of crop, the specificity of antagonistic microorganisms to pathogens, and the specificity of these antagonistic microorganisms to the soil environment.

4.3. Changes in Bacterial Communities Caused by NO3–N Accumulation in Greenhouse Soils Are Key to the Increased Fol Abundance

Fol invasion is the fundamental cause of tomato Fusarium wilt [17]. In the present study, Fol abundance in the soil of the Disease group was significantly higher than that in the Health group and was positively correlated with the tomato Fusarium wilt DI (p < 0.05). Additionally, the tomato rhizosphere soil of the Health and Disease groups showed significant differences in chemical elements and microbial community composition, indicating a correlation between soil environmental factors and Fol abundance. According to the PLS-SEM results, the NO3–N content and EC in greenhouse soils indirectly regulated Fol abundance by altering the RA of the bacterial communities (Figure 5). The correlation between chemical properties and bacterial communities was significantly higher than that between the chemical properties and fungal communities. The RDA results (Figure 3b,d) also supported this finding. However, Huang et al. [52] showed that although the soil microbial communities of E. grandiflorum significantly differed with varying levels of Fusarium wilt, their assembly was random and exhibited little correlation with the physicochemical properties of the soil. This conclusion differs from the findings of our study and may be attributed to the experimental conditions of Huang et al. [52], who conducted their study in the same greenhouse with uniform fertilization and irrigation strategies. However, even under such standardized conditions, their data showed an increasing trend of NO3–N content in the soil based on the severity of Fusarium wilt and significantly lower contents in the soil of healthy plants relative to that of infected and dying plants. This further supports our hypothesis that the NO3–N concentration in the greenhouse soil may be a critical factor influencing the occurrence of tomato Fusarium wilt.
The NO3–N content in greenhouse soil is positively correlated with EC (Figure 3b) and represents one of the main components of soil salinity [8]. In the present study, the NO3–N content in the Disease group reached 240 mg kg−1, which was 1.5-fold higher than that in the Health group. The PLS-SEM indicated that, in the bacterial community, the enhanced contents of EC and NO3–N in greenhouse soils negatively affected the RA of Bacillus and Lysinibacillus. High NO3–N concentrations cause secondary soil salinization, resulting in salt stress conditions that inhibit the growth and reproductive capacity of Bacillus and Lysinibacillus [73]. Despite certain strains of Bacillus and Lysinibacillus possessing nitrate reductase capabilities, although high NO3 concentrations exceed the nitrate reductase capacity of these soil microorganisms, resulting in the accumulation of NO3 reduction byproducts (NO2) [74]. NO2 accumulation is toxic to most bacteria and causes lower growth and survival rates [75]. In contrast, F. oxysporum exhibited a strong assimilation capacity for NO3–N and presents effective nitrate reduction and denitrification systems, including three nitrate reductase genes (nit1, nit2, and nit3) and a high-affinity nitrate/nitrite transporter gene (nrt1). These systems enable Fol to effectively use NO3–N as a nitrogen source under aerobic and anaerobic conditions [76,77]. Moreover, Gomez-Gil et al. [76] demonstrated that F. oxysporum activates virulence-related functions when NO3–N is used as a nitrogen source. Based on these, the accumulation of NO3–N inhibits the growth and propagation of disease-suppressive bacteria while being beneficial for the growth of Fol. Therefore, NO3–N accumulation in greenhouses is a critical soil factor contributing to the severity of tomato Fusarium wilt.

4.4. Nutrification of Greenhouse Soils Alters Microbial Networks and Increases Pathogen Invasion Risk

The interactions of soil microbial communities, as holistic co-occurrence networks, influence the occurrence of plant diseases [78]. In the present study, we observed significant differences in the soil microbial networks between the Health and Disease groups of greenhouse tomatoes. The Health group demonstrated higher complexity, connectivity, and stability, as indicated by the increased number of nodes and edges and higher network topology coefficients (Figure 6). This network structure exhibits stronger resistance and buffering capacity against external disturbances and thus more effectively defends against pathogen intrusion [22,79]. This is consistent with the findings of Guo et al. on peanut stem rot [80]. Microbial communities increase their cooperation and competition to survive in soils with low inputs and limited nutrient resources, thereby leading to greater connectivity and complexity within the microbial network [81,82]. This finding implies that interactions among microbial communities may decrease in the nutrient-enriched Disease group. This results in decreased connectivity of the microbial network. This increases the risk of further plant invasion by pathogens, including F. oxysporum.
In this study, variations in bacterial-fungal interactions within the microbial co-occurrence network were the most significant between the Health and Disease groups. The number of microbial interactions in the Disease group was only 34.50% of that in the Health group. Moreover, the proportion of bacterial-fungal interactions relative to the total number of microbial interactions increased by 8.18% in the Disease group compared with the Health group. However, the proportion of negative bacterial-fungal interactions within the bacterial-fungal interactions in the Disease group decreased by 22.37% compared with that in the Health group. Guo et al. [80] did not find significant changes in the number of bacterial-fungal interactions between the Health and Disease groups, although they observed a significant increase in fungal-fungal interactions in the Disease group, which was likely due to the increased abundance of the pathogen Athelia rolfsii. In the present study, we considered the shift in bacterial-fungal relationships as a factor contributing to disease occurrence, with the competitive relationship (negative impact) of bacteria on fungi significantly reduced in the Disease group. Competitive relationships are predominant in nutrient-poor soil environments and aid in maintaining the synergistic oscillation and network stability of microbial communities [78]. Therefore, soil nutrient enrichment may diminish the competition between bacteria and fungi, thereby reducing network stability. The occurrence of tomato Fusarium wilt is associated with a reduced competitive effect of bacteria on fungi. Additionally, in the co-occurrence network of the Health group, many bacteria did not show clearly beneficial functions according to the negative bacterial-fungal correlations. According to Wen et al. [83], bacteria with no apparent beneficial functions are present in the soil and compete with pathogens for ecological niches, thereby inhibiting pathogen reproduction. Consequently, soil eutrophication not only significantly impacts the bacterial structure but also disrupts the mutual constraints between bacteria and fungi, thereby weakening competition. This change alters the original microbial network relationships, increasing the likelihood of infection by tomato Fusarium wilt.

4.5. Implications and Limitations

In greenhouse agriculture, the reliance on large quantities of fertilizer to sustain crop yields leads to excessive nutrient enrichment in the soil. This practice disrupts microbial balance, thereby increasing the risk of soil-borne diseases in greenhouses. A limitation of this study is that it did not fully elucidate the deeper mechanisms by which soil nutrient enrichment in greenhouse agriculture triggers Fusarium wilt. For instance, whether nitrate reductase activity in biocontrol bacteria (e.g., Bacillus spp.) is a critical factor constraining their RA remains unclear. Further research is required to determine the specific thresholds at which nutrient accumulation in the soil increases the risk of soil-borne diseases. When developing biocontrol strategies, the adaptability of microorganisms to nutrient-rich environments must be considered. Additionally, this study observed significant changes in microbial communities that were unrelated to nutrient enrichment. These changes may be linked to factors such as the high temperature and humidity of greenhouses, the type of organic fertilizer used, or monocropping practices. Given the unique conditions of greenhouse agriculture, the patterns of soil-borne diseases may differ from those in open-field systems, necessitating further extensive and comprehensive research.

5. Conclusions

In greenhouse agriculture, the response of bacterial communities to soil NO3–N is a key factor driving Fusarium wilt in greenhouse tomatoes. Compared with the Health group, the soil of the Disease group showed significant enrichment of different elements, especially NO3–N. This enrichment in greenhouse soil indirectly influenced Fol abundance by altering the bacterial community composition. Specifically, increased NO3–N contents (exceeds 170.43 mg kg-1) inhibited the growth of biocontrol bacteria, such as Bacillus and Lysinibacillus, reshaped the soil microbial community, and consequently reduced the resistance of the greenhouse soil to pathogens. In the Disease group, decreases in the complexity and stability of the microbial network and the competitive relationship between bacteria and fungi reduced, which increased the likelihood of Fol infection. Therefore, we should take into account the interaction among soil nutrients, microbial community structures, and soil-borne diseases during the crop planting process and achieve the goal of ensuring crop health and increasing crop yield through reasonable fertilization. Our findings offer new insights into the mechanisms underlying the effects of nutrient enrichment in greenhouse soils on soil-borne disease occurrence, thus providing valuable guidance for agricultural sustainable practices.

Supplementary Materials

The following supporting information can be downloaded at: https://www.mdpi.com/article/10.3390/su16177756/s1, Figure S1. The prior model of partial least squares structural equation in this study; Figure S2. Mean relative abundance (RA) of major bacterial and fungal phyla in soil of health and disease-intensive systems (Mean RA > 0.05%). * indicates significant difference among treatments at the p < 0.05 level (Turkey test); Figure S3. The relationship between chemical properties and Fusarium oxysporum abundance in rhizosphere soil of greenhouse tomato. *, **, and *** indicate the p < 0.05. p < 0.01 and p < 0.001 level, respectively (Turkey test).; Figure S4. Correlation between the incidence index of tomato Fusarium wilt disease in greenhouses and Fusarium oxysporum copy number.

Author Contributions

Conceptualization, Y.Y.; Data curation, L.Y.; Formal analysis, L.Y.; Funding acquisition, S.L. and W.H.; Investigation, L.Y. and B.T.; Methodology, L.Y., B.T., and Y.Y.; Project administration, S.L. and W.H.; Resources, W.H. and Y.Y.; Software, L.Y. and B.T.; Supervision, W.H. and Y.Y.; Validation, B.T., W.H., and Y.Y.; Visualization, L.Y.; Writing—original draft, L.Y.; Writing—review and editing, L.Y., B.T., Y.W., S.L., W.H., and Y.Y. All authors have read and agreed to the published version of the manuscript.

Funding

This research was funded by [the National Key R&D Program of China] grant number [2023YFD1500303] and [the Scientific Research Project of Science and Technology of Liaoning Province] grant number [2022-MS-254].

Institutional Review Board Statement

Not applicable.

Informed Consent Statement

Not applicable.

Data Availability Statement

Dataset available on request from the authors.

Acknowledgments

We are grateful for the facilities provided by Shenyang Agricultural University. We would also like to express our gratitude to the professors and members of our research group for their invaluable support in various aspects, including sampling, manuscript correction, and logical structuring of the writing.

Conflicts of Interest

The authors declare no conflicts of interest.

References

  1. Singh, N.; Siddiqui, Z.A. Effects of Bacillus subtilis, Pseudomonas fluorescens and Aspergillus awamori on the Wilt-Leaf Spot Disease Complex of Tomato. Phytoparasitica 2014, 43, 61–75. [Google Scholar] [CrossRef]
  2. FAOSTAT. Crops and Livestock Products; FAO: Rome, Italy, 2021; Available online: https://www.fao.org/faostat/en/#data/QCL (accessed on 24 August 2024).
  3. Scheffer, R.P.; Walker, J.C. The Physiology of Fusarium Wilt of Tomato. Phytopathology 1953, 43, 116–125. [Google Scholar]
  4. Nofal, A.; El-Rahman, M.; Abdelghany, T.; AbdEl-Mongy, M. Mycoparasitic Nature of Egyptian Trichoderma Isolates and Their Impact on Suppression of Fusarium Wilt of Tomato. Egypt. J. Pest Control 2021, 31, 103. [Google Scholar] [CrossRef]
  5. Massee, G. The “sleepy disease” of tomatoes. Gard. Chron. Ser. 1896, 3, 707–708. [Google Scholar]
  6. Cai, Z. Scientific and Technological Issues of Nutrient Management under Greenhouse Cultivation in China. Acta Pedol. Sin. 2019, 56, 36–43. [Google Scholar] [CrossRef]
  7. Worku, M.; Sahela, S. Review on Disease Management Practice of Tomato Wilt Caused Fusarium oxysporum in Case of Ethiopia. J. Plant Pathol. Microbiol. 2018, 9, 2. [Google Scholar] [CrossRef]
  8. Sun, H.W.; Wei, C.; Xu, W.S.; Yang, J.Z.; Wang, X.G.; Qiu, Y.F. Characteristics of Salt Contents in Soils under Greenhouse Conditions in China. Environ. Sci. Pollut. Res. 2019, 26, 3882–3892. [Google Scholar] [CrossRef]
  9. Hu, Y.C.; Song, Z.W.; Lu, W.L.; Poschenrieder, C.; Schmidhalter, U. Current Soil Nutrient Status of Intensively Managed Greenhouses. Pedosphere 2012, 22, 825–833. [Google Scholar] [CrossRef]
  10. Hoffland, E.; Jeger, M.J.; van Beusichem, M.L. Effect of Nitrogen Supply Rate on Disease Resistance in Tomato Depends on the Pathogen. Plant Soil 2000, 218, 239–247. [Google Scholar] [CrossRef]
  11. Gu, Z.; Wang, M.; Wang, Y.; Zhu, L.; Mur, L.A.J.; Hu, J. Nitrate Stabilizes the Rhizospheric Fungal Community to Suppress Fusarium Wilt Disease in Cucumber. Mol. Plant Microbe Interact. 2020, 33, 590–599. [Google Scholar] [CrossRef]
  12. Long, D.H.; Lee, F.N.; TeBeest, D.O. Effect of Nitrogen Fertilization on Disease Progress of Rice Blast on Susceptible and Resistant Cultivars. Plant Dis. 2000, 84, 403–409. [Google Scholar] [CrossRef] [PubMed]
  13. Easterday, C.A.; Kendig, A.E.; Lacroix, C.; Seabloom, E.W.; Borer, E.T. Long-Term Nitrogen Enrichment Mediates the Effects of Nitrogen Supply and Co-Inoculation on a Viral Pathogen. Ecol. Evol. 2022, 12, e8450. [Google Scholar] [CrossRef] [PubMed]
  14. Mousa, M.A.A.; Abo-Elyousr, K.A.M.; Abdel Alal, A.M.K.; Alshareef, N.O. Management of Fusarium Wilt Disease in Tomato by Combinations of Bacillus amyloliquefaciens and Peppermint Oil. Agronomy 2021, 11, 2536. [Google Scholar] [CrossRef]
  15. Bastakoti, S.; Belbase, S.; Manandhar, S.; Arjyal, C. Trichoderma Species as Biocontrol Agent against Soil Borne Fungal Pathogens. Nepal J. Biotechnol. 2017, 5, 39–45. [Google Scholar] [CrossRef]
  16. Jiao, X.L.; Zhang, X.S.; Lu, X.H.; Qin, R.; Bi, Y.M.; Gao, W.W. Effects of Maize Rotation on the Physicochemical Properties and Microbial Communities of American Ginseng Cultivated Soil. Sci. Rep. 2019, 9, 8615. [Google Scholar] [CrossRef]
  17. Beckman, C.H. The Nature of Wilt Diseases in Plants; APS Press: St. Paul, MN, USA, 1987; pp. 1–175. [Google Scholar]
  18. Gosling, P.; Mead, A.; Proctor, M.; Hammond, J.P.; Bending, G.D. Contrasting Arbuscular Mycorrhizal Communities Colonizing Different Host Plants Show a Similar Response to a Soil Phosphorus Concentration Gradient. New Phytol. 2013, 198, 546–556. [Google Scholar] [CrossRef]
  19. Watanabe, K.; Matsui, M.; Honjo, H.; Becker, J.O.; Fukui, R. Effects of Soil pH on Rhizoctonia Damping-Off of Sugar Beet and Disease Suppression Induced by Soil Amendment with Crop Residues. Plant Soil 2011, 347, 255–268. [Google Scholar] [CrossRef]
  20. Li, B.B.; Roley, S.S.; Duncan, D.S.; Guo, J.; Quensen, J.F.; Yu, H.Q.; Tiedje, J.M. Long-Term Excess Nitrogen Fertilizer Increases Sensitivity of Soil Microbial Community to Seasonal Change Revealed by Ecological Network and Metagenome Analyses. Soil Biol. Biochem. 2021, 160, 108349. [Google Scholar] [CrossRef]
  21. Berendsen, R.L.; Pieterse, C.M.; Bakker, P.A. The Rhizosphere Microbiome and Plant Health. Trends Plant Sci. 2012, 17, 478–486. [Google Scholar] [CrossRef]
  22. Santolini, M.; Barabasi, A.L. Predicting Perturbation Patterns from the Topology of Biological Networks. Proc. Natl. Acad. Sci. USA 2018, 115, E6375–E6383. [Google Scholar] [CrossRef]
  23. Cai, Z.; Wang, B.; Xu, M.; Zhang, H.; He, X.; Zhang, L.; Gao, S. Intensified Soil Acidification from Chemical N Fertilization and Prevention by Manure in an 18-Year Field Experiment in the Red Soil of Southern China. J. Soil. Sediment. 2014, 15, 260–270. [Google Scholar] [CrossRef]
  24. IUSS Working Group WRB. World Reference Base for Soil Resources 2006, First Update 2007; World Soil Resources Reports No. 103; FAO: Rome, Italy, 2007. [Google Scholar]
  25. Scherf, J.M.; Milling, A.; Allen, C. Moderate Temperature Fluctuations Rapidly Reduce the Viability of Ralstonia solanacearum Race 3, Biovar 2, in Infected Geranium, Tomato, and Potato Plants. Appl. Environ. Microbiol. 2010, 76, 7061–7067. [Google Scholar] [CrossRef] [PubMed]
  26. Zhao, J.; Mei, Z.; Zhang, X.; Xue, C.; Zhang, C.; Ma, T.; Zhang, S. Suppression of Fusarium Wilt of Cucumber by Ammonia Gas Fumigation via Reduction of Fusarium Population in the Field. Sci. Rep. 2017, 7, 43103. [Google Scholar] [CrossRef] [PubMed]
  27. Bao, S.D. Analytical Methods of Soil Agrochemistry, 3rd ed.; China Agricultural Press: Beijing, China, 2000. [Google Scholar]
  28. Dennis, K.L.; Wang, Y.W.; Blatner, N.R.; Wang, S.Y.; Saadalla, A.; Trudeau, E.; Roers, A.; Weaver, C.T.; Lee, J.J.; Gilbert, J.A.; et al. Adenomatous Polyps Are Driven by Microbe-Instigated Focal Inflammation and Are Controlled by IL-10-Producing T Cells. Cancer Res. 2013, 73, 5905–5913. [Google Scholar] [CrossRef] [PubMed]
  29. Manter, D.K.; Vivanco, J.M. Use of the ITS Primers, ITS1F and ITS4, to Characterize Fungal Abundance and Diversity in Mixed-Template Samples by qPCR and Length Heterogeneity Analysis. J. Microbiol. Methods 2007, 71, 7–14. [Google Scholar] [CrossRef]
  30. Lievens, B.; Houterman, P.M.; Rep, M. Effector Gene Screening Allows Unambiguous Identification of Fusarium oxysporum f. sp. lycopersici Races and Discrimination from Other Formae Speciales. FEMS Microbiol. Lett. 2009, 300, 201–215. [Google Scholar] [CrossRef]
  31. Walker, N.J. Real-Time and Quantitative PCR: Applications to Mechanism-Based Toxicology. J. Biochem. Mol. Toxicol. 2001, 15, 121–127. [Google Scholar] [CrossRef]
  32. Bolyen, E.; Rideout, J.R.; Dillon, M.R.; Bokulich, N.A.; Abnet, C.C.; Al-Ghalith, G.A.; Alexander, H.; Alm, E.J.; Arumugam, M.; Asnicar, F.; et al. Reproducible, Interactive, Scalable and Extensible Microbiome Data Science Using QIIME 2. Nat. Biotechnol. 2019, 37, 852–857. [Google Scholar] [CrossRef]
  33. Bokulich, N.A.; Kaehler, B.D.; Rideout, J.R.; Dillon, M.; Bolyen, E.; Knight, R.; Huttley, G.A.; Gregory Caporaso, J. Optimizing Taxonomic Classification of Marker-Gene Amplicon Sequences with QIIME 2’s q2-Feature-Classifier Plugin. Microbiome 2018, 6, 90. [Google Scholar] [CrossRef]
  34. Feng, K.; Peng, X.; Zhang, Z.; Gu, S.; He, Q.; Shen, W.; Wang, Z.; Wang, D.; Hu, Q.; Li, Y.; et al. iNAP: An Integrated Network Analysis Pipeline for Microbiome Studies. iMeta 2022, 1, e13. [Google Scholar] [CrossRef]
  35. Delgado-Baquerizo, M.; Gallardo, A.; Covelo, F.; Prado-Comesaña, A.; Ochoa, V.; Maestre, F.T.; Schweitzer, J. Differences in Thallus Chemistry Are Related to Species-Specific Effects of Biocrust-Forming Lichens on Soil Nutrients and Microbial Communities. Funct. Ecol. 2015, 29, 1087–1098. [Google Scholar] [CrossRef]
  36. Hair, J.F.; Hult, G.T.M.; Ringle, C.M.; Sarstedt, M. A Primer on Partial Least Squares Structural Equation Modeling (PLS-SEM), 3rd ed.; Sage Publications: Thousand Oaks, CA, USA, 2022. [Google Scholar]
  37. Bertrand, F.; Sanchez, G.; Trinchera, L.; Russolillo, G. plspm: Partial Least Squares Path Modeling (PLS-PM), R Package Version 0.5.1. 2024. Available online: https://cran.r-project.org/web/packages/plspm/index.html (accessed on 25 August 2024). [CrossRef]
  38. Du, L.Y.; Pan, D.W.; Zhang, H.L.; Liang, C.H.; Xu, Z.Q. Effects of Different Fertilization Treatments on Potassium Content in Soils under Vegetable Protection Cultivation. Chin. J. Soil Sci. 2006, 37, 945–949. [Google Scholar] [CrossRef]
  39. Elrys, A.S.; Desoky, E.M.; Abo El-Maati, M.F.; Elnahal, A.S.; Abdo, A.I.; Raza, S.; Zhou, J. Can Secondary Metabolites Extracted from Moringa Seeds Suppress Ammonia Oxidizers to Increase Nitrogen Use Efficiency and Reduce Nitrate Contamination in Potato Tubers? Ecotoxicol. Environ. Saf. 2019, 185, 109689. [Google Scholar] [CrossRef] [PubMed]
  40. Guo, J.H.; Liu, X.J.; Zhang, Y.; Shen, J.L.; Han, W.X.; Zhang, W.F.; Christie, P.; Goulding, K.W.; Vitousek, P.M.; Zhang, F.S. Significant acidification in major Chinese croplands. Science 2010, 327, 1008–1010. [Google Scholar] [CrossRef]
  41. Hue, N.V.; Adams, F.; Evans, C.E. Sulfate Retention by an Acid BE Horizon of an Ultisol. Soil Sci. Soc. Am. J. 1985, 49, 1196–1200. [Google Scholar] [CrossRef]
  42. Andrade Foronda, D.; Colinet, G. Prediction of Soil Salinity/Sodicity and Salt-Affected Soil Classes from Soluble Salt Ions Using Machine Learning Algorithms. Soil Syst. 2023, 7, 47. [Google Scholar] [CrossRef]
  43. Cucci, G.; Lacolla, G.; Mastro, M.A.; Caranfa, G. Leaching Effect of Rainfall on Soil under Four-Year Saline Water Irrigation. Soil Water Res. 2016, 11, 181–189. [Google Scholar] [CrossRef]
  44. Minhas, P.S.; Ramos, T.B.; Ben-Gal, A.; Pereira, L.S. Coping with Salinity in Irrigated Agriculture: Crop Evapotranspiration and Water Management Issues. Agric. Water Manag. 2020, 227, 105832. [Google Scholar] [CrossRef]
  45. Mendes, R.; Garbeva, P.; Raaijmakers, J.M. The Rhizosphere Microbiome: Significance of Plant Beneficial, Plant Pathogenic, and Human Pathogenic Microorganisms. FEMS Microbiol. Rev. 2013, 37, 634–663. [Google Scholar] [CrossRef]
  46. Weil, R.R.; Brady, N.C. The Nature and Properties of Soils, 15th ed.; Pearson: Columbus, OH, USA, 2016. [Google Scholar]
  47. Griffiths, R.I.; Whiteley, A.S.; O’Donnell, A.G.; Bailey, M.J. Rapid Method for Coextraction of DNA and RNA from Natural Environments for Analysis of Ribosomal DNA- and rRNA-Based Microbial Community Composition. Appl. Environ. Microbiol. 2000, 66, 5488–5491. [Google Scholar] [CrossRef]
  48. Lauber, C.L.; Hamady, M.; Knight, R.; Fierer, N. Pyrosequencing-Based Assessment of Soil pH as a Predictor of Soil Bacterial Community Structure at the Continental Scale. Appl. Environ. Microbiol. 2009, 75, 5111–5120. [Google Scholar] [CrossRef]
  49. Lou, Y.; Xu, M.; He, X.; Duan, Y.; Li, L. Soil Nitrate Distribution, N2O Emission, and Crop Performance after the Application of N Fertilizers to Greenhouse Vegetables. Soil Use Manag. 2012, 28, 299–306. [Google Scholar] [CrossRef]
  50. Sun, J.; Zou, L.; Li, W.; Yang, J.; Wang, Y.; Xia, Q.; Peng, M. Rhizosphere Soil Properties and Banana Fusarium Wilt Suppression Influenced by Combined Chemical and Organic Fertilizations. Agric. Ecosyst. Environ. 2018, 254, 60–68. [Google Scholar] [CrossRef]
  51. Yang, H.; Li, J.; Xiao, Y.; Gu, Y.; Liu, H.; Liang, Y.; Liu, X.; Hu, J.; Meng, D.; Yin, H. An Integrated Insight into the Relationship between Soil Microbial Community and Tobacco Bacterial Wilt Disease. Front. Microbiol. 2017, 8, 2179. [Google Scholar] [CrossRef]
  52. Huang, X.; Zhou, X.; Zhang, J.; Cai, Z. Highly Connected Taxa Located in the Microbial Network Are Prevalent in the Rhizosphere Soil of Healthy Plant. Biol. Fertil. Soils 2019, 55, 299–312. [Google Scholar] [CrossRef]
  53. Zhao, F.; Zhang, Y.; Dong, W.; Zhang, Y.; Zhang, G.; Sun, Z.; Yang, L. Vermicompost Can Suppress Fusarium oxysporum f. sp. lycopersici via Generation of Beneficial Bacteria in a Long-Term Tomato Monoculture Soil. Plant Soil 2019, 440, 491–505. [Google Scholar] [CrossRef]
  54. Janvier, C.; Villeneuve, F.; Alabouvette, C.; Edel-Hermann, V.; Mateille, T.; Steinberg, C. Soil Health through Soil Disease Suppression: Which Strategy from Descriptors to Indicators? Soil Biol. Biochem. 2007, 39, 1–23. [Google Scholar] [CrossRef]
  55. Shi, S.; Richardson, A.E.; O’Callaghan, M.; DeAngelis, K.M.; Jones, E.E.; Stewart, A.; Firestone, M.K.; Condron, L.M. Effects of Selected Root Exudate Components on Soil Bacterial Communities. FEMS Microbiol. Ecol. 2011, 77, 600–610. [Google Scholar] [CrossRef]
  56. Jilani, G.; Mahmood, S.; Chaudhry, A.N.; Hassan, I.; Akram, M. Allelochemicals: Sources, Toxicity and Microbial Transformation in Soil—A Review. Ann. Microbiol. 2008, 58, 351–357. Available online: https://annalsmicrobiology.biomedcentral.com/articles/10.1007/BF03175528 (accessed on 24 August 2024). [CrossRef]
  57. Xiong, W.; Guo, S.; Jousset, A.; Zhao, Q.; Wu, H.; Li, R.; Kowalchuk, G.A.; Shen, Q. Bio-Fertilizer Application Induces Soil Suppressiveness against Fusarium Wilt Disease by Reshaping the Soil Microbiome. Soil Biol. Biochem. 2017, 114, 238–247. [Google Scholar] [CrossRef]
  58. Jamal, Q.M.S.; Ahmad, V. Lysinibacilli: A Biological Factories Intended for Bio-Insecticidal, Bio-Control, and Bioremediation Activities. J. Fungi 2022, 8, 1288. [Google Scholar] [CrossRef] [PubMed]
  59. Volpiano, C.G.; Sant’Anna, F.H.; Ambrosini, A.; de Sao Jose, J.F.B.; Beneduzi, A.; Whitman, W.B.; de Souza, E.M.; Lisboa, B.B.; Vargas, L.K.; Passaglia, L.M.P. Genomic Metrics Applied to Rhizobiales (Hyphomicrobiales): Species Reclassification, Identification of Unauthentic Genomes and False Type Strains. Front. Microbiol. 2021, 12, 614957. [Google Scholar] [CrossRef]
  60. Bonilla, N.; Gutiérrez-Barranquero, J.; Vicente, A.; Cazorla, F. Enhancing Soil Quality and Plant Health Through Suppressive Organic Amendments. Diversity 2012, 4, 475–491. [Google Scholar] [CrossRef]
  61. Li, J.; Zhang, C.; Qu, X.; Luo, Z.; Lu, S.; Kuzyakov, Y.; Alharbi, H.A.; Yuan, J.; Niu, G. Microbial Communities and Functions in the Rhizosphere of Disease-Resistant and Susceptible Camellia spp. Front. Microbiol. 2021, 12, 732905. [Google Scholar] [CrossRef] [PubMed]
  62. Trivedi, P.; Delgado-Baquerizo, M.; Trivedi, C.; Hamonts, K.; Anderson, I.C.; Singh, B.K. Keystone Microbial Taxa Regulate the Invasion of a Fungal Pathogen in Agro-Ecosystems. Soil Biol. Biochem. 2017, 111, 10–14. [Google Scholar] [CrossRef]
  63. Stein, L.Y.; Klotz, M.G. The Nitrogen Cycle. Curr. Biol. 2016, 26, R94–R98. [Google Scholar] [CrossRef] [PubMed]
  64. Duan, M.; Zhang, Y.; Zhou, B.; Wang, Q.; Gu, J.; Liu, G.; Qin, Z.; Li, Z. Changes in Antibiotic Resistance Genes and Mobile Genetic Elements during Cattle Manure Composting after Inoculation with Bacillus subtilis. Bioresour. Technol. 2019, 292, 122011. [Google Scholar] [CrossRef]
  65. Vejan, P.; Abdullah, R.; Khadiran, T.; Ismail, S.; Nasrulhaq Boyce, A. Role of Plant Growth Promoting Rhizobacteria in Agricultural Sustainability—A Review. Molecules 2016, 21, 573. [Google Scholar] [CrossRef]
  66. Mendes, R.; Kruijt, M.; de Bruijn, I.; Dekkers, E.; van der Voort, M.; Schneider, J.H.M.; Piceno, Y.M.; DeSantis, T.Z.; Andersen, G.L.; Bakker, P.A.; et al. Deciphering the Rhizosphere Microbiome for Disease-Suppressive Bacteria. Science 2011, 332, 1097–1100. [Google Scholar] [CrossRef]
  67. Kalam, S.; Basu, A.; Ahmad, I.; Sayyed, R.Z.; El-Enshasy, H.A.; Dailin, D.J.; Suriani, N.L. Recent Understanding of Soil Acidobacteria and Their Ecological Significance: A Critical Review. Front. Microbiol. 2020, 11, 580024. [Google Scholar] [CrossRef]
  68. Huang, S.; Chen, H.; Li, W.; Zhu, X.; Ding, W.; Li, C. Bioactive Chaetoglobosins from the Mangrove Endophytic Fungus Penicillium chrysogenum. Mar. Drugs 2016, 14, 172. [Google Scholar] [CrossRef]
  69. Zhao, S.S.; Zhang, Y.Y.; Yan, W.; Cao, L.L.; Xiao, Y.; Ye, Y.H. Chaetomium globosum CDW7, a Potential Biological Control Strain and Its Antifungal Metabolites. FEMS Microbiol. Lett. 2017, 364, fnw287. [Google Scholar] [CrossRef] [PubMed]
  70. Afolabi, O.O.; Bigirimana, V.D.P.; Hua, G.K.H.; Oni, F.E.; Bertier, L.; Onwughalu, J.; Oyetunji, O.E.; Ogunbayo, A.; Van De Velde, M.; Nyamangyoku, O.I.; et al. Fusarium and Sarocladium Species Associated with Rice Sheath Rot Disease in Sub-Saharan Africa. Diversity 2023, 15, 1090. [Google Scholar] [CrossRef]
  71. Naeem, M.; Manzoor, S.; Abid, M.U.; Tareen, M.B.K.; Asad, M.; Mushtaq, S.; Ehsan, N.; Amna, D.; Xu, B.J.; Hazafa, A. Fungal Proteases as Emerging Biocatalysts to Meet the Current Challenges and Recent Developments in Biomedical Therapies: An Updated Review. J. Fungi 2022, 8, 109. [Google Scholar] [CrossRef] [PubMed]
  72. Kumar, A.; Verma, V.; Dubey, V.K.; Srivastava, A.; Garg, S.K.; Singh, V.P.; Arora, P.K. Industrial Applications of Fungal Lipases: A Review. Front. Microbiol. 2023, 14, 1142536. [Google Scholar] [CrossRef]
  73. Chu, S.; Zhang, D.; Wang, D.; Zhi, Y.; Zhou, P. Heterologous Expression and Biochemical Characterization of Assimilatory Nitrate and Nitrite Reductase Reveals Adaption and Potential of Bacillus megaterium NCT-2 in Secondary Salinization Soil. Int. J. Biol. Macromol. 2017, 101, 1019–1028. [Google Scholar] [CrossRef]
  74. Tian, Q.; Chen, F.; Liu, J.; Zhang, F.; Mi, G. Inhibition of Maize Root Growth by High Nitrate Supply Is Correlated with Reduced IAA Levels in Roots. J. Plant Physiol. 2008, 165, 942–951. [Google Scholar] [CrossRef]
  75. Dodds, K.L.; Collins-Thompson, D.L. Nitrite Tolerance and Nitrite Reduction in Lactic Acid Bacteria Associated with Cured Meat Products. Int. J. Food Microbiol. 1984, 1, 163–170. [Google Scholar] [CrossRef]
  76. Gomez-Gil, L.; Camara Almiron, J.; Rodriguez Carrillo, P.L.; Olivares Medina, C.N.; Bravo Ruiz, G.; Romo Rodriguez, P.; Corrales Escobosa, A.R.; Gutierrez Corona, F.; Roncero, M.I. Nitrate Assimilation Pathway (NAP): Role of Structural (nit) and Transporter (ntr1) Genes in Fusarium oxysporum f. sp. lycopersici Growth and Pathogenicity. Curr. Genet. 2018, 64, 493–507. [Google Scholar] [CrossRef]
  77. Uchimura, H.; Enjoji, H.; Seki, T.; Taguchi, A.; Takaya, N.; Shoun, H. Nitrate Reductase-Formate Dehydrogenase Couple Involved in the Fungal Denitrification by Fusarium oxysporum. J. Biochem. 2002, 131, 579–586. [Google Scholar] [CrossRef]
  78. Coyte, K.Z.; Schluter, J.; Foster, K.R. The Ecology of the Microbiome: Networks, Competition, and Stability. Science 2015, 350, 663–666. [Google Scholar] [CrossRef] [PubMed]
  79. Faust, K.; Raes, J. Microbial Interactions: From Networks to Models. Nat. Rev. Microbiol. 2012, 10, 538–550. [Google Scholar] [CrossRef] [PubMed]
  80. Guo, Y.; Luo, H.; Wang, L.; Xu, M.; Wan, Y.; Chou, M.; Shi, P.; Wei, G. Multifunctionality and Microbial Communities in Agricultural Soils Regulate the Dynamics of a Soil-Borne Pathogen. Plant Soil 2021, 461, 309–322. [Google Scholar] [CrossRef]
  81. Morriën, E.; Hannula, S.E.; Snoek, L.B.; Helmsing, N.R.; Zweers, H.; de Hollander, M.; Soto, R.L.; Bouffaud, M.L.; Buée, M.; Dimmers, W.; et al. Soil Networks Become More Connected and Take up More Carbon as Nature Restoration Progresses. Nat. Commun. 2017, 8, 14349. [Google Scholar] [CrossRef]
  82. Banerjee, S.; Walder, F.; Büchi, L.; Meyer, M.; Held, A.Y.; Gattinger, A.; Keller, T.; Charles, R.; van der Heijden, M.G.A. Agricultural Intensification Reduces Microbial Network Complexity and the Abundance of Keystone Taxa in Roots. ISME J. 2019, 13, 1722–1736. [Google Scholar] [CrossRef]
  83. Wen, T.; Xie, P.H.; Liu, H.W.; Liu, T.; Zhao, M.L.; Yang, S.D.; Niu, G.Q.; Hale, L.; Singh, B.K.; Kowalchuk, G.A.; et al. Tapping the Rhizosphere Metabolites for the Prebiotic Control of Soil-Borne Bacterial Wilt Disease. Nat. Commun. 2023, 14, 4497. [Google Scholar] [CrossRef]
Figure 1. Distribution of tomato Fusarium wilt incidence index (a) and yield (b) in greenhouses over different years. * p < 0.05 indicates significant differences among treatments (Tukey’s test).
Sustainability 16 07756 g001
Figure 2. Phylogenetic dendrograms and LDS scores of bacterial (a,c) and fungal (b,d) biomarkers in the rhizosphere soil of the Health and Disease groups of greenhouse-grown tomatoes. Phylogenetic dendrogram circles indicate the classification from phylum to genus from inside to out.
Sustainability 16 07756 g002
Figure 3. Redundancy analysis of the relationship between greenhouse soil samples with different disease severity, environmental variables, and bacterial (b) and fungal genera (d). Mantel’s test for correlations between soil chemical properties and bacterial genera (a) and fungal genera (c) in greenhouse soil from planted tomatoes. * p < 0.05, ** p < 0.01, and *** p < 0.001.
Sustainability 16 07756 g003
Figure 4. Random forest mean predictor importance (percentage of increase in mean square error) of the relative abundance of bacterial families (a) and genera (b) and fungal families (c) and genera (d) for Fusarium oxysporum abundance in the greenhouse soil of planted tomatoes. * p < 0.05, ** p < 0.01. Predictors with p ≥ 0.05 are not significant (unmarked).
Sustainability 16 07756 g004
Figure 5. Partial least squares structural equation model (PLS-SEM) showing the direct and indirect effects of chemical properties, microbial diversity, and microbial relative abundance on Fusarium oxysporum abundance in greenhouse soils. The red and green arrows represent positive and negative correlations, respectively. The numbers on the lines in the model represent path coefficients. The numbers on the lines outside the model represent the weight contributions. Continuous and dashed lines indicate significant and non-significant relationships, respectively.
Sustainability 16 07756 g005
Figure 6. Microbial co-occurrence networks constructed based on ASVs of bacteria and fungi from the Health (a) and Disease (b) groups, including their topological features (cg). Connections indicate strong (|Pearson’s ρ| > 0.84) and significant (p < 0.01) correlations. The red and green edges indicate positive and negative correlations, respectively. The color of the nodes is based on the phylum, and the size of each node is proportional to its degree centrality. * p < 0.05 indicates significant differences among treatments (Tukey’s test). ☐ represents the mean, and the dashed line represents the median.
Sustainability 16 07756 g006
Table 1. Chemical characteristics of greenhouse tomato rhizosphere soils.
Chemical CharacteristicsHealth GroupDisease Group
pH7.29 ± 0.22 a6.75 ± 0.28 b
EC (μs cm−1)255.60 ± 134.85 a458.57 ± 381.34 a
TN (g kg−1)2.08 ± 0.51 b3.14 ± 0.80 a
NH4+–N (mg kg−1)5.53 ± 7.00 a7.10 ± 16.67 a
NO3–N (mg kg−1)94.90 ± 36.65 b237.87 ± 99.31 a
AN (mg kg−1)202.86 ± 63.80 b332.22 ± 124.12 a
AP (mg kg−1)551.88 ± 218.04 b737.29 ± 154.12 a
AK (mg kg−1)625.73 ± 233.93 a804.34 ± 233.18 a
Values are means ± SD. Different letters indicate significant differences between groups according to the Tukey’s test (p < 0.05).
Table 2. Absolute abundance and alpha diversity of rhizosphere microorganisms in greenhouse tomato soils.
Microbial Community CharacteristicsHealth GroupDisease Group
Absolute abundance16S rRNA (109 copies g−1)7.780 ± 5.281 a7.204 ± 4.038 a
ITS (108 copies g−1)5.197 ± 2.357 a7.276 ± 2.832 a
Fol (104 copies g−1)10.003 ± 2.697 b16.175 ± 4.091 a
Alpha diversityBacterialChao13750.40 ± 112.80 a3355.59 ± 745.47 a
Pielou_e0.8808 ± 0.0095 a0.8596 ± 0.013 b
Shannon10.26 ± 0.21 a9.91 ± 0.20 b
Simpson0.9969 ± 0.0009 a0.9956 ± 0.0013 b
FungalChao1403.83 ± 86.09 a394.29 ± 90.05 a
Pielou_e0.5747 ± 0.0357 a0.5950 ± 0.0339 a
Shannon4.96 ± 0.41 a5.10 ± 0.43 a
Simpson0.9086 ± 0.0294 a0.9244 ± 0.0201 a
Values are means ± SD. Different letters indicate significant differences between groups according to the Tukey’s test (p < 0.05).
Table 3. Proportion of positive and negative interactions in the microbial co-occurrence networks of the Health and Disease groups.
GroupBacterial–Bacterial (%)Fungal–Fungal (%)Bacterial–Fungal (%)
PositiveNegativePositiveNegativePositiveNegative
Health58.4741.5365.5234.489.6090.40
Disease60.1739.8356.7643.2431.9768.03
Disclaimer/Publisher’s Note: The statements, opinions and data contained in all publications are solely those of the individual author(s) and contributor(s) and not of MDPI and/or the editor(s). MDPI and/or the editor(s) disclaim responsibility for any injury to people or property resulting from any ideas, methods, instructions or products referred to in the content.

