Abstract
Despite the importance of using digital technologies for resource management, Peru does not record current and estimated processed data on rural agriculture, hindering an effective management process combined with policy. This research analyzes the connotation of spatiotemporal level trends of eight different land cover types in nine rural districts representative of the three natural regions (coast, highlands, and jungle) of Peru. The effect of change over time of the COVID-19 pandemic was emphasized. Then, forecast trends of agricultural areas were estimated, approximating possible future trends in a post-COVID-19 scenario. Landsat 7, Landsat 8, and Sentinel 2 images (2017–2022) processed in the Google Earth Engine platform (GEE) and adjusted by random forest, Kappa index, and Global Accuracy. To model the forecasts for 2027, the best-fit formula was chosen according to the criteria of the lowest precision value of the mean absolute percentage error, the mean absolute deviation, and the mean squared deviation. In the three natural regions, but not in all districts, all cover types suggested in the satellite images were classified. We found advantageous situations of agricultural area dynamics (2017–2022) for the coast of up to 80.92 km2 (Guadalupe, 2022), disadvantageous situations for the Sierra, and indistinct situations for the Selva: between −91.52 km2 (Villa Rica, 2022) and 22.76 km2 (Santa Rosa, 2022). The trend analysis allows us to confirm the effects of the COVID-19 pandemic on the extension dedicated to agriculture. The area dedicated to agriculture in the Peruvian coast experienced a decrease; in the highlands, it increased, and in the jungle, the changes were different for the districts studied. It is expected that these results will allow progress in the fulfillment of the 2030 Agenda in its goals 1, 2, and 17.
1. Introduction
No other activity can match agriculture in importance. In most of the underdeveloped world, agriculture is not only the main employment but also a proportion of national income and export earnings [1]. Between 1990 and 2005, cropland is estimated to have increased at a slower rate than population growth, and at the same time, increases in yields and decreases in cropland occurred infrequently on a global scale [2]. Over the past two decades, cropland around the world has expanded dramatically [3], mainly due to increased demand for food from a growing population [4]. Recent studies predict that approximately 500 million hectares of additional cropland will be needed by 2050 to meet global food demand [5], which will increase the pressure on natural habitats [6]. Considering also that the United Nations’ Sustainable Development Goals (SDGs) for 2030 call for balancing the increase in agricultural production with the maintenance of ecosystem services [7], it is crucial to have precise data on the current availability of agricultural land to make accurate food forecasts and ensure food security and sovereignty. This will empower us to develop effective economic, political, and governmental strategies in collaboration with the relevant authorities to achieve optimal territorial zoning.
We now have digital tools such as remote sensing, which has long been recognized as an effective means of mapping large-scale land cover [8]. In recent years, coarse spatial resolution global cropland maps have been used that cannot adequately capture cropland dynamics (loss or gain) (e.g., <1 km2 or 100 ha) [9]. This is problematic, for example, for conservation strategies. Since most of the significant human impacts on the earth cannot be captured at the scale of the Google Earth Engine platform [10] and must be done in adequate time frames for efficient management, we recognize that the GEE platform is a tool that facilitates the acquisition and processing of images that allow us to evaluate the large amount of information obtained by satellites with greater precision and in less time [11].
GEE has a vast, free, petabyte-scale catalog of satellite imagery and geospatial datasets. It is the only one that brings together information from Landsat, Sentinel, MODIS satellites and data on climate models, temperature, geophysical features, and other satellite imagery from different international agencies to standardize scales and generate time series [12]. It is very intuitive and allows the input of local data and the export of information for further processing or visualization within its geographic information system (GIS) software, such as QGIS (Version 3.28) and ArcGIS Pro (Version 3.1.2) [11]. In Peru, only agricultural research on monocultures, such as rice cultivation, has been conducted using the GEE platform [13]. The platform was used for the first time in Peru to provide information on rural agriculture. This will help to manage resources, make decisions, monitor crops, and update the crop calendar. Also, the transition of crops from natural area to cultivation, or from forest to cultivation, or from natural area to protected area can be managed, as well as the desert zones in Peru that are generally Agri Export Zones and their implications. In this sense, remote sensing data help rural agricultural development agencies fill information gaps [14]. Smallholder farmers are the most important custodians of plant genetic resources for in situ conservation [15]. However, rural agriculture in Peru is complex; it involves poverty, development, food systems, climate change, and agricultural production management [16]. For example, global factors such as the Severe Acute Respiratory Syndrome (SARS-CoV-2) pandemic that initiated in Peru a policy of quarantine and social isolation imposed by the declaration of a National Public Health Emergency as of March 2020 have already generally affected small-scale agriculture, which provides about 70% of the country’s food, at all stages of the food production chain [17].
In Peru, the restrictions to curb the pandemic primarily affected low-income families in poorer areas of Lima and the main cities. Faced with the situation, they had to migrate back to their centers of origin in the hope of finding better conditions for their families [18]. This is called reverse migration, which can have both positive and negative effects on different ecosystems. Despite efforts in South America, high informal employment and social inequalities undermined the effectiveness of these countries’ responses [19]. The effects of this reverse migration on the dynamics of areas dedicated to agriculture, with a focus on food security and sovereignty, have not been well addressed by empirical studies.
The concern for the above led to the presentation of this research, whose objectives were to conduct a multitemporal analysis of land use and land cover change (LULC) using the Google Earth Engine platform in nine rural districts mainly dedicated to agriculture, using eight types of land cover, representative of Peru. Then, trend values were estimated for changes in agricultural areas until 2027 to estimate possible trends in a post-pandemic scenario. The analyses were made using as a reference base the changes in farming areas for the years 2017–2022 in these rural districts of Peru, dedicated to agriculture, and emphasis was placed on the dynamics of change from 2020, in which the pandemic emergency began in Peru.
Our findings span a national scope because we studied nine rural districts representative of the three main regions of Peru: coast, highlands, and jungle, covering the north, center, and south. Given that future farmland abandonment and its effects on environmental services require explicit policy action [2], we expect these data to inform and strengthen policy proposals.
2. Materials and Methods
2.1. Study Area
The study was carried out based on information from rural agricultural districts in Peru, as well as on-site visits to farms in the study area, based on the IV National Agricultural Census of 2012 [20]. An attempt was made to distribute in a representative manner three rural sampling areas by natural region (Coast, Andes, and Jungle), with agricultural and livestock activity. According to geographic distribution and the subnational administrative boundaries of Peru [21], nine districts were selected (Table 1 and Figure 1). We took into account random selection [22] as well as the aforementioned inclusion criteria.

Table 1.
Rural districts were selected for the research.
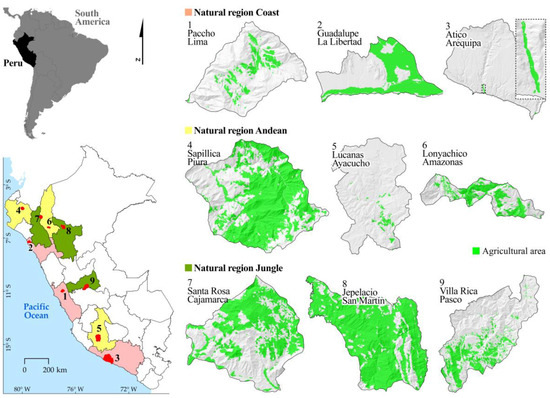
Figure 1.
Map of rural districts of Peru evaluated, representative of the natural region Coast, natural region Andes, and natural region Jungle. The green water-colored areas in the districts represent the agricultural area in the year 2021.
2.2. Multi-Temporal Analysis of Land Use and Land Cover Change (LULC)
2.2.1. Image Classification in Google Earth Engine (GEE)
Satellite data were taken in each of the 9 zones for at least 6 years (years 2017 to 2022). The reasons why we selected this group of temporal data were to focus on an analysis of the dynamics of these areas with crops compared to the year that the COVID-19 pandemic began (year 2020), and to evaluate the potential effects of these dynamics as a predictor of changes until 2027. The provider of the dataset was the United States Geological Survey (USGS). GEE Landsat 7 ETM+, Landsat 8 OLI/TIRS (30 m resolution), and Sentinel 2 images were used (10 m resolution), with surface reflectance (SR) corrected. Landsat image collections 7 ETM+ and Landsat 8 OLI/TIRS were obtained from ee.ImageCollection (“LANDSAT/LC08/C02/T1_TOA”), and Sentinel 2 image collections were obtained from ee.ImageCollection (“COPERNICUS/S2_HARMONIZED”).
The reservation of cloud-free image pixels was performed by running the cloud-masking function. In this study, for Landsat, only bands “B2” Blue, “B3” Green, “B4” Red, “B5” Near Infrared, “B6” Shortwave Infrared 1, and “B7” Shortwave Infrared (which had a spatial resolution of 30 m) were used. For Sentinel 2, only the bands “B2” Blue, “B3” Green, “B4” Red, “B5” Red edge 1, “B6” Red edge 2, and “B7” (with a spatial resolution of 10 m for B2, B3, and B and 20 m for B5, B6, and B7) were used. A median filter was then applied to obtain representative pixels for each location in each spectral band of each time range.
Of the reference data, 70% were used as training samples to classify the images, and the rest were used to validate the classification results [24,25]. The reference data were distributed at random points generated from the field survey data. These points represented the eight land cover use categories (LULC) addressed in this study: artificial areas (AA); agriculture (A); forest (B); water bodies (CA); burned areas (ZQ); forest plantations (PF); herbaceous (H); and bare soil (SD). For image classification accuracy, the random forest (RF) algorithm was used because of its ability to handle complex, high-dimensional data; it also provides higher accuracy than other traditional algorithms [26] and with good results in territories with characteristics such as Peru [27]. Based on the samples acquired, the function “ee.Classifier.smileRandomForest” maps were obtained on the GEE platform, and the maps were obtained with time series data, classified by each zone and by each semester for 5 years. For the processing of the random forest (RF) classifier, two parameters were identified: the number of classification trees desired and the number of predictor variables used at each node to grow the tree [28]. In this study, the number of trees was set at 500, and eight random variables were selected from the best splitting when each tree grows.
2.2.2. Accuracy Assessment for Land Use and Land Cover Change (LULC) Analysis
The overall accuracy level (OA) was evaluated between images and ground reality, as it is one of the most popular measures of agreement and indicates the percentage of correctly classified pixels. It was calculated using the formula in Equation (1), where q is the number of classes, n ii are the diagonal elements, and n represents the total number of pixels considered [29].
The Kappa coefficient was calculated in the code editor console using the built-in GEE script and was performed for the analysis of multiple relationships between classes, measuring the difference between the map and the observed reality using the following equation [30]:
where n is the number of rows of the matrix; X ii is the number of observations in row i and column i; X i + X + i are the marginal totals of row i and column i, respectively; and m is the total number of observations.
Randomly sampled 1600 ground control points were used to evaluate the accuracy of the LULC maps produced by using different algorithms [31]. Sampling points were selected from field observation and using Google Earth Engine for remote and inaccessible areas.
Then, the images were processed with accuracy level values higher than 78.5–99.9% and with Kappa indexes between 70% and 98.4% in all areas, except in Atico where the conditions of environment and type of coverage merited using the available images and higher validation points, which ensures the reliability of the information (Table 2).
Table 2.
Accuracy level (OA) and Kappa Index (IK) for satellite images of 9 zones of Peru for 6 years.
In vector format, the final LULC maps with the 8 classified cover types and administrative boundaries were superimposed on each other. In this way, the area of each type of cover was calculated for spatial distribution (9 zones of Peru) and temporal distribution (for 6 years), where all the information was quantified and represented in the form of maps and tables, and the areas were represented in kilometers.
2.3. Trends in Agricultural Area Forecasts
Then, for forecasting trend modeling of areas devoted to agriculture (A), up to the year 2027, the information from the multitemporal analysis for areas devoted to agriculture in the 9 rural areas (years 2017–2022) was used. The appropriate trend model (either the linear trend model, a quadratic trend model, an exponential growth model, or a curve model) was represented with a formula. The appropriate trend was selected based on the criteria of the lowest precision value of the MAPE (mean absolute percentage error) [32,33]. The model was chosen based on the values of mean absolute deviation (MAD) [34], mean squared deviation (MSD) [35,36,37], and MAPE, comparing the best measures of precision [38].
where is the actual agricultural area for time t, is the forecast agricultural area for period t, n is the specific number of periods (years), and is the forecast error = ( − ).
For all cases of the research, the quadratic model [39] was the best fit, under the formula:
where yt is the variable; b0 is the constant; b1 and b2 are the coefficients; and t is the time unit value. In other words, it presented the lowest values of all the precision measures such as MAPE, MAD, and MSD; therefore, this model is the best fit and was selected as the best model for the trend of the agricultural area forecast to the year 2027, in all zones (Figure 2).
Yt = b0 + b1 ∗ t + (b2 ∗ t2)
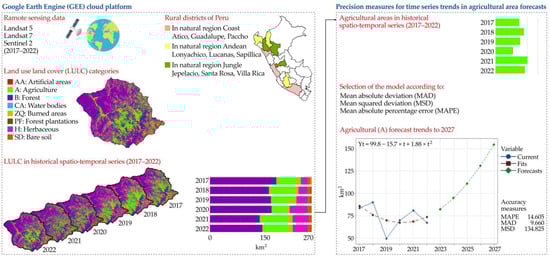
Figure 2.
Workflow for the modeling space-temporal Rural Agricultural Land Use Change and Area Forecasts in Historical Time Series in Peru.
3. Results
3.1. Land Use and Land Cover Change (LULC) on the Coast
The dynamics of agricultural coverage in the Paccho district (Table 3, Figure 3) showed an increase in 2022 despite the volatility of its values during the years evaluated. In 2017, 13.10 km2 of agricultural area was recorded, and by 2022, it was 20.48 km2 of agricultural area.
Table 3.
Dynamics of land use and land cover change years 2017–2022 in Paccho (km2).
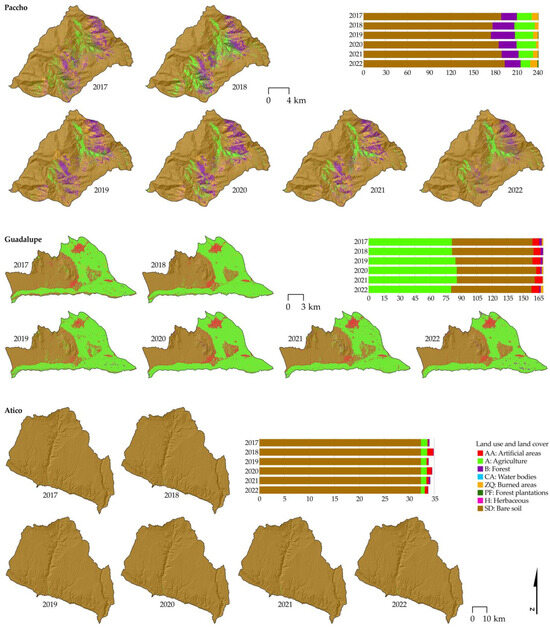
Figure 3.
Dynamics of land use and land cover change years 2017–2022 in the districts of the Coastal region.
In the rural district of Guadalupe (Figure 3, Table 4), there was a slight increase in agricultural areas for 2022 to 80.9226 km2, compared with 80.208 km2 in 2017, and the largest extensions of coverage were presented in agricultural areas for all years. Artificial areas, water bodies, burned areas, and forest plantations showed a decrease over the years. Meanwhile, forests and bare soil increased until 2022.
Table 4.
Dynamics of land use and land cover change years 2017–2022 in Guadalupe (km2).
In the Coast (South) region where Atico is located, land use dynamics denoted an increase in agricultural areas, ranging from 0.7434 km2 in 2017 to 1.3095 km2 in 2022 (Figure 3, Table 5). The largest areas were recorded in bare soil in all years. Artificial areas and forests showed an increase in 2022, while forest areas decreased.
Table 5.
Dynamics of land use and land cover change years 2017–2022 in Atico (km2).
Overall, in the rural districts of the coastal region, the areas devoted to agriculture increased (Figure 3, Table 3, Table 4 and Table 5).
Except for the district of Atico (located in southern Peru), in the coastal districts of Paccho and Guadalupe, as an effect of the pandemic (years 2021 and 2022), a decrease in the area with agricultural and forest cover was observed, increasing bare soil.
3.2. Land Use and Land Cover Change (LULC) in the Sierra
In Sapillica, agricultural cover increased and decreased each year to such an extent that it shrunk from 83.3355 km2 in 2017 to 67.2849 km2 in 2022. Other coverages that eventually decreased in this zone were artificial areas, herbaceous coverages, and bare soil. The cover types that increased their areas in 2022 compared with 2017 are forests, water bodies, burned areas, and forest plantations (Figure 4, Table 6).
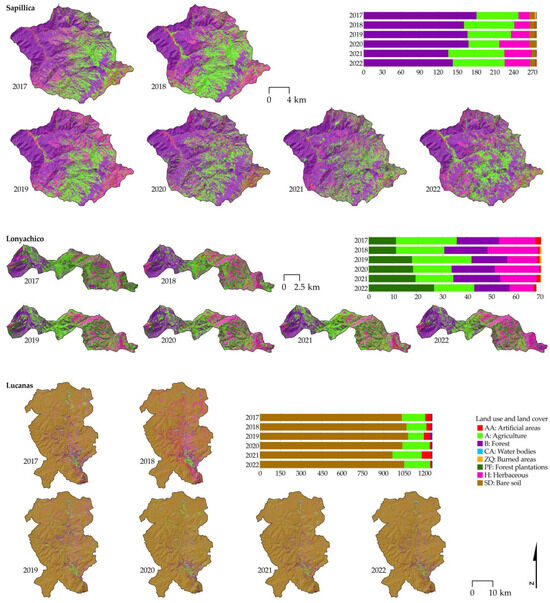
Figure 4.
Dynamics of land use and land cover change years 2017–2022 in districts of the Sierra region.
Table 6.
Dynamics of land use and land cover change years 2017–2022 in Sapillica (km2).
On the contrary, in Lonya Chico, agricultural areas increased progressively over the years (16.3917 km2 in 2017 to 24.7311 km2 in 2022). In addition, the cover of artificial areas, forests, herbaceous cover, and bare soil increased over the years. Meanwhile, the coverage of water bodies decreased, burned areas decreased to a lesser extent, and forest plantations decreased considerably (Figure 4, Table 7). This district in the highlands is the only one that in 2022 will occupy the first place in extension occupied by agricultural cover.
Table 7.
Dynamics of land use and land cover change years 2017–2022 in Lonyachico (km2).
In the rural district of Lucanas (Figure 4, Table 8), the agricultural cover showed a progressive and considerable decrease in agricultural cover, ranging from 51.8706 km2 in 2017 to 19.8567 km2 in 2022. The coverages of burned areas, forests, and bare soil also showed a decrease in their areas, while water bodies and herbaceous cover increased.
Table 8.
Dynamics of land use and land cover change years 2017–2022 in Lucanas (km2).
In general terms, in the rural areas of the highlands region (Figure 4; and Table 6, Table 7 and Table 8), agricultural land is more dispersed throughout the district. Lucanas (south) and Sapillica (north) showed less agricultural activity compared to a district such as Lonyachico (northeast) where, despite their small size, small-scale agriculture is basically for self-consumption. Overall, agricultural areas increased.
Changes in land use in the rural districts of the highlands of Peru were very different. Soils with herbaceous cover decreased since 2021, increasing the area with forest cover in Sapillica (Sierra Norte), while in Lonyachico it appeared that forest areas were converted to agricultural land. In the Lucanas district, there was an increase in the area with herbaceous cover in 2022, which could explain the decrease in the extension of crops.
3.3. Land Use and Land Cover Change (LULC) in Selva
For the rural district of Santa Rosa (Figure 5 and Table 9), the agricultural coverages denoted an increase during the last 5 years, except in 2021 (pandemic year). However, by 2022, an agricultural area of 116,307 km2 was shown, making this value the largest area concerning the rest of the coverage. Other areas that finally grew were the coverages of artificial areas, burned areas, herbaceous coverages, and bare soil. The areas that decreased in these years were forests and water bodies. Inversely in Jepelacio, the dynamics of land use show that agricultural areas decreased to 152.3862 km2 in 2022, even though 161.9703 km2 were recorded in 2017 (Figure 5, Table 10). A significant reduction of artificial land cover areas was shown until 2022, while forest areas, burned areas, and water bodies increased. In Villa Rica, where there are mainly export monocultures, the dynamics of agricultural cover over the years was unstable, decreasing from 230.3874 km2 in 2017 to 138.8745 km2 in 2022. Artificial areas, forests, water covers, herbaceous covers, forest plantations, and bare soil finally increased until 2022; and bare soil decreased its agricultural area (Figure 5, Table 11).
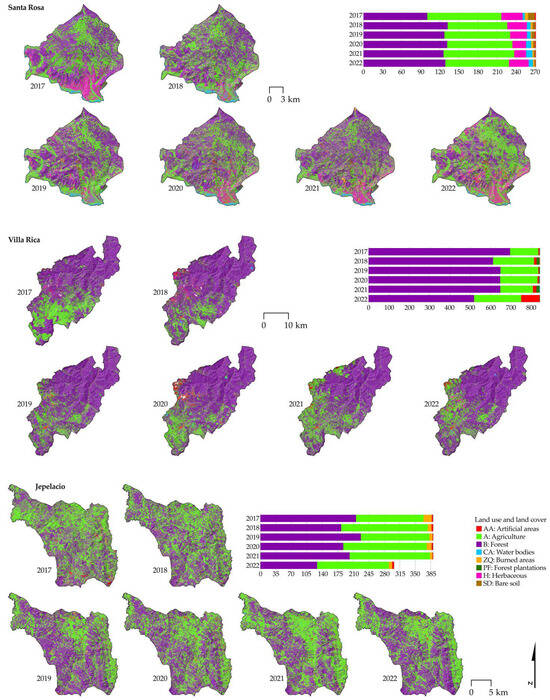
Figure 5.
Dynamics of land use and land cover change years 2017–2022 in the Selva.
Table 9.
Dynamics of land use and land cover change years 2017–2022 in Santa Rosa (km2).
Table 10.
Dynamics of land use and land cover change years 2017–2022 in Jepelacio (km2).
Table 11.
Dynamics of land use and land cover change years 2017–2022 in Villa Rica (km2).
Regarding the dynamics of change in agricultural areas in the rural districts in the jungle region (Figure 5 and Table 9, Table 10 and Table 11), there were changes in increase and decrease indistinctly. It should be noted that agriculture did not lead as the largest area in any of the districts (Santa Rosa, Jepelacio, and Villa Rica), moving into second place to forests.
Conversely, the three studied jungle districts seemed to have large extensions of land for agriculture associated with crops that effectively require large extensions, such as coffee, cocoa, rice, etc. In addition, the configuration of the cover types is very similar, indicating greater homogeneity according to the type of land use.
In the rural districts of the Peruvian jungle, changes in use appeared to be between forest areas with herbaceous cover and space dedicated to crops.
3.4. Trends in Agricultural Area Forecasts in Time Series for Rural Districts of Peru
Figure 6 shows the changes in the amount of land dedicated to agriculture in the nine rural districts of Peru. In the Coastal region, an increasing dynamic of agricultural area forecasts was observed in time series in Atico and Paccho, including the year of the beginning of the COVID-19 pandemic that affected the entire world. Although Atico presented a progressive increase in areas in all the years evaluated, Paccho increased the forecasts in agricultural areas between the years 2017 and 2021, and by the year 2022, it presented a considerable reduction in agricultural areas. The trends in Guadalupe were the opposite; this district presented a decrease in agricultural areas starting in 2020 and a single year of increase in agricultural areas (2018). The trends for the year 2027 differed between districts on the coast. Guadalupe and Paccho showed a decreasing trend in agricultural areas that, if the trend continues, without changing factors, could disappear in Paccho or be drastically reduced in Guadalupe. Atico showed an increasing trend until 2027.
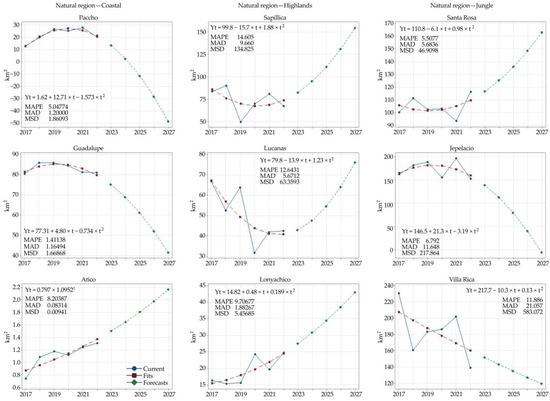
Figure 6.
Forecast trends to 2027 of agricultural areas in time series, for rural districts of Peru.
The dynamics of agricultural area forecasts in the highlands of Peru were different in each district. While in Lonya Chico the trends finally increased until 2022, despite the reduction of agricultural areas in 2021, in Lucanas these areas showed a trend of annual reduction during the 6 years of evaluation. The rural district of Sapillica presented a dynamic of annual sequential increase and decrease (years 2017–2022). Despite the dynamics of change in varied agricultural areas that were presented in the three districts, the trends of agricultural areas for the year 2027 showed an increase in the forecasts in the three zones; these values are represented under the growth model curve in Figure 6.
In the Peruvian Selva region, the dynamics of agricultural area forecasts in the years 2017–2022 were varied and not sequential in each year and for each district evaluated. Despite this, it was noted that between the pandemic years 2017 to 2021, agricultural forecasts increased in all three zones. Santa Rosa was the district where agricultural area forecasts increased (2017–2022). Meanwhile, the districts of Jepelacio and, to a greater extent, Villa Rica showed that agricultural areas decreased during the years evaluated.
In the synopsis for Peru, the dynamics of change in agricultural areas evaluated (year 2017–2022) were different according to each region and according to each district. Analyzing the agricultural area in the zones, from 2017 to 2022, it increased in all rural districts evaluated in the Coast region (Paccho, Guadalupe, and Atico) and decreased in all rural districts evaluated in the Jungle region (Villa Rica, Jepelacio, Sapillica, and Lucanas). Meanwhile, in the Sierra region, the increase in agricultural areas occurred in Lonya Chico, and the decrease in Lucanas and Sapillica. Likewise, for the annual trends to 2027, only in the Sierra region was there a trend of increasing agricultural area forecasts in the three zones, together with Atico in the Costa region and Santa Rosa in the Selva region. Meanwhile, Guadalupe and Paccho in the coastal region and the jungle region, Jepelacio, and Villa Rica showed decreasing trends in agricultural forecasts for 2027.
4. Discussion
4.1. Space-Time Trends Using the GEE Resource
Land use and land cover (LULC) changes help to understand the basic properties, regional structure, and distribution characteristics of the different types of LULC [40], laying the groundwork for a deeper analysis of regional differences in LULC changes [2,41]. The results shown here allow us to understand the dynamics of change in agricultural areas that affect or benefit other land covers according to the influence of specific factors at the temporal and spatial levels in rural sectors of Peru.
The production of global LULC maps is inherently difficult due to the extreme biogeographic variations within and between biomes that lead to diverse spectral signatures within a single LULC class [42,43,44,45]. Therefore, trade-offs between thematic resolution, global vs. local accuracy, class-specific biases, and a change analysis are necessary [42]. This research shows in detail several procedures performed to improve data accuracy, such as the random forest algorithm (random forest: RF) [46,47,48,49], the use of training samples to classify images [50], obtaining the overall Accuracy [51,52,53], and the Kappa index [54,55,56,57].
Overall classification values exceeded 89% in all cases, leading to very reliable annual data in the results of the present study. For an example of higher temporality, a global cropland dataset from 2000 to 2019 was published at 4-year intervals, with overall classification accuracy exceeding 97% [3]. Two other GlobeLand30 datasets (2000/2010/2020) [10] provide farmland maps at 30 m spatial resolution and with similar global classification values. Also, we processed images with values lower than 78.5% (Atico with KI 24.5% to 59.3%), where the conditions of environment and type of coverage merited using the available images with higher validation points, which ensures the reliability of the information through the global accuracy value greater than 99.8% in all years.
The spatiotemporal trend shows then, as in the present results, changes in vegetation cover in the world, which is of concern to the community because it threatens sustainable development. In an area of the highlands of Cajamarca in Peru, between 1989 and 2023, the categories of artificial surfaces, agricultural areas, and scrubland/herbaceous vegetation show a positive rate of change, while the categories of forest and open spaces with little or no vegetation show a decreasing trend [58]. The same trend is shown for a conservation area in Madre de Dios (Peruvian rainforest) between 2006 and 2011, where they faced intense pressure and experienced high rates of ecosystem loss, even compared to non-conservation land [59]. In contrast, in Tumbes (Peruvian coast), the analysis of estimated rates over 4 years (2017–2021) reports increases in urban areas, dense dry forest, and open dry forests. This is a consequence of the reduction in agricultural land, water body, and water body rates [60].
4.2. Predicted Trends of Agricultural Areas in a Post-COVID-19 Scenario
Although the global expansion of cropland doubled from 2000 to 2019 [3], for Peru, the trajectory of land use destined for agricultural areas (2017–2022) is different for each region and each district. The expansion of agricultural land only occurred in all rural districts evaluated in the Coastal region.
The dynamics may vary according to the geographic area evaluated and the social, economic, and environmental conditions to which the inhabitants are exposed [61]. This is demonstrated by areas intended to mitigate the estimated need for up to 70% increase in food production to meet the demands of the population in 2050 [62], at the expense of forest areas in the world, which have suffered considerable losses mainly due to agricultural activities [63]. Contrary to this, more specific research is presented in areas of the Peruvian Sierra region (Quechua, Suni, and Puna altitudinal zones), where agricultural areas were reduced by urban demographic pressure between 1998 and 2008 [64]. Furthermore, according to the land cover distribution trend for Peru in 2008, only 12.9% of the area corresponds to agriculture, and 7.6% of the estimated forest area [65] is a larger area. Also, for Madre de Dios, in the Peruvian jungle for example, thousands of hectares of tropical forest were lost between 1993 and 2013, and among the factors of change, they list the expansion of agriculture [66].
The predictive models of future changes in land use and specifically in the area dedicated to agriculture presented in this research are only an approximation of the impact that the reverse migration phenomenon could have caused by the measures implemented by the State to contain the pandemic. Considering that each region of Peru has different behaviors in the agricultural dynamics in rural areas, it is relevant to emphasize the results at the regional level [67,68]. Furthermore, in order to obtain more robust prediction models, thanks to this proposal, other predictors such as socio-economic, political, and even environmental factors could be included in the future in the database processed in this research.
Peruvian agricultural management will be able to use information on spatiotemporal and future trends in rural areas [13,40,69], especially in a post-COVID-19 scenario. Although there are already studies on criteria for rural agricultural areas in Peru [70,71], now it will be possible to achieve greater precision and economic savings. In addition, new typologies of farmers can be identified according to land gain and loss, aligning with the SDGs to eradicate poverty, achieve zero hunger, and foster partnerships [72].
Finally, it should be noted that the use of new digital technologies helps to provide almost immediate responses in scenarios unknown to mankind after the COVID-19 pandemic [73,74], and in general, the use of these tools allows and will allow better future responses to mitigate the effects of pandemics in the agricultural sector, from the precision in mapping and for the better use of resources, as well as other factors that alter the dynamics of sustainable development. This will also allow us to adapt to the new economic, environmental, and social challenges [75,76] that arise in the different production systems, such as in this research, where it is already possible to learn first-hand about the spatiotemporal modeling of agricultural land use change and the determination of area forecasts in historical time series in Peru using the Google Earth Engine platform.
5. Conclusions
The Google Earth Engine platform made it possible to quantify areas of different land cover types (LULC) in nine representative rural districts dedicated to agriculture in Peru (years 2017–2022). In all regions of Peru, all cover types proposed in the satellites were found (artificial areas (AA); agriculture (A); forest (B); water bodies (CA); burned areas (ZQ); forest plantations (PF); herbaceous (H); and bare soil (SD)), although not all districts have all types of land cover. The dynamics in the increase and reduction of areas are indistinct for the three natural regions, so it is deduced that social economic or environmental factors influence in a specific way these dynamics of cover. Especially in times of pandemic, the change in agricultural area between 2020 and 2021 presented the same trend of increasing areas in the Coastal region, decreasing areas in the Sierra region, and an indistinct trend of areas in the Selva region. Only in the Sierra was there a trend of increasing agricultural area forecasts in the three zones, along with Atico on the Coast and Santa Rosa in the Jungle. Guadalupe and Paccho on the coast and in the jungle, Jepelacio, and Villa Rica showed decreasing trends in agricultural forecasts.
This work demonstrates that the migratory phenomena caused by the measures imposed by the government to contain the COVID-19 pandemic provoked a change in the extension of land dedicated to agriculture in Peru. Cultivated land on the coast was reduced and increased in the districts of the highlands. However, more factors need to be incorporated to obtain more accurate projections.
Author Contributions
Conceptualization, L.G., J.V., S.G.C., M.O.-C., G.A.G. and N.B.R.-B.; methodology, L.G., J.V., S.G.C. and N.B.R.-B.; software, L.G., J.V., S.G.C. and N.B.R.-B.; validation, L.G., J.V., S.G.C. and N.B.R.-B.; formal analysis, L.G., J.V., S.G.C. and N.B.R.-B.; investigation, S.G.C.; resources, S.G.C.; data curation, L.G., J.V., G.A.G. and M.O.-C.; writing—original draft preparation, L.G.; writing—review and editing, L.G., J.V., S.G.C. and N.B.R.-B.; visualization, G.A.G. and S.G.C.; supervision, L.G., J.V., S.G.C., M.O.-C. and N.B.R.-B.; project administration, L.G., G.A.G. and M.O.-C.; funding acquisition, L.G. All authors have read and agreed to the published version of the manuscript.
Funding
This research was funded by PROCIENCIA, grant number CONTRATO N° 075-2021-PROCIENCIA (MISAR) and grant number N° PE501083491-2023-PROCIENCIA (APIGEN). The APC was funded by Universidad Nacional Toribio Rodríguez de Mendoza de Amazonas.
Institutional Review Board Statement
Not applicable.
Informed Consent Statement
Not applicable.
Data Availability Statement
The data presented in this study are available on request from the corresponding author.
Acknowledgments
We are grateful for the support of the Universidad Nacional Toribio Rodríguez de Mendoza and the rural farmers of Peru who allowed us to visit the farms for georeferencing.
Conflicts of Interest
The authors declare no conflicts of interest.
References
- Grigg, D. The Agricultural Regions of the World: Review and Reflections. Econ. Geogr. 1969, 45, 95–132. [Google Scholar] [CrossRef]
- Rudel, T.K.; Schneider, L.; Uriarte, M.; Ii, B.L.T.; Defries, R.; Lawrence, D.; Geoghegan, J.; Hecht, S.; Ickowitz, A.; Lambin, E.F.; et al. Agricultural Intensification and Changes in Cultivated Areas, 1970–2005. Proc. Natl. Acad. Sci. USA 2009, 106, 20678–20680. [Google Scholar] [CrossRef] [PubMed]
- Potapov, P.; Turubanova, S.; Hansen, M.C.; Tyukavina, A.; Zalles, V.; Khan, A.; Song, X.P.; Pickens, A.; Shen, Q.; Cortez, J. Global Maps of Cropland Extent and Change Show Accelerated Cropland Expansion in the Twenty-First Century. Nat. Food 2022, 3, 19–28. [Google Scholar] [CrossRef]
- Charles, H.; Godfray, J.; Beddington, J.R.; Crute, I.R.; Haddad, L.; Lawrence, D.; Muir, J.F.; Pretty, J.; Robinson, S.; Thomas, S.M.; et al. Food Security: The Challenge of Feeding 9 Billion People. Science 2010, 327, 812–818. [Google Scholar]
- Mogollón, J.M.; Bouwman, A.F.; Beusen, A.H.W.; Lassaletta, L.; van Grinsven, H.J.M.; Westhoek, H. More Efficient Phosphorus Use Can Avoid Cropland Expansion. Nat. Food 2021, 2, 509–518. [Google Scholar] [CrossRef]
- Williams, D.R.; Clark, M.; Buchanan, G.M.; Ficetola, G.F.; Rondinini, C.; Tilman, D. Proactive Conservation to Prevent Habitat Losses to Agricultural Expansion. Nat. Sustain. 2021, 4, 314–322. [Google Scholar] [CrossRef]
- Movilla-Pateiro, L.; Mahou-Lago, X.M.; Doval, M.I.; Simal-Gandara, J. Toward a Sustainable Metric and Indicators for the Goal of Sustainability in Agricultural and Food Production. Crit. Rev. Food Sci. Nutr. 2021, 61, 1108–1129. [Google Scholar] [CrossRef]
- Naboureh, A.; Li, A.; Bian, J.; Lei, G. National Scale Land Cover Classification Using the Semiautomatic High-Quality Reference Sample Generation (HRSG) Method and an Adaptive Supervised Classification Scheme. IEEE J. Sel. Top. Appl. Earth Obs. Remote Sens. 2023, 16, 1858–1870. [Google Scholar] [CrossRef]
- Meng, Z.; Dong, J.; Ellis, E.C.; Metternicht, G.; Qin, Y.; Song, X.P.; Löfqvist, S.; Garrett, R.D.; Jia, X.; Xiao, X. Post-2020 Biodiversity Framework Challenged by Cropland Expansion in Protected Areas. Nat. Sustain. 2023, 6, 758–768. [Google Scholar] [CrossRef]
- Chen, J.; Chen, J.; Liao, A.; Cao, X.; Chen, L.; Chen, X.; He, C.; Han, G.; Peng, S.; Lu, M.; et al. Global Land Cover Mapping at 30 m Resolution: A POK-Based Operational Approach. ISPRS J. Photogramm. Remote Sens. 2015, 103, 7–27. [Google Scholar] [CrossRef]
- Velastegui-Montoya, A.; Montalván-Burbano, N.; Carrión-Mero, P.; Rivera-Torres, H.; Sadeck, L.; Adami, M. Google Earth Engine: A Global Analysis and Future Trends. Remote Sens. 2023, 15, 3675. [Google Scholar] [CrossRef]
- Gorelick, N.; Hancher, M.; Dixon, M.; Ilyushchenko, S.; Thau, D.; Moore, R. Google Earth Engine: Planetary-Scale Geospatial Analysis for Everyone. Remote Sens. Environ. 2017, 202, 18–27. [Google Scholar] [CrossRef]
- Medina Medina, A.J.; Salas López, R.; Zabaleta Santisteban, J.A.; Tuesta Trauco, K.M.; Turpo Cayo, E.Y.; Huaman Haro, N.; Oliva Cruz, M.; Gómez Fernández, D. An Analysis of the Rice-Cultivation Dynamics in the Lower Utcubamba River Basin Using SAR and Optical Imagery in Google Earth Engine (GEE). Agronomy 2024, 14, 557. [Google Scholar] [CrossRef]
- Fritz, S.; See, L.; Bayas, J.C.L.; Waldner, F.; Jacques, D.; Becker-Reshef, I.; Whitcraft, A.; Baruth, B.; Bonifacio, R.; Crutchfield, J.; et al. A Comparison of Global Agricultural Monitoring Systems and Current Gaps. Agric. Syst. 2019, 168, 258–272. [Google Scholar] [CrossRef]
- Scurrah, M.; Andersen, R.; Winge, T. Background Study 8 Farmers’ Rights in Peru Farmers’ Perspectives. In The Farmers’ Rights Project Background Study 8; Fridtjof Nansen Institute: Lysaker, Norway, 2008; p. 81. [Google Scholar]
- Zimmerer, K.S.; de Haan, S.; Jones, A.D.; Creed-Kanashiro, H.; Tello, M.; Amaya, F.P.; Carrasco, M.; Meza, K.; Tubbeh, R.M.; Nguyen, K.T.; et al. Indigenous Smallholder Struggles in Peru: Nutrition Security, Agrobiodiversity, and Food Sovereignty amid Transforming Global Systems and Climate Change. J. Lat. Am. Geogr. 2020, 19, 74–111. [Google Scholar] [CrossRef]
- García, L.; Veneros, J.; Tineo, D. Severe Acute Respiratory Syndrome (SARS-CoV-2): A National Public Health Emergency and Its Impact on Food Security in Peru. Sci. Agropecu. 2020, 11, 241–245. [Google Scholar] [CrossRef]
- Fort, R.; Espinoza, M.; Espinoza, Á. COVID-19 y Las Migraciones de La Ciudad Al Campo En El Perú: Identificación de Amenazas y Oportunidades Para El Uso Sostenible Del Capital Natural; Inter-American Development Bank: Washington, DC, USA, 2021; p. 60. [Google Scholar]
- Benítez, M.A.; Velasco, C.; Sequeira, A.R.; Henríquez, J.; Menezes, F.M.; Paolucci, F. Responses to COVID-19 in Five Latin American Countries. Heal. Policy Technol. 2020, 9, 525–559. [Google Scholar] [CrossRef]
- Instituto Nacional de Estadística e Informática Estadísticas: Cuentas Nacionales. Available online: https://m.inei.gob.pe/estadisticas/indice-tematico/national-accounts/ (accessed on 10 June 2024).
- Instituto Geográfico Nacional Peru—Subnational Administrative Boundaries. Available online: https://data.humdata.org/dataset/cod-ab-per? (accessed on 10 June 2024).
- Beaman, L.; Dillon, A. Do Household Definitions Matter in Survey Design? Results from a Randomized Survey Experiment in Mali. J. Dev. Econ. 2012, 98, 124–135. [Google Scholar] [CrossRef]
- INEI. Directorio de Comunidades Nativas y Campesinas; Instituto Nacional de Estadística e Informática: Lima, Peru, 2018. Available online: https://www.inei.gob.pe/media/MenuRecursivo/publicaciones_digitales/Est/Lib1597/ (accessed on 10 June 2024).
- García, L.; Veneros, J.; Pucha-Cofrep, F.; Chávez, S.; Bustamante, D.E.; Calderón, M.S.; Morales, E.; Oliva, M. Geospatial Analysis of Soil Erosion Including Precipitation Scenarios in a Conservation Area of the Amazon Region in Peru. Appl. Environ. Soil Sci. 2021, 2021, 1–21. [Google Scholar] [CrossRef]
- Veneros, J.E.; García, L. Application of the Standardized Vegetation Index (Svi) and Google Earth Engine (Gee) for Drought Management in Peru. Trop. Subtrop. Agroecosystems 2021, 25, 1–13. [Google Scholar] [CrossRef]
- Tian, S.; Zhang, X.; Tian, J.; Sun, Q. Random Forest Classification of Wetland Landcovers from Multi-Sensor Data in the Arid Region of Xinjiang, China. Remote Sens. 2016, 8, 954. [Google Scholar] [CrossRef]
- Mantas, V.; Caro, C. User-Relevant Land Cover Products for Informed Decision-Making in the Complex Terrain of the Peruvian Andes. Remote Sens. 2023, 15, 3303. [Google Scholar] [CrossRef]
- Castillo, E.B.; Turpo Cayo, E.Y.; De Almeida, C.M.; López, R.S.; Rojas Briceño, N.B.; Silva López, J.O.; Gurbillón, M.Á.B.; Oliva, M.; Espinoza-Villar, R. Monitoring Wildfires in the Northeastern Peruvian Amazon Using Landsat-8 and Sentinel-2 Imagery in the GEE Platform. ISPRS Int. J. Geo-Inf. 2020, 9, 564. [Google Scholar] [CrossRef]
- Brovelli, M.A.; Molinari, M.E.; Hussein, E.; Chen, J.; Li, R. The First Comprehensive Accuracy Assessment of Globel and 30 at a National Level: Methodology and Results. Remote Sens. 2015, 7, 4191–4212. [Google Scholar] [CrossRef]
- Sonia; Ghosh, T.; Gacem, A.; Alsufyani, T.; Alam, M.M.; Yadav, K.K.; Amanullah, M.; Cabral-Pinto, M.M.S. Geospatial Evaluation of Cropping Pattern and Cropping Intensity Using Multi Temporal Harmonized Product of Sentinel-2 Dataset on Google Earth Engine. Appl. Sci. 2022, 12, 12583. [Google Scholar] [CrossRef]
- Hamud, A.M.; Shafri, H.Z.M.; Shaharum, N.S.N. Monitoring Urban Expansion and Land Use/Land Cover Changes in Banadir, Somalia Using Google Earth Engine (GEE). In IOP Conference Series: Earth and Environmental Science, Proceedings of the International Conference on Geomatics and Geospatial Technology (GGT 2021), Shah Alam, Malaysia, 23–24 March 2021; IOP Publishing Ltd.: Bristol, UK, 2021; Volume 767. [Google Scholar]
- Ruekkasaem, L.; Sasananan, M. Forecasting Agricultural Products Prices Using Time Series Methods for Crop Planning. Int. J. Mech. Eng. Technol. IJMET 2018, 9, 957–971. [Google Scholar]
- Sujjaviriyasup, T.; Pitiruek, K. Agricultural Product Forecasting Using Machine Learning Approach. Int. J. Math. Anal. 2013, 7, 1869–1875. [Google Scholar] [CrossRef]
- Zangeneh, M.; Omid, M.; Akram, A. Assessment of Machinery Energy Ratio in Potato Production by Means of Artificial Neural Network. African J. Agric. Res. 2010, 5, 993–998. [Google Scholar] [CrossRef]
- Jain, R.; Meena, M.L.; Dangayach, G.S.; Bhardwaj, A.K. Effect of Individual and Work Parameters on Musculoskeletal Health of Manual Agriculture Workers. Int. J. Ind. Syst. Eng. 2019, 32, 56–70. [Google Scholar] [CrossRef]
- Guerra, L.C.; Hoogenboom, G.; Hook, J.E.; Thomas, D.L.; Boken, V.K.; Harrison, K.A. Evaluation of On-Farm Irrigation Applications Using the Simulation Model EPIC. Irrig. Sci. 2005, 23, 171–181. [Google Scholar] [CrossRef]
- Gauch, H.G.; Hwang, J.T.G.; Fick, G.W.; Gauch, H.G.; Fick, G.W. Model Evaluation by Comparison of Model-Based Predictions and Measured Values. Agron. J. 2003, 95, 1442–1446. [Google Scholar] [CrossRef]
- Haryanti, Y.; Menanggal, D.; Surabaya, K. Prediksi Profitabilitas Bank Umum Konvensional Pada Masa Pandemi COVID-19. J. Stat. J. Ilm. Teor. Dan Apl. Stat. 2022, 15, 245–250. [Google Scholar] [CrossRef]
- Oktavilia, S.; Firmansyah, F. International Journal of Economics and Financial Issues The Relationships of Environmental Degradation and Trade Openness in Indonesia. Int. J. Econ. Financ. Issues 2016, 6, 125–129. [Google Scholar]
- Rojas-Briceño, N.B.; García, L.; Cotrina-Sánchez, A.; Goñas, M.; Salas López, R.; Silva López, J.O.; Oliva-Cruz, M. Land Suitability for Cocoa Cultivation in Peru: AHP and MaxEnt Modeling in a GIS Environment. Agronomy 2022, 12, 2930. [Google Scholar] [CrossRef]
- Wang, Y.; Sun, Y.; Cao, X.; Wang, Y.; Zhang, W.; Cheng, X. A Review of Regional and Global Scale Land Use/Land Cover (LULC) Mapping Products Generated from Satellite Remote Sensing. ISPRS J. Photogramm. Remote Sens. 2023, 206, 311–334. [Google Scholar] [CrossRef]
- Venter, Z.S.; Barton, D.N.; Chakraborty, T.; Simensen, T.; Singh, G. Global 10 m Land Use Land Cover Datasets: A Comparison of Dynamic World, World Cover and Esri Land Cover. Remote Sens. 2022, 14, 4101. [Google Scholar] [CrossRef]
- Brannstrom, C.; Filippi, A.M. Remote Classification of Cerrado (Savanna) and Agricultural Land Covers in Northeastern Brazil. Geocarto Int. 2008, 23, 109–134. [Google Scholar] [CrossRef]
- Cui, Y.; Liu, R.; Li, Z.; Zhang, C.; Song, X.P.; Yang, J.; Yu, L.; Chen, M.; Dong, J. Decoding the Inconsistency of Six Cropland Maps in China. Crop J. 2024, 12, 281–294. [Google Scholar] [CrossRef]
- Halvorsen, R.; Skarpaas, O.; Bryn, A.; Bratli, H.; Erikstad, L.; Simensen, T.; Lieungh, E. Towards a Systematics of Ecodiversity: The EcoSyst Framework. Glob. Ecol. Biogeogr. 2020, 29, 1887–1906. [Google Scholar] [CrossRef]
- Belgiu, M.; Drăgu, L. Random Forest in Remote Sensing: A Review of Applications and Future Directions. ISPRS J. Photogramm. Remote Sens. 2016, 114, 24–31. [Google Scholar] [CrossRef]
- van der Westhuizen, S.; Heuvelink, G.B.M.; Hofmeyr, D.P. Multivariate Random Forest for Digital Soil Mapping. Geoderma 2023, 431, 116365. [Google Scholar] [CrossRef]
- Xiao, T.; Segoni, S.; Liang, X.; Yin, K.; Casagli, N. Generating Soil Thickness Maps by Means of Geomorphological-Empirical Approach and Random Forest Algorithm in Wanzhou County, Three Gorges Reservoir. Geosci. Front. 2023, 14, 101514. [Google Scholar] [CrossRef]
- Fernando, W.A.M.; Senanayake, I.P. Developing a Two-Decadal Time-Record of Rice Field Maps Using Landsat-Derived Multi-Index Image Collections with a Random Forest Classifier: A Google Earth Engine Based Approach. Inf. Process. Agric. 2023, 11, 145–161. [Google Scholar] [CrossRef]
- Foody, G.M.; Mathur, A. Toward Intelligent Training of Supervised Image Classifications: Directing Training Data Acquisition for SVM Classification. Remote Sens. Environ. 2004, 93, 107–117. [Google Scholar] [CrossRef]
- Yang, X.; Qiu, S.; Zhu, Z.; Rittenhouse, C.; Riordan, D.; Cullerton, M. Mapping Understory Plant Communities in Deciduous Forests from Sentinel-2 Time Series. Remote Sens. Environ. 2023, 293, 113601. [Google Scholar] [CrossRef]
- Zhao, C.; Jia, M.; Wang, Z.; Mao, D.; Wang, Y. Toward a Better Understanding of Coastal Salt Marsh Mapping: A Case from China Using Dual-Temporal Images. Remote Sens. Environ. 2023, 295, 113604. [Google Scholar] [CrossRef]
- Cheng, Y.; Lan, S.; Fan, X.; Tjahjadi, T.; Jin, S.; Cao, L. A Dual-Branch Weakly Supervised Learning Based Network for Accurate Mapping of Woody Vegetation from Remote Sensing Images. Int. J. Appl. Earth Obs. Geoinf. 2023, 124, 103499. [Google Scholar] [CrossRef]
- Tangirala, S. Evaluating the Impact of GINI Index and Information Gain on Classification Using Decision Tree Classifier Algorithm*. Int. J. Adv. Comput. Sci. Appl. 2020, 11, 612–619. [Google Scholar] [CrossRef]
- de Azevedo, R.P.; Dallacort, R.; Boechat, C.L.; Teodoro, P.E.; Teodoro, L.P.R.; Rossi, F.S.; Filho, W.L.F.C.; Della-Silva, J.L.; Baio, F.H.R.; Lima, M.; et al. Remotely Sensed Imagery and Machine Learning for Mapping of Sesame Crop in the Brazilian Midwest. Remote Sens. Appl. Soc. Environ. 2023, 32, 101018. [Google Scholar] [CrossRef]
- Jamali, A.; Roy, S.K.; Ghamisi, P. WetMapFormer: A Unified Deep CNN and Vision Transformer for Complex Wetland Mapping. Int. J. Appl. Earth Obs. Geoinf. 2023, 120, 13333. [Google Scholar] [CrossRef]
- Rabby, Y.W.; Li, Y.; Hilafu, H. An Objective Absence Data Sampling Method for Landslide Susceptibility Mapping. Sci. Rep. 2023, 13, 1–15. [Google Scholar] [CrossRef]
- Gómez-Fernández, D.; López, R.S.; Zabaleta-Santisteban, J.A.; Medina-Medina, A.J.; Goñas, M.; Silva-López, J.O.; Oliva-Cruz, M.; Rojas-Briceño, N.B. Landsat Images and GIS Techniques as Key Tools for Historical Analysis of Landscape Change and Fragmentation. Ecol. Inform. 2024, 82, 102738. [Google Scholar] [CrossRef]
- Scullion, J.J.; Vogt, K.A.; Sienkiewicz, A.; Gmur, S.J.; Trujillo, C. Assessing the Influence of Land-Cover Change and Conflicting Land-Use Authorizations on Ecosystem Conversion on the Forest Frontier of Madre de Dios, Peru. Biol. Conserv. 2014, 171, 247–258. [Google Scholar] [CrossRef]
- Barboza, E.; Salazar, W.; Gálvez-Paucar, D.; Valqui-Valqui, L.; Saravia, D.; Gonzales, J.; Aldana, W.; Vásquez, H.V.; Arbizu, C.I. Cover and Land Use Changes in the Dry Forest of Tumbes (Peru) Using Sentinel-2 and Google Earth Engine Data. Environ. Sci. Proc. 2022, 22, 2. [Google Scholar] [CrossRef]
- Kwan, M.P. The Uncertain Geographic Context Problem. Ann. Assoc. Am. Geogr. 2012, 102, 958–968. [Google Scholar] [CrossRef]
- Hunter, M.C.; Smith, R.G.; Schipanski, M.E.; Atwood, L.W.; Mortensen, D.A. Agriculture in 2050: Recalibrating Targets for Sustainable Intensification. Bioscience 2017, 67, 386–391. [Google Scholar] [CrossRef]
- Tarazona, Y.; Miyasiro-López, M. Monitoring Tropical Forest Degradation Using Remote Sensing. Challenges and Opportunities in the Madre de Dios Region, Peru. Remote Sens. Appl. Soc. Environ. 2020, 19, 100337. [Google Scholar] [CrossRef]
- Haller, A. Los Impactos Del Crecimiento Urbano En Los Campesinos Andinos. Un Estudio de Percepción En La Zona Rural-Urbana de Huancayo, Perú. Espac. Desarro. 2017, 29, 37–56. [Google Scholar] [CrossRef][Green Version]
- Imbach, P.; Manrow, M.; Barona, E.; Barretto, A.; Hyman, G.; Ciais, P. Spatial and Temporal Contrasts in the Distribution of Crops and Pastures across Amazonia: A New Agricultural Land Use Data Set from Census Data since 1950. Glob. Biogeochem. Cycles 2015, 29, 898–916. [Google Scholar] [CrossRef]
- Sánchez-Cuervo, A.M.; de Lima, L.S.; Dallmeier, F.; Garate, P.; Bravo, A.; Vanthomme, H. Twenty Years of Land Cover Change in the Southeastern Peruvian Amazon: Implications for Biodiversity Conservation. Reg. Environ. Chang. 2020, 20, 8. [Google Scholar] [CrossRef]
- Karimi, H.; Jafarnezhad, J.; Khaledi, J.; Ahmadi, P. Monitoring and Prediction of Land Use/Land Cover Changes Using CA-Markov Model: A Case Study of Ravansar County in Iran. Arab. J. Geosci. 2018, 11, 1–9. [Google Scholar] [CrossRef]
- Bounouh, O.; Essid, H.; Farah, I.R. Prediction of Land Use/Land Cover Change Methods: A Study. In Proceedings of the 2017 International Conference on Advanced Technologies for Signal and Image Processing (ATSIP), Fez, Morocco, 22–24 May 2017. [Google Scholar] [CrossRef]
- Trigoso, D.I.; Salas López, R.; Rojas Briceño, N.B.; Silva López, J.O.; Gómez Fernández, D.; Oliva, M.; Quiñones Huatangari, L.; Terrones Murga, R.E.; Castillo, E.B.; Ángel, M.; et al. Land Suitability Analysis for Potato Crop in the Jucusbamba and Tincas Microwatersheds (Amazonas, NW Peru): AHP and RS-GIS Approach. Agronomy 2020, 10, 1898. [Google Scholar] [CrossRef]
- Alva, J.; Rojas, J. Improving Rural Livestock Farmers’ Competitiveness through the Livelihoods Approach 1. Braz. J. Oper. Prod. Manag. 2022, 19, 6–13. [Google Scholar] [CrossRef]
- Beltrán-Tolosa, L.M.; Cruz-Garcia, G.S.; Ocampo, J.; Pradhan, P.; Quintero, M. Rural Livelihood Diversification Is Associated with Lower Vulnerability to Climate Change in the Andean-Amazon Foothills. PLoS Clim. 2022, 1, e0000051. [Google Scholar] [CrossRef]
- Machaca, A.T.; Guti, H.; Aliaga, B.T.; Micaela, D.; Ccoa, C.; Quispe, R.Y.; Herbert, J.; Cahuana, S.; Nanci, C.; Ttito, D.; et al. Peru’s National Policy on Financial Inclusion and Its Alignment with Sustainable Development Goal I. Sustainability 2024, 16, 4151. [Google Scholar] [CrossRef]
- Lopez-Vargas, A.; Ledezma, A.; Bott, J.; Sanchis, A. IoT for Global Development to Achieve the United Nations Sustainable Development Goals: The New Scenario after the COVID-19 Pandemic. IEEE Access 2021, 9, 124711–124726. [Google Scholar] [CrossRef]
- Myška, M.; Koukal, P.; Vlachová, Z.; Woznica, O. Liability of Hosting ISPs: The Czech Perspective. In Internet and New Technologies Law; Nomos Verlagsgesellschaft mbH & Co. KG: Baden-Baden, Germany, 2021; pp. 393–404. [Google Scholar]
- Linkov, I.; Trump, B.D.; Poinsatte-Jones, K.; Florin, M.V. Governance Strategies for a Sustainable Digital World. Sustainability 2018, 10, 440. [Google Scholar] [CrossRef]
- Ge, L.; Anten, N.P.; DE van Dixhoorn, I.; Feindt, P.H.; Kramer, K.; Leemans, R.; Meuwissen, M.P.; Spoolder, H.; Sukkel, W. Why We Need Resilience Thinking to Meet Societal Challenges in Bio-Based Production Systems. Curr. Opin. Environ. Sustain. 2016, 23, 17–27. [Google Scholar] [CrossRef]


Disclaimer/Publisher’s Note: The statements, opinions and data contained in all publications are solely those of the individual author(s) and contributor(s) and not of MDPI and/or the editor(s). MDPI and/or the editor(s) disclaim responsibility for any injury to people or property resulting from any ideas, methods, instructions or products referred to in the content. |
© 2024 by the authors. Licensee MDPI, Basel, Switzerland. This article is an open access article distributed under the terms and conditions of the Creative Commons Attribution (CC BY) license (https://creativecommons.org/licenses/by/4.0/).