Article

Optimization and Analysis of the Impact of Food Hub Location on GHG Emissions in a Short Food Supply Chain

LMAH, FR-CNRS-3335, Université Le Havre Normandie, 76600 Le Havre, France
*
Author to whom correspondence should be addressed.
Sustainability 2024, 16(17), 7781; https://doi.org/10.3390/su16177781
Submission received: 5 July 2024 / Revised: 27 August 2024 / Accepted: 3 September 2024 / Published: 6 September 2024

Abstract

:
The trend in many countries is to promote local consumption of food. This is done by encouraging consumers to connect directly with local farmers or by building hubs that are known as food hubs. Most of the studies on the environmental impact of short food supply chains (SFSCs) focus on the evaluation the greenhouse gas (GHG) emissions in SFSCs where consumers are directly connected to local farmers. Also, these studies mainly focus on GHG emissions due to transportation. To the best of our knowledge, there is no previous study or theoretical models on the estimation and impact of food hub selection and design on total GHG emissions, although they can play an important role in economic, environmental, and social sustainability of an SFSC. In this paper, we develop a framework to estimate GHG emissions from hubs and transportation in a two-echelon SFSC. We introduce a novel approach that utilizes piece-wise linear functions to model the hubs’ GHG emissions combined with an optimization model to calculate the total GHG emission of the SFSC. With this approach, we address the gaps in the literature for a more realistic supply chain model. Our optimization-based approach determines the optimal location, size, and number of food hubs to minimize total GHG emissions. We apply this framework, under various conditions, to the design of a particular SFSC in the Normandy region of France. We also extend the study to other countries. We provide several numerical results that are then analysed. Our analysis shows that the number of foods hubs, their location, and their design may considerably impact the total GHG emissions, depending on the input parameters and data. Furthermore, this study contributes to the advancement of sustainable and green supply chain management, providing valuable insights for practitioners and policy makers aiming to optimize SFSCs for environmental sustainability.

1. Introduction

Supply chains for food constitute an important part of the supply chain globally; as part of perishable/fresh products, food supply chains have distinct features and characteristics that differentiate them from other supply chains. Fundamentally speaking, there is a continuous and significant change in the quality of food products throughout the entire supply chain until the final point of delivery. Transportation of food products generally represents the delivery from its origin (e.g., the supplier or the production plant) to its destination (e.g., the wholesaler, the retailer, or the final customer/consumer) [1].
The food supply system has been strongly affected by the phenomenon of globalisation since the second half of the 19th century [2]. Under globalisation, the direct relationship between farmers and consumers is replaced with a more complex system that includes more actors and many intermediaries [3]; it leads to a collapse in biodiversity and ecosystems, an increase of obesity and food poverty, and the impossibility for consumers to have adequate information about food provenance and quality [4,5].
However, currently, consumers and governments are becoming more and more aware of the negative externalities of the globalised food system, and they are willing to build more efficient local food systems to directly connect with farmers in order to support the local communities, to consume healthy food [6,7,8], and to reduce the environmental impact of the food consumption [9,10,11]. As one of the pillars of food sovereignty, a short food supply chain (SFSC) can answer these emerging needs. Much literature has examined the benefits of SFSCs and their positive impact on human health and well-being [12,13,14,15,16,17,18,19].

1.1. Research Gap

In SFSCs, greenhouse gas (GHG) emissions are often a key consideration in the design of the food supply chain. Research has shown that SFSCs tend to be more environmentally sustainable than long food supply chains, with the potential for further improvements through reduced fuel consumption, lower GHG emissions, and fewer distribution phases [20,21]. However, most studies on the environmental impact of SFSCs focus primarily on evaluating GHG emissions where consumers have direct connections with local farmers [22,23]. In classical SFSCs, direct shipping is seen as a means to fulfill local food demand, necessitating farms to cater to each consumer’s needs without considering quantity and frequency. This approach often leads to inefficient transportation resource utilization due to small demand volumes, coupled with high transportation costs and low economical efficiency [24]. Consequently, farms are compelled to allocate more resources towards production, distribution, and marketing efforts.
Many researchers pointed out the importance of a suitable logistic organisation in SFSCs for improving both economic and environmental sustainability. Cooperation between farmers involved in the SFSC is a key point for achieving this goal [19]. The notion of Food Hubs has been introduced to allow such a cooperation between farmers [2,25,26,27,28]. They support small farms by offering production, distribution, and marketing services and connecting local producers with consumers and institutional buyers like restaurants and schools. They help farmers access larger markets, allowing them to focus more on farming. By increasing access to fresh, healthy foods and streamlining the process for consumers, food hubs play a crucial role in strengthening local food systems.
As mentioned before, the efficiency of an SFSC must be studied by means of economic, environmental, and social aspects [19,29]. To the best of our knowledge, there is no study on the environmental impact of a food hub-based SFSC. Moreover, Ref. [30] highlighted the significance of studying facilities within food supply chains, especially refrigerated facilities, which is a critical gap in the existing emissions literature.

1.2. Objective of the Paper

In our paper, we propose a framework for estimating the total GHG emissions for an SFSC based on food hubs, considering emissions from both hub and transportation parts. We consider a multi-period multi-commodity two-echelon distribution system with food hubs and short distance [31,32]. The framework is based on an optimization model that calculates the optimal number and location of food hubs together with routing decisions while minimizing the total GHG emissions (hubs and transportation).

1.3. Contribution of the Paper

The contributions of this paper, distinguishing it from related research, include:
  • Integrating strategic decisions with tactical decisions to propose a hub location–vehicle planning problem in SFSCs;
  • Incorporating real-world constraints such as products demand/production unbalance;
  • Providing a model for estimating individual food hub GHG emissions by a piece-wise linear function;
  • Integrating hub selection with the evaluation of GHG emissions across various hub sizes and various food production levels;
  • Considering Normandy, France, as an realistic case study for evaluating the proposed framework.
The reminder of the paper is organized as follows. Section 2 provides the literature reviews for the related topics. Section 3 provides the general description of the two-echelon logistics system we consider. Section 4 provides the methodology of the framework for assessing total GHG emissions in the considered SFSC and the mathematical model we use for calculating the total GHG emissions. Section 5 is dedicated to the Normandy Region case study. We give details about the benchmarks, data collection, and results. We also analyse the results with further discussion in Section 6. Conclusions and future research directions are given in Section 7.

2. Literature Review

In this section, we review research closely related to our study on the multi-period, multi-commodity, two-echelon distribution system within the context of SFSCs. To the best of our knowledge, our work is the first one to consider GHG emissions of food hubs within a two-echelon SFSC, and, more generally, to study the impact of their design and location on the GHG emissions of the whole SFSC distribution system. Additionally, the combination of multiple commodities and multiple periods has not been explored together in two-echelon distribution systems.
The review is organized into several key categories: short food supply chains (SFSCs) and logistics, with a focus on the two-echelon location-routing problem and GHG emissions in food supply chains. Specifically, Section 2.1 gives the general definitions of SFSCs and discusses how they are measured. Section 2.2 covers recent advances in food hubs, highlighting their functions and benefits. Section 2.3 reviews literature on SFSCs with the multi-commodity nature of food products. Section 2.4 addresses the logistical challenges in SFSCs, focusing on efforts to improve economic and environmental efficiency. Section 2.5 summarizes recent studies on GHG emissions in food supply chains, particularly those related to transportation and facilities. Section 2.6 explores recent developments in the two-echelon location-routing problem in SFSCs from an operational research perspective.

2.1. Short Food Supply Chains (SFSCs)

An SFSC typically refers to a system in which food is produced, processed, and distributed over a relatively small geographical area. This often involves direct relationships between producers, retailers, and consumers, bypassing or minimizing the involvement of intermediaries such as wholesalers or large-scale distributors. SFSCs are characterized by transparency, traceability, and a focus on local or regional sourcing, aiming to reduce the distance between producers and consumers and promote sustainability, freshness, and community resilience. Examples include farmers’ markets, community-supported agriculture (CSA) programs [33,34], farm-to-table restaurants, and direct sales from farms. To define an SFSC or a local food system, the most intuitive and frequent feature is to give the geographical proximity, that is, the closeness between producers and consumers [35,36]. This closeness can be conceptualised in terms of political boundaries, that is, in terms of regions or countries [37,38], or in relation to distance, whether measured in kilometres [39,40] or in time [37]. When it is given by the latter, the distance defined by kilometres in most literature varies from 30 to 100 km [31,41], but its upper limits can change depending on the case studies [42,43,44]. The distance measured by time ranges between 5 h to 1 day [35,37]. In addition, communication and information must be guaranteed within the SFSC for all possible intermediates and actors [2,45]. The definition given by the European Union (Reg. 1305/13) has both “social” proximity (minimum or null number of actors) and geographical proximity (physical distance between farmer and consumers): an SFSC is “a supply chain involving a limited number of economic operators committed to cooperation, local economic development, and close geographical and social relations between producers, processors and consumers” [46].

2.2. Food Hubs in SFSCs

In general, the supply chain can be composed with many stages (also called layers or tiers) [1]. Transportation activities occurs among these pairs of stages. Each pair of stages represents one level of the distribution network and is usually referred to as an echelon. Freight transportation can be globally categorized into two classes according to the presence of one or more intermediate facilities.
  • Direct shipping happens when freight is delivered directly from its origin to its destination;
  • Indirect shipping occurs when freight, or part of the freight, is transited through one or more intermediate facilities (e.g., cross-docks, distribution centers, or hubs) before reaching its destination.
Multi-echelon distribution systems generally represent the network where freight has to move through multiple intermediate facilities. These intermediate facilities offer services such as storage, merging, consolidation, transshipment operations, or assurance [47]. It is not surprising that multi-echelon distribution systems are attractive, as they considerably affect both the product costs and the customer experience. On one hand, they help the small production companies to grow their markets, to reduce their transportation costs, and to lighten the distribution and the marketing burdens; on the other hand, they permit the customers to access a considerable larger market to compare, purchase, and group products; furthermore, they reduce the global procurement costs. There is a need for specialised and cost-effective logistical services that could be provided by a third-party logistics service provider, as was expressed by different chain participants in the local food supply chain [48]. With these ideas, hybrid food hubs (HFHs) or local food hubs are then employed as innovative organisations for aggregation and distribution aimed at strengthening the connection between producers and consumers [2,49,50]; they incorporate physical infrastructures (e.g., logistical skills, IT management system, contracts, and invoices) and operational infrastructures (e.g., vehicle fleet, packaging equipment, and storage structure) of conventional food systems. They are potentially able to achieve many of the advantages of both alternative and conventional systems while overcoming the main critical logistics issues of SFSCs [2,51].

2.3. Multi-Commodities in SFSCs

An SFSC can be a complex system not only because intermediate facilities are employed to make it a multi-echelon distribution system, but also because seasonal- and product-based factors need to be taken into account. “The explicit consideration of different commodities is essential in the agri-food supply chains since availability at the producer depends on the production of farmers and requirements made by customers concern specific commodities” [32]. From the operation research point of view, it leads to the multi-period multi-commodity and multi-echelon inventory, planning, location, routing, distribution system. Two-echelon distribution systems are a special case of the multi-echelon systems where the network is composed of two echelons; it is generally the case related to short fresh food supply systems [1,32,52,53]. In this case, after leaving its origin—the producer—food products are first delivered to an intermediate facility—food hub for all necessary operations. It is then moved from the intermediate facility towards its destination—the consumer. Under this framework, the flow of the freight in one echelon must be coordinated with that in the other echelon. As a consequence, location problems of the intermediate facilities and routing problems arise in two-echelon distribution systems [1]. According to the type of decisions involved, we consider
  • Strategic planning decisions: they include concerning the infrastructure of the network, typically the number and the location of the facilities;
  • Tactical planning decisions: they include the routing of freight through the network and allocation of customers to the intermediate facilities.
Within these concepts, several topics are investigated in the literature, such as clustering of producers based on their geographical proximity [54]; location problem for collection/distribution/selling centres optimized using different clustering techniques such as centre-of-gravity, load–distance, location factor rating techniques, and vehicle routing-based analysis [54,55,56,57,58]; and routing problems for collection and distribution optimized mainly using vehicle routing techniques that minimize travelling distance, time [54,55,56,58,59], and number of trucks used [60].

2.4. Logistic Issues in SFSCs

Logistics is one of the main weak points for the development and the effectiveness of SFSCs. Indeed, as part of the perishable products—food—the most critical and important logistics decisions at the operational level are inventory management, vehicle routing, and scheduling of vehicles for delivery under an efficient and effective manner [2]. Efficient management of vehicle routes for delivery of products from a supplier to a set of customers can result in significant savings in both operational cost and greenhouse gas (GHG) emissions [15,61]. Likewise, inventory control constitutes an important logistics operation, especially when products have a limited shelf life. Therefore, improving the logistics in an SFSC is still challenging when transforming it into a concrete and sustainable alternative to the globalised food system [2,31,62].
It is a common awareness that an efficient logistics system is beneficial for a food supply chain; necessary strategic coordinating mechanisms need to be employed to solve a complex food supply chain problem. All activities included in logistics of the agro-food system, such as agriculture product production, purchasing, transportation, warehousing, loading and unloading, handling, packaging, processing, distribution, and information processing, should be optimised in a strategical cooperative way [2,63]. An efficient management of logistics operations can yield out a traceable [64], economical, and environmental friendly system [26,65,66,67]; it is a critical factor to build a successful SFSC. Logistics improvement can contribute to overcoming the main weaknesses of SFSCs revealed by different SWOT analyses [66,68,69].
The main issues for a good supply chain design related to the food supply system are the location and route optimization. These contribute to reducing distance travelled [km], vehicle emissions [kgCO2], transport costs [€], delivery time [hours], and number of routes. In these optimization problems, both collection and distribution need to be taken into account, and the members of the network are localised: local food producers, wholesalers (collection and distribution points), and customers/delivery points (e.g., food retailers, restaurants, cafes, hotels, final customers, etc.) are identified and mapped using maps or geographic information system software [2]. Relevant data should be collected, such as truck employment, daily sequence of trips, time required for delivery, delivery time windows, annual production quantity/quantity of delivery from each producer, product delivery distance, type of vehicles, load rate of vehicles, annual revenue, production type, delivery frequency and weight, product distribution cost, and customers’ demands.

2.5. Greenhouse Gas (GHG) Emissions in SFSCs

Greenhouse gas (GHG) emissions are frequently another crucial factor considered in the design of the food supply chain. Short geographical distance between producers and consumers may not necessarily imply a decrease in GHG emissions [70,71,72,73,74], but greater environmental sustainability of SFSCs compared with long food supply chains has been demonstrated [20,21], and there is still potential improvement with lower fuel consumption, GHG emissions, and fewer distribution phases [20,75,76,77].
Within this topic, most literature in the related field tends to focus on two main directions. For instance, in transportation, studies such as [22] examine the selection of optimal facility locations to minimize CO2 emissions resulting from transportation activities between facilities and customers, utilizing methods like emission-based centre-of-gravity analysis. Similarly, the research in [23] addresses the perishability of products in food supply chain distribution and analyses the total transportation GHG emissions within hub networks. Despite the frequent neglect of hub emissions in such analyses, numerous researchers are now investigating emissions from the perspective of hubs. For example, ref. [78] conducted environmental modeling to forecast the future trajectory of GHG emissions from cold warehouses in China from 2021 to 2060. Additionally, Ref. [30] underscored the significance and lack of studies on facilities within all transportation chains, particularly refrigerated facilities, which represent a critical gap in existing emissions literature. Notably, their article is the first to assess emissions from refrigerated facilities handling and storing fresh fruit in South Africa.

2.6. Two-Echelon Location Routing Problem in SFSCs from the OR Perspectives

The mathematical modeling, formulation, and problem-solving methodologies for the multi-commodity two-echelon location routing problem belong to the broad class of two-echelon routing problems, which are distribution problems where transportation activities take place in two echelons of a supply chain. There exists a wide literature on this class of problems. Recent survey on two-echelon routing problems can be found in [1], and transportation problems with intermediate facilities was discussed in [52]; as for the latter, they identified three classes of problems with intermediate facilities: vehicle routing problems, transshipment problems, and service network design problems.
To the best of our knowledge, the multiple commodities and the multiple periods aspects have not been considered together before in two-echelon distribution systems. However, literature can be found in discussing the models of multi-item, multi-location, multi-echelon, multi-period inventory systems [79], solving the multi-commodity two-echelon routing problems [32], and solving the multi-commodity two-echelon location problems [80,81]. In [81], a two-echelon supply chain network design problem in deterministic, single-period, multi-commodity contexts is proposed; it involves both strategic and tactical levels of supply chain planning, including locating and sizing manufacturing plants and distribution warehouses, assigning the retailers’ demands to the warehouses and the warehouses to the plants, as well as selecting transportation modes. A mixed-integer programming model integrating the above mentioned decisions is given to minimize total costs of the network including transportation, lead-times, and inventory holding costs for products, as well as opening and operating costs for facilities, and, moreover, the authors developed an efficient Lagrangian-based heuristic solution algorithm for solving the real-sized problems. In [32], they developed an decomposition approach for the multi-commodity two-echelon routing problem; the problem is separated into two sub-problems associated with the collection and delivery phases, and two sequential solution approaches are proposed based on the solved order of the collection and delivery sub-problems. The information of the first phase solution is taken into account as an input for solving the second phase problem; the second phase problem is formulated as a vehicle routing problem (VRP) with multiple commodities and multiple depots, with a maximum available quantity of each commodity at the depots, and a VRP with multiple depots is a well-studied problem in the literature [82].

3. The Two-Echelon Distribution System in SFSCs and Optimization Issues

3.1. Presentation of the Logistic Scheme

In this section, we present the two-echelon SFSC. This supply chain is relying on food hubs, which aim to aggregate local food before it is transported to the consumers. The transportation network is composed of three distinct actors:
  • Farmers serving as the origins or production points within the network,
  • Food hubs acting as intermediate points for food collection, storage, and distribution within the network,
  • Consumers representing all endpoints for food consumption within the network.
Within this network, various product classes are transported, with each class representing a category of food (e.g., meat, vegetables, milk) moving from farmers to consumers via the food hubs.
According to the SFSC definition, there is at most one intermediate between producers and consumers; in our supply chain, there is only one hub between each farmer and the consumers he/she serves. Thus, each farmer is assigned to a single hub and sends his/her products to this hub. Then, the hub is in charge of the distribution of the products to the consumers. Figure 1 illustrates such a distribution network. Each farmer is assigned to only one food hub, but a consumer may be served by one or more food hubs. To encourage the full utilization of local food production, when local food production exceeds demand, we prioritize meeting that demand with local products. If there is a shortfall in local production, our priority is to utilize local production. We assume that the unsatisfied part of the demand will be outsourced from the global food supply chain. Notice that we do not include the outsourced flow and its impact on the present study. These two scenarios are presented as case studies in our problem formulation in Section 4.2. We also consider that the distance between both farmers and the hubs and between the hubs and the consumers must not exceed a given limit (for instance, 80 km).

3.2. Optimization of Food Hub Design and Selection

The significance of carefully designing and selecting food hubs cannot be overstated. These hubs serve as central decision-making points for transportation, storage, and distribution activities. It is widely acknowledged that suboptimal hub locations or insufficient capacities can result in inefficient transportation routes, increased vehicle emissions, and, ultimately, elevated carbon footprints.
In our focus of minimizing total CO2 emissions within the two-echelon farmer–hub–consumer SFSC network, we have developed an optimization framework for food hub design and selection. This framework relies on critical factors such as farm production levels, potential hub locations, consumer demand patterns, and vehicle availability. At its core, the framework focuses on strategically designing and selecting food hubs within the network. These hubs serve as crucial nodes for aggregating and distributing goods, directly influencing the total emissions produced throughout the supply chain. By meticulously assessing farm locations, production levels, and consumer demands, the framework identifies optimal hub location candidates. This process entails considering factors like proximity to farms and consumers, transportation infrastructure, and environmental considerations to minimize carbon emissions. Furthermore, the framework evaluates the capacity and availability of vehicles for transportation tasks. Efficient vehicle assignment and transportation planning are additional measures contributing to emission reduction efforts. Thus, by prioritizing the optimization of hub locations and capacities, the framework aims to minimize total CO2 emissions while ensuring the sustainability and efficiency of the food supply chain network. This strategic approach emphasizes the crucial role of hub design in achieving environmental goals and fostering a more environmentally friendly and resilient supply chain ecosystem.

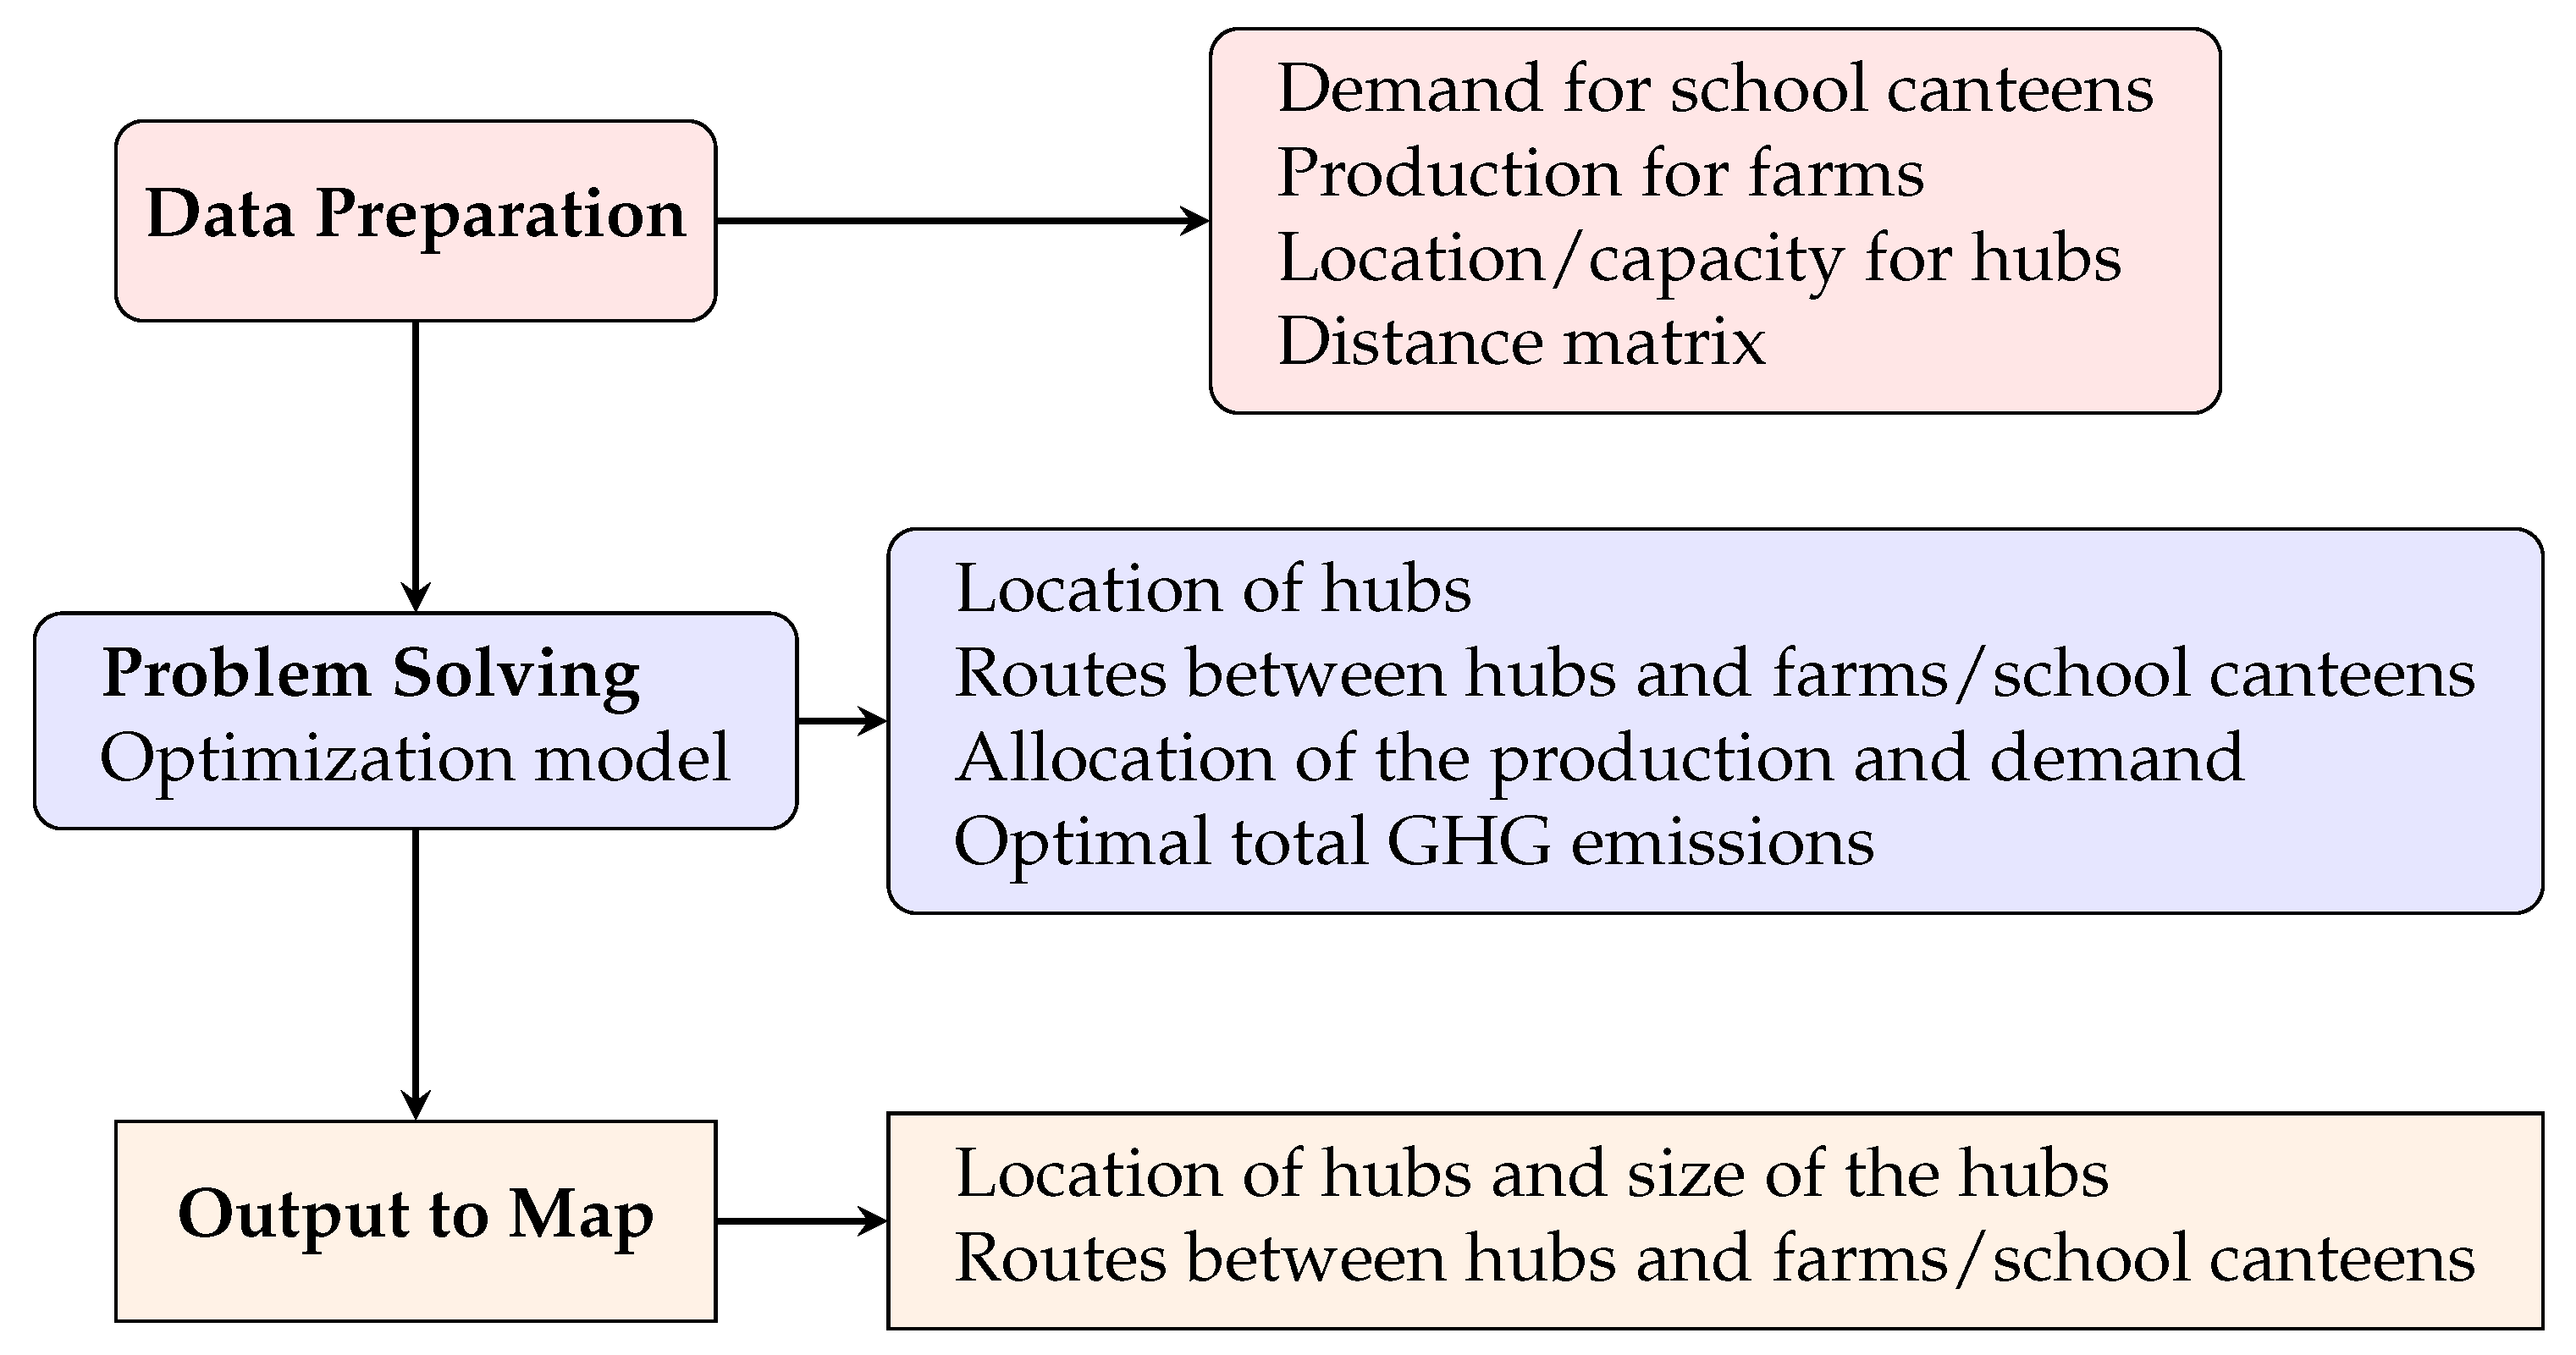
4. Methodology and Material

This paper explore the design and the impact of food hubs on the GHG emission in the SFSC, with a focus on evaluating GHG emissions as the primary objective.
The GHG emissions examined in this paper are from the food distribution phases, i.e., from transportation and food hub management.
E m i s s i o n t o t a l = E m i s s i o n t r a n s p o r t a t i o n + E m i s s i o n h u b
Our goal is to estimate the total GHG emissions using an optimization-based model. This model determines the optimal location and design of the hubs together with transportation decisions that minimize the total emissions. Thus, in Section 4.1, we provide the framework to estimate the emissions due to each vehicle and each food hub used in the distribution system. Then, we present the optimization model we use to calculate the optimal total emissions in Section 4.2.

4.1. Framework for Assessing Total GHG Emissions

While GHG emissions related to transportation are often strongly linked with traveling distances, emissions at the hub cannot be directly associated with the cost analysis models [24]. Therefore, in this subsection, we will specify the emission characteristics and address the necessary classifications.

4.1.1. Estimation of the Emission by Transportation

The emissions on the transportation side are directly linked to the vehicle type and its energy used during transportation. For example, given a vehicle type V and its diesel consumption rate V D C R , along with the diesel emission factor D E F , the transportation emissions for a traveled distance d can be estimated as:
d × V D C R × D E F .
This estimation process also applies when changing vehicle types and their energy consumption characteristics, as well as the energy emission factors associated with them.

4.1.2. Estimating the Emission by Each Hub

The content in this section predominantly stems from the research conducted by [30]. The process of quantifying emissions appears straightforward, hinging on the actual or estimated energy consumption of a facility. This energy consumption is subsequently multiplied by an emission factor, measured in kg CO2 per unit (l, kWh, kg), to convert energy consumption into emissions. The process of quantifying emissions involves several key elements outlined and categorized below. It begins with identifying the emission sources within the food hub, defining the unit of analysis, specifying assumptions regarding facility energy consumption, and establishing the energy-to-emission conversion factor.
  • Emission Sources
Regarding emission sources, facilities typically rely on two energy types: electricity and diesel. Electricity powers refrigeration plants, general lighting, and offices, whereas diesel serves backup generators and handling equipment. It is crucial to note that the choice of energy source is highly contingent on the country or region; for instance, South Africa employs diesel as a backup due to electricity shortages, a scenario that may differ elsewhere.
  • Unit of Analysis
The paper employs pallets as the unit of analysis, deviating from the conventional tonne used in emission assessments. This deviation is deemed acceptable as long as consistency is maintained throughout the assessment, enabling emission comparisons over multiple years. Consequently, the resulting unit for emission intensity factors is kg CO2 per pallet instead of kg CO2 per tonne. This adjustment is justified by industry practices, as stakeholders commonly refer to pallets as the metric or functional unit post-packing and palletization, and during distribution. Moreover, capturing pallet weight in cold stores is often overlooked due to its added operational complexity without contributing significant value. Thus, utilizing pallets as a consignment-based indicator provides a consistent metric already in use.
  • Facility Consumption Assumptions
Warehouse scale is classified into small and large, with specific pallet capacities and operational details outlined:
  • Small Warehouse: Pallet capacity of 345 pallets;
  • Large Warehouse: Pallet capacity exceeding 5000 pallets.
To estimate energy use and greenhouse gas emissions in cold chain infrastructure, several configurations are extracted from the paper. Analysing facility consumption levels is based on key assumptions:
  • The weight difference between food types and packaging configurations is negligible, implying all pallets of fruit and vegetable share the same weight;
  • Pallet weight considerations are sourced from [83] (average weight of 450 kg per pallet) and [30] (suggesting a conversion factor of 1030 kg per pallet if needed for pallet-to-weight conversion);
  • All pallets experience the same number of dwell days in a facility, irrespective of the food type or destination market;
  • The energy consumed due to cold sterilization is distributed across all pallets moving through the facility, with the impact of fruit destined for different markets considered negligible;
  • The time aspect is incorporated by collecting average dwell days or obtaining the average utilization percentage of the facilities. For example, the estimated dwell days for fruit in the facility are noted as 6.72 days, according to [30].
  • Energy-to-Emission Conversion
Energy-to-emission conversion involves specific factors:
  • Electricity: The emission factor (EF) for electricity is obtained from Carbon Footprint Ltd’s 2023 Integrated Report, https://www.carbonfootprint.com/international_electricity_factors.html, accessed on 30 July 2023, which, for example, reveals an EF of 0.06207 kg CO2 per kWh for France consumers. Nevertheless, it is imperative for readers to specify this value in accordance with the region under study; this figure can fluctuate significantly based on the country and region.
  • Diesel: The EF for diesel fuel (World-to-Wheel of 3.24 kg CO2 per unit) is sourced from the European Standard [84].
  • Hub CO2 Emission Function
Given the close relationship between CO2 emissions and the size of the food hub [85,86,87], it becomes imperative to construct a piece-wise linear objective function to determine both the location and size of a hub at the time of its establishment with all the elements classified above.
An example that expresses the CO2 emissions function with the quantity flows within the hub is given as in Figure 2, in which x is the total quantity flow passing through the hub, and y is the emission. When the total quantity flow is smaller than C 1 , then the small size hub is selected; otherwise, large size hub C 2 is used, and average higher emissions is set with smaller hubs, that is, a 1 > a 2 . To construct the piece-wise linear objective function based on various utilized warehouses, it is essential to define the energy consumption within the system. Two potential approaches are available: one involves converting the diesel usage into electricity (though this is strongly discouraged), whereas the other involves translating the energy consumption directly into CO2 emissions. The CO2 emissions during electricity production vary significantly by region or country; nonetheless, we can customize the emission factors according to different regions.

4.2. The Mathematical Formulation of the Problem

In this section, the paper explores the mathematical formulation of the problem, with a focus on minimizing the GHG emissions as the primary objective. We define the following parameters, decision variables, and problem formulation.

4.2.1. Input Data

  • Parameters
Denote A , H , C , P , and T the set of farms, potential hubs, consumers, product commodity, and time period. Let
  • f h be the Emission Function of the hub h H . The function f h is defined with the piece-wise linear objective function as in Figure 2;
  • c a h be the transportation emission between the farm a A and the hub h H ;
  • c h c be the unit transportation emission between the hub h H and the consumer c C ;
  • d c k t be the demand quantity of customer c C for product k K for the period t T ;
  • w a k t be the quantity of product k K produced by farm a A for the period t T ;
  • V a , V c be the truck capacity of farm a A and of consumer c C ;
  • V k be the pallet capacity defined with respect to each product k P .
  • Assumptions
We additionally provide the following assumptions. Depending on the commodity, the total production may not be enough to fulfill the total demand for this product. For our SFSC, according to the data scenario, we consider one of these two cases for each commodity k P and each period t T :
  • Case 1:  c C d c k t > a A k P w a k t ;
  • Case 2:  c C d c k t a A k P w a k t .
In the first case, the local production is insufficient to satisfy the demand. The available production is hence used to supply a part of the demand. In the second case, the local production is sufficient to satisfy all the demand. Thus, we cover all the demand with the local production.
Depending on these cases, we add a different mathematical constraint in the formulation.
In addition, we denote by P u v the cost associated with link ( u , v ) , with u and v being two geographical locations. We let P u v = 0 when link ( u , v ) is a short-distance link, i.e., d i s t ( u , v ) 80 . For a long-distance link, i.e., d i s t ( u , v ) > 80 , we let P u v > 0 be a significantly large scalar.

4.2.2. Decision Variables

Let
  • q a h k t R + be the quantity of product k P transported on transition ( a , h ) A × H (from the farm a to the hub h) for the period t T ;
  • q h c k t R + be the quantity of product k P transported on transition ( h , c ) H × C (from the hub h to the consumer c) for the period t T ;
  • θ h t Z + be the number of pallets passing through hub h H for the period t T ;
  • θ a h t Z + be the number of trucks used for each farm–hub pair ( a , h ) A × H for the period t T ;
  • θ h c t Z + be the number of trucks used for each hub–consumer pair ( h , c ) H × C for the period t T ;
  • x a h t = 1 if the transportation link for the farm–hub pair ( a , h ) A × H is activated for period t T , 0 otherwise;
  • x h c t = 1 if the transportation link for the hub–consumer pair ( h , c ) H × C is activated for period t T , 0 otherwise;
  • y h = 1 if the hub h H is open, 0 otherwise.

4.2.3. Problem Formulation

The mathematical model consists of minimizing several parts of emissions; in addition to the transportation emissions and hub emissions, we additionally provide a penalty on long-distance delivery.
In this strategic model, the hub location problem formulation is then as follows: minimize
t T h H f h ( θ h t ) t o t a l   h u b   o p e n i n g   e m i s s i o n s + t T h H a A c a h θ a h t t o t a l   f a r m - h u b   t r a n s p o r t a t i o n   e m i s s i o n s + t T h H c C c h c θ h c t t o t a l   h u b - c u s t o m e r   t r a n s p o r t a t i o n   e m i s s i o n s + t T a A h H P a h x a h t + t T h H c C P h c x h c t p e n a l t y   c o s t
subject to
h H q a h k t w a k t k P , a A , t T
c C q h c k t = a A q a h k t k P , h H , t T
k P c C h H q h c k t M y h h H , t T
h H q h c k t = d c k t k P , c C , t T , [ for case 1 ]
c C h H q h c k t = a A w a k t k P , t T , [ for case 2 ]
h H q h c k t d c k t k P , c C , t T , [ for case 2 ]
k P q a h k t M x a h t a A , h H , t T
h H x a h t 1 a A , t T
k P q a h k t V a θ a h t a A , h H , t T
k P q h c k t V c θ h c t h H , c C , t T
k P c C q h c k t V k θ h t k K , h H , t T
θ a h t , θ h c t , θ h t Z + a A , h H , c C , t T
x a h t , x h c t , y h { 0.1 } a A , h H , c C , t T
q a h k t , q h c k t 0 k P , a A , h H , c C , t T
Objective (3) consists of minimizing the global aggregate transportation emissions between points of the network and the global opening emissions of hubs. The penalty cost has been instated to discourage the activation of long-distance links. In essence, it promotes solutions that minimize the activation of such links. The omission of the decision variable y from the objective function is a result of the emission function f h , which already signifies that, if a hub is open, it will trigger the basic emission. Constraints (4) are imposed to respect the production level in farms. Constraints (5) are imposed to respect the in/out flow at the hubs. Constraints (6) are imposed to respect the global capacity in hubs only if hubs are open. Constraints (7)–(9) are imposed to respect the food demand level in customers with two cases. Constraints (10) and (11) are imposed to restrict that one farm can, at most, be active with exactly one hub. Constraints (12)–(14) are imposed to restrict that the needed truck and pallet must be a positive integer. Constraints (15)–(17) define the domain of the variables.

5. Case Study and Results

In this section, we present the experimental results obtained from instances generated from real-world applications. The objective is to illustrate the practical application of the proposed hub location formulations. Specifically, we analyse the local food supply network within the Normandy region of France; we utilize the representative case study of department “Seine-Maritime” as our focal example for examination. The cost model developed in [24] has demonstrated notable performance enhancements with the case studies related to the Normandy region. Here is a summary of the remaining aspects of this instance: 205 school canteens, 48 farms, 30 candidate hubs, and 2 commodities (milk, vegetables) (see Figure 3). The inclusion of meat in the analysis has been omitted due to its substantially different refrigeration requirements compared to the other food types, which could significantly skew the evaluation of CO2 emissions.
The remainder of this section is structured as follows: Section 5.1 provides instructions on the data collection and preprocessing process for the subsequent experiments. Section 5.2 elaborates on the configuration and details of our analysis.

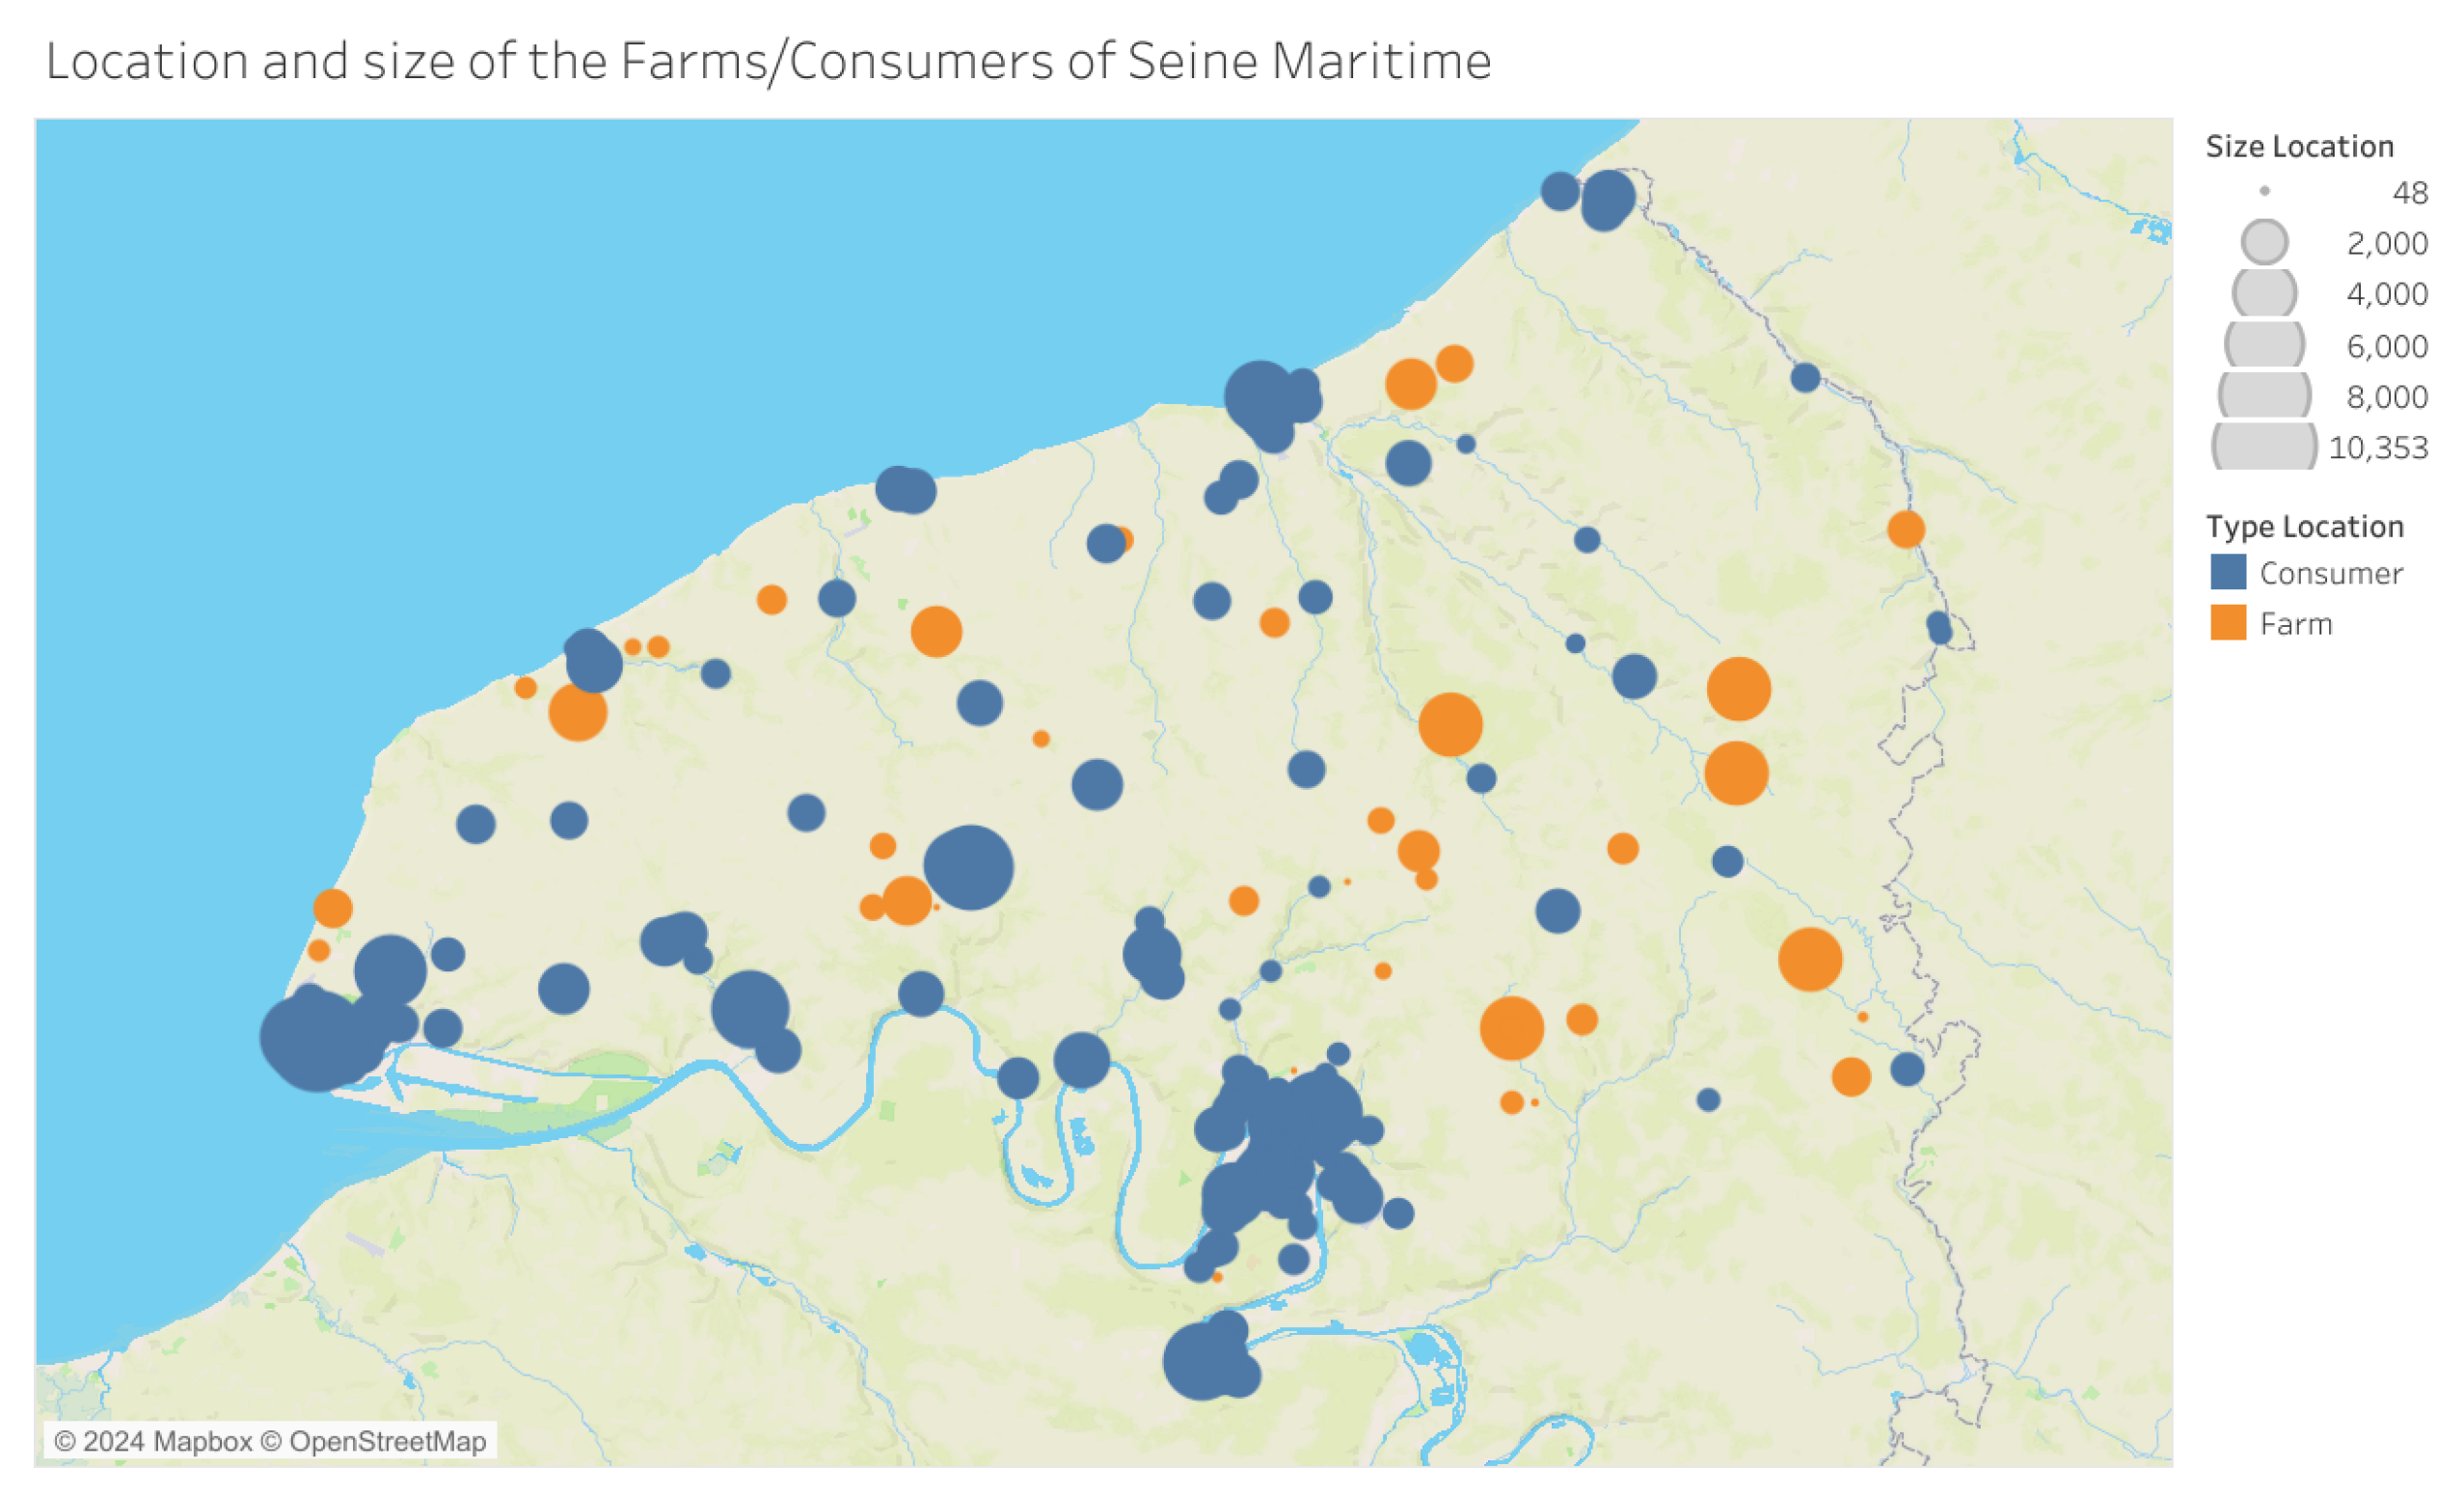
5.1. Data Collection

To carry out the experiments, four sets of data are required: information regarding the farms, encompassing their locations, products, and production levels; details concerning the school canteens, comprising their locations and product demands; hub candidates, including their locations and capacities; and, lastly, the distance matrix among all involved entities.

5.1.1. Demand for School Canteens

The school canteens data are collected from the website of “Académie de Normandie”, https://www.ac-normandie.fr/annuaire-des-etablissements-121766, accessed on 10 March 2022 for the year 2019–2020. The demand from these school canteens correlates with the number of individuals actively consuming meals at the school, estimated on the basis of an average person having four meals per week. The nutritional requirements for a single meal for a student at French schools are obtained from the Ministère de l’Éducation nationale website, https://www.education.gouv.fr/la-restauration-scolaire-6254, accessed on 10 March 2022, and this standard method is used to estimate the total demand for each food product on a weekly basis.

5.1.2. Production for Farms

The farms included in the set are sourced from the websites “Au rendez-vous des Normands”, https://aurendezvousdesnormands.fr/, accessed on 10 March 2022, and “Bienvenue à la ferme”, https://www.bienvenue-a-la-ferme.com/, accessed on 10 March 2022. These two websites give information about the local farmers involved in the SFSC. The first website concerns farmers registered with the Normandy regional governance, whereas the second encompasses farm information collected from across the entire country of France. In this article, only farms that primarily produce vegetables and milk products are considered. The production of each commodity for each farmer and each time period is estimated using national statistics obtained from the website “Direction Régionale de l’Alimentation, de l’Agriculture et de la Forêt de Normandie”, http://carto.geo-ide.application.developpement-durable.gouv.fr/, accessed on 10 March 2022 (published in year 2022). This website provides informations about the average surface of farms in a given location as well as the average production per unit of surface of different commodities. For our purpose, we gather these informations for several places of the Normandy region and calculate an average quantity of vegetable and milk produced in each of the locations we consider in this study. We denote by w a k the estimated production of commodity k at location a. Finally, the production of farmer a in commodity k at time period t, w a k t , is randomly generated using
w a k t = w a k × U ( 0.8 , 1.2 )
where U ( 0.8 , 1.2 ) is a random variable following a uniform distribution on [ 0.8 , 1.2 ] .

5.1.3. Candidates Hub Locations

For the study, we consider a set of locations where food hubs can be installed. We consider two types of locations for candidate hubs. The first type is locations where collective farms exist. These collective farms are places where several farmers work together to produce one or more products. The second type of locations is places which are geographically close to several farms and also geographically close to the consumers. Recall that we choose 30 locations as hub candidates following these rules.

5.1.4. Distance Matrix for the Location Pairs

To calculate the transportation emission for the SFSC, a distance matrix needs to be generated prior to solving the formulated model. This matrix should contain the distances for farm–hub, hub–school canteen, and farm–school canteen pairs. Numerous methods exist for generating the distance matrix among all entities, but we strongly recommend utilizing real-time online distance generators such as Google Maps API, https://developers.google.com/maps, and Bing Maps API, https://www.bingmapsportal.com/. These tools provide the capability to calculate highly accurate travel distances between two points on the map, taking into account factors such as your vehicle type and current weather conditions.

5.1.5. Truck Types

In SFSCs, farms typically lack large-capacity vehicles, whereas hubs have the capability to invest in vehicles with greater capacity to serve multiple customers. Therefore, we consider two types of trucks: farms equipped with trucks with a capacity of 600 kg (e.g., Kangoo) and hubs equipped with trucks with a capacity of 1500 kg (e.g., FOURGON 3.5 T PTAC). The truck specifications can be found in Table 1.
It is important to clarify to the readers that the selection of truck types can vary depending on the region or specific case under study. The two truck types chosen represent commonly used vehicles in France within the local food supply chain.

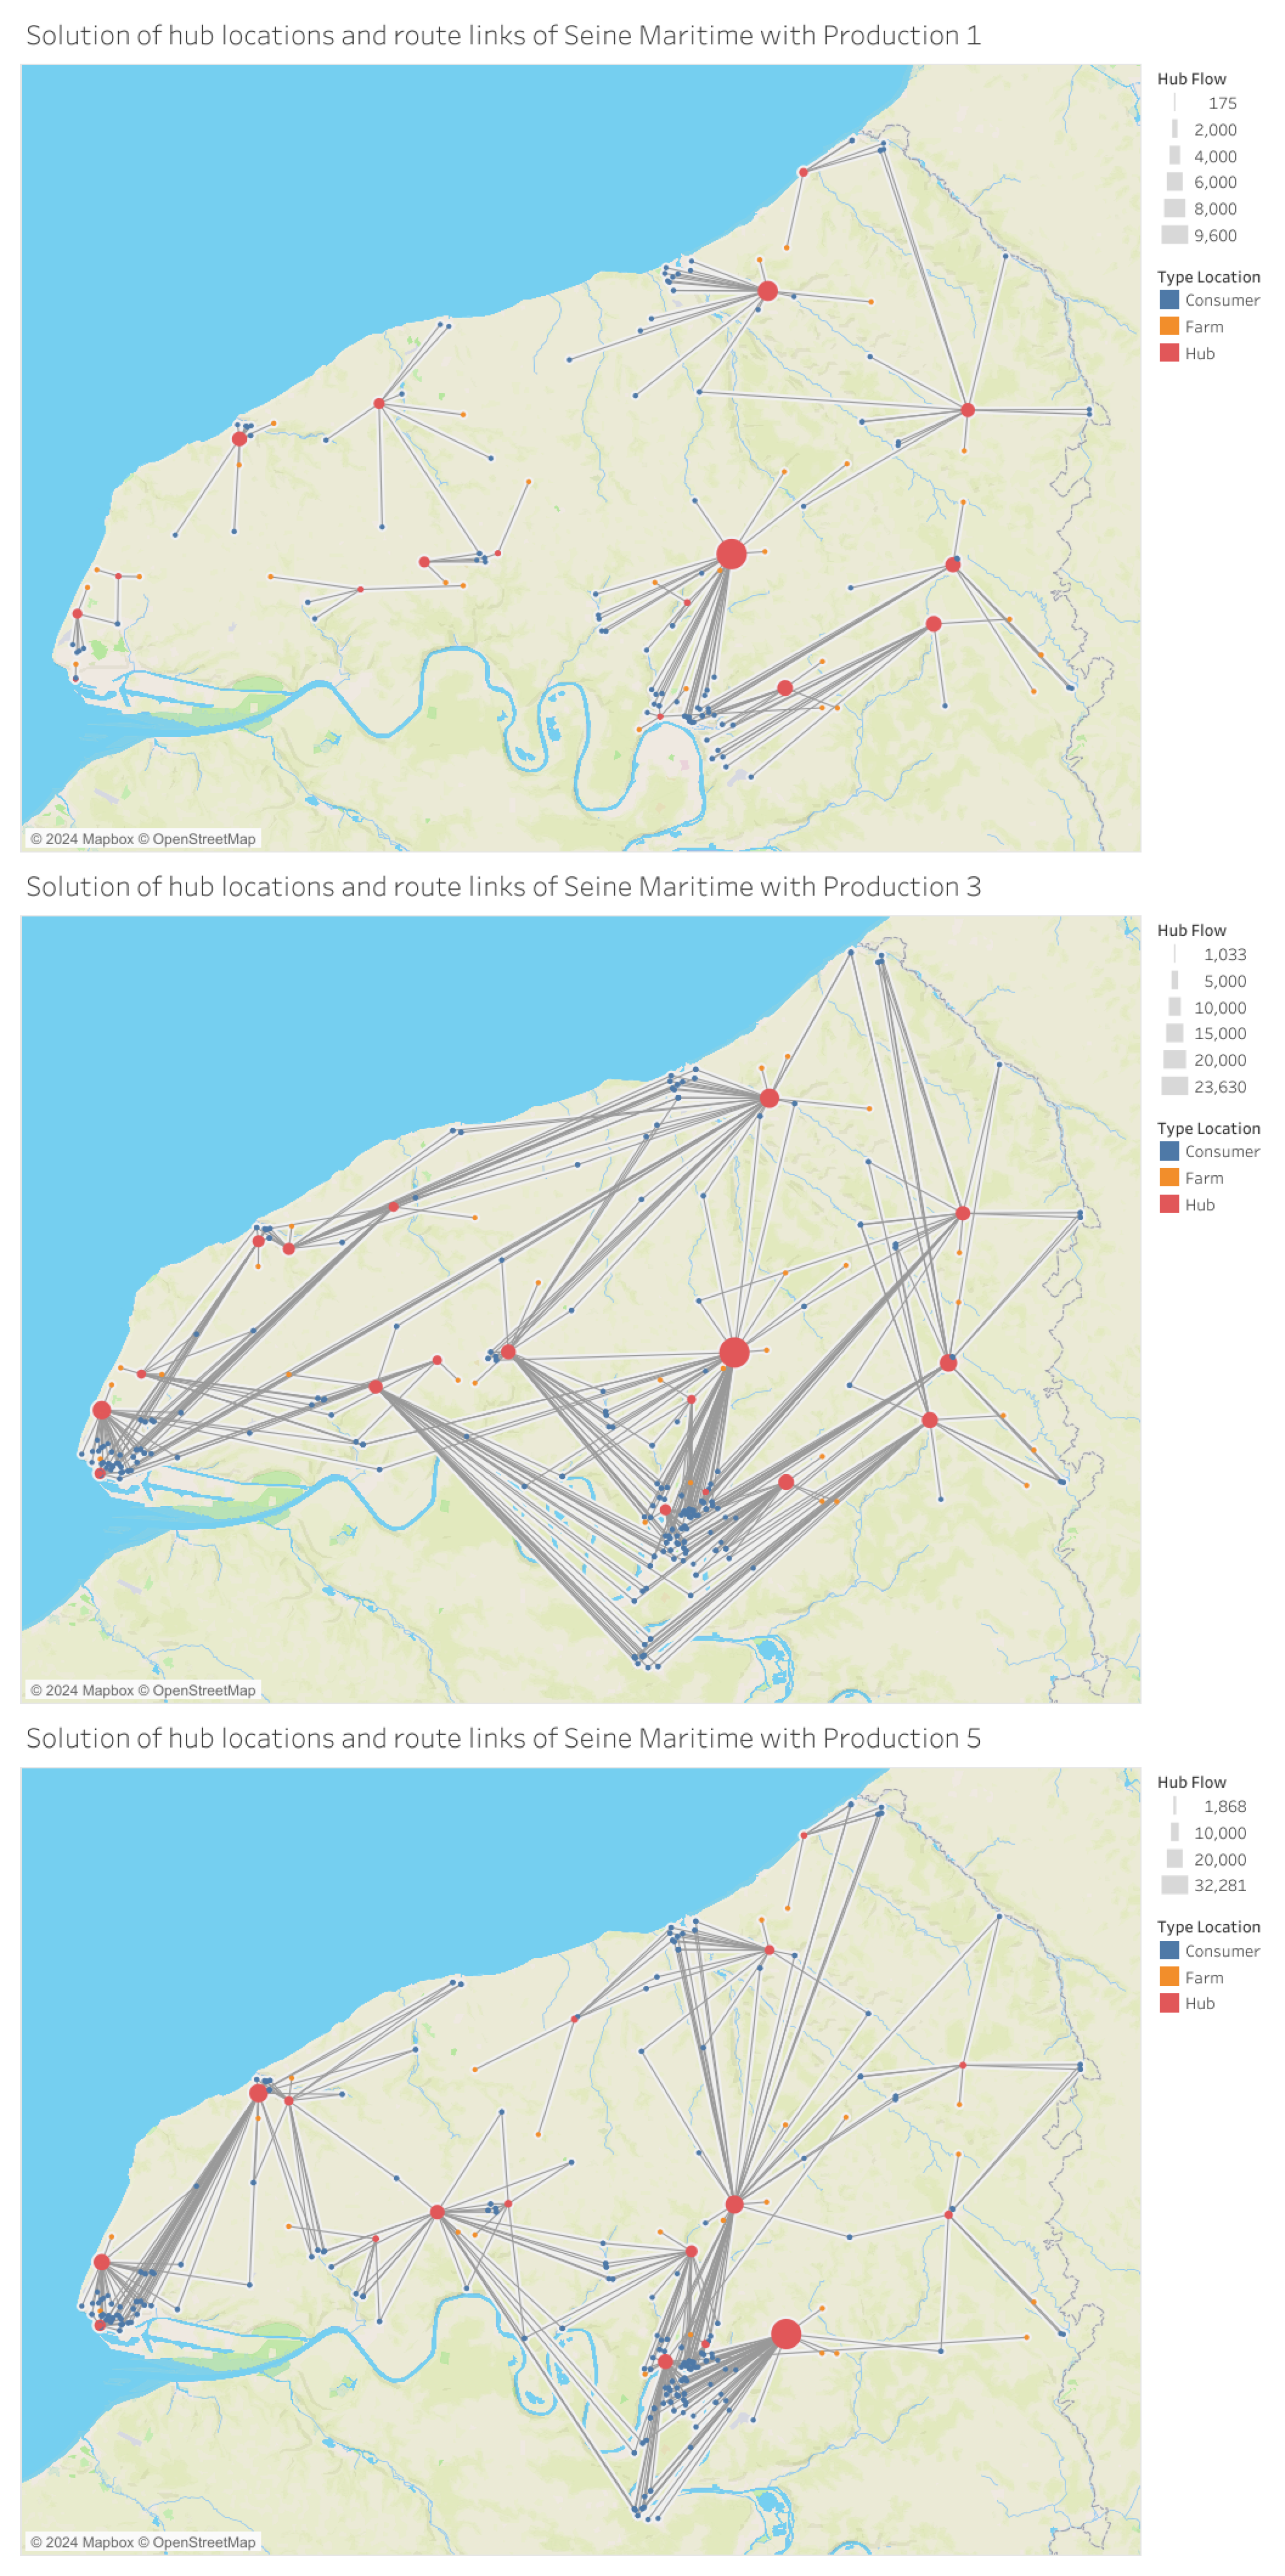
5.2. Results and Analysis

Various scenarios are created based on case study data collection and different parameter settings. For each scenario, we use the workflow depicted in Figure 4. The workflow typically begins with data collection, followed by the resolution of the optimization model, and concludes with the delivery of results.
All optimization models and solution methodologies have been implemented in Julia 1.9.3 on a desktop equipped with an Intel Core i7 3.6 GHz processor and 32.0 GB RAM. The optimization solver utilized throughout the solution process is CPLEX Optimizer version 22.1.1.
In what follows, we evaluate the emissions linked to the food hubs in SFSCs, using our formulated GHG emission model. The experiment’s focus will be on examining how CO2 emissions influence the selection of hubs, considering four primary criteria: different hub sizes defined within a piece-wise linear function, different limitations on the number of hubs, different emission factors, and different “short-distance”s. The rationale behind the first criterion stems from the observation that different sizes of hubs entail distinct emission factors, as explored in the paper by [30]. It is important to acknowledge that hub sizes may differ across regions and countries, and the emission factor can vary depending on hub types and the types of food being handled. The second criterion aims to analyse the optimal assessment of hub numbers from a number limitation perspective. The third criterion is used to assess the impact of the region under study using its specific emission factor. The fourth criterion is to comprehend the potential impact of defining “short-distance” on our solutions.
While numerous types and sizes of refrigerated food hubs may exist in real-world applications, there is a noticeable absence of research in the literature regarding the relationship between food hubs and their energy consumption. Therefore, in this paper, we will utilize the findings from [30], focusing specifically on two types of refrigerated food hubs that exclusively handle fresh fruits, vegetables, and dairy products.
To align the configuration with our experimental setting, we establish several key assumptions:
  • We maintain two types of hubs: large warehouses (pallet capacity number exceeding 5000) operating throughout the entire year with a relatively consistent electricity consumption rate, and small warehouses (pallet capacity number of 345) operating flexibly on a weekly basis.
  • We assess the electricity consumption in the hubs and subsequently convert the energy consumption into emissions, acknowledging the variation in emission factors from region to region.
  • The emission factor (EF) for electricity is sourced from Carbon Footprint Ltd’s 2023 Integrated Report, https://www.carbonfootprint.com/international_electricity_factors.html, accessed on 30 July 2023, with five representative countries’ EFs (Table 2) selected for the experiment and comparison. The EF for diesel fuel (World-to-Wheel of 3.24 kg CO2 per unit) is sourced from the European Standard [84].
  • Various food production levels are derived from Equation (18) and detailed in Table 3.
  • The average dwell time for fresh food at the food hub in SFSC is fixed at 2 days.
  • The total time period T is fixed with 12 weeks (i.e., one season).
The purpose of defining different production levels in the simulation is to encompass various scenarios that may occur in real-world applications. For example, Production Level 1 represents the original local production, which may be less than the demand. The subsequent levels are created by evenly increasing the production of each farm until the set limit for each commodity is reached. Production Level 3 represents a scenario where local production exactly meets the local demand, whereas Production Level 6 represents a situation where local production significantly exceeds demand, providing more flexibility in accessing local resources.
Importantly, Production Levels 4, 5, and 6 are not intended to validate the concept of problem solving, but rather to offer comparisons with Production Level 3 to explore the potential outcomes when more flexibility is granted in accessing additional local food production. This exploration will provide valuable insights into the consequences of increased flexibility. These production levels do not mandate specific production amounts from the farms, but rather aim to determine the optimal production for each farm, contrasting with the evenly increased productions. For instance, in Production Level 6, with the optimal allocation solution available, we acquire precise knowledge regarding the amount of production utilized from each farm. This information can then guide the production planning for subsequent years.

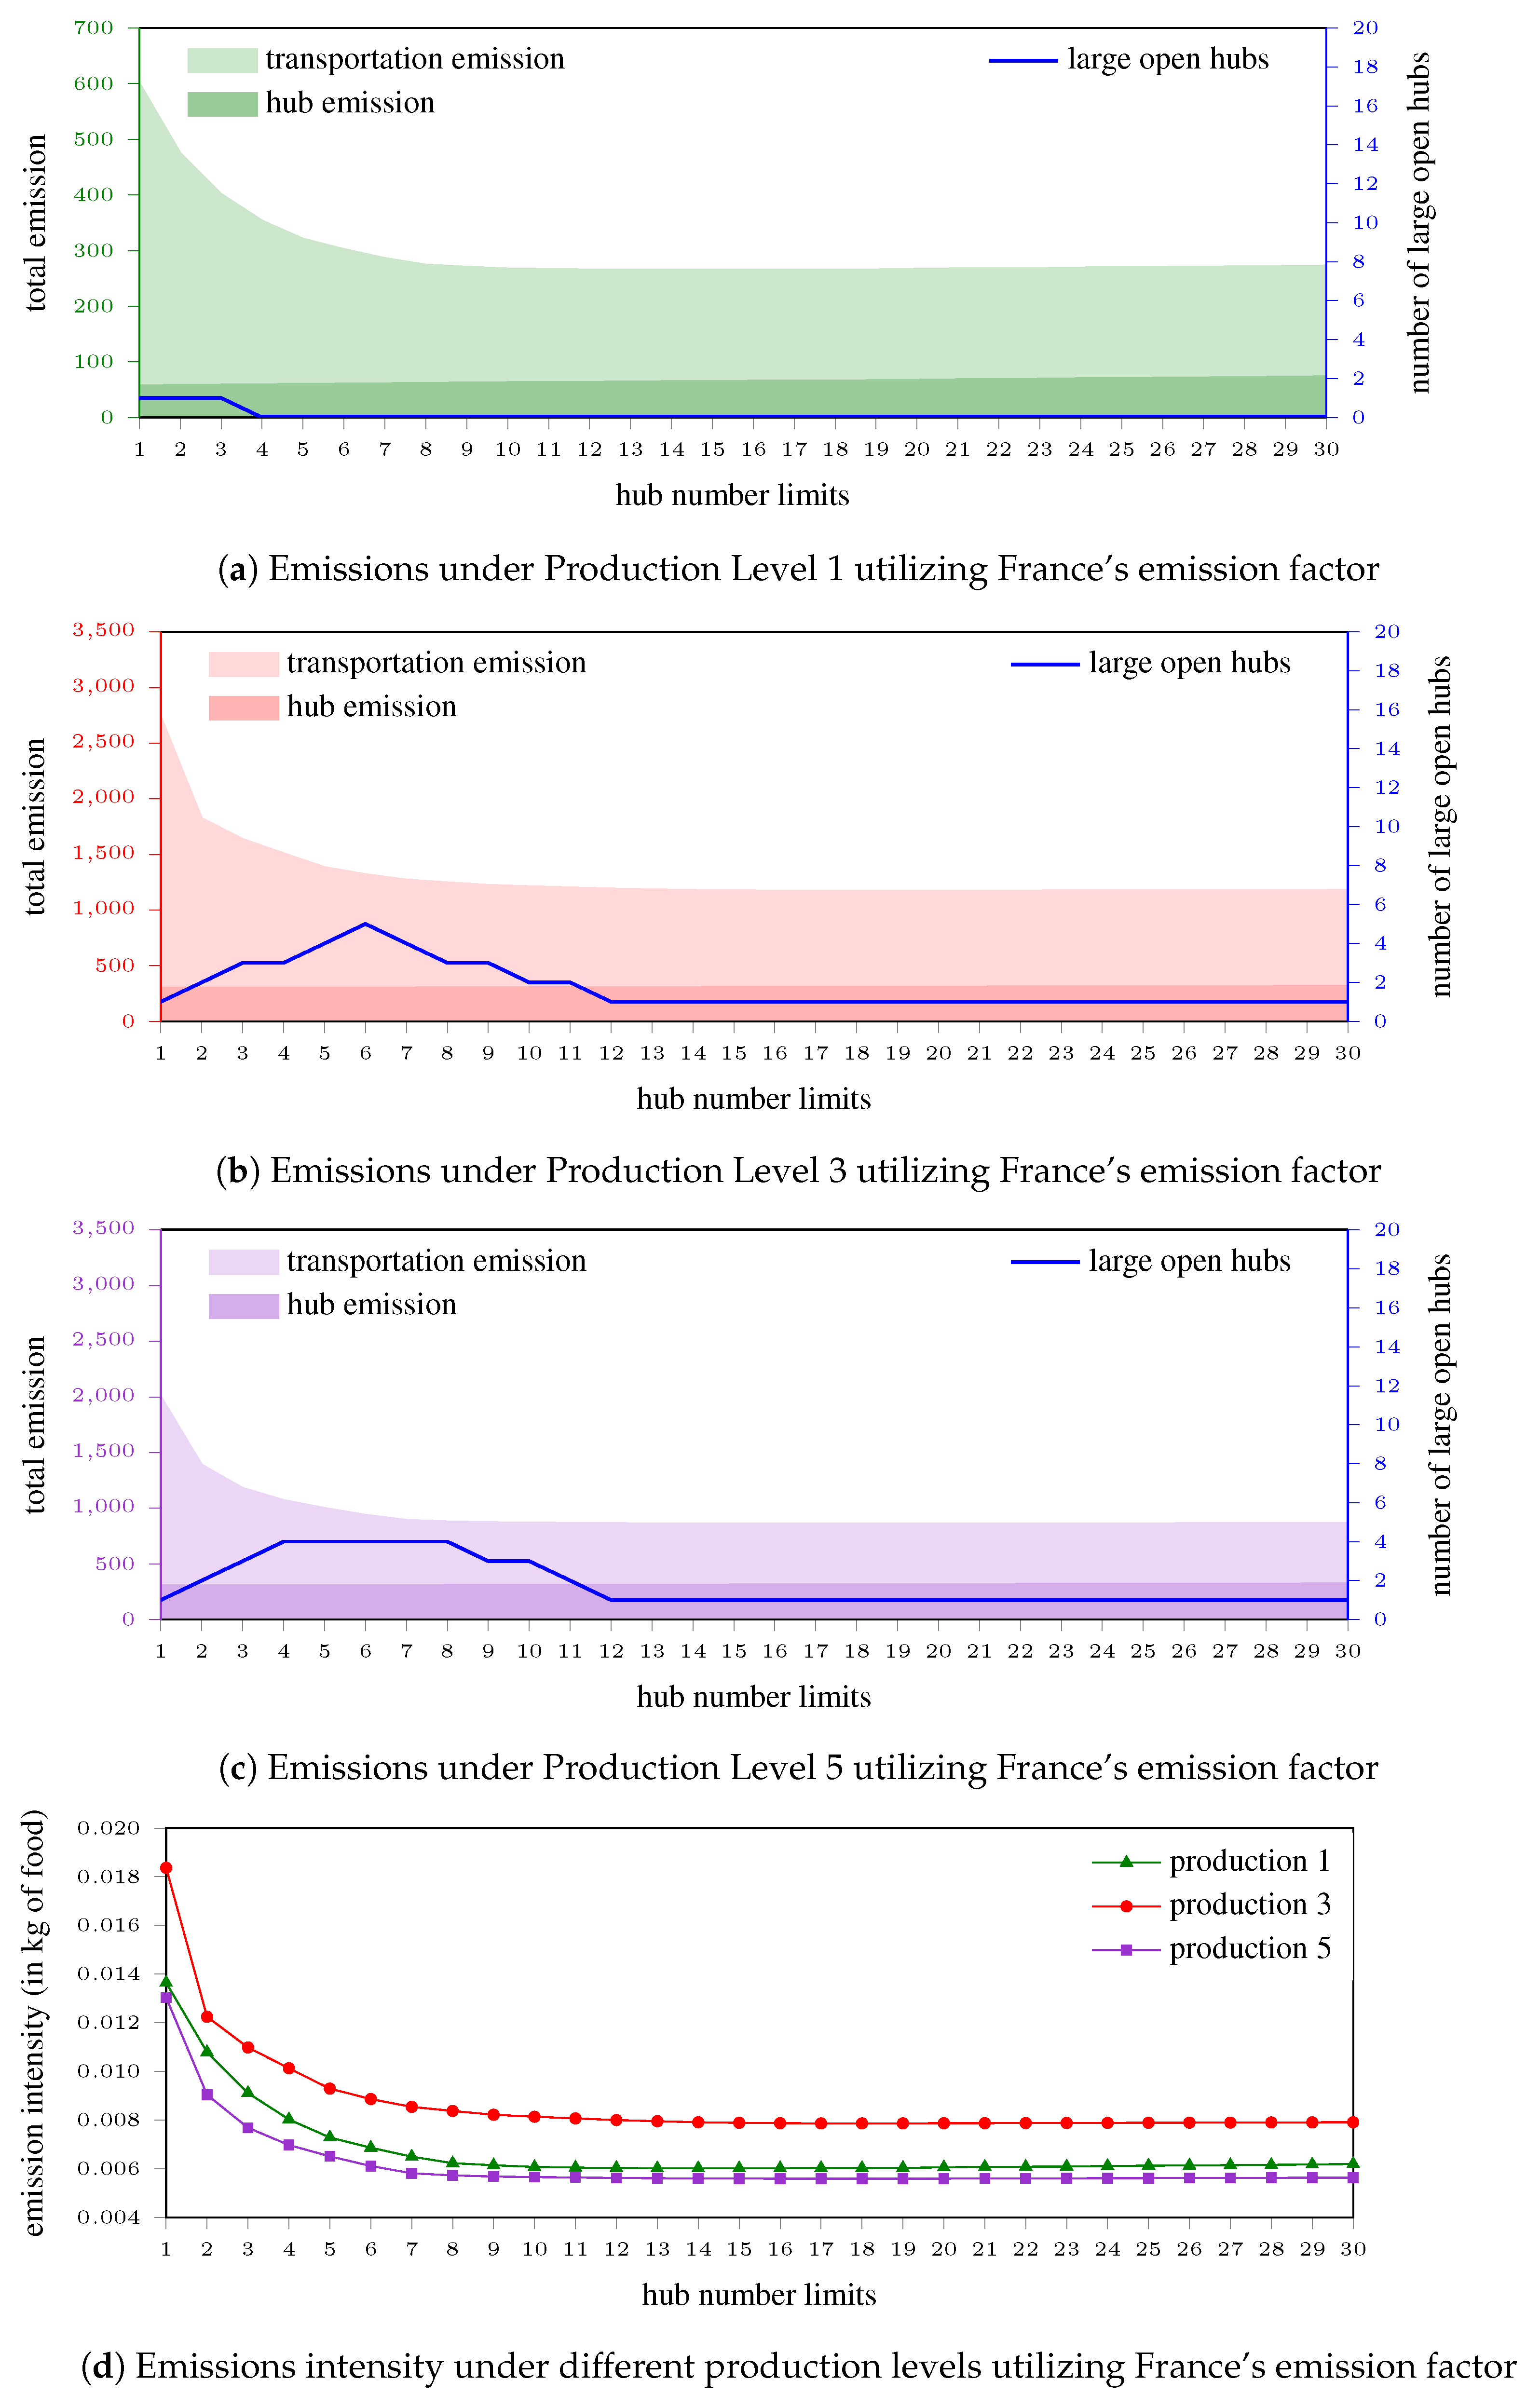
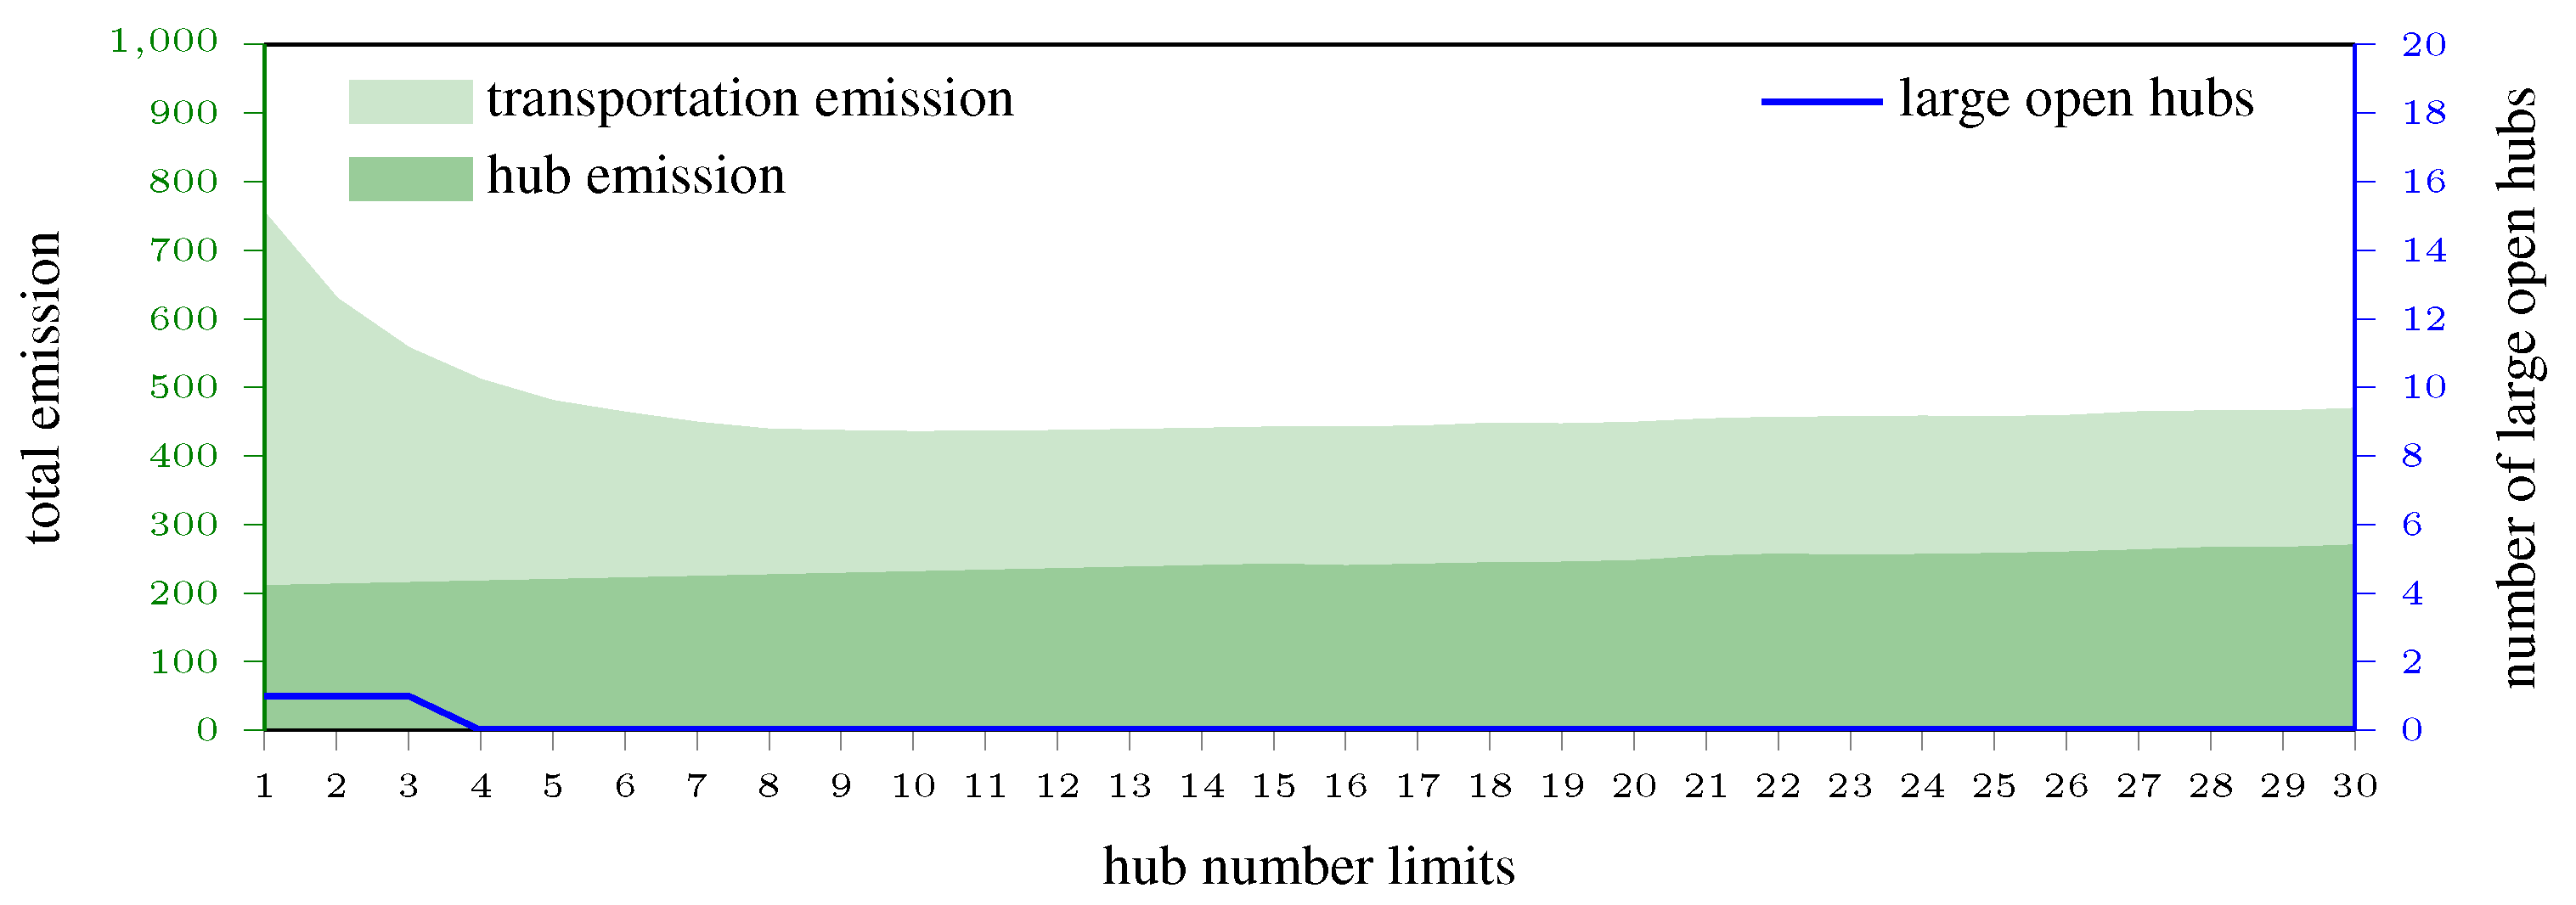
5.2.1. Evaluating Emissions with Hub Number Constraints

The initial sets of testing incorporate with newly introduced constraints on the number of hubs within the formulation, that is,
h H y h = Hub Number
The purpose of these test sets is to explore the potential outcomes when policy makers face constraints on resources for hub investment. Our focus lies in examining how the constrained number of hubs can impact emissions from a policy perspective. This is particularly relevant when governments or companies seek to understand the trade-offs involved in designing a sustainable and efficient SFSC. Our aim is to identify and illustrate the optimal strategy for either adding or reducing the number of hub openings. Thus, this first part analysis centers on a case study involving the emission factor of France.
As depicted in Figure 5a–c, in general, in all scenarios, the total emissions decrease as the number of hubs allowed in the supply chain increases. There is a significant decrease between the situation with one hub allowed and the situation with eight hubs allowed. For example, in Production 1, allowing eight hub decreases the total emission by 62.5%. For Production 3 and 5, the total emission is decreased by 60% and 56%, respectively.
Furthermore, the total CO2 emissions is correlated with the number of big and small hubs opened. Figure 5a–c show that, as the total emissions decrease, the number of big hubs opened also decreases in Production Level 1, 3, and 5.
Figure 5d presents the emissions intensity obtained in Production Level 1, 3, and 5, with respect to the number of hubs allowed. Compared to Production Level 3, Production Level 1 has a lower intensity. This is because of the reduced proportion of demand that can be satisfied in this scenario. Indeed, in Production 1, the total demand cannot be satisfied. Thus, the optimal solution proposed by our framework consists of assigning the production of each farmer as close as possible to the consumers. However, for Production 3 and 5, since more proportion of the demand can be satisfied, in the optimal solution, consumers are served by farmers which may be close or not to them. We also observe that Production Level 5 presents a slightly better intensity than Production Level 3, because the excess of production offers more flexibility than Production 3.
In Figure 6, we give the example of the solutions on a map for the food hub location and design with respect to different production levels. The solutions indicate that when production is insufficient, such as in Production 1, smaller food hubs tend to be opened. These hubs are often clustered around farms. As production increases (i.e., from Production 3 to 6), the size of the food hubs also increases, which is indicated in Figure 7. Consequently, food hubs have been relocated closer to both farms and consumers. Additionally, we observe a decrease in the number of small hubs and an increase in the number of large hubs from Production 4 to 6. This shift occurs because large hubs can replace small ones when the system can access greater production from nearby farms, benefiting from economy of scale and the piece-wise linear emission function used to evaluate hub emissions.

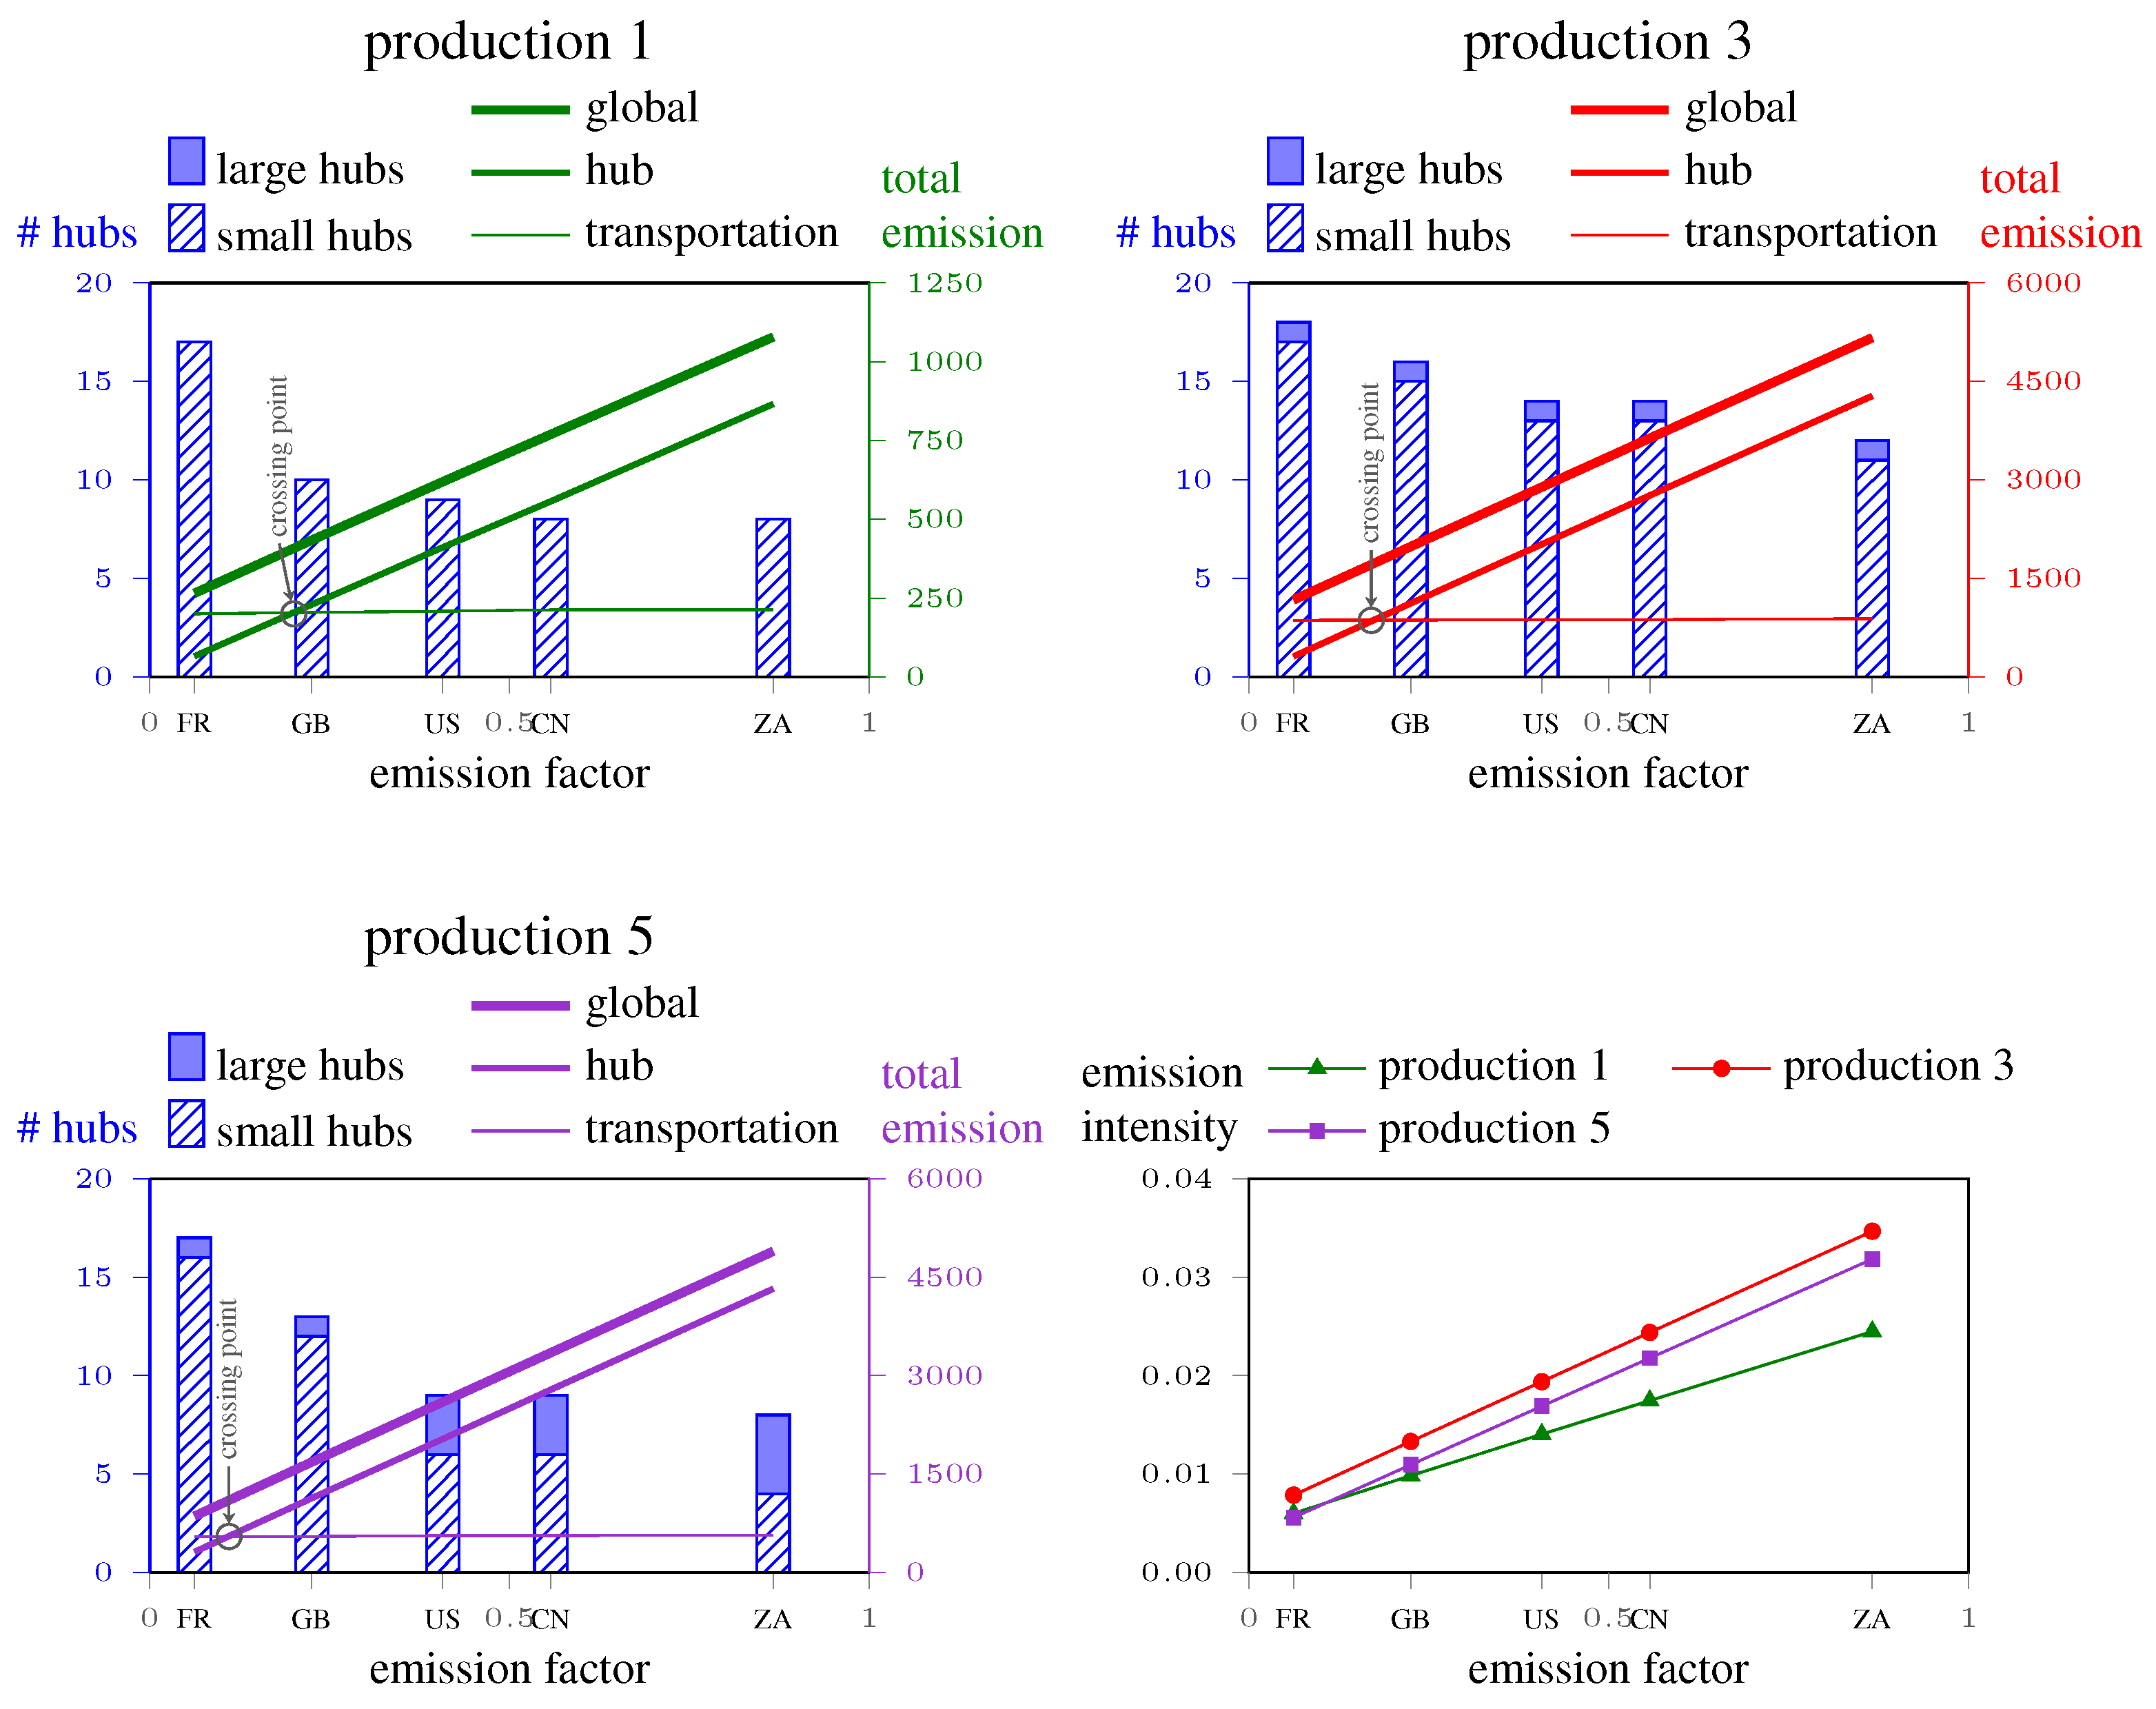
5.2.2. Evaluating Emissions with Different Emission Factors

In this section, we analyse the total CO2 emissions of the supply chain when the emission factor (EF) changes. Remember that the EF value is related to the way the energy is mostly produced in the country considered. Thus, the EFs we consider here correspond to EFs of different countries. In this analysis, we want to see how the total CO2 emission and the design of the supply chain (number of hub, locations, size, and flows) are influenced by the EF of different countries and the production level. The experiments are conducted by considering production levels from 1 to 6 and EFs for the countries defined in Table 2. We also remove the hub number restriction constraint.
Figure 7 presents the number of big and small hubs opened in the optimal solution, for EFs of France (FR), the USA (US), and South Africa (ZA), and for all the production levels. We remark that the EFs of France, the USA, and South Africa are in increasing order.
We observe from Figure 7 that the total number of hubs opened decreases as the EF increases, no matter the production level. In addition, when the production is less than the demand (i.e., Production Level 1 and 2), all the hubs opened are small. This suggests that the low proportion of demand to be satisfied encourage opening several small hubs instead of one big hub. Now, when the production exceeds the demand, the optimization framework shows that it may be more efficient to open more hubs than when the production is less. Moreover, when the EF increases, it becomes more efficient to use big hubs in the supply chain. Indeed, due to the shape of the hub emission functions (which is concave piece-wise linear), large hubs are predominantly selected in high-production scenarios, capitalizing on economies of scale on CO2 emissions. Notably, in South Africa, where the EF value is highest, nearly half of the hubs are large, reflecting findings described in the paper of [30].
We further summarized the number of hubs opened and calculated the total emission and the emission intensity with respect to different EF values across different scenarios. Figure 8 present the obtained results. The analysis reconfirms that with the increase in EFs, the total number of opened hubs decreases, and the number of large hubs increases. Indeed, when EF is high, it seems more efficient to replace several small hubs with one big hub, yielding a decrease of the total number of hubs opened. Figure 8 also shows that when the EF increases, the total CO2 emission also increases, independently of the production level. We can see that the emissions due to transportation are slightly affected by the EF changes. They stay almost stable when the EF increases, for all the production levels. The increase of the total CO2 emissions is, hence, mainly due to the growth of the CO2 emissions due to the food hubs.
Finally, we analyse the point where emissions curves due to transportation and due to hubs intersect each other. This point is indicated by the circle on Figure 8 for each production level. The intersection of the two curves indicates that, depending on the EF, the emissions due to transportation may surpass those due to the hubs. From the figure, we observe that, in France, the emissions due to transportation are more important than those due to the hub. However, when the EF of the others countries considered (GB, US, CN, and ZA), the emissions due to the hubs may surpass those due to transportation, and an example solution is given in Figure 9 with the same optimization process as Section 5.2.1 using United Kingdom’s emission factor. This clearly means that designing such an SFSC while optimizing CO2 emissions must take into account the EF of the country considered, together with the hub design.
Indeed, the emissions caused by transportation tend to be more stable, and are less impacted by the EFs, as depicted in Figure 8, after the intersection point. Conversely, hub emissions are more heavily influenced by EFs. Notably, in cases like France, transportation emissions surpass those from the hub, as confirmed by our analysis. This figure is significant, as it underscores the necessity to adapt policies in response to fluctuating input parameters. Our analysis suggests a shift in the importance of emissions, transitioning from transportation to hub as EFs increase. As emission factors naturally lead to an increase in emission intensity, the below-right sub-figure suggests that higher emission factors impose greater pressure on policy makers. They must carefully determine the number and size of hubs to be opened in order to achieve sustainable SFSCs.

5.2.3. Evaluating Emission with Different Short Distances Defined

The aim of this section is to assess the influence of the distance limit considered in the SFSC (called here “short distance”). For all the previous analyses, we have considered 80 km as a short distance, which is the reference distance limit in France for SFSCs. Our objective here is to observe how the solution changes when this short distance also changes. For this, we solve the optimization model with short distances defined as 20, 40, 60, 80, 100, 150, and 200 km.
We then examined hub selection and the emissions for different production levels using France’s emission factor with various short distances defined.
The results are depicted in Figure 10, which reaffirms the observation that large hubs are unnecessary for the short production cases but become essential as production levels increase. Typically, in an SFSC, shorter distances necessitate the establishment of more small hubs. This is because farms and customers must be situated in close proximity to these hubs, resulting in higher emissions overall from the hub side. Consequently, distances as short as 10 km tend to incur the highest total emissions and prompt the opening of more hubs across all production levels. As the distance defined in the SFSC increases, the system gains greater flexibility in designing the location and size of food hubs. This flexibility enables leveraging economies of scale, leading to emission reductions.

6. Discussion

6.1. Practical Interpretation of the Results

We have applied our framework to the Normandy region of France. The various results we have produced provide insights on the different factors that may influence the GHG emissions in the SFSC we have considered. The Normandy case study revealed that GHG emissions are influenced by several factors, including the balance between production and demand volumes, the distance limit, the number and size of food hubs that are open, and the emission factors of the energy used for hubs and transportation.
Policy makers and supply chain designers have to pay attention to these factors for designing efficient SFSCs. For example, in France, some administrations are interested in building large food hubs dedicated to SFSC. Considering the size and the cost of these hubs, only a few of them will be created.
Our findings show that the reduced number of those hubs, together with their large size, may yield an increase of the total GHG emissions. Thus, for optimizing the total GHG emissions, it can be beneficial to design the SFSC by including several smaller hubs.
We also show that, depending on the emission factor of the region under consideration, opening several small food hubs may not be always efficient for reducing GHG emissions. When the emission factor increases, it is more relevant to open larger food hubs in order to minimize the total GHG emissions. In France, since the emission factor is small, our results suggest that we may build more small hubs. In other countries like South Africa, the USA, and China, whose emission factors are larger, the situation would be different.
The results we have obtained also show that the small hubs should be built close to the farmers (see, for example, Figure 6). This should favor the collaboration between farmers, in contrast to bigger hubs which are built, most of the time, far from the farmers. One of the challenges in agriculture, especially for small farms, is how to make them collaborate and achieve better revenue. Thus, food hubs built close to the farms are an opportunity to promote social proximity between farmers. This can also allow them to share best practices, resources (vehicles, etc.), information, markets, etc.

6.2. Limitations and Flexibility of the Framework

It is worth noting that some parameters we use in this paper, in particular the hub size, production levels, and energy sources, may not be precise enough to fully address a real-world situation. For a real case, one should use data which exactly correspond to the region of application.
In addition, notice that the emissions due to production and consumption as well as outsourcing (when the production is not sufficient) are not considered in our framework.
However, our mathematical model and framework are flexible enough and they can be easily adapted to changes in the data. For instance, one can change the considered region, use different product categories (such as fish or meat), different production levels, different vehicle types, different hub types, etc., without changing the mathematical model. In addition, since, in practice, the local production is usually less than the local demand, it is necessary for decision makers to develop supply and consumption schemes that better meet the needs of local consumer (school canteens in our case). Our framework can be used to evaluate the environmental efficiency of different schemes and help select the most relevant ones.

6.3. Further Improvement of the Framework

Our framework focuses on strategic decisions associated with the SFSC, targeting the optimal location of the hubs. As a perspective, it could be interesting to also consider tactical and operational decisions like inventory decision in the food hubs, different transportation schemes for both product collection and delivery, etc. For example, our framework can be improved by considering vehicle routing schemes to draw efficient environmental and economical transportation plans.
Finally, in practice, policy makers are interested in trade-offs between cost, GHG emissions, and social aspects for designing a sustainable SFSC. Such analysis can be done by a multi-objective framework dealing with these three aspects.

7. Conclusions

In this paper, we have developed a framework for estimating the total GHG emissions in a two-echelon SFSC. The logistics scheme of the considered SFSC relies on food hubs. Our framework in particular estimates the total emissions due to both food hubs and transportation. It uses a mathematical optimization model and provides the optimal location and design of food hubs as well as optimal transportation decisions for the SFSC while minimizing the total emissions.
Our experimental results demonstrate the utility of our study from environmental perspectives. Specifically, our approach aids in promoting the collaboration of local farms while concurrently reducing GHG emissions. This dual benefit is crucial in the design of a sustainable and green supply chain, particularly in the context of SFSCs.
Our findings underscore the importance of integrating economic, environmental, and social objectives in SFSC design. Moreover, our research contributes to the broader discourse on sustainability by offering practical insights into how SFSCs can serve as effective mechanisms for fostering local production and mitigating climate change impacts.
It is worth noting that, in general, scientific literature lacks an accurate study on investigating and modeling GHG emissions in food hubs. Our framework, even if it has some limitations, tries to address this issue and provide both researchers and practitioners a modeling framework. This framework should also be improved by considering more practical aspects in SFSCs like resource wastage, investigating the relationship between hub characteristics and energy consumption, etc.

Author Contributions

Conceptualization, Y.C., I.D., C.J. and S.M.L.; methodology, Y.C. and I.D.; software, Y.C. and I.D.; validation, Y.C.; formal analysis, Y.C.; investigation, Y.C.; resources, Y.C.; data curation, Y.C., I.D., C.J. and S.M.L.; writing—original draft preparation, Y.C.; writing—review and editing, Y.C., I.D., C.J. and S.M.L.; visualization, Y.C.; supervision, I.D., C.J. and S.M.L.; project administration, I.D., C.J. and S.M.L. All authors have read and agreed to the published version of the manuscript.

Funding

This research received no external funding.

Institutional Review Board Statement

Not applicable.

Informed Consent Statement

Not applicable.

Data Availability Statement

The data presented in this study are available on request from the corresponding author.

Conflicts of Interest

The authors declare no conflicts of interest.

References

  1. Cuda, R.; Guastaroba, G.; Speranza, M.G. A survey on two-echelon routing problems. Comput. Oper. Res. 2015, 55, 185–199. [Google Scholar] [CrossRef]
  2. Paciarotti, C.; Torregiani, F. The logistics of the short food supply chain: A literature review. Sustain. Prod. Consum. 2021, 26, 428–442. [Google Scholar] [CrossRef]
  3. Dunne, J.B.; Chambers, K.J.; Giombolini, K.J.; Schlegel, S.A. What does ‘local’ mean in the grocery store? Multiplicity in food retailers’ perspectives on sourcing and marketing local foods. Renew. Agric. Food Syst. 2011, 26, 46–59. [Google Scholar] [CrossRef]
  4. Qaim, M. Globalisation of agrifood systems and sustainable nutrition. Proc. Nutr. Soc. 2017, 76, 12–21. [Google Scholar] [CrossRef] [PubMed]
  5. Pulker, C.E.; Trapp, G.S.; Scott, J.A.; Pollard, C.M. Global supermarkets’ corporate social responsibility commitments to public health: A content analysis. Glob. Health 2018, 14, 1–20. [Google Scholar] [CrossRef] [PubMed]
  6. Duram, L.A.; Cawley, M. Irish chefs and restaurants in the geography of “local” food value chains. Open Geogr. J. 2012, 5, 16–25. [Google Scholar] [CrossRef]
  7. King, R.P.; Hand, M.S.; Gómez, M.I. Growing Local: Case Studies on Local Food Supply Chains; Univeristy of Nebraska Press: Lincoln, NE, USA, 2014. [Google Scholar] [CrossRef]
  8. Aldieri, L.; Brahmi, M.; Chen, X.; Vinci, C.P. Knowledge spillovers and technical efficiency for cleaner production: An economic analysis from agriculture innovation. J. Clean. Prod. 2021, 320, 128830. [Google Scholar] [CrossRef]
  9. Feldmann, C.; Hamm, U. Consumers’ perceptions and preferences for local food: A review. Food Qual. Prefer. 2015, 40, 152–164. [Google Scholar] [CrossRef]
  10. Bloemhof, J.M.; van der Vorst, J.G.; Bastl, M.; Allaoui, H. Sustainability assessment of food chain logistics. Int. J. Logist. Res. Appl. 2015, 18, 101–117. [Google Scholar] [CrossRef]
  11. Zhang, C.; Xiao, G.; Xu, L. Manufacturers’ emission-reduction investments in competing supply chains with Prisoner’s Dilemma: The economic and environmental impacts of Retailer (s) capital Constraint (s). Transp. Res. Part E Logist. Transp. Rev. 2024, 187, 103602. [Google Scholar] [CrossRef]
  12. Schönhart, M.; Penker, M.; Schmid, E. Sustainable local food production and consumption: Challenges for implementation and research. Outlook Agric. 2009, 38, 175–182. [Google Scholar] [CrossRef]
  13. Hand, M.S.; Martinez, S. Just what does local mean. Choices 2010, 25, 13–18. [Google Scholar] [CrossRef]
  14. Chang, T.F.M.; Iseppi, L. EU agro-food chain and vertical integration potentiality: A strategy for diversification? Transit. Stud. Rev. 2012, 19, 107–130. [Google Scholar] [CrossRef]
  15. Brown, J.R.; Guiffrida, A.L. Carbon emissions comparison of last mile delivery versus customer pickup. Int. J. Logist. Res. Appl. 2014, 17, 503–521. [Google Scholar] [CrossRef]
  16. Peano, C.; Migliorini, P.; Sottile, F. A methodology for the sustainability assessment of agri-food systems: An application to the Slow Food Presidia project. Ecol. Soc. 2014, 19, 24. [Google Scholar] [CrossRef]
  17. Benis, K.; Ferrão, P. Potential mitigation of the environmental impacts of food systems through urban and peri-urban agriculture (UPA)—A life cycle assessment approach. J. Clean. Prod. 2017, 140, 784–795. [Google Scholar] [CrossRef]
  18. Bayir, B.; Charles, A.; Sekhari, A.; Ouzrout, Y. Issues and challenges in short food supply chains: A systematic literature review. Sustainability 2022, 14, 3029. [Google Scholar] [CrossRef]
  19. Raftowicz, M.; Solarz, K.; Dradrach, A. Short Food Supply Chains as a Practical Implication of Sustainable Development Ideas. Sustainability 2024, 16, 2910. [Google Scholar] [CrossRef]
  20. Torquati, B.; Taglioni, C.; Cavicchi, A. Evaluating the CO2 emission of the milk supply chain in Italy: An exploratory study. Sustainability 2015, 7, 7245–7260. [Google Scholar] [CrossRef]
  21. Striebig, B.; Smitts, E.; Morton, S. Impact of transportation on carbon dioxide emissions from locally vs. non-locally sourced food. Emerg. Sci. J. 2019, 3, 222–234. [Google Scholar] [CrossRef]
  22. BÜYÜKSAATÇI, S.; ESNAF, Ş. Carbon emission based optimisation approach for the facility location problem. Tojsat 2014, 4, 9–20. [Google Scholar]
  23. Musavi, M.; Bozorgi-Amiri, A. A multi-objective sustainable hub location-scheduling problem for perishable food supply chain. Comput. Ind. Eng. 2017, 113, 766–778. [Google Scholar] [CrossRef]
  24. Cui, Y.; Diarrassouba, I.; Joncour, C.; Michel, S. Outil d’aide à la décision pour le placement de hub dans un circuit alimentaire de proximité. Cah. Logistique 2022, 3, 15–27. [Google Scholar]
  25. Bourlakis, M.A.; Bourlakis, C.A. Deliberate and emergent logistics strategies in food retailing: A case study of the Greek multiple food retail sector. Supply Chain. Manag. Int. J. 2001, 6, 189–200. [Google Scholar] [CrossRef]
  26. Oglethorpe, D.; Heron, G. Testing the theory of constraints in UK local food supply chains. Int. J. Oper. Prod. Manag. 2013, 33, 1346–1367. [Google Scholar] [CrossRef]
  27. Berti, G.; Mulligan, C. Competitiveness of small farms and innovative food supply chains: The role of food hubs in creating sustainable regional and local food systems. Sustainability 2016, 8, 616. [Google Scholar] [CrossRef]
  28. Lutz, J.; Smetschka, B.; Grima, N. Farmer cooperation as a means for creating local food systems—potentials and challenges. Sustainability 2017, 9, 925. [Google Scholar] [CrossRef]
  29. Sarabia, N.; Peris, J. Emergence and Development of Transformative Capacities for the Sustainability of the Agri-Food System: The Process in Valdivia, Chile. Sustainability 2024, 16, 4849. [Google Scholar] [CrossRef]
  30. du Plessis, M.J.; van Eeden, J.; Goedhals-Gerber, L.L. The carbon footprint of fruit storage: A case study of the energy and emission intensity of cold stores. Sustainability 2022, 14, 7530. [Google Scholar] [CrossRef]
  31. Blanquart, C.; Gonçalves, A.; Vandenbossche, L.; Kebir, L.; Petit, C.; Traversac, J.B. The logistic leverages of short food supply chains performance in terms of sustainability. In Proceedings of the 12th World Conference on Transport Research 2010, Lisbon, Portugal, 11–15 July 2010; p. 10. [Google Scholar]
  32. Gu, W.; Archetti, C.; Cattaruzza, D.; Ogier, M.; Semet, F.; Speranza, M.G. A sequential approach for a multi-commodity two-echelon distribution problem. Comput. Ind. Eng. 2021, 163, 107793. [Google Scholar] [CrossRef]
  33. Brown, C.; Miller, S. The impacts of local markets: A review of research on farmers markets and community supported agriculture (CSA). Am. J. Agric. Econ. 2008, 90, 1296–1302. [Google Scholar] [CrossRef]
  34. Vasquez, A.; Sherwood, N.E.; Larson, N.; Story, M. Community-supported agriculture as a dietary and health improvement strategy: A narrative review. J. Acad. Nutr. Diet. 2017, 117, 83–94. [Google Scholar] [CrossRef] [PubMed]
  35. Ilbery, B.; Maye, D. Retailing local food in the Scottish–English borders: A supply chain perspective. Geoforum 2006, 37, 352–367. [Google Scholar] [CrossRef]
  36. Kebir, L.; Torre, A. Geographical proximity and new short supply food chains. In Creative Industries and Innovation in Europe; Routledge: Milton Park, UK, 2012; pp. 212–229. [Google Scholar] [CrossRef]
  37. Zepeda, L.; Leviten-Reid, C. Consumers’ views on local food. J. Food Distrib. Res. 2004, 35, 1–6. [Google Scholar] [CrossRef]
  38. Engelseth, P.; Hogset, H. Adapting supply chain management for local foods logistics. In Proceedings of the Food System Dynamics, Innsbruck-Igls, Austria, 15–19 February 2016; pp. 143–160. [Google Scholar] [CrossRef]
  39. Chambers, S.; Lobb, A.; Butler, L.; Harvey, K.; Traill, W.B. Local, national and imported foods: A qualitative study. Appetite 2007, 49, 208–213. [Google Scholar] [CrossRef]
  40. Durham, C.A.; King, R.P.; Roheim, C.A. Consumer definitions of “Locally Grown” for fresh fruits and vegetables. J. Food Distrib. Res. 2009, 40, 56–62. [Google Scholar] [CrossRef]
  41. Pretty, J.N.; Ball, A.S.; Lang, T.; Morison, J.I. Farm costs and food miles: An assessment of the full cost of the UK weekly food basket. Food Policy 2005, 30, 1–19. [Google Scholar] [CrossRef]
  42. Nilsson, H. Local food systems from a sustainability perspective: Experiences from Sweden. Int. J. Sustain. Soc. 2009, 1, 347–363. [Google Scholar] [CrossRef]
  43. Kremer, P.; DeLiberty, T.L. Local food practices and growing potential: Mapping the case of Philadelphia. Appl. Geogr. 2011, 31, 1252–1261. [Google Scholar] [CrossRef]
  44. Engelseth, P. Developing exchange in short local foods supply chains. Int. J. Food Syst. Dyn. 2016, 7, 229–242. [Google Scholar] [CrossRef]
  45. Galli, F.; Brunori, G. (Eds.) Short Food Supply Chains as Drivers of Sustainable Development. Evidence Document; Document developed in the framework of the FP7 project FOODLINKS (GA No. 265287); Laboratorio di studi rurali Sismondi: Pisa, Italy, 2013; ISBN 978-88-90896-01-9. [Google Scholar]
  46. European-Union. Regulation (EU) No. 1305/2013 of the European Parliament and of the Council of 17 December 2013 on support for rural development by the European Agricultural Fund for Rural Development (EAFRD) and repealing Council Regulation (EC) No 1698/2005. Off. J. Eur. Union 2013, L 347, 487.
  47. Diamond, A.; Barham, J. Money and mission: Moving food with value and values. J. Agric. Food Syst. Commun. Dev. 2011, 1, 101–117. [Google Scholar] [CrossRef]
  48. Martikainen, A.; Niemi, P.; Pekkanen, P. Developing a service offering for a logistical service provider—Case of local food supply chain. Int. J. Prod. Econ. 2014, 157, 318–326. [Google Scholar] [CrossRef]
  49. Horst, M.; Ringstrom, E.; Tyman, S.; Ward, M.; Werner, V.; Born, B. Toward a more expansive understanding of food hubs. J. Agric. Food Syst. Commun. Dev. 2011, 2, 209–225. [Google Scholar] [CrossRef]
  50. Matson, J.; Thayer, J. The role of food hubs in food supply chains. J. Agric. Food Syst. Commun. Dev. 2013, 3, 43–47. [Google Scholar] [CrossRef]
  51. Manikas, I.; Malindretos, G.; Moschuris, S. A community-based Agro-Food Hub model for sustainable farming. Sustainability 2019, 11, 1017. [Google Scholar] [CrossRef]
  52. Guastaroba, G.; Speranza, M.G.; Vigo, D. Intermediate facilities in freight transportation planning: A survey. Transp. Sci. 2016, 50, 763–789. [Google Scholar] [CrossRef]
  53. Dellaert, N.; Van Woensel, T.; Crainic, T.G.; Saridarq, F.D. A multi-commodity two-Echelon capacitated vehicle routing problem with time windows: Model formulations and solution approach. Comput. Oper. Res. 2021, 127, 105154. [Google Scholar] [CrossRef]
  54. Bosona, T.G.; Gebresenbet, G. Cluster building and logistics network integration of local food supply chain. Biosyst. Eng. 2011, 108, 293–302. [Google Scholar] [CrossRef]
  55. Bosona, T.; Gebresenbet, G.; Nordmark, I.; Ljungberg, D.; Jüriado, R. Integrated logistics network for the supply chain of locally produced food, Part I: Location and route optimization analyses. J. Serv. Sci. Manag. 2011, 4, 174. [Google Scholar] [CrossRef]
  56. Nordmark, I.; Ljungberg, D.; Gebresenbet, G.; Bosona, T.; Jüriado, R. Integrated logistics network for the supply chain of locally produced food, part II: Assessment of E-trade, economic benefit and environmental impact. J. Serv. Sci. Manag. 2012, 5, 22448. [Google Scholar] [CrossRef]
  57. Tong, D.; Ren, F.; Mack, J. Locating farmers’ markets with an incorporation of spatio-temporal variation. Socio-Econ. Plan. Sci. 2012, 46, 149–156. [Google Scholar] [CrossRef]
  58. Bosona, T.; Nordmark, I.; Gebresenbet, G.; Ljungberg, D. GIS-based analysis of integrated food distribution network in local food supply chain. Int. J. Bus. Manag. 2013, 8, 13. [Google Scholar] [CrossRef]
  59. Bosona, T.; Gebresenbet, G.; Nordmark, I.; Ljungberg, D. Box-scheme based delivery system of locally produced organic food: Evaluation of logistics performance. J. Serv. Sci. Manag. 2011, 4, 357. [Google Scholar] [CrossRef]
  60. Saetta, S.A.; Caldarelli, V.; Tiacci, L.; Lerche, N.; Geldermann, J. A logistic network to harmonise the development of local food system with safety and sustainability. Int. J. Integr. Supply Manag. 2015, 9, 307–328. [Google Scholar] [CrossRef]
  61. Duram, L.; Oberholtzer, L. A geographic approach to place and natural resource use in local food systems. Renew. Agric. Food Syst. 2010, 25, 99–108. [Google Scholar] [CrossRef]
  62. Nsamzinshuti, A.; Janjevic, M.; Rigo, N.; Ndiaye, A.B. Logistics collaboration solutions to improve short food supply chain solution performance. In Proceedings of the 3rd World Conference on Supply Chain Management, Colombo, Sri Lanka, 17–19 May 2017; Volume 2, pp. 57–69. [Google Scholar]
  63. Kukovič, D.; Topolšek, D.; Rosi, B.; Jereb, B. A comparative literature analysis of definitions for logistics: Between general definition and definitions of subcategories. In Proceedings of the 14th International Scientific Conference Business Logistics in Modern Management, Osijek, Croatia, 16 October 2014. [Google Scholar]
  64. Ringsberg, H. Perspectives on food traceability: A systematic literature review. Supply Chain. Manag. Int. J. 2014, 19, 558–576. [Google Scholar] [CrossRef]
  65. Markley, M.J.; Davis, L. Exploring future competitive advantage through sustainable supply chains. Int. J. Phys. Distrib. Logist. Manag. 2007, 37, 763–774. [Google Scholar] [CrossRef]
  66. Kneafsey, M.; Venn, L.; Schmutz, U.; Balázs, B.; Trenchard, L.; Eyden-Wood, T.; Bos, E.; Sutton, G.; Blackett, M. Short food supply chains and local food systems in the EU. A state of play of their socio-economic characteristics. JRC Sci. Policy Rep. 2013, 123, 129. [Google Scholar] [CrossRef]
  67. Bask, A.; Rajahonka, M. The role of environmental sustainability in the freight transport mode choice: A systematic literature review with focus on the EU. Int. J. Phys. Distrib. Logist. Manag. 2017, 47, 560–602. [Google Scholar] [CrossRef]
  68. Sini, M.P. Long and short supply chain coexistence in the agricultural food market on different scales: Oligopolies, local economies and the degree of liberalisation of the global market. Eur. Sci. J. 2014, 10, 26.363–26.401. [Google Scholar]
  69. Rapisarda, P. Analysis of a direct selling network for agrifood products. Ital. J. Food Sci. 2015, 27, 109–117. [Google Scholar] [CrossRef]
  70. Wallgren, C. Local or global food markets: A comparison of energy use for transport. Local Environ. 2006, 11, 233–251. [Google Scholar] [CrossRef]
  71. Edwards-Jones, G.; i Canals, L.M.; Hounsome, N.; Truninger, M.; Koerber, G.; Hounsome, B.; Cross, P.; York, E.H.; Hospido, A.; Plassmann, K.; et al. Testing the assertion that ‘local food is best’: The challenges of an evidence-based approach. Trends Food Sci. Technol. 2008, 19, 265–274. [Google Scholar] [CrossRef]
  72. Glettner, C. Energy Use in the Transport of Food: Comparing Local and Conventional Food Systems in Berkeley, CA. 2008. Available online: https://nature.berkeley.edu/classes/es196/projects/2008final/Glettner_2008.pdf (accessed on 5 July 2024).
  73. Mariola, M.J. The local industrial complex? Questioning the link between local foods and energy use. Agric. Hum. Values 2008, 25, 193–196. [Google Scholar] [CrossRef]
  74. Cleveland, D.A.; Radka, C.N.; Müller, N.M.; Watson, T.D.; Rekstein, N.J.; Van M. Wright, H.; Hollingshead, S.E. Effect of localizing fruit and vegetable consumption on greenhouse gas emissions and nutrition, Santa Barbara County. Environ. Sci. Technol. 2011, 45, 4555–4562. [Google Scholar] [CrossRef] [PubMed]
  75. Pirog, R.S.; Van Pelt, T.; Enshayan, K.; Cook, E. Food, Fuel, and Freeways: An IOWA Perspective on How Far Food Travels, Fuel Usage, and Greenhouse Gas Emissions; Leopold Center for Sustainable Agriculture, Iowa State University: Ames, IA, USA, 2001. [Google Scholar]
  76. Jones, A. An environmental assessment of food supply chains: A case study on dessert apples. Environ. Manag. 2002, 30, 560–576. [Google Scholar] [CrossRef]
  77. Auld, G.W.; Thilmany, D.; Jones, K. Factors affecting small Colorado producers’ local food sales. J. Hunger. Environ. Nutr. 2009, 4, 129–146. [Google Scholar] [CrossRef]
  78. Dong, Y.; Miller, S.A.; Keoleian, G.A. Estimating the greenhouse gas emissions of cold chain infrastructure in China from 2021 to 2060. Sustain. Prod. Consum. 2022, 31, 546–556. [Google Scholar] [CrossRef]
  79. Bauskar, M.E. Special Models for a Multi-Item, Multi-Location, Multi-Echelon, Multi-Period Inventory System with Centralized Replenishments and Restricted Transshipments; The University of Alabama: Tuscaloosa, AL, USA, 1997. [Google Scholar]
  80. Hinojosa, Y.; Puerto, J.; Fernández, F.R. A multiperiod two-echelon multicommodity capacitated plant location problem. Eur. J. Oper. Res. 2000, 123, 271–291. [Google Scholar] [CrossRef]
  81. Sadjady, H.; Davoudpour, H. Two-echelon, multi-commodity supply chain network design with mode selection, lead-times and inventory costs. Comput. Oper. Res. 2012, 39, 1345–1354. [Google Scholar] [CrossRef]
  82. Montoya-Torres, J.R.; Franco, J.L.; Isaza, S.N.; Jiménez, H.F.; Herazo-Padilla, N. A literature review on the vehicle routing problem with multiple depots. Comput. Ind. Eng. 2015, 79, 115–129. [Google Scholar] [CrossRef]
  83. Dobers, K.; Perotti, S.; Fossa, A. Emission Intensity Factors for Logistics Buildings; Fraunhofer IML: Dortmund, Germany, 2022. [Google Scholar] [CrossRef]
  84. BSI BS EN 16258:2012; Methodology for Calculation and Declaration of Energy Consumption and GHG Emissions of Transport Services (Freight and Passengers). BSI: London, UK, 2012.
  85. Tassou, S.; Ge, Y.; Hadawey, A.; Marriott, D. Energy consumption and conservation in food retailing. Appl. Therm. Eng. 2011, 31, 147–156. [Google Scholar] [CrossRef]
  86. Foster, A.; Brown, T.; Evans, J.; Maidment, G. Relationship between specific energy consumption and size of supermarket stores. Refrig. Sci. Technol. 2019, 2019, 4973–4980. [Google Scholar] [CrossRef]
  87. Franco, A.; Cillari, G. Energy Sustainability of Food Stores and Supermarkets through the Installation of PV Integrated Plants. Energies 2021, 14, 5678. [Google Scholar] [CrossRef]
Figure 1. Food hub-based two-echelon SFSC transportation network.
Sustainability 16 07781 g001
Figure 2. The CO2 emission function with the quantity flows within the hub.
Sustainability 16 07781 g002
Figure 3. Data size of the department Seine Maritime.
Sustainability 16 07781 g003
Figure 4. Workflow for finding the optimal food hub locations and design and calculating the total GHG emissions of the SFSC.
Sustainability 16 07781 g004
Figure 5. Emissions and emission intensity.
Sustainability 16 07781 g005
Figure 6. The example solution for the hub location and design with different production levels.
Sustainability 16 07781 g006
Figure 7. The opening of hubs corresponds to their production levels.
Sustainability 16 07781 g007
Figure 8. Number of hubs and their impact on total emission/emission intensity in relation to EFs.
Sustainability 16 07781 g008
Figure 9. Emissions under Production Level 1 utilizing United Kingdom’s emission factor.
Sustainability 16 07781 g009
Figure 10. Hub selection and emissions under different productions utilizing France’s emission factor with different short distances defined.
Sustainability 16 07781 g010
Table 1. Truck specifications. Source: Renault Group, https://cdn.group.renault.com/ren/ch/renault-new-cars/pricelists/Renault_Master_PL_f.pdf.asset.pdf/c7d9f4ed1b.pdf, accessed on 1 January 2024.
Truck TypeCapacity (kg)Diesel Consumption (L/100 km)
Kangoo6005.33
Fourgon15008.2
Table 2. Electricity emission factors in different countries. Source: Carbon Footprint Ltd’s 2023 Integrated Report, https://www.carbonfootprint.com/international_electricity_factors.html, accessed on 30 July 2023.
CountryCountry CodeEmission Factor (kg CO2/kWh)
FranceFR0.06207
United KingdomGB0.22499
United StatesUS0.40706
ChinaCN0.55720
South AfricaZA0.86650
Table 3. Different food production levels.
Production LevelDemand Satisfaction Percentage (%)
130
250
3100
4160
5300
61500
Disclaimer/Publisher’s Note: The statements, opinions and data contained in all publications are solely those of the individual author(s) and contributor(s) and not of MDPI and/or the editor(s). MDPI and/or the editor(s) disclaim responsibility for any injury to people or property resulting from any ideas, methods, instructions or products referred to in the content.

