Article

“Treating Waste with Waste”: Utilizing Phosphogypsum to Synthesize Porous Calcium Silicate Hydrate for Recovering of Fe2+ from Pickling Wastewater

1
School of Materials and Research, Guizhou University, Guiyang 550025, China
2
Key Laboratory of Metallurgical Engineering and Process Energy Conservation of Guizhou Province, Guiyang 550025, China
*
Authors to whom correspondence should be addressed.
Sustainability 2024, 16(17), 7796; https://doi.org/10.3390/su16177796
Submission received: 24 July 2024 / Revised: 22 August 2024 / Accepted: 5 September 2024 / Published: 6 September 2024

Abstract

:
Phosphogypsum is a by-product of the wet-process phosphoric acid production, and it is rich in Ca and S. Long-term storage of Phosphogypsum can cause serious pollution to the environment; therefore, promoting the sustainable utilization of Phosphogypsum is crucial. This study proposes the use of Phosphogypsum and silicic acid in a sodium hydroxide solution for the hydrothermal synthesis of porous calcium silicate hydrate adsorbent, which is used for adsorbing Fe2+ from simulated hydrochloric acid pickling wastewater. Under the optimal synthesis conditions (37.5 g/L of NaOH, calcium/silicon ratio of 1.0, liquid/solid ratio of 15:1 mL/g, 110 °C, and 4 h), the conversion rate of SO42− in Phosphogypsum is 87.41%. Porous calcium silicate hydrate exhibits excellent OH release capability in Fe2+-containing pickling wastewater. The adsorption process for Fe2+; is mainly chemical adsorption, involving ion exchange between Ca2+ and Fe2+, as well as complexation reactions of O-Si-O group, -OH group, and Si-O group with Fe2+. This technology aims to provide a solution for the sustainable utilization of Phosphogypsum and the recovery of Fe2+ from pickling wastewater, which has significant practical importance.

Graphical Abstract

1. Introduction

Steel pickling wastewater is produced during the steel pickling process, which involves treating the surface of steel components to remove iron oxide scale, commonly using hydrochloric acid [1]. In recent years, China has been the world’s largest steel producer, generating millions of tons of pickling wastewater annually. This pickling wastewater is strongly acidic (pH value below 2.0). The industry typically employs acid–base neutralization methods to treat acidic wastewater. However, this results in sludge that is difficult to handle and causes significant waste of iron metals [2]. Various related treatment technologies have been reported. The spray roasting technology has a high iron recovery rate but requires strict temperature control and consumes a lot of energy [3]. The improved mineralization–neutralization technology effectively achieves acid treatment and iron recovery, but due to the complexity of the operation process, it is challenging to handle large volumes of wastewater [4]. The electrochemical technology has a significant treatment effect [5], but it is complex to operate and requires a high iron concentration. In recent years, adsorption has gained increasing attention as a simple and efficient method for treating heavy metal ions in wastewater [6,7,8]. Porous calcium silicate hydrate (PCSH) is a synthetic inorganic silicate with a high specific surface area, a well-developed pore structure, and stable chemical properties. It has good ion release and alkaline supply capabilities, and its preparation method is simple, making it a promising economic, efficient, and environmentally friendly heavy metal ion adsorbent [9,10,11]. The raw materials for preparing PCSH mostly come from solid waste, which not only achieves the resource utilization of solid waste to a certain extent, but also addresses the issue of solid waste storage [12,13,14].
Phosphogypsum (PG) is a solid waste residue produced in the wet-process phosphoric acid production and is mainly composed of CaSO4·2H2O. Currently, nearly 300 million tons of PG are produced globally each year, with China’s production exceeding 70 million tons [15,16]. It has been reported that approximately 5 tons of PG are generated for every ton of phosphoric acid produced. The annual accumulation of PG increases at a rate of 100 to 128 million tons, leading to severe problems such as heavy metal pollution, water eutrophication, and air pollution [17,18]. PG contains a large amount of Ca and S, and chemical purification techniques can convert it into a range of chemical products such as calcium sulfate whiskers [19], potassium sulfate [20], or ammonium sulfate [21]. Currently, the sustainable utilization of PG is a research hotspot. If the abundant calcium source in PG can be effectively utilized and converted into PCSH by reacting with a readily available silicon source (such as sodium silicate) [22], and if the conversion of important components can be enhanced during the reaction process to increase the added value of PG, this could potentially achieve the sustainable development of PG.
In this study, PG is used as the reactive material, by adding silicic acid and conducting hydrothermal synthesis of PCSH in a sodium hydroxide solution system. We perform a thermodynamic feasibility analysis of the synthesis process. The study mainly investigates the effects of hydrothermal conditions on the conversion rate of SO42− in PG. Subsequently, PCSH prepared under optimal conditions is used to adsorb Fe2+ from simulated hydrochloric acid pickling wastewater. Kinetic models of the adsorption process are established, and the adsorption mechanism is analyzed. This study provides theoretical references for the industrial technological feasibility of “preparing PCSH from PG and removing Fe2+; from pickling wastewater”. The goal is to promote the sustainable resource utilization of PG and purify and recover iron-containing pickling wastewater, thereby achieving “waste treatment using waste”.

2. Materials and Methods

2.1. Materials

PG used in this study was sourced from a phosphate chemical plant in Guizhou Province. Prior to use, the washing process for PG involves placing it into a beaker containing deionized water, subjecting it to ultrasonic treatment for 10 min, and then filtering it. This operation is repeated twice, dried at 105 °C for 48 h, and then crushed, ground, and sieved through a 200-mesh screen. The silica acid (H2SiO3) and sodium hydroxide (NaOH) used were of analytical grade (Aladdin Biochemical Technology Company, Shanghai, China). Solutions of sodium hydroxide at various concentrations were prepared by diluting with deionized water (18.25 MΩ·cm, 25 °C) and then standardizing. The main chemical components of the washed PG were determined using X-ray fluorescence (XRF) spectroscopy, and the fluorine content was measured using an ion-selective electrode method, with results shown in Table 1. It can be observed that the primary oxides in PG are sulfur trioxide and calcium oxide, with SO3 accounting for 51.58 wt% and CaO for 39.61 wt%. This indicates that PG is rich in S and Ca elements. Additionally, P2O5 accounts for 5.11 wt%, and SiO2 for 2.25 wt%. Furthermore, PG contains trace amounts of metal impurities, and F content is 0.17 wt%.
The XRD and SEM-EDS results of PG are demonstrated in Figure 1a–c, indicating that the main phases are calcium sulfate and calcium sulfate hemihydrate, along with minor amounts of calcium hydrogen phosphate and quartz. The inner surface of PG contains abundant Ca and S elements, with a generally consistent surface structure, and the distribution of each element is basically uniform.

2.2. Methods

2.2.1. Preparation of PCSH

The experimental process, as illustrated in Figure 1, primarily involves two processes: hydrothermal reaction and solid–liquid separation, conducted in a single reactor equipped with a mechanical stirring system. Initially, solid silica acid is mixed with the prepared sodium hydroxide solution and stirred for 15 min, PG is then added, and the mixture is stirred for an additional 5 min. The mixture is transferred to the single reactor and heated to a constant temperature until the reaction is complete. After the reaction, the pH of the slurry liquid is measured at room temperature. The slurry is subjected to ultrasonic treatment for 5 min before solid–liquid separation, which is repeated three times. The collected solid product is dried in an oven at 60 °C for 24 h and then crushed, ground, and sieved through a 200-mesh screen to obtain the PCSH product. The calcium/silicon ratio indicates the CaO/SiO2 molar ratio of PG to silicic acid, and the liquid/solid ratio indicates the volume/mass ratio (mL/g) of sodium hydroxide solution to PG. The specific condition parameters are shown in Table S1.
After separation, the filtrate is diluted and made up to a 500 mL volume in a volumetric flask to measure the SO42− content. The determination method for SO42− employs “Barium Chromate Spectrophotometry” (HJ/T 342-2007) [23], and the details are shown in Text S1. The conversion rate of SO42− in PG is calculated as follows (Equation (1)):
φ = m ( S O 4 2 ) E x p m ( S O 4 2 ) T h e × 100
where φ refers to the mass percentage (%) of SO42− in the filtrate to the total SO42−, m(SO42−)Exp is the mass of SO42− in the filtrate, and m(SO42−)The is the total mass of sulphate in the PG.

2.2.2. Adsorption Experiment

The simulated pickling wastewater studied in the experiment primarily utilized iron powder and hydrochloric acid to prepare 1000 mg/L Fe2+; standard solution (the pH value of simulated pickling wastewater is approximately 2). The adsorption experiments and the dilution and volumetric processes use oxygen-free deionized water. Several centrifuge tubes were taken, 50 mL of a certain concentration of Fe2+ solution was added, and the solution pH was stabilized using hydrochloric acid/sodium hydroxide. A certain amount of PCSH was added into the centrifuge tubes, and they were quickly placed in a constant temperature shaker at 25 °C with a speed of 200 rpm to react for 12 h. After the reaction was complete, the stable pH value of the solution was measured, the supernatant was passed through a 0.22 μm organic filter membrane, and the Fe2+ concentration in the solution was measured. The determination method for Fe2+ uses the “O-phenanthroline Spectro-photometric Method” (HJ/T 345-2007 [24]) that measures absorbance at a wavelength of 510 nm.

2.3. Characterization and Analytical Methods

The pH of the slurry liquid or solution was determined using a pH meter (pH-3e, REX, Suzhou, China). The chemical composition of the samples was determined by X-ray fluorescence spectrometry (XRF); the samples were analyzed in their physical phase by X-ray diffraction spectroscopy (XRD) (continuous scanning: 5°/min), the morphology of the samples was observed by electron scanning electron microscopy (SEM), and the elemental distribution and content were determined using energy-dispersive X-ray spectroscopy (EDS). The specific surface area and average pore size of the synthesized products were tested using N2 adsorption–desorption (BET). Fourier-transform infrared spectroscopy (FTIR) was used to analysis the types of functional groups on the surface of the product before and after adsorption. X-ray photoelectron spectroscopy (XPS) was used to analyze the surface elemental composition and valence states of the product before and after adsorption (Figure 2).

3. Results and Discussion

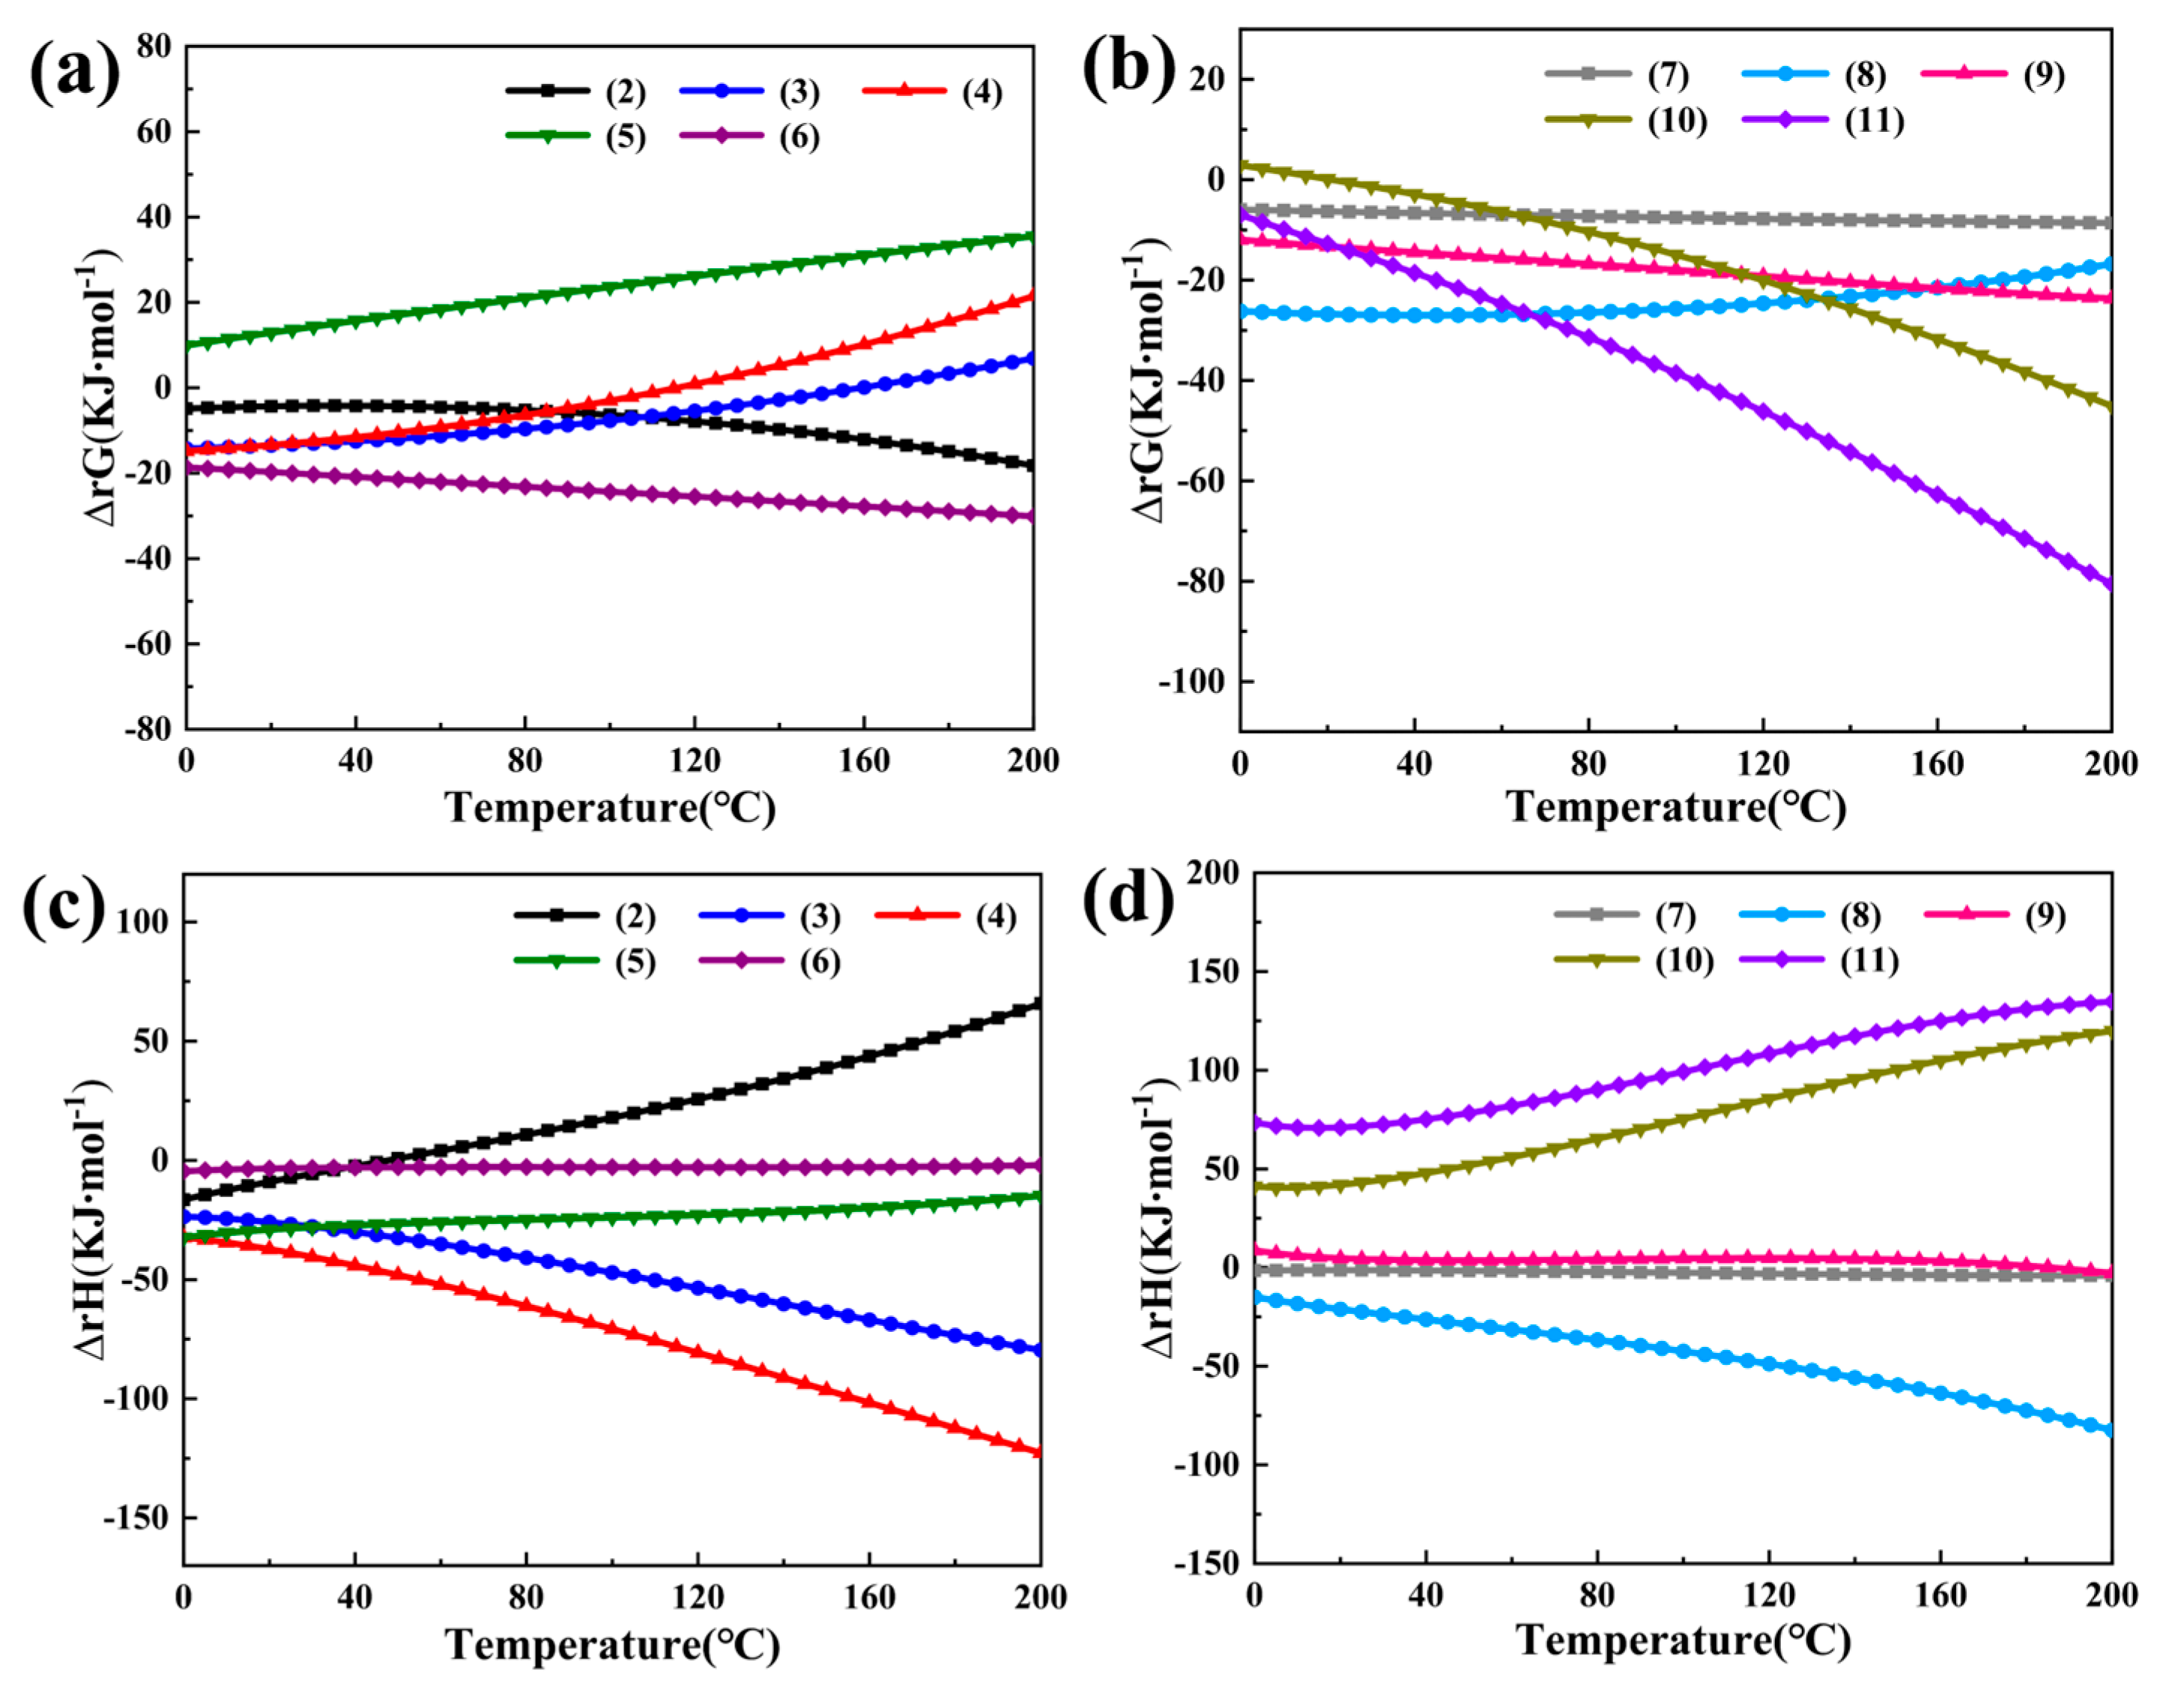
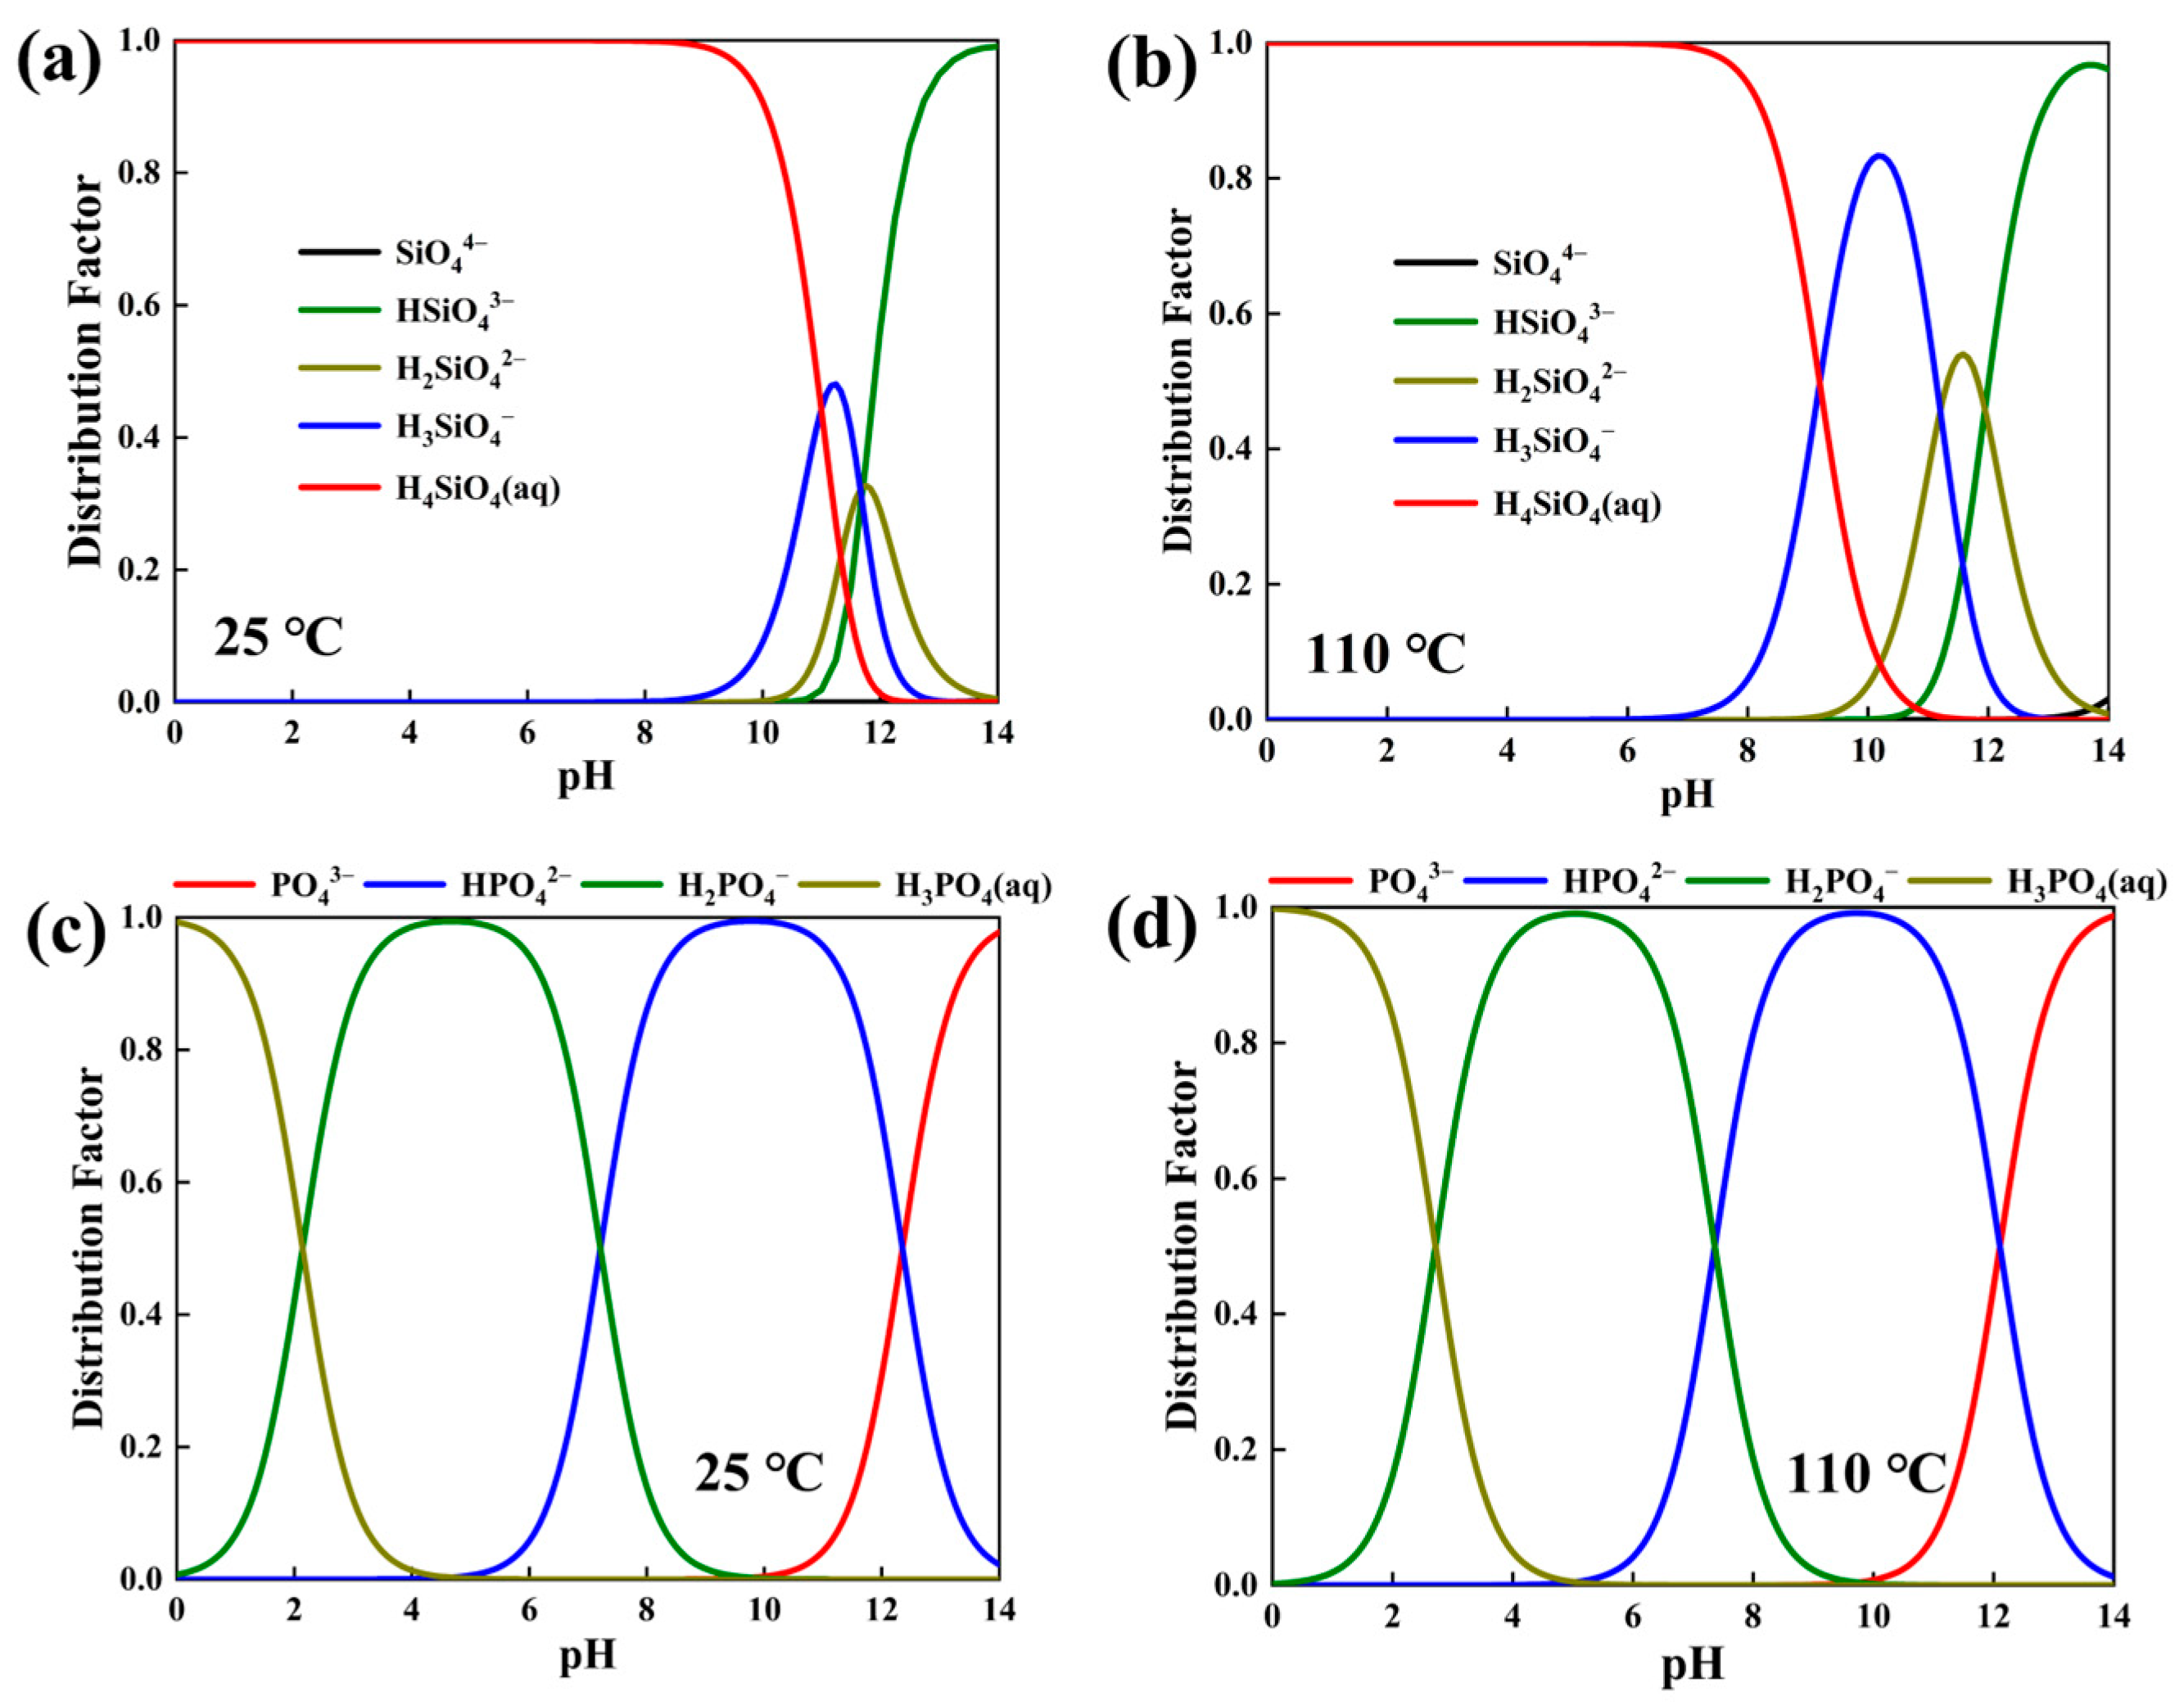
3.1. Synthetic Thermodynamic Analysis

Using the HSC Chemistry 10.3.4 software, the thermodynamic analysis of the hydrothermal synthesis of porous calcium silicate was conducted, incorporating all possible reactions from Equations (2)–(11):
H2SiO3(s) + OH(aq) = H3SiO4 (aq)
H3SiO4(aq) + OH(aq) = H2SiO42−(aq) + H2O(l)
H2SiO42−(aq) + OH(aq) = HSiO43−(aq) + H2O(l)
HSiO43−(aq) + OH (aq) = SiO44−(aq) + H2O(l)
2CaSO4·0.5H2O(s) + 4OH(aq) = 2Ca(OH)2(s) + 2SO42− + H2O(l)
CaSO4(s) + 2OH (aq) = Ca(OH)2(s) + SO42−(aq)
Ca(OH)2(s) + H3SiO4(aq) = CaSiO3(s) + OH(aq) + 2H2O(l)
Ca(OH)2(s) + H2SiO42−(aq) = CaSiO3(s) + 2OH(aq) + H2O(l)
Ca(OH)2(s) + HSiO43−(aq) = CaSiO3(s) + 3OH (aq)
Ca(OH)2(s) + SiO44−(aq) + H2O(l) = CaSiO3(s) + 4OH(aq)
The relationship between △rG/△rH and temperature is shown in Figure 3. In alkaline solutions, silicic acid easily reacts with OH− to form various free forms of silicate, which are the main sources of calcium silicate formed with calcium hydroxide (Equations (2)–(5)). Most reactions can proceed spontaneously at lower temperatures without additional energy consumption. From Equations (6) and (7) and △rG/△rH−T relationship curves, calcium sulfate or calcium sulfate hemihydrate minerals combine with OH and Na+ to form CaOH2(s) and Na2SO4, and finally, Ca(OH)2(s) combines with different forms of silicate to form a stable precipitate of CaSiO3 (Equations (8)–(11) (Figure 4)).

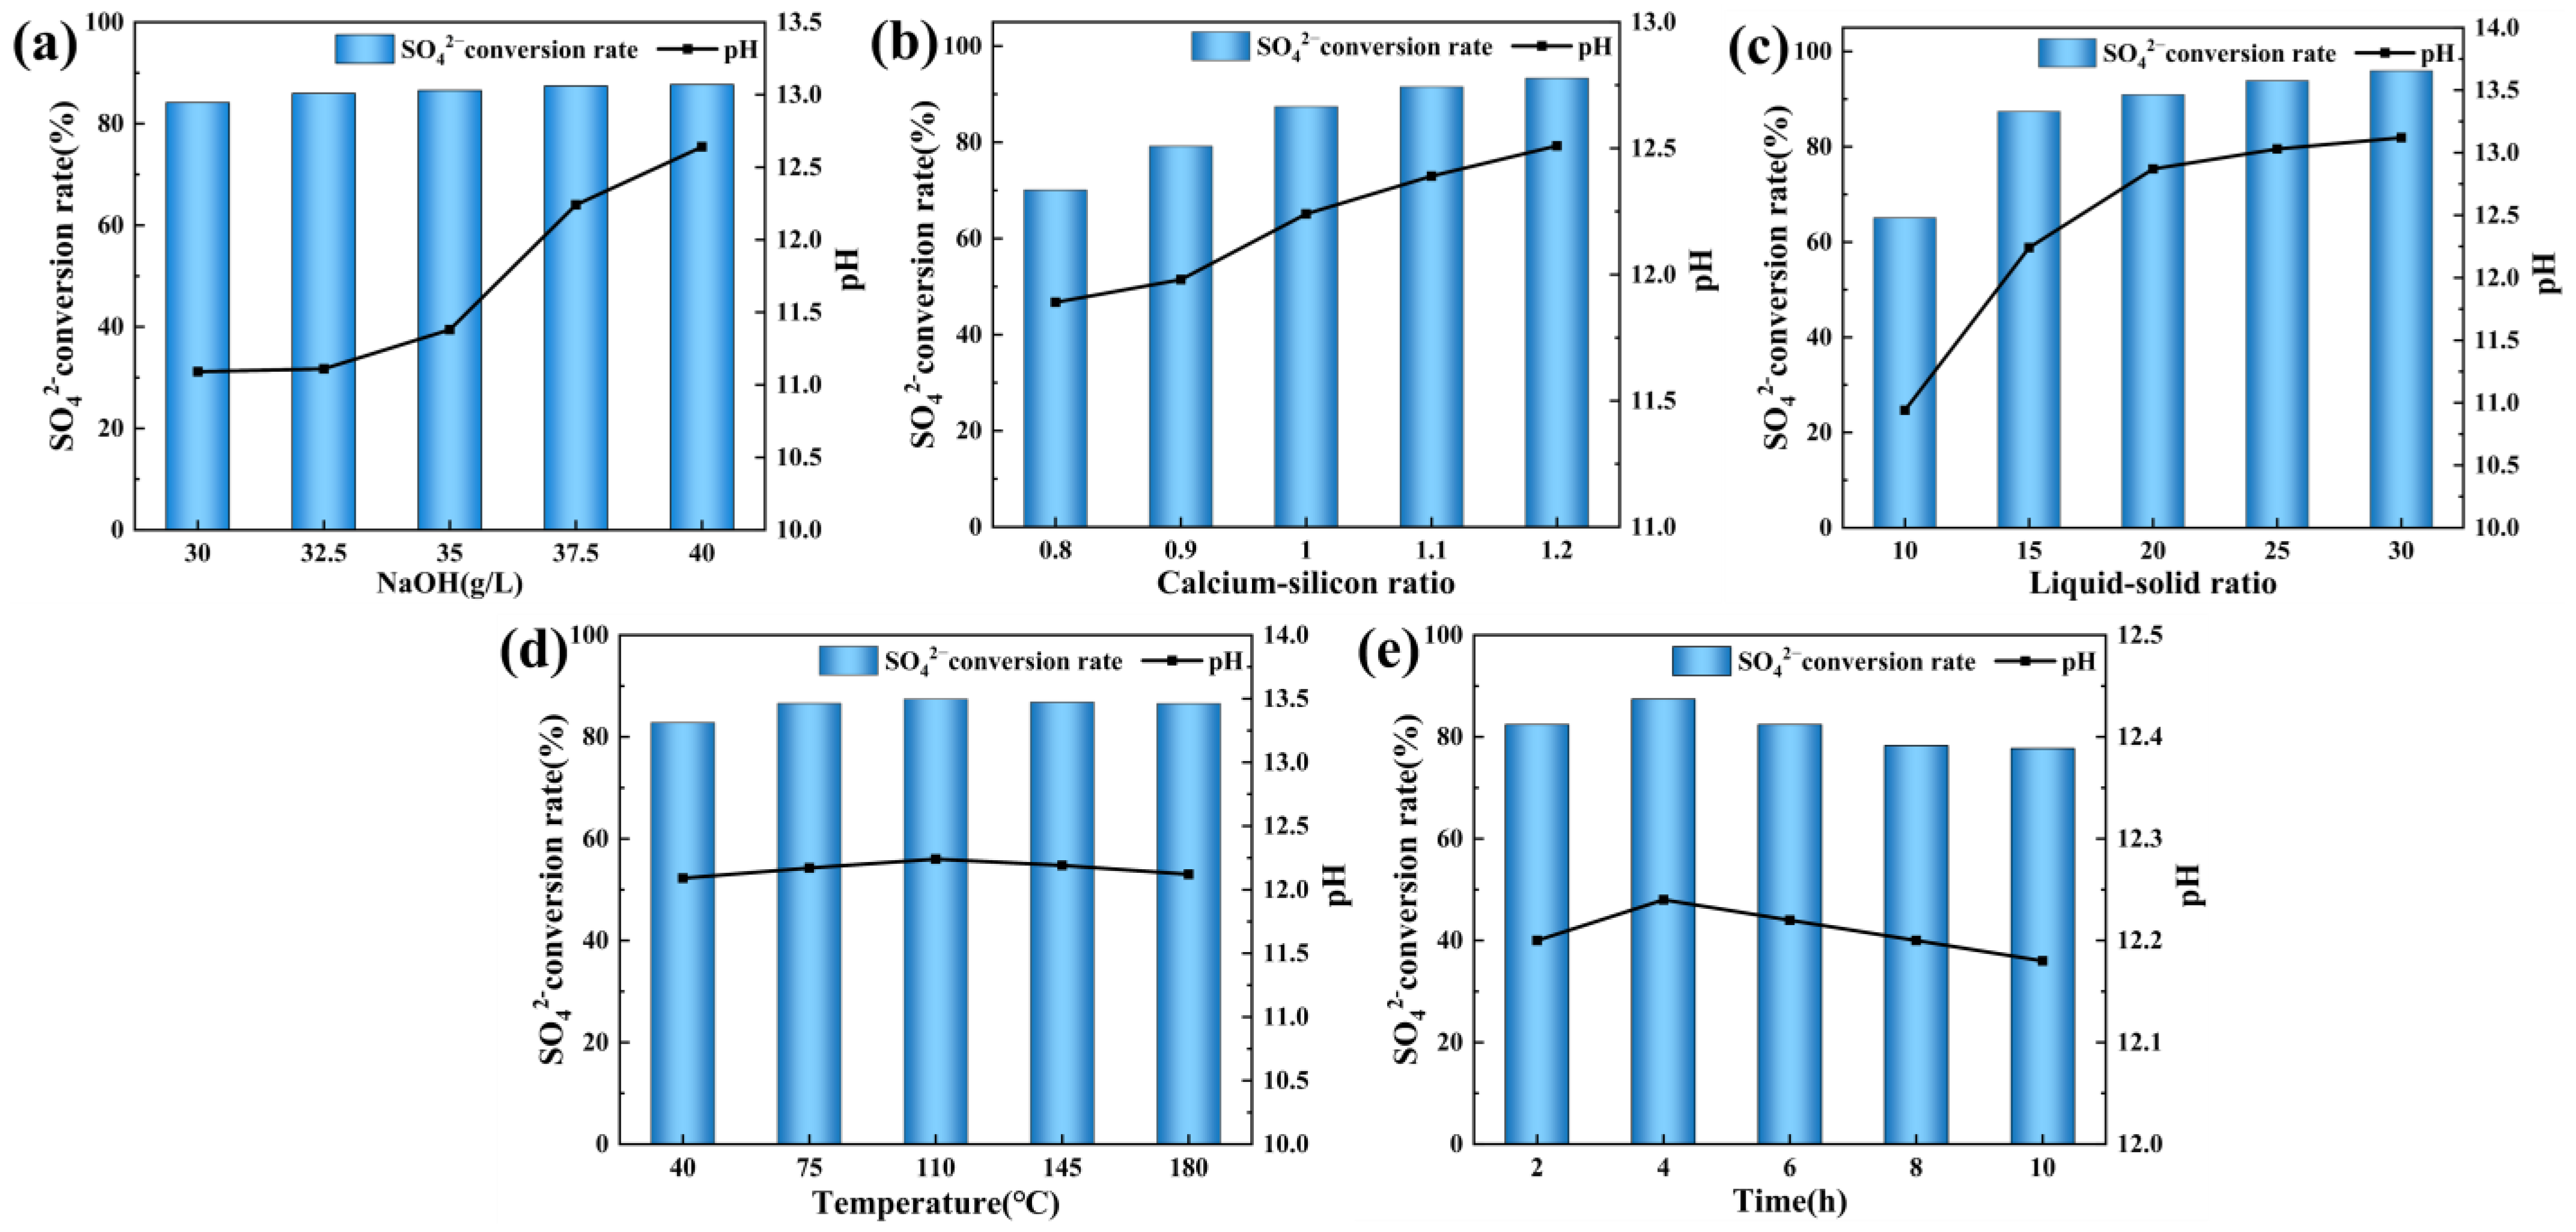
3.2. Effect of Different Condition Parameters on SO42− Conversion Rate in PG

Figure 5a and Figure 6a, respectively, show the SO42− conversion rate in PG and the XRD patterns of the products at different NaOH concentrations. The results indicate that the SO42− conversion rate increases with the increase in NaOH concentration, stabilizing at 37.5 g/L with a conversion rate of 87.41%. The pH changes significantly within the 35.0 g/L to 37.5 g/L range, providing the product with good alkalinity conducive to raising the pH of acidic wastewater. Therefore, 37.5 g/L is selected as the optimal NaOH concentration for hydrothermal synthesis. Higher alkaline concentrations mainly promote the conversion of calcium sulfate mineral phases to hydrated calcium silicate mineral phases (characteristic peaks at 29.355°, 32.053°, and 50.077°, PDF#33-0306), and a small amount of phosphorus converts to hydroxyapatite mineral phases (PDF#76-0694) and dicalcium phosphate mineral phases (PDF#26-0306), all of which are beneficial for adsorbing heavy metal ions [25,26].
Figure 5b and Figure 6b, respectively, show the SO42− conversion rate in PG and the XRD patterns of the products at different calcium/silicon ratios. The results indicate that an increase in the calcium/silicon ratio enhances the SO42− conversion rate. When the calcium/silicon ratio exceeds 1.0, the increase in the SO42− conversion rate is minor, with the slurry pH value and SO42− conversion rate showing a consistent trend. Therefore, a calcium/silicon ratio of 1.0 is chosen as the optimal ratio for hydrothermal synthesis. A lower calcium/silicon ratio results in unreacted calcium sulfate mineral phases, while at a calcium/silicon ratio of 1.2, the higher diffraction peaks indicate higher product crystallinity.
Figure 5c and Figure 6c, respectively, show the SO42− conversion rate in PG and the XRD patterns of the products at different liquid/solid ratios. The results indicate that increasing the liquid/solid ratio from 10:1 to 15:1 significantly affects the SO42− conversion rate, after which changes are minor. The slurry pH value and SO42− conversion rate exhibit a consistent trend, making 15:1 the optimal liquid/solid ratio for hydrothermal synthesis. Corresponding XRD patterns show incomplete PG conversion at a 10:1 mg/L liquid/solid ratio.
Figure 5d and Figure 6d, respectively, show the SO42− conversion rate in PG and the XRD patterns of the products at different reaction temperatures. The results indicate that the SO42− conversion rate peaks at 110 °C due to higher temperatures, causing particle encapsulation on the material surface, thereby hindering the reaction [27,28]. Thus, 110 °C is selected as the optimal temperature for hydrothermal synthesis, with the slurry pH value and SO42− conversion rate showing a consistent trend. At 180 °C, a tobermorite (PDF#40-0513) mineral phase appears, and due to its higher crystallinity, it is not conducive to providing adsorption active sites.
Figure 5e and Figure 6d, respectively, show the SO42− conversion rate in PG and the XRD patterns of the products at different reaction times. The results indicate that the PG conversion rate maximizes at 4 h and then slowly decreases. Therefore, 4 h is chosen as the optimal reaction time for hydrothermal synthesis. The XRD diffraction peaks at different times are similar, with the presence of a dicalcium phosphate mineral phase at 4 h.

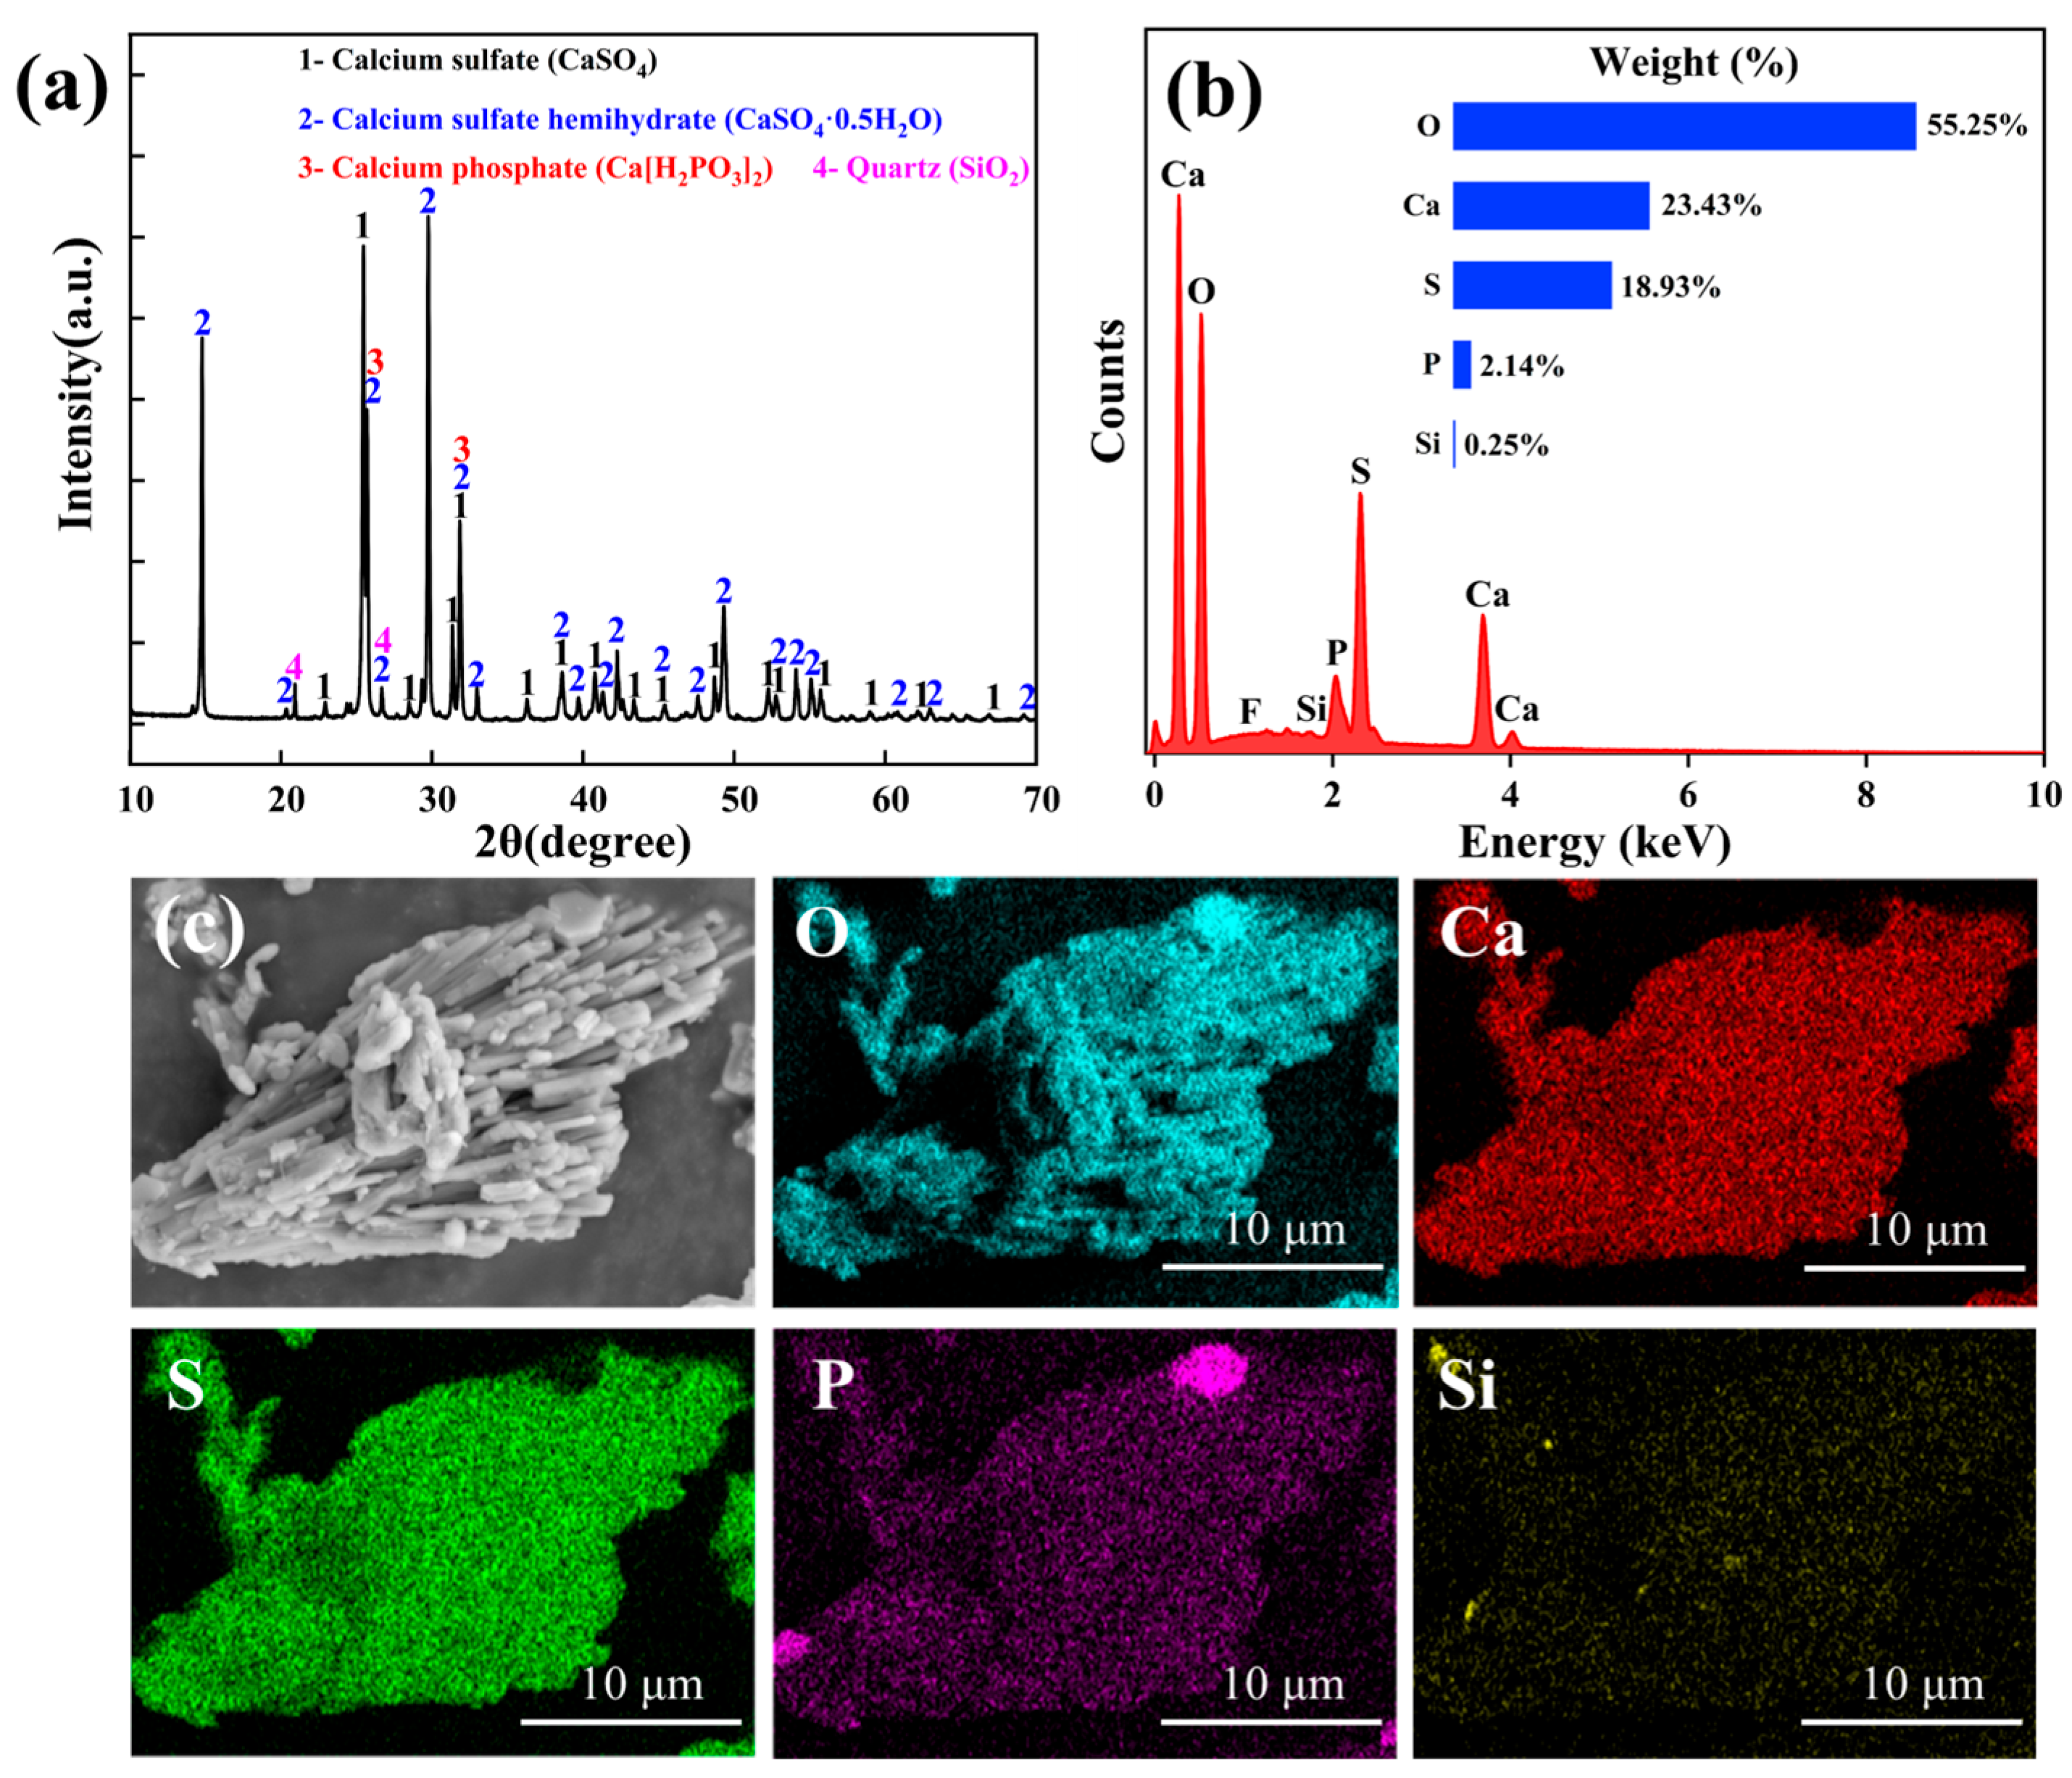
3.3. SEM and BET Characterization of PCSH

Figure 7a–o show SEM images of PCSH under different condition parameters. Figure 7a–c show that, at an NaOH concentration of 32.5–35.0 g/L, many unreacted materials are attached to the product surface, with no noticeable porous structure. As the NaOH concentration increases to 37.5 g/L, the product adopts an overall loose porous structure. Figure 7d–f show that, at lower calcium/silicon molar ratios, the surface is covered with many impurities. When the calcium/silicon ratio increases to 1.2, the product surface hardness increases, reducing the number of adsorption active sites. Figure 7g–i show that, at lower liquid/solid ratios, the reaction is incomplete, and many unreacted solid particles are attached to the product surface. As the liquid/solid ratio increases to 25:1, the fine particles on the surface gradually decrease, but the pore structure is not prominent. Figure 7j–l show that products synthesized at low temperatures exhibit a dense gel state. As the temperature increases, the surface porosity of the product becomes more apparent. When the temperature reaches 180 °C, the product surface structure hardens, mainly due to the formation of a highly crystalline tobermorite mineral phase, consistent with the XRD analysis results. Figure 7m–o show that, with an extended reaction time, the pore structure on the product surface becomes more apparent, which is beneficial for providing more adsorption active sites.
Figure 8a and Table 2, respectively, show N2 adsorption–desorption curves and pore structure parameters of PCSH under optimal hydrothermal conditions. The nitrogen adsorption–desorption curve of PCSH forms a good closed loop, indicating good desorption performance. The specific surface area of PCSH reaches 93.5066 m2/g, with an average pore diameter of 20.5658 nm, classifying it as a mesoporous structure. Figure 8b,c present the SEM-EDS images of PCSH. It can be observed that PCSH has well-developed pore structures, and the surface mainly contains Ca and Si and a small amount of P, with calcium content accounting for 26.86 wt% and silicon content accounting for 20.66 wt%, indicating a widespread distribution of porous calcium silicate. Subsequently, PCSH synthesized under optimal conditions will be used as an adsorbent for removing Fe2+ from simulated pickling wastewater.

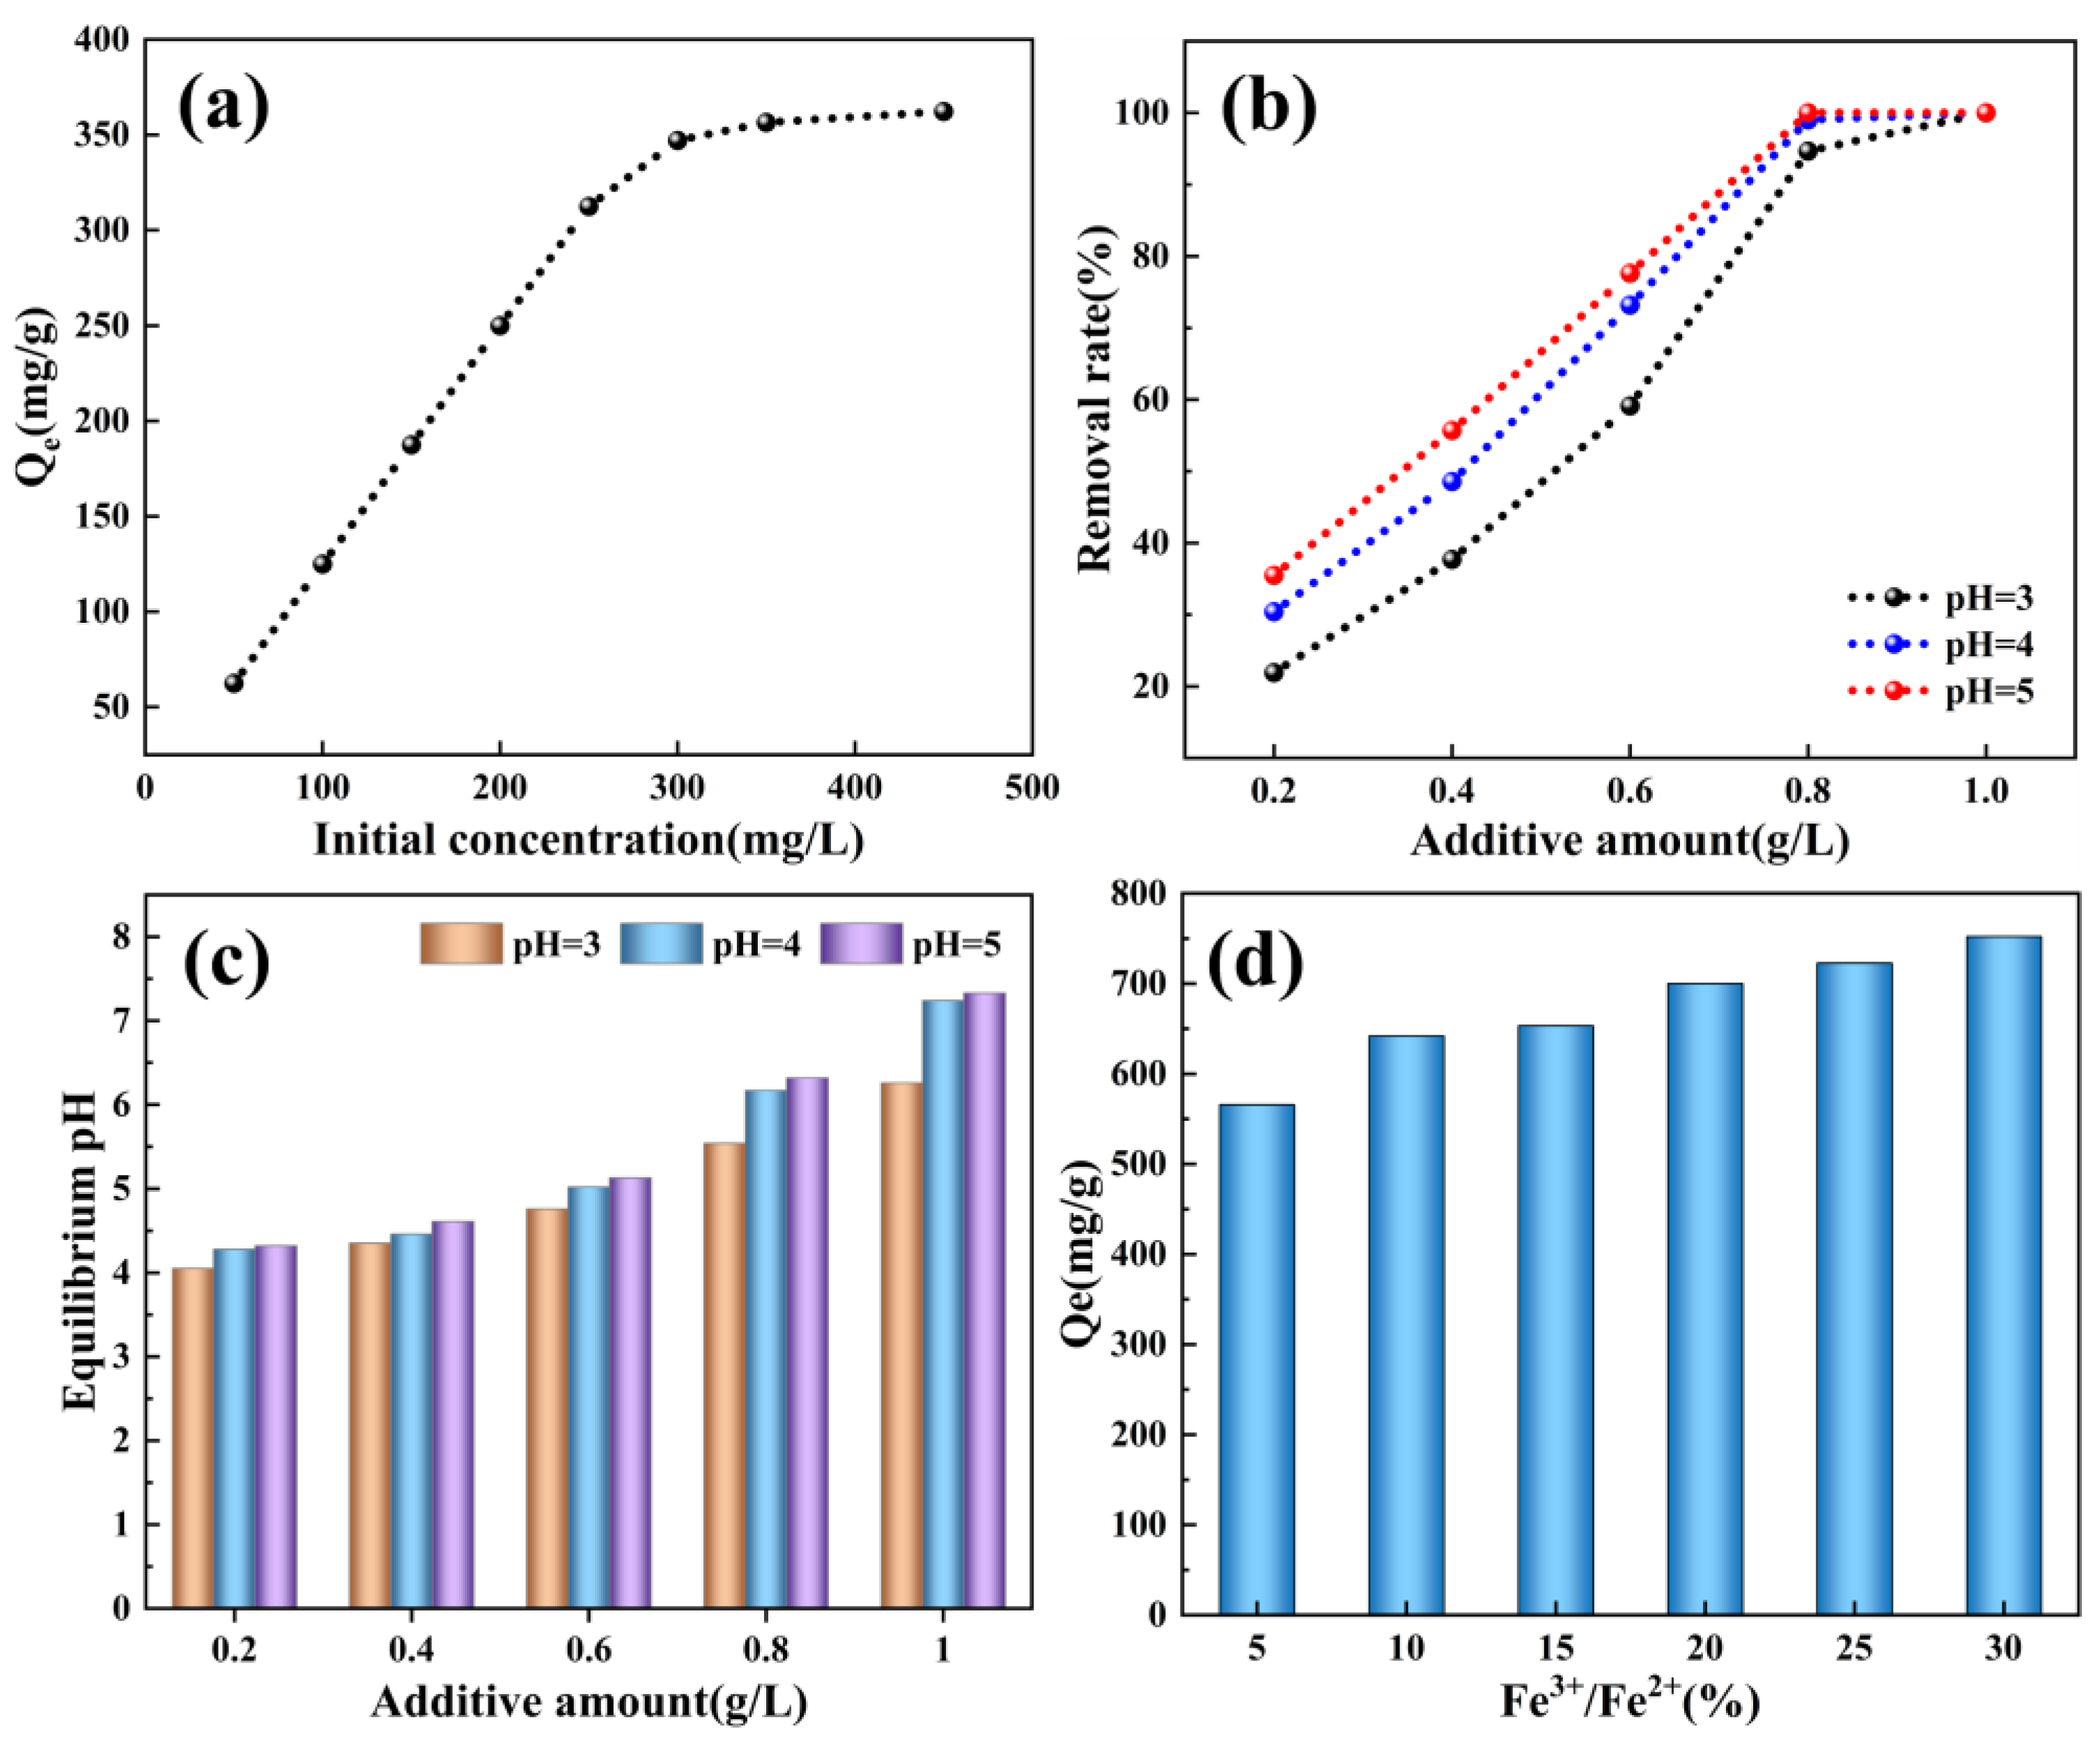
3.4. PCSH Adsorbs Fe2+ from Simulated Pickling Wastewater

Figure 9a shows the effects of different initial concentrations on Fe2+ adsorption capacity. Adsorption conditions are 25 °C, pH = 4, and PCSH additive amount of 0.8 g/L, and as the concentration of Fe2+ increases, the adsorption capacity of PCSH for Fe2+ increases rapidly. When the Fe2+ concentration reaches 250 mg/L, the adsorption capacity is 309.54 mg/g. The subsequent increase in adsorption capacity gradually decreases. Therefore, 250 mg/L is considered the optimal initial concentration for subsequent experiments. Figure 9b shows the effect of different PCSH additive amounts and initial pH conditions on the removal rate of Fe2+. As the initial pH or PCSH additive amount increases, the removal rate of Fe2+ is promoted. At pH of 4 and PCSH additive amount of 0.8 g/L, the Fe2+ removal rate reaches a maximum of 99.05%. The equilibrium pH of the solution after adsorption significantly increases, with the pH value exceeding 6.0, indicating that PCSH has a good OH releasing capability [29], as shown in Figure 9c.
In actual pickling wastewater, the stored wastewater easily comes into contact with air or dissolved oxygen in water, causing Fe2+ to oxidize to Fe3+. As the pH increases, Fe3+ undergoes chemical precipitation to form Fe(OH)3. Figure 9d shows the adsorption effects of PCSH on Fe2+ under different Fe3+; contents. Under the conditions of a solution pH of 4 and a PCSH dosage of 0.4 g/L, the removal effect of Fe2+ significantly improves with the increase in Fe3+ content. This is attributed to the adsorption performance of Fe(OH)3, whose presence aids in the removal of Fe2+ [30].

3.5. Adsorption Kinetics

Figure 10a shows the relationship between Qt of PCSH for Fe2+ and the time of adsorption. As the adsorption time increases, the adsorption capacity Qt continuously increases, but the rate of increase gradually slows down after 60 min and basically reaches the maximum Qt at 240 min. The experimental scatter plots were fitted using pseudo-first-order, pseudo-second-order, and Elovich kinetic models, with the corresponding equations given in Equations (12)–(14) [31,32,33].
Q t = Q e ( 1 e ( K 1 t ) )
Q t = K 2 Q e 2 t / ( 1 + K 2 Q e t )
Q t = a + b l n t
Figure 10b–d and Table 3, respectively, show the fitted curves and kinetic parameters for the three kinetic models. The results indicate that the R2 values of the fitted curves for the pseudo-second-order kinetic model are higher than those for the pseudo-first-order model and Elovich kinetic model, ranging from approximately 0.9769 to 0.9840, with a smaller fluctuation range and closer proximity to 1, which is markedly better than those of the pseudo-first-order and Elovich models. Therefore, the adsorption process of Fe2+ by PCSH is more consistent with the pseudo-second-order kinetic model, indicating that the adsorption process of PCSH for Fe2+ is mainly chemical adsorption [34].

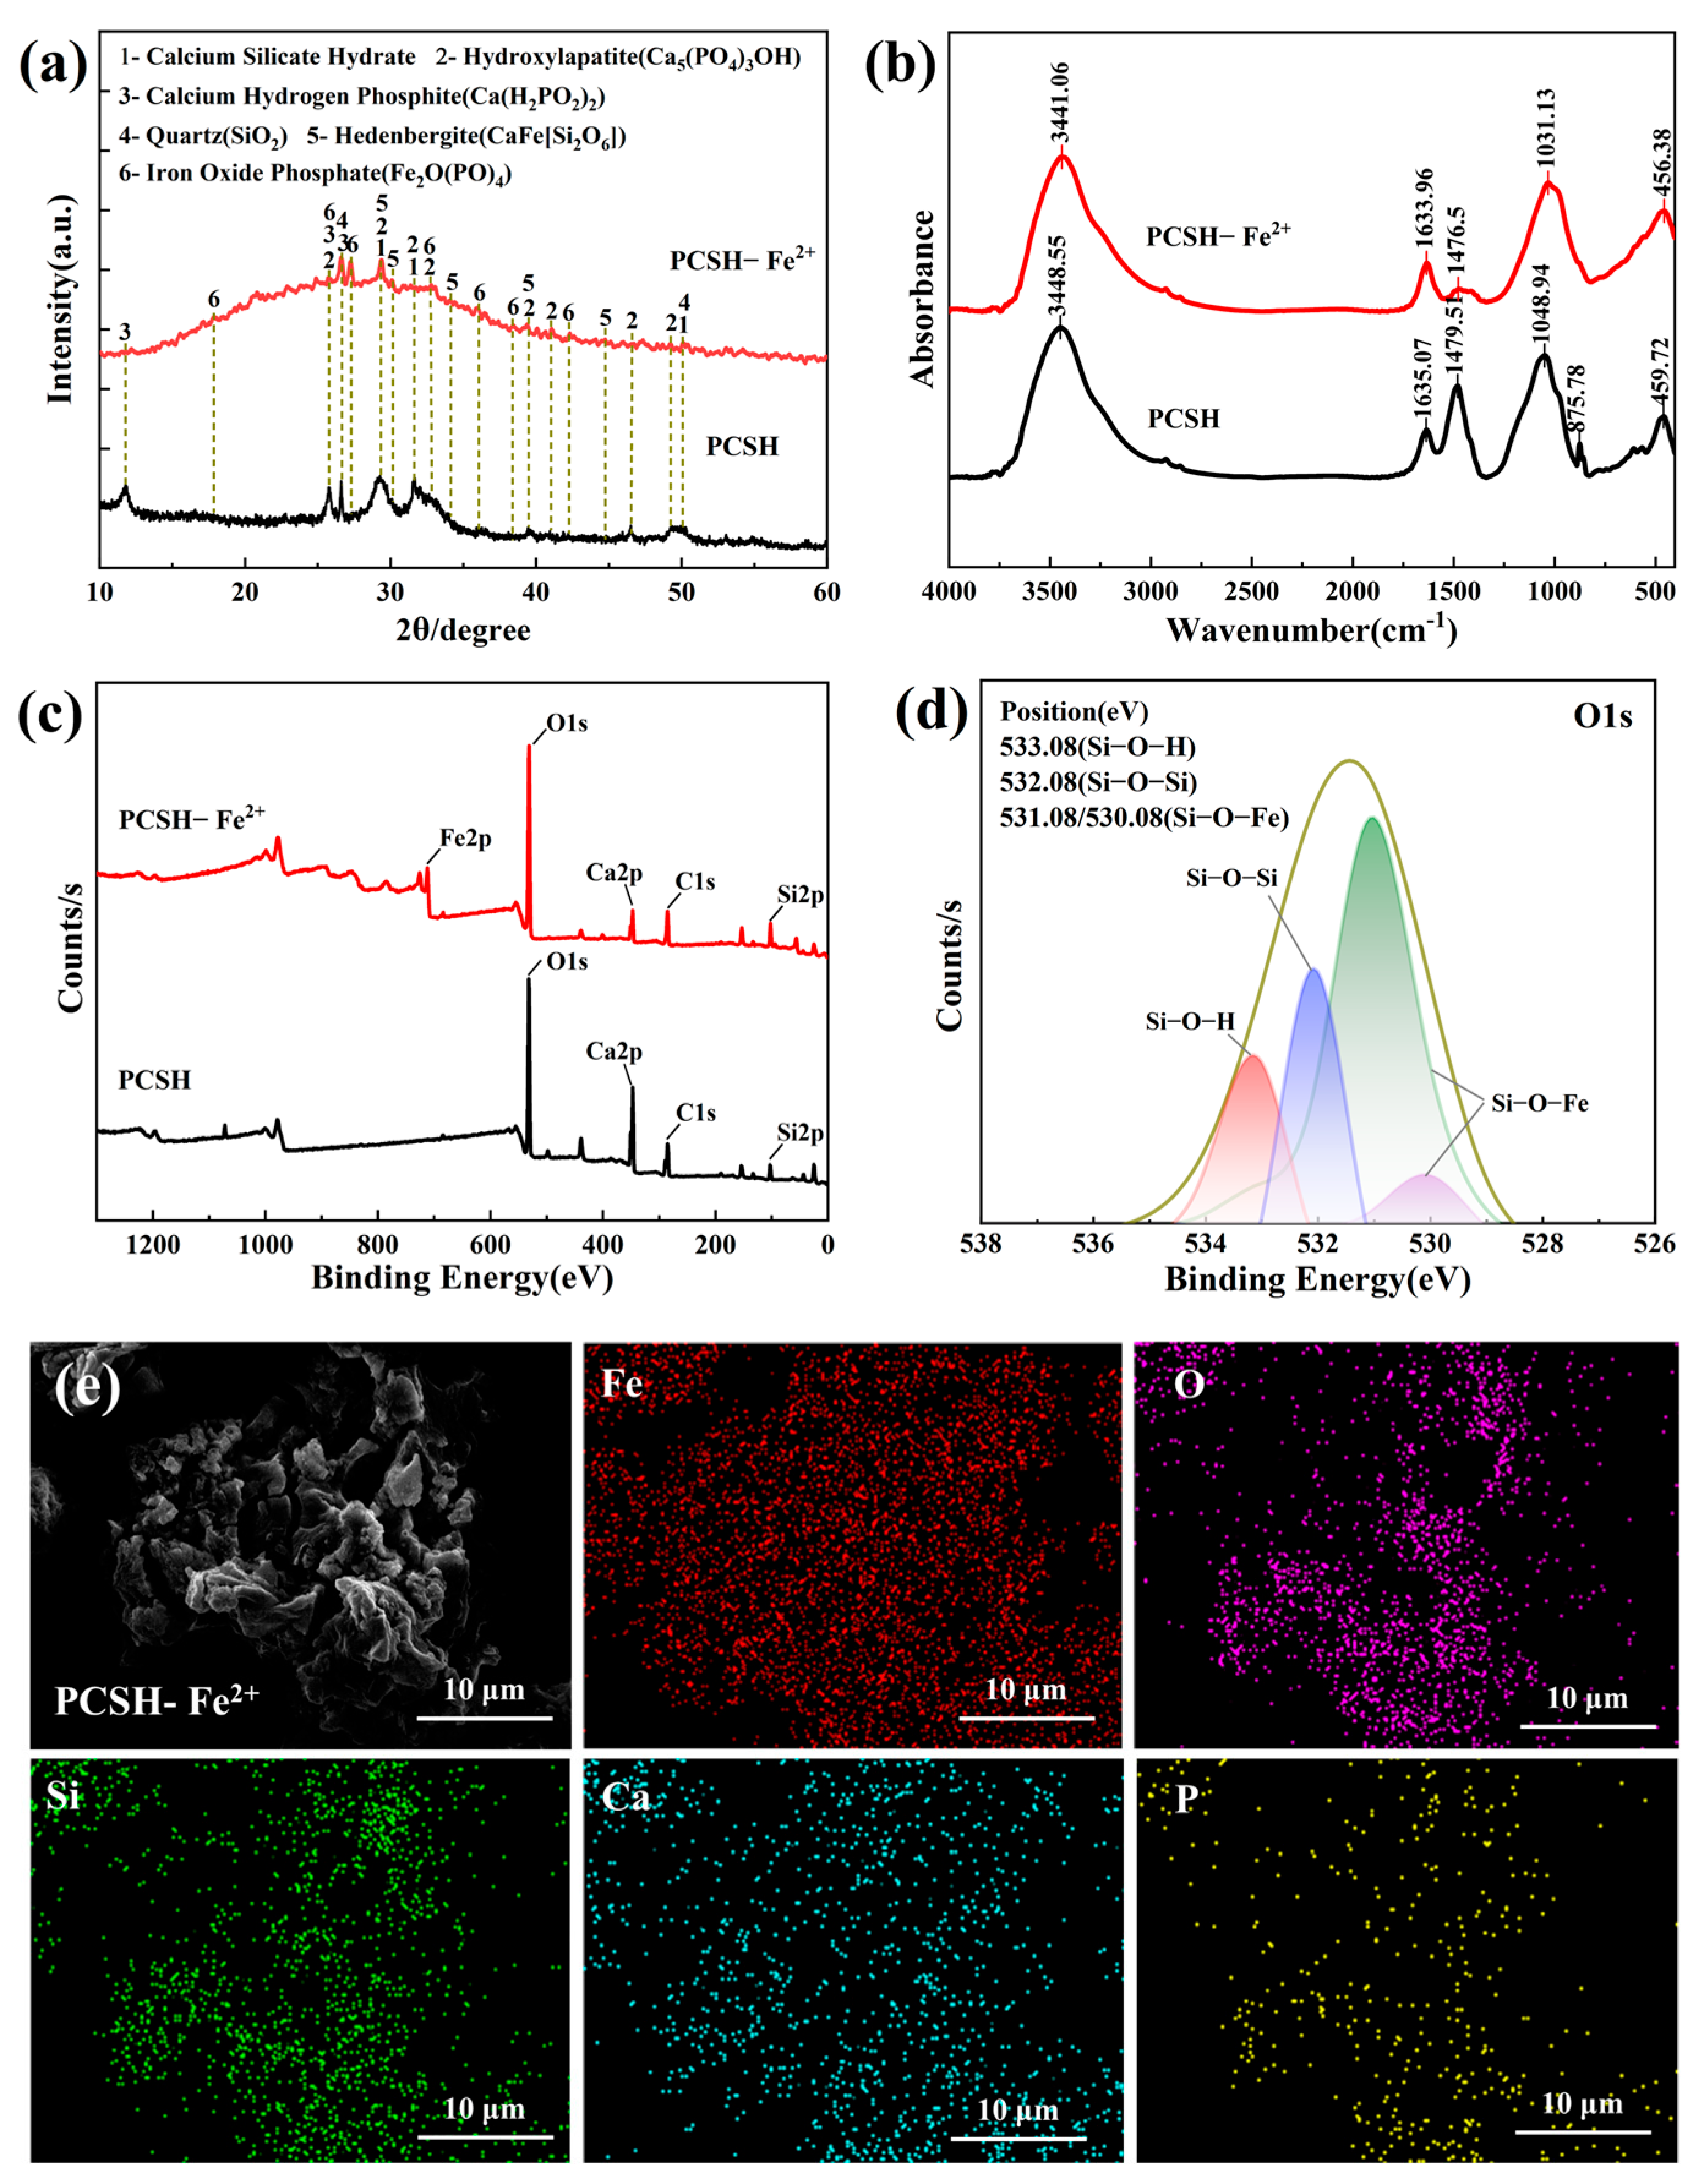
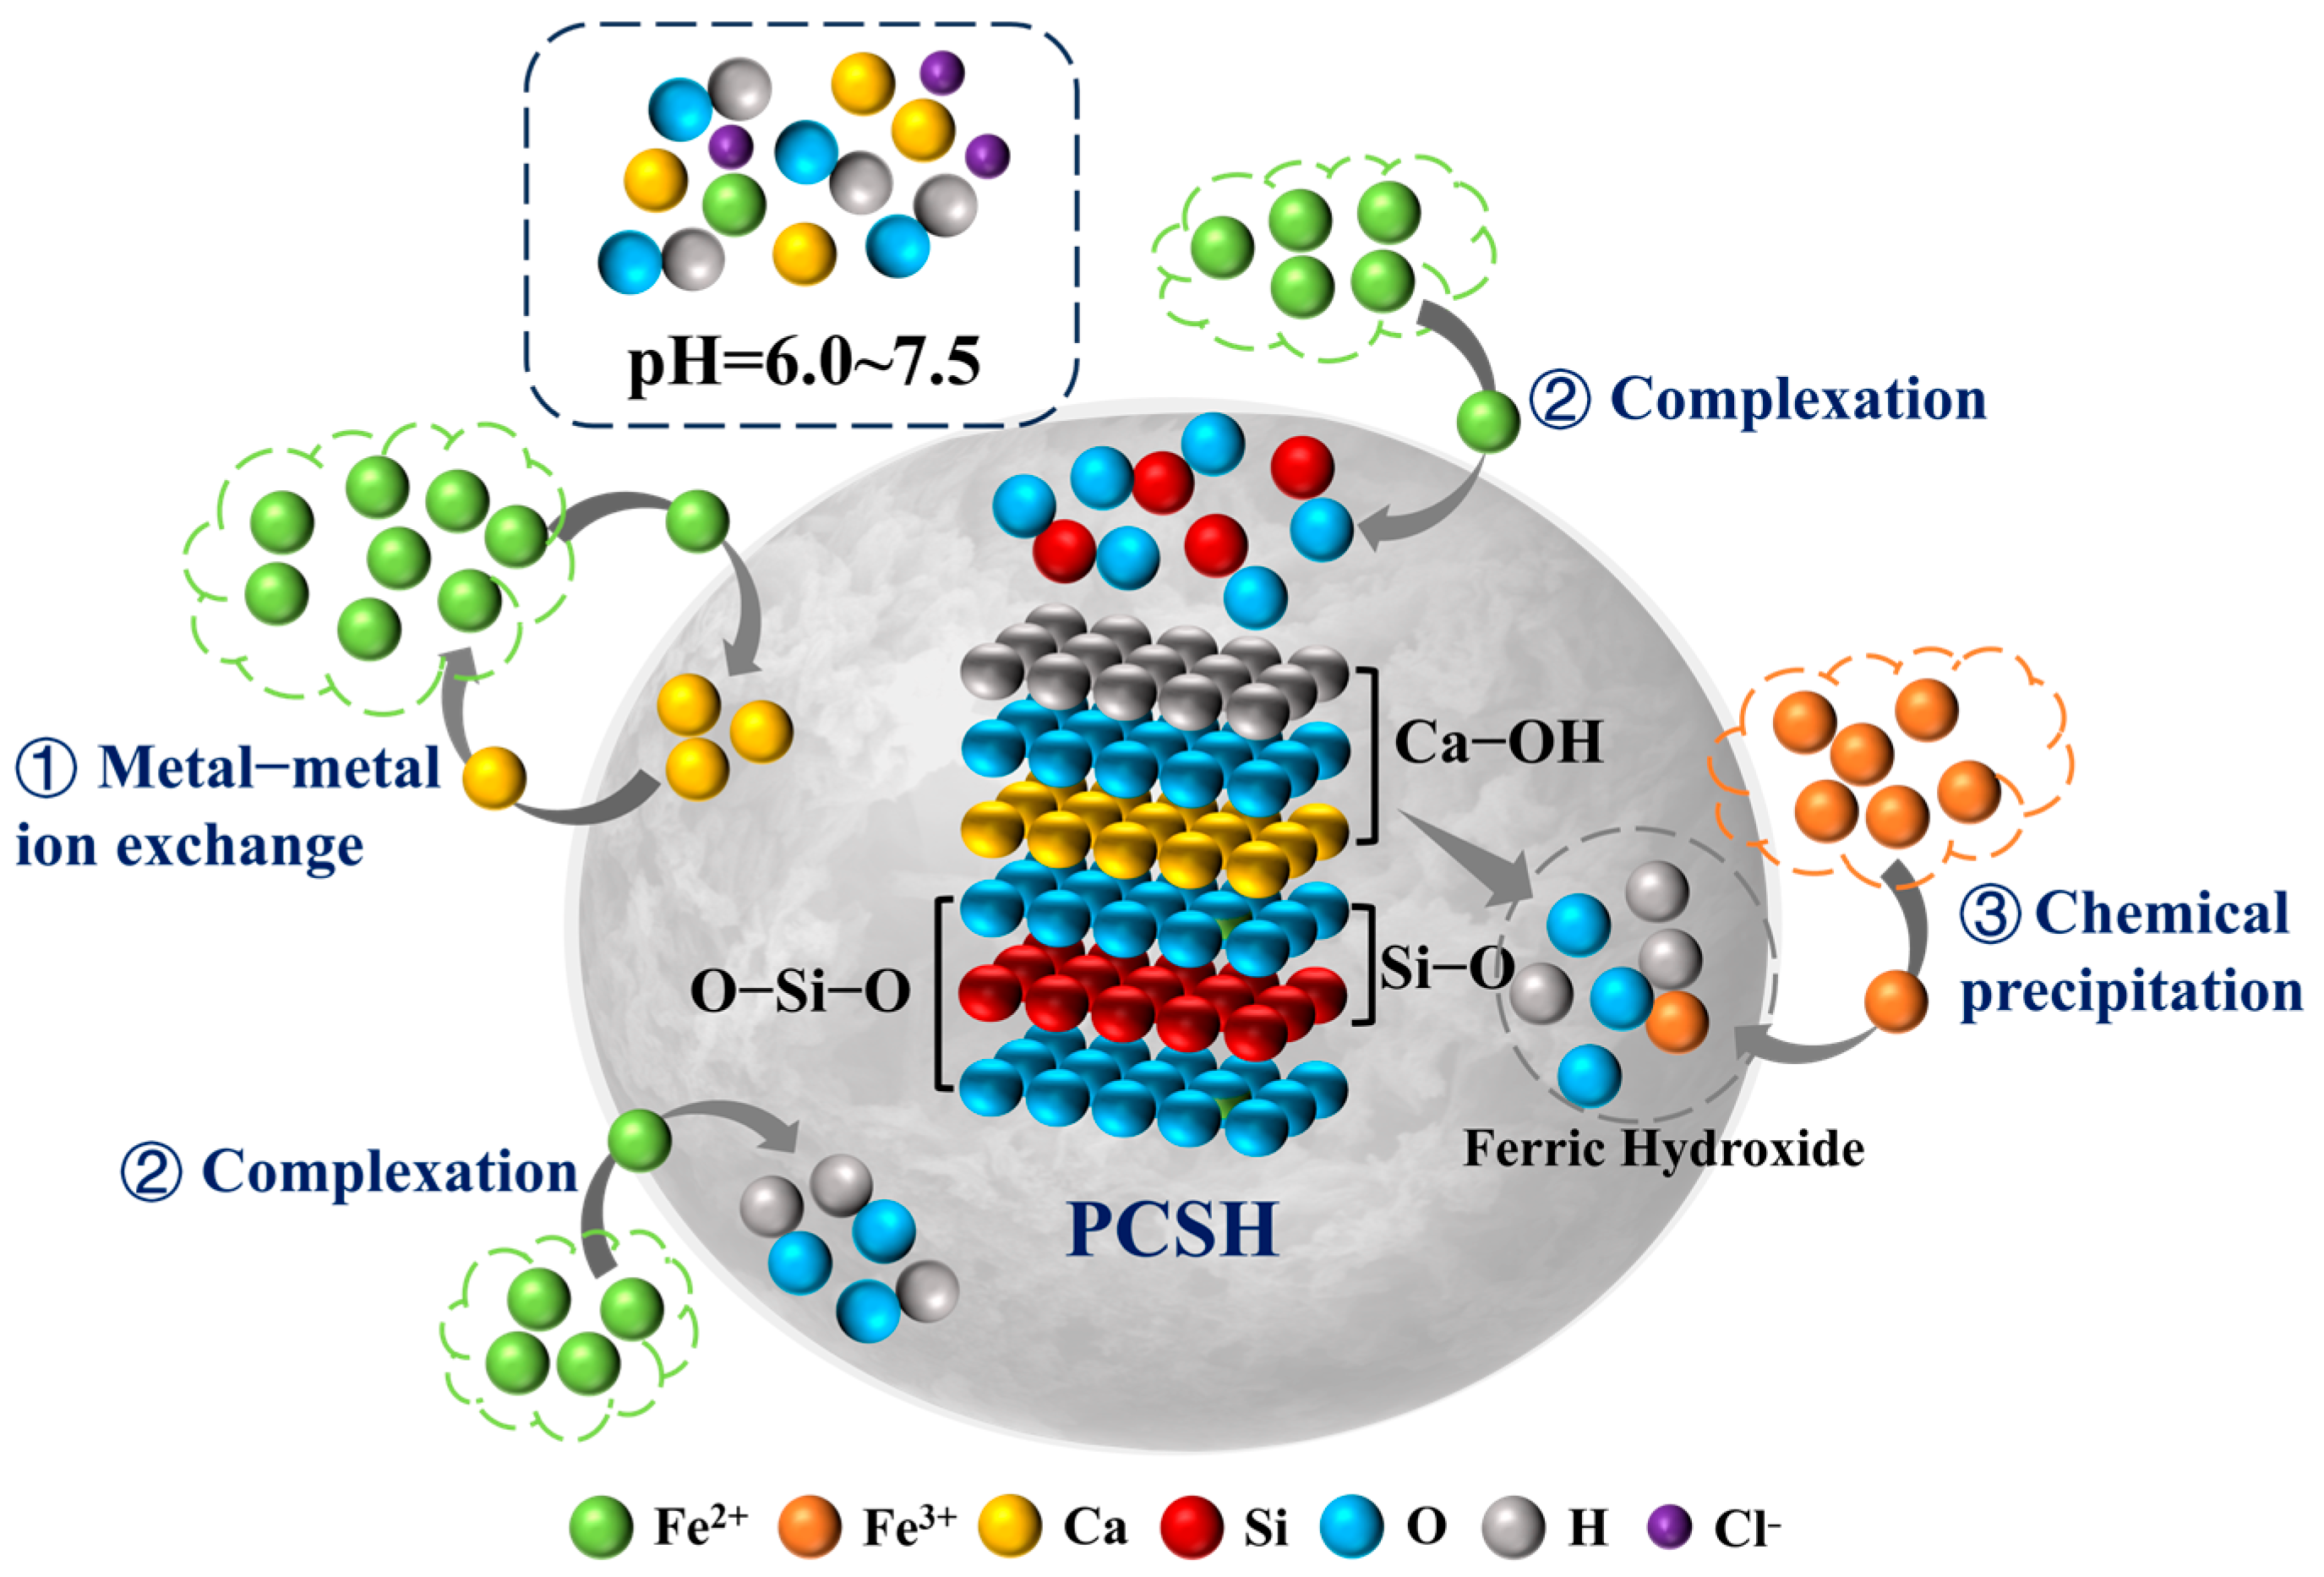
3.6. Adsorption Mechanism Analysis

Figure 11a shows the XRD patterns of PCSH before and after Fe2+ adsorption. The adsorption products mainly include hedenbergite, iron phosphate, PCSH, and quartz, indicating that, besides PCSH participating in the Fe2+ adsorption process, hydroxyapatite and calcium hydrogen phosphate also contribute to Fe2+ adsorption. Figure 11b presents the FTIR spectra of PCSH before and after Fe2+ adsorption. After Fe2+ adsorption, the absorption peaks corresponding to the characteristic peaks of CaO at 1450–1490 cm−1 significantly decrease [35], and the stretching vibration of the O-Si-O group at 875.78 cm−1 is almost undetectable [36]. This suggests that, during the adsorption process, there is ion exchange between Ca2+ and Fe2+, and there are complexation reactions between O-Si-O groups and Fe2+. The antisymmetric stretching vibration of the adsorbed water molecule -OH group at 3448.55 cm−1 and the antisymmetric stretching vibration of the Si-O group at 1048.94 cm−1 show a significant shift [37,38], possibly due to the complexation reactions between Fe2+ and -OH groups and Si-O groups. Figure 11c,d are the XPS full spectrum and fine spectrum of PCSH before and after Fe2+ adsorption, respectively. PCSH mainly contains elements like Ca, Si, and O, and the presence of C is due to contamination by CO2 during sample drying. In the XPS spectra, the energy peak of Ca2p significantly decreases after Fe2+ adsorption, and an Fe2p energy peak appears at a binding energy of 978.08 eV, indicating that ion exchange between Ca2+ and Fe2+ primarily occurs during the adsorption process, and this is consistent with the XRD and FTIR analyses. After adsorption, the O1s spectrum shows peaks at binding energies of 533.08 eV for Si-O-H groups, 532.08 eV for Si-O-Si groups, and 531.08 eV and 530.08 eV for Si-O-Fe groups, further verifying the complexation reactions between Si-O groups and -OH groups with Fe2+. Figure 11e shows the SEM images of PCSH after Fe2+ adsorption. It is evident that Fe2+ is significantly adsorbed onto the surface of PCSH. The morphology of the adsorption products still retains a certain surface area and porous structure, indicating a relatively stable structure.
Based on the above analysis, the mechanism of Fe2+ adsorption from simulated hydrochloric acid pickling wastewater by PCSH is proposed, as shown in Figure 12. PCSH itself contains abundant Ca-OH groups, releasing OH in solution: a part of Ca2+ undergoes ion exchange with Fe2+, and the released OH raises the pH of the solution. Due to the inevitable oxidation of Fe2+ to Fe3+ by traces of dissolved oxygen in the solution, the increase in pH promotes precipitation reactions between Fe3+ and OH to form Fe(OH)3. The porous structure of PCSH can provide more adsorption sites, facilitating the substantial removal of Fe2+. The adsorption mechanism is primarily characterized by chemisorption, involving not only ion exchange between metals, but also complexation reactions between Fe2+ with -OH groups, O-Si-O groups, and Si-O groups. After Fe2+ adsorption by PCSH, Fe2+ mainly exists in the adsorption product in the form of hedenbergite.

4. Conclusions

In this study, a multifunctional adsorbent PCSH was synthesized via hydrothermal synthesis using PG, and it was utilized to remove Fe2+ from simulated hydrochloric acid pickling wastewater from the steel industry. By controlling the main reaction parameters in the “synthesis–adsorption” process, the transformation of important components during synthesis and the efficient recovery of Fe2+ were achieved. The main conclusions are as follows:
The hydrothermal reaction at a sodium hydroxide concentration of 37.5 g/L, calcium/silicon ratio of 1.0, liquid/solid ratio of 15:1, reaction temperature of 110 °C, and reaction time of 4 h resulted in conversion rate of 87.41% for SO42− in PG. Under optimal synthesis conditions, the specific surface area of the product PCSH is 93.51 m2/g and an average pore diameter of 20.57 nm. At an initial Fe2+ concentration of 250 mg/L, an initial pH of 4, PCSH dosage of 0.8 g/L, and reaction time of 240 min, the maximum adsorption capacity of PCSH for Fe2+ was 309.54 mg/g, with a removal rate of 99.05%. The adsorption process for Fe2+ is mainly chemical adsorption, involving ion exchange between Fe2+ and Ca2+, as well as complexation reactions between Fe2+ and O-Si-O, Si-O, and -OH groups. The pH of the pickling wastewater significantly increased after adsorption, indicating that PCSH has an excellent OH releasing capability.

Supplementary Materials

The following supporting information can be downloaded at: https://www.mdpi.com/article/10.3390/su16177796/s1, Text S1: Method for determination of SO42− in solution; Table S1: The conditions parameters for the hydrothermal synthesis of PCSH.

Author Contributions

Conceptualization, methodology, software, validation, writing—original draft preparation, and data curation: P.L.; investigation, resources, and supervision: C.C.; visualization, project administration, and funding acquisition: J.L.; formal analysis: J.C. All authors have read and agreed to the published version of the manuscript.

Funding

This research was funded by the National Natural Science Foundation of China (grant numbers: 52274260, U23A20610, and 52074096) and the Guizhou Provincial Science and Technology Projects (GCC [2023]017).

Institutional Review Board Statement

Not applicable.

Informed Consent Statement

Informed consent was obtained from all subjects involved in the study.

Data Availability Statement

Date are contained within the article or Supplementary Material.

Conflicts of Interest

The authors declare no conflicts of interest.

References

  1. Yang, S.; Li, W.; Zhang, H.; Wen, Y.; Ni, Y. Treatment of paper mill wastewater using a composite inorganic coagulant prepared from steel mill waste pickling liquor. Sep. Purif. Technol. 2019, 209, 238–245. [Google Scholar] [CrossRef]
  2. Lv, Y.; Zong, L.; Liu, Z.; Du, J.; Wang, F.; Zhang, Y.; Liu, F. Sequential separation of Cu (II)/Ni (II)/Fe (II) from strong-acidic pickling wastewater with a two-stage process based on a bi-pyridine chelating resin. Chin. Chem. Lett. 2021, 32, 2792–2796. [Google Scholar] [CrossRef]
  3. Schiemann, M.; Wirtz, S.; Scherer, V.; Bärhold, F. Spray roasting of iron chloride FeCl2: Numerical modelling of industrial scale reactors. Powder Technol. 2013, 245, 70–79. [Google Scholar] [CrossRef]
  4. Wang, X.; Wang, D.; Xu, J.; Fu, J.; Zheng, G.; Zhou, L. Modified chemical mineralization-alkali neutralization technology: Mineralization behavior at high iron concentrations and its application in sulfur acid spent pickling solution. Water Res. 2022, 218, 118513. [Google Scholar] [CrossRef]
  5. Miranda-Alcantará, B.; Castañeda-Záldivar, F.; Ortíz-Frade, L.; Antaño, R.; Rivera, F.F. Electrochemical study of iron deposit in acid media for its recovery from spent pickling baths regeneration. J. Electroanal. Chem. 2021, 901, 115805. [Google Scholar] [CrossRef]
  6. Ren, S.; Luo, Z.; Pan, Y.; Ling, C.; Yu, L.; Yin, K. Distinctive adsorption and desorption behaviors of temporal and post-treatment heavy metals by iron nanoparticles in the presence of microplastics. Sci. Total Environ. 2023, 878, 163141. [Google Scholar] [CrossRef]
  7. Fawzy, M.E.; Ahmed, H.M.; Alshammari, S.O.; El-Khateeb, M.A. Treatment of Heavy Metal Ions from Simulated Water using Adsorption Process via Modified Iron Magnetic Nanocomposite. Desalination Water Treat. 2024, 317, 100071. [Google Scholar]
  8. Kim, S.H.; Park, J.I.; Lee, S.; An, H.R.; Kim, H.; Son, B.; Lee, H.U. Enhancing adsorption efficiency for environmentally-friendly removal of As (V) and Pb (II) using a biochar-iron oxide composite. Appl. Surf. Sci. 2024, 667, 160348. [Google Scholar] [CrossRef]
  9. Liu, Y.; Jia, H.; Zhang, G.; Sun, Z.; Pan, Y.; Zheng, S. Synthesis and humidity control performances of natural opoka based porous calcium silicate hydrate. Adv. Powder Technol. 2019, 30, 2733–2741. [Google Scholar] [CrossRef]
  10. Valenzuela, F.; Quintana, G.; Briso, A.; Ide, V.; Basualto, C.; Gaete, J.; Montes, G. Cu(II), Cd(II), Pb(II) and As(V) adsorption from aqueous solutions using magnetic iron-modified calcium silicate hydrate: Adsorption kinetic analysis. J. Water Process Eng. 2021, 40, 101951. [Google Scholar] [CrossRef]
  11. Shao, N.; Li, S.; Yan, F.; Su, Y.; Liu, F.; Zhang, Z. An all-in-one strategy for the adsorption of heavy metal ions and photodegradation of organic pollutants using steel slag-derived calcium silicate hydrate. J. Hazard. Mater. 2020, 382, 121120. [Google Scholar] [CrossRef] [PubMed]
  12. Guan, W.; Ji, F.; Chen, Q.; Yan, P.; Zhang, Q. Preparation and phosphorus recovery performance of porous calcium–silicate–hydrate. Ceram. Int. 2013, 39, 1385–1391. [Google Scholar] [CrossRef]
  13. Qi, G.; Lei, X.; Li, L.; Yuan, C.; Sun, Y.; Chen, J.; Hao, J. Preparation and evaluation of a mesoporous calcium-silicate material (MCSM) from coal fly ash for removal of Co (II) from wastewater. Chem. Eng. J. 2015, 279, 777–787. [Google Scholar] [CrossRef]
  14. Ma, J.; Qin, G.; Zhang, Y.; Sun, J.; Wang, S.; Jiang, L. Heavy metal removal from aqueous solutions by calcium silicate powder from waste coal fly-ash. J. Clean. Prod. 2018, 182, 776–782. [Google Scholar] [CrossRef]
  15. Bilal, E.; Bellefqih, H.; Bourgier, V.; Mazouz, H.; Dumitraş, D.G.; Bard, F.; Haneklaus, N. Phosphogypsum circular economy considerations: A critical review from more than 65 storage sites worldwide. J. Clean. Prod. 2023, 414, 137561. [Google Scholar] [CrossRef]
  16. Liu, Y.; Wang, Y.; Chen, Q. Using cemented paste backfill to tackle the phosphogypsum stockpile in China: A down-to-earth technology with new vitalities in pollutant retention and CO2 abatement. Int. J. Miner. Metall. Mater. 2024, 31, 1480–1499. [Google Scholar] [CrossRef]
  17. Huang, Y.; Qian, J.; Lu, L.; Zhang, W.; Wang, S.; Wang, W.; Cheng, X. Phosphogypsum as a component of calcium sulfoaluminate cement: Hazardous elements immobilization, radioactivity and performances. J. Clean. Prod. 2020, 248, 119287. [Google Scholar] [CrossRef]
  18. Zhang, J.; Cui, K.; Chang, J.; Wang, L. Phosphogypsum-based building materials: Resource utilization, development, and limitation. J. Build. Eng. 2024, 91, 109734. [Google Scholar] [CrossRef]
  19. Sheng, Z.; Zhou, J.; Shu, Z.; Yakubu, Y.; Chen, Y.; Wang, W.; Wang, Y. Calcium sulfate whisker reinforced non-fired ceramic tiles prepared from phosphogypsum. Boletín Soc. Española Cerámica Vidr. 2018, 57, 73–78. [Google Scholar] [CrossRef]
  20. Lachehab, A.; Mertah, O.; Kherbeche, A.; Hassoune, H. Utilization of phosphogypsum in CO2 mineral sequestration by producing potassium sulphate and calcium carbonate. Mater. Sci. Energy Technol. 2020, 3, 611–625. [Google Scholar] [CrossRef]
  21. Ennaciri, Y.; Bettach, M.; El Alaoui-Belghiti, H. Obtaining nano calcium fluoride and ammonium sulfate from phosphogypsum. Phosphorus Sulfur Silicon Relat. Elem. 2024, 199, 178–186. [Google Scholar] [CrossRef]
  22. Wang, G.; Chen, C.; Li, J.; Lan, Y.; Lin, X.; Chen, J. Conversion of Phosphogypsum into Porous Calcium Silicate Hydrate for the Removal and Recycling of Pb(II) and Cd(II) from Wastewater. Molecules 2024, 29, 2665. [Google Scholar] [CrossRef]
  23. HJ/T 342-2007; Water Quality-Determination of Sulfate-Barium Chromate Spectrophotometry. China Environmental Science Press: Beijing, China, 2007.
  24. HJ/T 345-2007; Water Quality-Determination of Iron-Phenanthroline Spectrophotometry. State Environmental Protection Administration: Beijing, China, 2007.
  25. Peng, S.Y.; Lin, Y.W.; Lin, Y.Y.; Lin, K.L. Hydrothermal synthesis of hydroxyapatite nanocrystals from calcium-rich limestone sludge waste: Preparation, characterization, and application for Pb2+ adsorption in aqueous solution. Inorg. Chem. Commun. 2023, 160, 111943. [Google Scholar] [CrossRef]
  26. Zhao, Z.; Dong, Z.; Wang, F.; Wang, F.; Xia, M. Innovative strategy of turning waste into treasure: High-efficiency adsorption of heavy metals pollutants by modified amorphous calcium phosphate prepared with phosphogypsum waste. J. Environ. Chem. Eng. 2024, 12, 112994. [Google Scholar] [CrossRef]
  27. He, S.; Sun, H.; Tan, D.G.; Peng, T. Recovery of titanium compounds from Ti-enriched product of alkali melting Ti-bearing blast furnace slag by dilute sulfuric acid leaching. Procedia Environ. Sci. 2016, 31, 977–984. [Google Scholar] [CrossRef]
  28. Baigenzhenov, O.S.; Chepushtanova, T.A.; Altmyshbayeva, A.Z.; Temirgali, I.A.; Maldybayev, G.; Sharipov, R.H.; Dagubayeva, A.T. Investigation of thermodynamic and kinetic regularities of asbestos waste leaching processes. Results Eng. 2024, 21, 102000. [Google Scholar] [CrossRef]
  29. Cui, K.; Han, X.; Zhou, P.; Hao, M.; Wang, X.; Bian, L.; Liu, X. A novel highly dispersed calcium silicate hydrate nanosheets for efficient high-concentration Cu2+ adsorption. J. Hazard. Mater. 2024, 475, 134774. [Google Scholar] [CrossRef]
  30. Du, C.; Zuo, R.; Chen, M.; Wang, J.; Liu, X.; Liu, L.; Lin, Y. Influence of colloidal Fe(OH)3 on the adsorption characteristics of strontium in porous media from a candidate high-level radioactive waste geological disposal site. Environ. Pollut. 2020, 260, 113997. [Google Scholar] [CrossRef]
  31. Yang, K.; White, C.E. Modeling of aqueous species interaction energies prior to nucleation in cement-based gel systems. Cem. Concr. Res. 2021, 139, 106266. [Google Scholar] [CrossRef]
  32. Tang, S.; Lin, L.; Wang, X.; Feng, A.; Yu, A. Pb(II) uptake onto nylon microplastics: Interaction mechanism and adsorption performance. J. Hazard. Mater. 2020, 386, 121960. [Google Scholar] [CrossRef]
  33. Taher, T.; Munandar, A.; Mawaddah, N.; Wisnubroto, M.S.; Siregar, P.M.S.B.N.; Palapa, N.R.; Lesbani, A.; Wibowo, Y.G. Synthesis and characterization of montmorillonite—Mixed metal oxide composite and its adsorption performance for anionic and cationic dyes removal. Inorg. Chem. Commun. 2023, 147, 110231. [Google Scholar] [CrossRef]
  34. Tseng, R.L.; Tran, H.N.; Juang, R.S. Revisiting temperature effect on the kinetics of liquid-phase adsorption by the Elovich equation: A simple tool for checking data reliability. J. Taiwan Inst. Chem. Eng. 2022, 136, 104403. [Google Scholar]
  35. Yang, X.; Zhao, F. Adsorption thermodynamics and kinetics of hydrochloric-acid-modified bentonite for Zn (II) in wastewater. Desalination Water Treat. 2024, 317, 100279. [Google Scholar]
  36. Fang, D.; Huang, L.; Fang, Z.; Zhang, Q.; Shen, Q.; Li, Y.; Ji, F. Evaluation of porous calcium silicate hydrate derived from carbide slag for removing phosphate from wastewater. Chem. Eng. J. 2018, 354, 1–11. [Google Scholar]
  37. Guan, W.; Zhao, X. Fluoride recovery using porous calcium silicate hydrates via spontaneous Ca2+ and OH release. Sep. Purif. Technol. 2016, 165, 71–77. [Google Scholar]
  38. Shen, X.; Feng, P.; Zhang, Q.; Lu, J.; Liu, X.; Ma, Y.; Hong, J. Toward the formation mechanism of synthetic calcium silicate hydrate (CSH)-pH and kinetic considerations. Cem. Concr. Res. 2023, 172, 107248. [Google Scholar]
Figure 1. Characterization of PG: (a) XRD and (b,c) SEM-EDS.
Sustainability 16 07796 g001
Figure 2. Preparation of PCSH by hydrothermal method.
Sustainability 16 07796 g002
Figure 3. The relationship of (a,b) △rG and (c,d) △rH with temperature.
Sustainability 16 07796 g003
Figure 4. Distribution coefficients of (a,b) Si and (c,d) Ca as a function of pH at 25 °C and 110 °C.
Sustainability 16 07796 g004
Figure 5. SO42− conversion rate in PG for different condition parameters: (a) NaOH concentration; (b) calcium/silicon ratio; (c) liquid/solid ratio; (d) temperature; and (e) time.
Sustainability 16 07796 g005
Figure 6. XRD patterns of the products for different condition parameters: (a) NaOH concentration; (b) calcium/silicon ratio; (c) liquid/solid ratio; (d) temperature; and (e) time.
Sustainability 16 07796 g006
Figure 7. SEM images of different condition parameters of PCSH: (ac) NaOH concentration; (df) calcium/silicon ratio; (gi) liquid/solid ratio; (jl) temperature; and (mo) time.
Sustainability 16 07796 g007
Figure 8. (a) N2 adsorption–desorption curves and pore size distribution and (b,c) SEM-EDS mapping of PCSH.
Sustainability 16 07796 g008
Figure 9. (a) Effects of different initial concentrations on Fe2+ adsorption capacity; effects of different initial pHs and adsorbent amounts on (b) Fe2+ removal and (c) solution equilibrium pH; and (d) effects of different Fe3+ contents on adsorption of Fe2+ by PCSH.
Sustainability 16 07796 g009
Figure 10. (a) The relationship between Qt of PCSH for Fe2+ and the time of adsorption; (b) pseudo-first-order kinetics; (c) pseudo-second-order kinetics; and (d) Elovich kinetics.
Sustainability 16 07796 g010
Figure 11. (a) XRD patterns, (b) FTIR spectra, and (c,d) XPS full spectrum and fine spectrum of PCSH before and after Fe2+ adsorption; and (e) SEM image of PCSH after Fe2+ adsorption.
Sustainability 16 07796 g011
Figure 12. Adsorption mechanism diagram.
Sustainability 16 07796 g012
Table 1. Main chemical composition of PG (wt%).
CompositionSO3CaOP2O5SiO2Fe2O3Al2O3Na2OK2OF
Content51.5839.615.112.250.610.380.160.150.17
Table 2. Pore structure parameters of PCSH.
MaterialSpecific Surface Area (m2/g)Average Pore Size (nm)Pore Volume (cm3/g)
PCSH93.506620.56580.4819
Table 3. PCSH adsorption kinetics parameters for Fe2+.
ModelConcentration
(mg/L)
R2Qe
(mg/g)
K1
(min−1)
K2ab
Pseudo-
first-order
2000.9198233.710.0643
2500.8844293.110.0953
3000.8386328.450.1193
Pseudo-
second-order
2000.9819256.770.00035
2500.9840314.840.00048
3000.9769349.690.00058
Elovich2000.976783.340.0235
2500.9569411.020.0237
3000.94261391.660.0248
Disclaimer/Publisher’s Note: The statements, opinions and data contained in all publications are solely those of the individual author(s) and contributor(s) and not of MDPI and/or the editor(s). MDPI and/or the editor(s) disclaim responsibility for any injury to people or property resulting from any ideas, methods, instructions or products referred to in the content.

