Article

Study on Non-Point Source Pollution Prevention and Control System in Nansi Lake Basin Based on System Dynamics Approach

1
College of Geography and Environment, Shangdong Normal University, Jinan 250358, China
2
Shangdong Provincial Territorial Spatial Ecological Restoration Center, Jinan 250010, China
*
Authors to whom correspondence should be addressed.
Sustainability 2024, 16(17), 7831; https://doi.org/10.3390/su16177831
Submission received: 13 July 2024 / Revised: 20 August 2024 / Accepted: 5 September 2024 / Published: 8 September 2024

Abstract

:
Agriculture, as an important activity on which human beings depend for their livelihood, brings serious environmental problems while meeting the needs of human survival, among which agricultural non-point source (NPS) pollution is one of the most urgent environmental problems. This study quantitatively assessed the loading characteristics spatial and temporal evolution patterns of two agricultural NPS pollutants, chemical oxygen demand (COD) and ammonia nitrogen (NH3-N), from 2010 to 2020 in the Nansi Lake Basin as an example, and constructed a system dynamics (SD) simulation model to simulate and analyze agricultural NPS pollution under different development and treatment scenarios, based on an investigation of the regional prevention and control strategy of agricultural NPS pollution and the technological system. The results show that the current status of agricultural NPS pollution load in the Nansi Lake Basin is poor, and the level of pollution load is high, showing obvious geographical differences. In terms of temporal changes, the pollution loads of the two pollutants showed a decreasing trend from 2010 to 2020, among which the pollution load of NH3-N showed the largest change. Spatially, the spatial distribution of each type of pollutant has some similarities, with smaller pollution loads in Jining and Zaozhuang and relatively larger pollution loads in Heze and Ningyang. The main source of COD pollution in the Nansi Lake Basin is rural life, with an emission proportion of 52.85%, and the main sources of NH3-N pollution from agricultural NPS pollution in the area are rural life and livestock and poultry farming, with emission proportions of 47.55% and 35.36%, respectively. Under the status quo continuum scenario, the pollution load values for COD are consistently higher than those for NH3-N, so the relative impact of COD is greater. In this study, the principles and methods of SD in system science are adopted to deal with the agricultural NPS pollution of Nansi Lake Basin, and the evolution of its behavioral characteristics are simulated, forecasted, and predicted, and policy experiments are conducted, with a view to providing references for the prevention and control of agricultural NPS pollution in Nansi Lake Basin and further research.

1. Introduction

The water crisis is one of the most serious problems facing China in the 21st century. This water crisis is manifested not only in the lack of water quantity but also in the deterioration of water quality [1,2,3]. In recent years, as point source pollution has been effectively controlled, non-point source pollution (NPS, also known as surface source pollution) has become the main source of surface and groundwater pollution worldwide. Currently, 30–50% of the Earth’s surface worldwide has been affected by NPS pollution [4,5,6]. In the United States, around 60% of water pollution is attributed to NPS pollution [7]. In northern Australia, nitrogen pollution entering reservoirs is a significant contributor to NPS pollution [8]. In Sweden, nitrogen from NPS pollution accounted for 60–87% of the total import to the basin [9], and in Denmark, out of the monitoring data from 270 rivers [10], 94% of nitrogen loads and 52% of phosphorus loads originated from NPS pollution [11]. A similar effect is observed in the Netherlands, where NPS pollution is responsible for 60% of nitrogen pollutants and 40–50% of total phosphorus pollutants [12]. In China, with effective control of point source pollution, NPS pollution has emerged as a significant threat to regional water quality [13]. Nowadays, more than 60% of lakes in China have some degree of eutrophication, and 50% of them are caused by NPS pollution [14]. As a result, NPS pollution has attracted increasing attention worldwide [15,16,17]. Therefore, the identification of NPS pollution, especially the changing trends, and the determination of the influencing factors are fundamental scientific issues that are scientifically important for solving the deteriorating water environment in China [18].
NPS pollution is characterized by its randomness, universality, and unpredictability [19], which determines the complexity and variety of factors affecting NPS pollution. Thus, the study of the impact of NPS pollution also involves many aspects, such as the generation, migration, and transformation mechanism of NPS pollution [5,20,21,22]. Currently, the main methods used by experts to study NPS pollution include the mathematical modeling method, average concentration method, water quality and quantity correlation method, comprehensive survey method, unit survey method, inventory method [23], etc. The most representative method is the Soil Conservation Service (SCS), which was proposed by the United States Soil and Water Conservation Service in the 1950s. This method takes into account the influence of the nature of subsurface layers (soil, vegetation, human activities, etc.) on streams and is therefore widely used in NPS pollution analyses [24]. The theories of full storage flow production, hyper seepage flow production, and integrated flow production proposed by Chinese scholars have also been used to calculate regional agricultural NPS pollution [19,25]. The diversity of factors influencing NPS pollution determines that there are also many research methods, but the current research lacks quantitative analyses of NPS pollution load calculations and future trends [18].
Accurate calculation of NPS pollution loads is essential to protect water quality [22,26,27,28]. Various empirical methods and mechanistic-based models have been introduced to calculate NPS pollution across different scales, from small to large basins [29,30]. For example, Sarkar et al. [31] and others discussed the impact of NPS pollution in conjunction with the Soil and Water Assessment Tool (SWAT) hydrological module of the dispersive parameter NPS model, and Liu et al. [32] and others investigated the impact of land-use change on NPS pollution in the upper Yangtze River using the export coefficient model (ECM). The ECM [33] has been widely used in NPS pollution simulation. In order to better predict the spatial and temporal changes of NPS pollutants under environmental changes, this paper defines a new and improved ECM by using the mechanism model information of a relatively small basin, introducing the land use type, rainfall factor, and topographic factor to characterize the spatial variability of rainfall, and expressing the combined effect of export intensity on rainfall-runoff process and pollutant transport loss through pollutant production coefficients [34]. In contrast, assessing NPS pollution often involves extensive interactions among various planning elements [35], making the system’s structure, behavior, and sustainability highly complex. We can model such complex systems by integrating simple causal/feedback loops based on these interactions. System dynamics (SD) provides a platform for this integration and simulation [36], accommodating the complexity, nonlinearity, and feedback loops inherent in social and physical systems. In SD models, the system structure can be visually depicted using specialized software like Vensim PLE Plus, allowing the observation of key causal/feedback loops in the simulation. Increasingly, studies are applying SD models to urban development, land use management, and integrated sustainable management systems [37,38].
Nansi Lake is the largest freshwater lake in North China. It is also an important regulation lake and hub for South-to-North water transfer, and its water quality determines the success or failure of the entire eastern route of the water transfer project [39]. Nansi Lake is a moderately eutrophic lake, and its eutrophication phenomenon is mainly attributed to the excess of nitrogen and phosphorus elements, the accumulation of suspended matter, and the increase of other organic matter [2]. At present, the main water pollution in Nansi Lake is NPS pollution, with a total loading rate of 60–80% [40], of which the contribution rate of nitrogen and COD is more than 70%, and the intensity of chemical oxygen demand (COD) discharge is the largest. NPS pollution sources are complex, and the investigation and analysis of their own quantitative changes and influencing factors are of great significance. The objectives of this study are (1) to calculate the ammonia nitrogen (NH3-N) and COD NPS pollution loads in Nansi Lake from 2010 to 2020; (2) to quantify the spatial and temporal characteristics of the NH3-N and COD NPS pollution in Nansi Lake from 2010 to 2020; and (3) to construct a SD simulation model for simulating and analyzing the agricultural NPS pollution in different development and treatment scenarios. This study can not only provide a scientific basis for water pollution control in Nansi Lake but also draw the attention of policymakers and researchers to the causes of its water quality deterioration, particularly the aggravation of NPS pollution.

2. Materials and Methods

2.1. Study Area

Located in Shandong Province, Nansi Lake is one of the ten largest freshwater lakes in China and the largest shallow freshwater lake in northern China. The Nansi Lake Basin in this study refers to the catchment basin in Shandong Province, including Jining City, Heze City, Zaozhuang City, and Ningyang County, Tai’an City, with a total area of about 29,000 km2 (Figure 1). The study area has a temperate monsoon climate, with a multi-year average land temperature of 13.30–15 °C and an average annual rainfall between 590 and 820 mm. The total amount of water resources is 55.9 × 10⁸ m3, including 22.50 × 10⁸ m3 of surface water resources. The main land use types are arable land and construction land, accounting for 67.70% and 16.7% of the basin area, respectively. It includes 27 districts (cities and counties), with a total population of about 22.21 million as of 2020, according to statistics [41], of which the agricultural population accounts for 76.03% of the total population (Table 1). The Nansi Lake Basin is an important source of drinking water for the surrounding area, and the deterioration of water quality due to NPS pollution greatly restricts the health of the population and social development.

2.2. Datasets

The data required in this study consisted mainly of geospatial data and socio-economic statistics. The export coefficients for land use types are the basis for constructing the ECM. The land use data for 2010, 2015, and 2020 used in this study were obtained from the Resource and Environment Science Data Centre of the Chinese Academy of Sciences (www.resdc.cn), which is a dataset whose land use types were included in six level 1 classes (cropland, forest, grassland, water, construction, and unused land) at 30 m resolution. Socio-economic statistics are derived from the statistical yearbooks of the municipalities and mainly include data on rural populations and livestock farming, whose livestock farming data includes large livestock (cattle), poultry, pigs, and sheep.

2.3. Methods

2.3.1. Export Coefficient Model

Although physical models can provide accurate results, the values of a large number of parameters cannot be obtained from field data and must be determined by model calibration. In contrast, empirical models have the advantage of requiring less data and parameters. The export coefficient model (ECM) has been recognized as a reliable method for modeling NPS pollution [42]. The main methodological principle of the ECM, a model developed by Johnes et al. [33] in 1996, is the assumption that nutrient loads exported from a watershed are equal to the sum of pollutant losses from individual sources. Sources of pollution include land use types, livestock farming, and rural livelihoods. The ECM is calculated using the formula below:
L = i = 1 n [ E i A i ( I i ) ] + P
where L is the total nutrient loss, i is the number of land use types, livestock farming or rural population, E i is the export coefficient of nutrient sources, A i is area of the catchment occupied by land use type i (km2), I i is the nutrient inputs, and P is the nutrient inputs from precipitation, which can be calculated according to the following equation:
P = κ i × Q × α
where k i is the nutrient concentration of class i (g/L), Q is the rainfall volume (m3), and α is the runoff coefficient.
Typically, pollutants from all types of sources in each watershed will be collected through surface runoff and then enter a river or lake where surface runoff occurs. Although the ECM model improves the relationship between NPS pollution sources and the amount of pollution produced, it does not account for rainfall-runoff, surface soils, vegetation, and the effects of different land types on nutrient production. Consequently, the ECM model’s calculation process fails to reflect soil uptake, vegetation retention, groundwater infiltration, and other biochemical reactions, adsorption, and degradation. Additionally, the actual formation of agricultural NPS pollution is complex due to the stochasticity and heterogeneity of intensity. In this study, pollutant generation coefficients ( λ ) are used to represent the combined effect of export intensity on rainfall-runoff processes and pollutant transport losses. The improved ECM (IECM) is expressed as:
L = k = 1 m L k λ k
where L is the total loss of a given pollutant from the basin, L k is the loss of nutrients (kg) from basin k, λ k is the pollutant production factor for nutrients in basin k , and m is the number of counties.
The pollutant generation factor ( λ ) is defined by the rate of loss of adsorbed NPS pollutants. Previous studies [43,44] revealed the nitrogen and phosphorus loss rates of various land use types under different precipitation conditions. The determination process is as follows: firstly, the export coefficient of land use types is defined as E i with n land use types in the study area. Then, m sub-counties ( m > n ) were selected from the entire study area, and the equation for NPS pollution in each county was determined as follows:
L = P S + λ L 0 + λ i = 1 n [ E i × A i ( I i ) ] + λ P
where L represents the loss of nutrient sources, P S denotes the point source pollution load, L 0 signifies the annual NPS pollution load from rural domestic waste and livestock, E i is the export coefficient of land use type i , A i is the area of land use type i , and I i is the annual import load of NPS pollutants for land use type i .
L 0 = j = 1 n [ E j × A j ( I j ) ]
where E j represents the export coefficient for people or livestock, A j denotes the number of livestock, and I j indicates the imported nutrient load from people or livestock.

2.3.2. The Export Coefficients for Different Land Use Types

Constructing export coefficients for various land use types and other sources of agricultural NPS pollution is a key parameter for assessing agricultural NPS pollution loads, and its value is generally expressed by the load per unit area and time. Determining the appropriate export coefficients according to the conditions of different basins is the difficulty and key point of this study, and its value is related to the topography, climatic conditions, people production, living conditions, etc. It may not be possible to formulate the value of export coefficients with a uniform standard. In this study, the sources of agricultural NPS pollution in the Nansi Lake Basin are divided into three categories: land use, livestock and poultry breeding, and rural life. The values of export coefficients for different land use types are usually obtained by field monitoring and by referring to the related research literature, which has different focuses. On the one hand, the export coefficients obtained from field tests may be more suitable for the specific conditions of the local study area, but they are more time-consuming and subjective. On the other hand, the literature reference method is more efficient and has a strong scientific basis when it has been used by other scholars. By combing the research results of this basin and similar basins, the values of export coefficients taken by different basins and scholars were referenced, as shown in Table 2. By investigating the range of values of export coefficients for each land use type in the Nansi Lake Basin and other study areas, we took the average value of the export coefficients as the export coefficients of this study by screening and referring to the values taken by studies in similar basins.
The topography of the Nansi Lake Basin is dominated by plains, with favorable natural conditions for agriculture and good conditions for livestock and poultry farming. At the beginning of the twentieth century, livestock and poultry farming developed rapidly in the cities of the Nansi Lake Basin, and from 2010 to 2020, the farming situation in each city showed a different pattern. Influenced by urbanization and economic and social conditions, the export of livestock and poultry farming in Jining and Zaozhuang within the Nansi Lake basin has declined significantly, but the scale of livestock and poultry farming in Heze and Tai’an still shows a trend of development, and the export has continued to increase, so the NPS pollution caused by livestock and poultry farming in the Nansi Lake basin still cannot be ignored. Unlike the value of export coefficients for land use types, the value of export coefficients for livestock and poultry farming and rural life is highly universal. Therefore, this study comprehensively adopts the methods of reviewing the literature, field measurements, and reference to pollutant emission standards to determine (Table 3).
Since there is no reference for the coefficients of the same study area, we determined the discharges from livestock and poultry farming and rural living based on the “Pollutant Discharge Standards for Livestock and Poultry Farming” and Han et al. [49] study in the Han River Basin (Table 4).

2.3.3. System Dynamics

System dynamics (SD) is an analytical theory and method for studying complex time-varying systems. It is based on feedback control theory and uses computer simulation to examine the trend of the system state under the interaction and action of various elements [28,51]. At present, the main software dedicated to simulation language and simulation software for SD are Mini-Dynamo, Dynamo Plus, Stella/ithink series, Powersim, and Vensim, etc., which can deal with higher-order problems, and all of them are able to construct continuously varying feedback systems and the difference is only in the richness of the extended functions. In this study, Vensim PLE/DSS (x32) SD software is used as the modeling software to construct a watershed agricultural NPS pollution simulation system to simulate the agricultural NPS pollution generation, quantitatively assess the adjustment response of population, economic development, land use, and agricultural NPS pollution control in terms of scale, structure and layout, and the impact pathway, intensity and evolution pattern of agricultural NPS in the Nansi Lake, and identify the sensitivity assessment factors affecting optimal regulation.
The main variable types of the SD model include four types of state variables (L), rate variables (V), auxiliary variables (D), and constant variables (C), where the state variables are jointly determined by the initial value and the amount of change, some auxiliary variables (e.g., tabular functions) establish mathematical functional relationships, and the constant variables require constants. In this study, according to the nature of the variables themselves and the requirements of the model operation, the three methods are comprehensively applied to determine the pending parameters of the simulation system for agricultural NPS pollution in the Nansi Lake Basin. The data sources for the construction of this system are mainly the statistical yearbooks of Jining, Zaozhuang, Heze, and Ningyang, Tai’an, the land use and livestock and poultry farming covered in the previous chapters, as well as the plans of the local governments, or the data obtained from field research. The starting year of data is chosen as 2010, the base year is 2020, the near-term year of prediction is 2035, the long-term outlook is up to 2050, and the simulation has a step size of 1 year. In accordance with the modeling principle that SD is both concise and realistic, four subsystems will be delineated in this study (Figure 2): the rural living subsystem, the plantation subsystem, the livestock and poultry farming subsystem, and the basin pollution treatment subsystem.

2.3.4. Sensitivity Analysis

Sensitivity analysis analyzes the sensitivity of the key factors (control quantities) in the system to the simulation results (observations) after the SD model is built. The specific steps are to set the range of values of the key factors (control quantities), simulate many times (e.g., 200 times), and obtain the band and sector diagrams of the observed quantities, which are called the sensitivity and trajectory diagrams [52]. Among them, the larger the bandwidth of the trajectory graph of the observed quantities, the more sensitive it is, and the narrower the bandwidth is, the less sensitive it is. Sensitivity analysis can be set up for multiple control quantities and multiple observations. The effect of each control quantity on each observation can be analyzed, or the effect of a set of control quantities on each observation at the same time can be analyzed. In this study, the sensitivity test was carried out by Vensim DSS (Ventana, Massachusetts Institute of Technology, USA) software, and the sensitivity analysis was carried out for each factor of the rural living subsystem, the plantation subsystem, the livestock and poultry farming subsystem, and the basin pollution treatment subsystem, and this sensitivity analysis assumed that the export coefficients of each export coefficient of the two pollutants, COD and NH3-N, were unchanged.

3. Results

3.1. Trends in NPS Pollution

3.1.1. Status of NPS Pollution Loads

In this study, the agricultural NPS pollution loads of counties and counties in the Nansi Lake Basin in 2020 were assessed in detail based on the Nansi Lake agricultural NPS pollution load estimation model and statistical survey data (Table 5). In terms of the total amount, the agricultural NPS pollution load in 2020 in the Nansi Lake Basin was high, with cumulative panel data of 5.4 × 10⁴ t/a and 2.5 × 10⁴ t/a for COD and NH3-N, respectively. Among them, COD accounted for the highest proportion of 95.60%, while the proportion of NH3-N was 4.4%. In terms of spatial distribution, the NPS pollution loads in the Nansi Lake Basin showed obvious geographical differences, and in general, the NPS pollution loads in Heze in the west and Tai’an in the north were generally higher than those in Jining in the center and Zaozhuang in the south-east. Comparing the total data of each county, the highest agricultural NPS pollution loads were found in Cao, Tengzhou, and Yuncheng, with panel data of 5.7 × 10⁴ t/a, 4.4 × 10⁴ t/a, 4.3 × 10⁴ t/a, respectively, which were more than 40,000 t/a; whereas the total pollution loads in Shizhong and Yanzhou counties were very small, with 9.6 × 10³ t/a, 7.4 × 10³ t/a, respectively, both lower than 10,000 t/a.

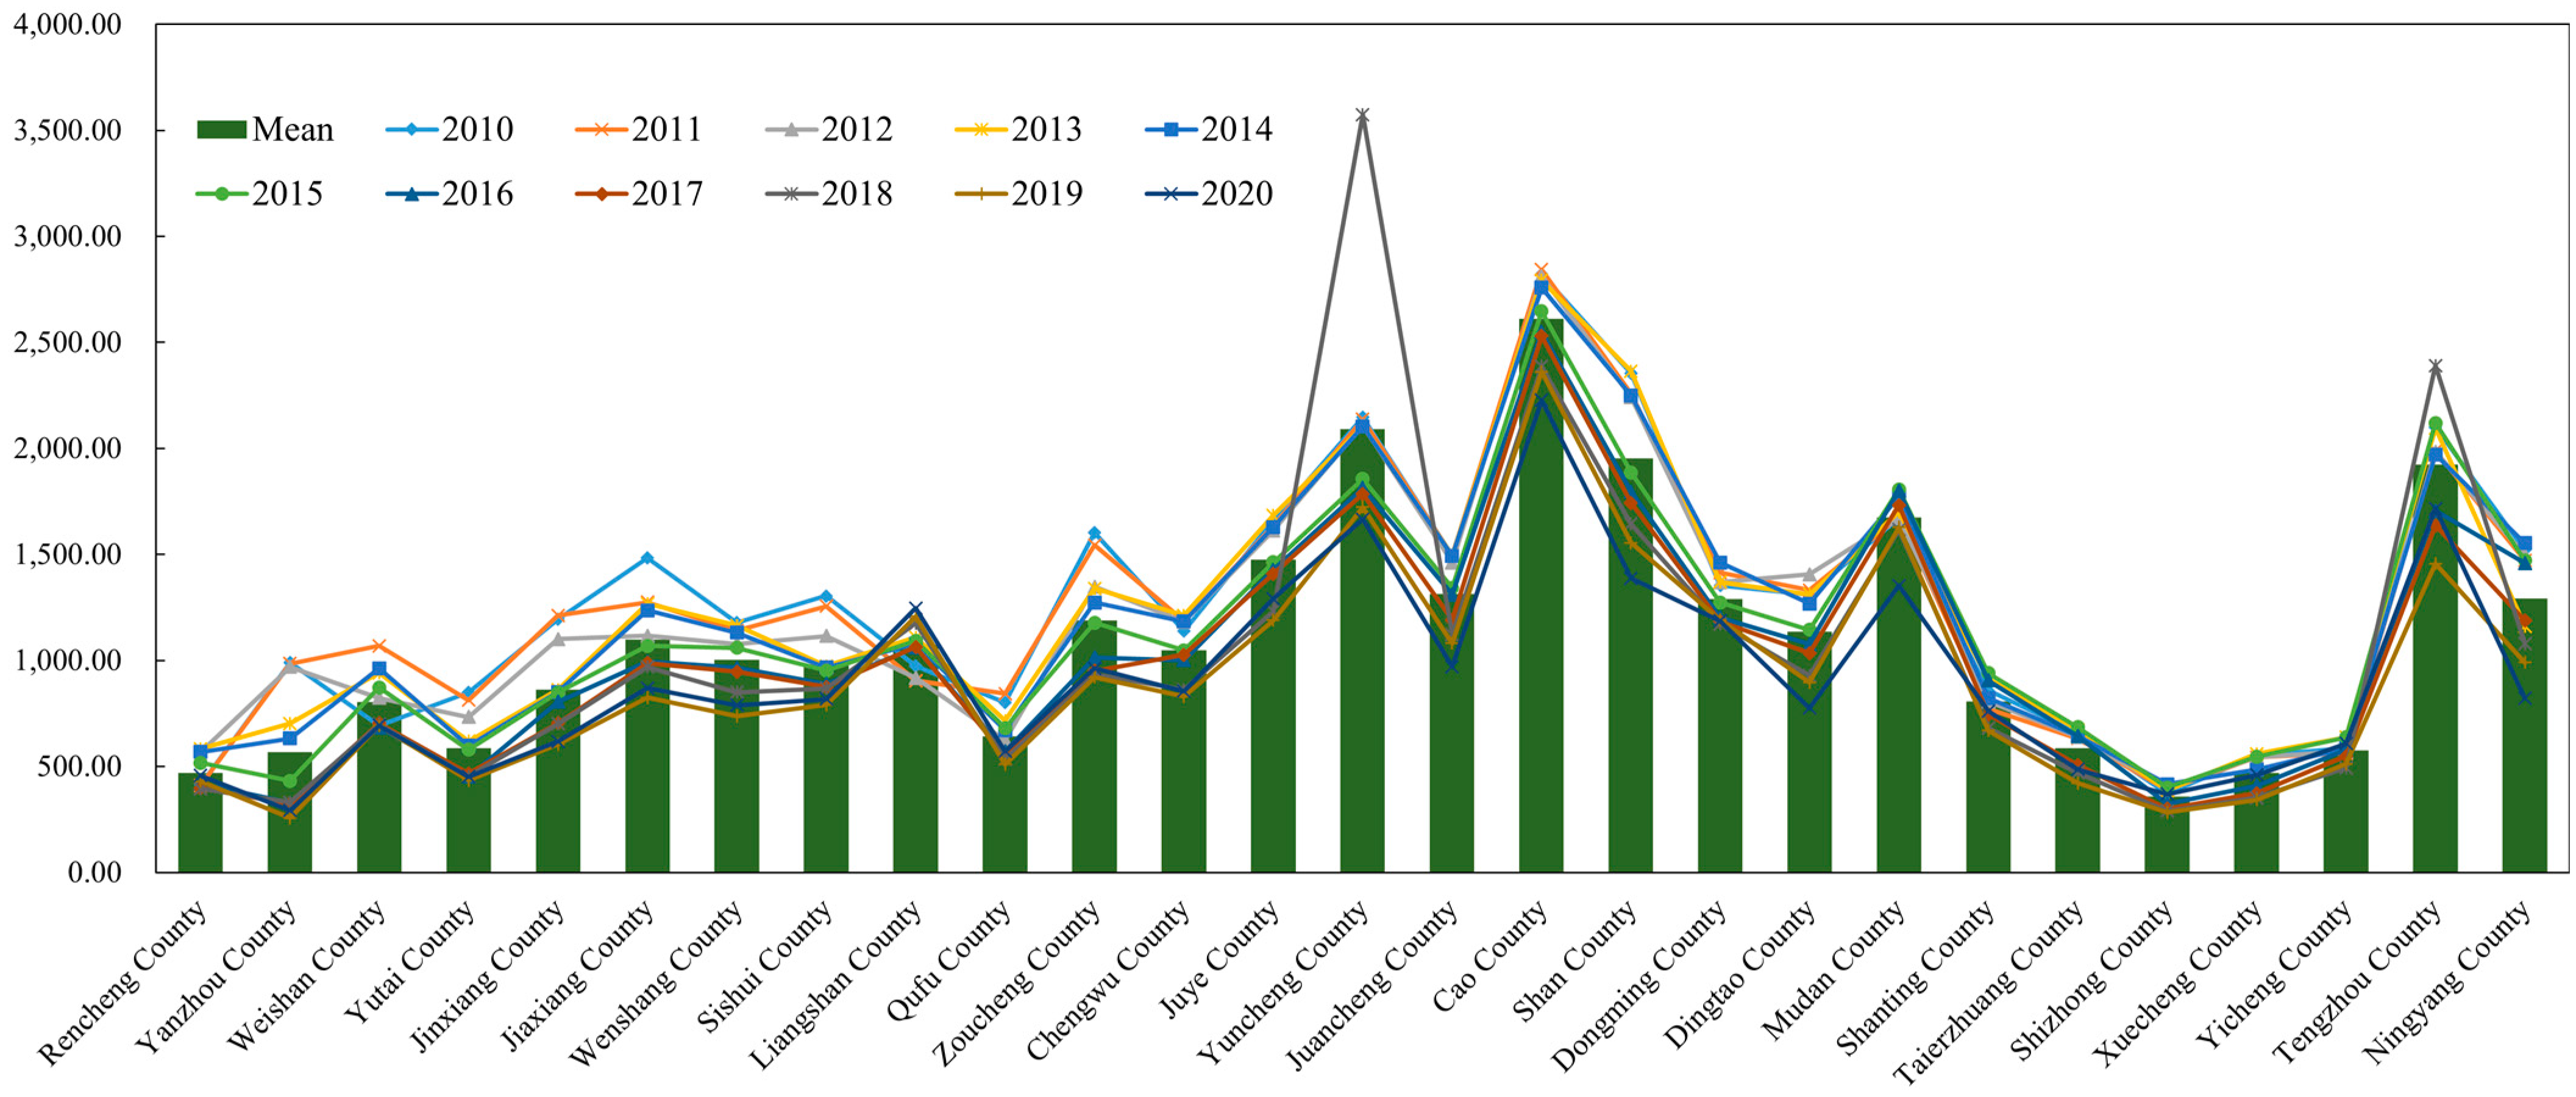
3.1.2. Spatial and Temporal Variation of NPS Loads

The results of COD pollution load in the Nansi Lake Basin from 2010 to 2020 are shown in Figure 3. Overall, the spatial distribution of COD pollution is characterized as “low in the middle, high around, locally concentrated and unevenly distributed”. Among them, the COD NPS pollution export loads of Heze, Tai’an, and Zaozhuang are relatively large, the COD pollution load of Jining is relatively small, and the low COD pollution load area is concentrated in the central part of Jining and the southwestern part of Zaozhuang. During the study period, Cao County, Shan County, Yuncheng County, Tengzhou County, and Ningyang County had the largest NPS pollution COD export loads. The NPS pollution COD pollution loads in Rencheng County, Qufu County County, Yutai County, Shizhong County, Xuecheng County, and Yicheng County were relatively small.
The average COD pollution load in the Nansi Lake Basin decreased from 2.72 × 10⁴ t/a in 2010 to 2.00 × 10⁴ t/a in 2020, with an overall decreasing trend. The four counties with the largest COD pollution load in 2010 were Cao County, Shan County and Yuncheng County in Heze, and Tengzhou County in Zaozhuang, with 6.49 × 10⁴ t/a, 4.41 × 10⁴ t/a, 4.45 × 10⁴ t/a, and 4.62 × 10⁴ t/a. Followed by Mudan County, Juye County, and Yuncheng County in Heze, Jiaxiang County and Zoucheng County in Jining, and Ningyang County in Tai’an, with COD pollution loads of 2.95 × 10⁴ t/a–3.52 × 104 t/a. COD pollution loads are smaller in Qufu County, Yutai County, Shanting County, and Taierzhuang County in Zaozhuang, with COD pollution loads between 1.32 × 10⁴ t/a and 1.85 × 10⁴ t/a. While Rencheng County and Weishan County in Jining and Xuecheng County and Yicheng County in Zaozhuang have very small COD pollution loads of 0.89 × 10⁴ t/a, 1.12 × 10⁴ t/a, 1.24 × 10⁴ t/a, and 1.32 × 10⁴ t/a, and Zaozhuang central county has the smallest pollution load, only 0.86 × 10⁴ t/a. Most of the lowest COD pollution load years are distributed in Zaozhuang central county, although the overall pollution center of gravity shows a trend of shifting to the west. In 2018, the COD pollution load value of the Nansi Lake Basin showed the greatest transient increase.
The results of NH3-N pollution load in the Nansi Lake Basin from 2010 to 2020 show that the spatial distribution of NH3-N pollution loads presents a lower central part, a higher periphery, and a clustering phenomenon in some localities, with an unbalanced distribution (Figure 4). Among them, the NH3-N NPS pollution loads in Heze, Tai’an, and Zaozhuang are relatively large, the export load in Jining is small, and the distribution of the low-value area of NH3-N pollution loads is concentrated in the central part of Jining and the southwestern part of Zaozhuang. The high-value areas of pollution load are Cao County, Shan County, Yuncheng County and Mudan County in Heze, Rencheng County, Qufu County, Yanzhou County, Yutai County in Jining and Shizhong County, Xuecheng County, Yicheng County and Tai’erzhuang County in Zaozhuang, where the NH3-N pollution loads are relatively small.
The mean NH3-N pollution load in the Nansi Lake Basin changed from 1.26 × 10³ t/a in 2010 to 0.92 × 10³ t/a in 2020, with an overall decreasing trend. Specifically, the four counties with the largest NH3-N NPS pollution loads in 2010 were Cao County, Shan County, Yuncheng County in Heze, and Tengzhou County in Zaozhuang, which reached 2.82 × 10³ t/a, 2.35 × 10³ t/a, 2.15 × 10³ t/a, and 2.10 × 10³ t/a, respectively. Followed by Mudan County, Juno County, and Jancheng County located in Heze, Jiaxiang County and Zoucheng City in Jining, and Ningyang County in Tai’an, with NH3-N pollution loads ranging from 1.35 × 10³ t/a to 1.67 × 10³ t/a. The smaller NH3-N pollution loads were found in Liangshan County, Yanzhou County, Qufu County, Yutai County, and Shanting County of Jining and Zaozhuang, with NH3-N pollution loads ranging from 0.69 × 10³ t/a to 0.99 × 10³ t/a. Rencheng County and Weishan County in Jining and Xuecheng County, Yicheng County and Taierzhuang County in Zaozhuang had very small NH3-N pollution loads of 0.41 × 10³ t/a, 0.69 × 10³ t/a, 0.55 × 10³ t/a, 0.59 × 10³ t/a, and 0.66 × 10³ t/a, respectively, and Shizhong County in Zaozhuang County had the smallest COD pollution loads of only 0.37 × 10³ t/a. During 2010–2017, the maximum value of NH3-N pollution load in the Nansi Lake Basin declined, with the highest value in Cao County of Heze and the lowest pollution load in Shizhong County of Zaozhuang, and spatially, the center of gravity of the pollution load showed a tendency of shifting to the west. In 2018, there was a transient upward trend in the maximum value of NH3-N pollution load in the Nansi Lake Basin, with the highest value of Yuncheng County in Heze, amounting to 2.87 × 10³ t/a. The minimum value of NH3-N pollution load value in the Nansi Lake Basin during 2019–2020 shifted to Yanzhou County in Jining, amounting to 0.26 × 10³ t/a and 0.29 × 10³ t/a, respectively.

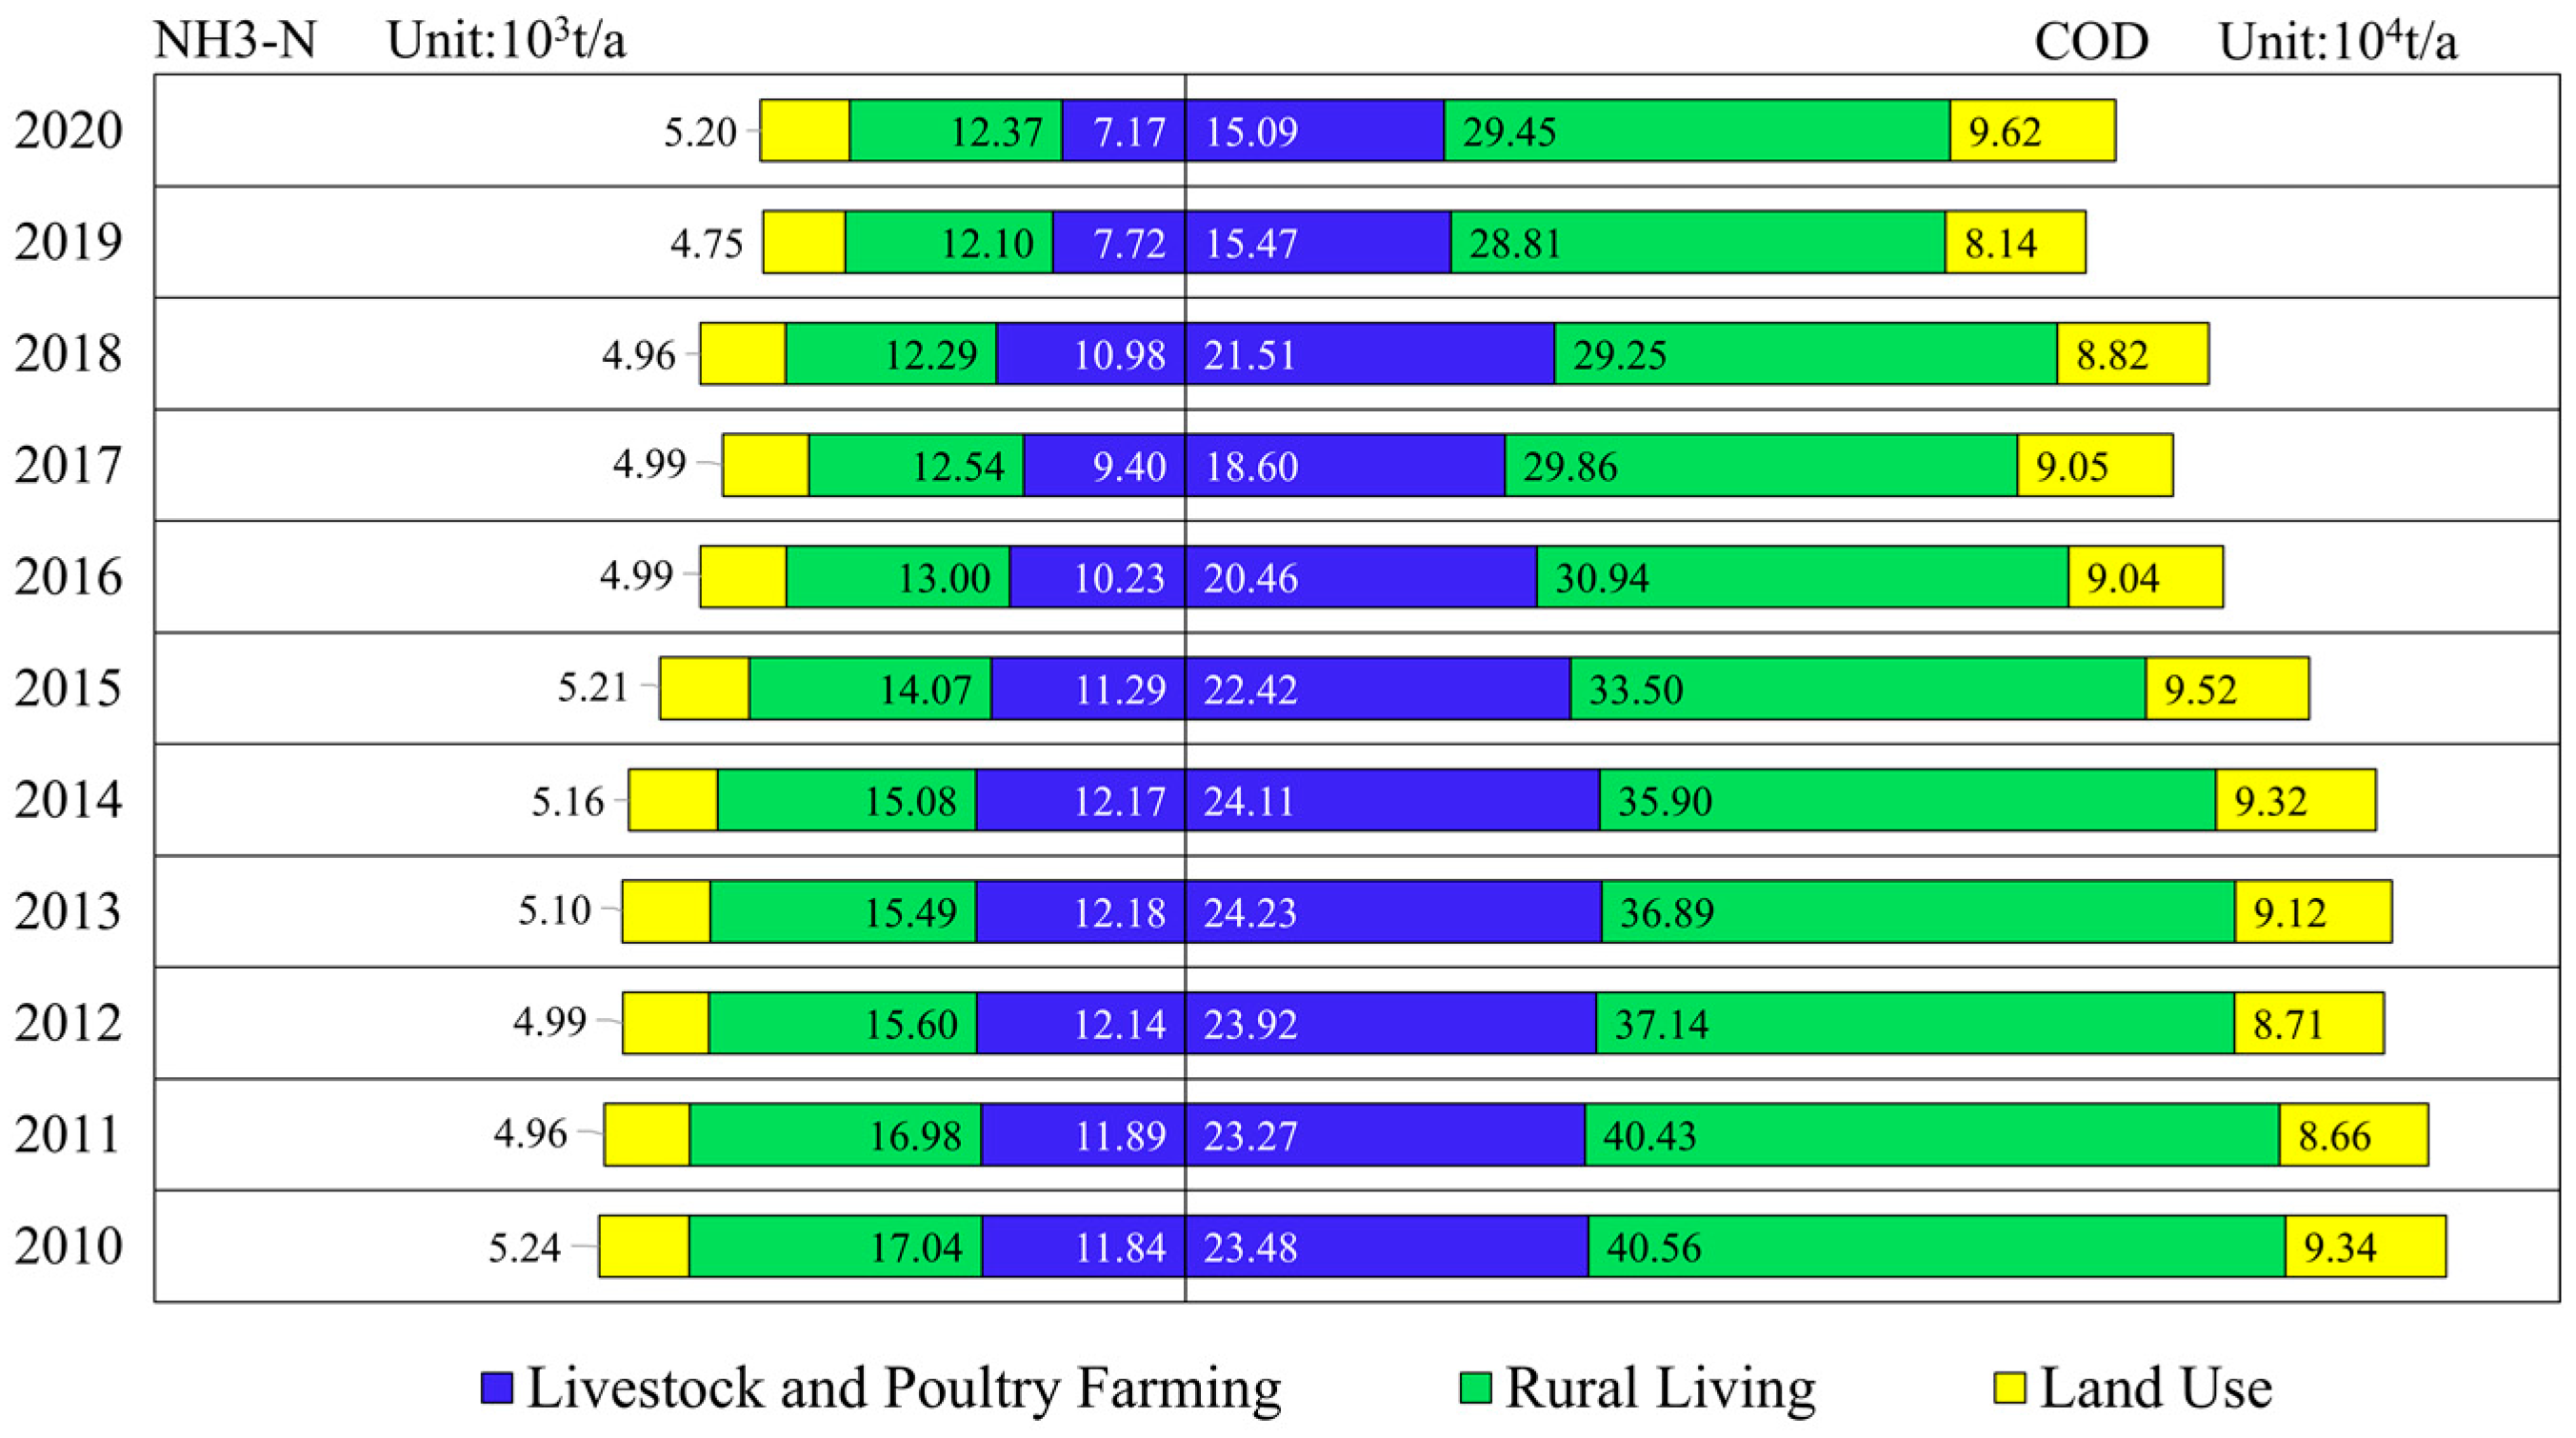
3.1.3. Analysis of Sources of NPS Pollution Loads

This study further analyses the source structure of the pollution load of the four pollutants in the Nansi Lake Basin from 2010 to 2020, and the results are shown in Figure 5. The main source of NPS pollutant COD in Nansi Lake Basin is rural life, which shows an overall decreasing trend, and the share of rural life in COD pollution output is stable at 50%. Followed by livestock and poultry farming, the overall emission shows a decreasing trend, from 23.48 × 10⁴ t/a in 2010 to 15.09 × 10⁴ t/a in 2020, a decrease of 35.73%. The main sources of the pollution load of pollutant NH3-N are livestock and poultry farming and rural life, in which rural life plays a more dominant role, and its share in NH3-N pollution export is stable at about 50%. Rural life in NH3-N pollution export decreased from 1.71 × 10⁴ t/a in 2010 to 1.23 × 10⁴ t/a in 2020, a decrease of 28.07%. Livestock and poultry farming in the NH3-N pollution export change floats little; only in 2019 and 2020 is the decreasing trend obvious. Meanwhile, the export of NH3-N from land use is less, maintaining around 0.50 × 10⁴ t/a.
This study also analyzed the export structure of NPS pollutants from different land use types in the Nansi Lake Basin for the 11 years from 2010 to 2020 (Table 6). COD pollutants had the largest share in the arable land type. NPS pollutant COD reached the maximum value of 62,650.79 kg/ha in 2010, decreased to the minimum value of 47,064.68 kg/ha in 2019, but increased to 60,344.56 kg/ha in 2020. The proportion of COD pollutants was stable at about 80% and showed an overall trend of increasing, then decreasing, and then increasing again from 542.87 kg/ha in 2010 to 542.87 kg/ha in 2020. 542.87 kg/ha in 2010 to 3243.83 kg/ha in 2011, decreasing to 631.28 kg/ha in 2015 and increasing to 1733.30 kg/ha in 2020. NH3-N pollutants accounted for a smaller proportion in the woodland type, with only 4% of both. In the grassland type, NPS pollutants were dominated by COD, which was the largest pollutant and remained at around 60% but showed a general decreasing trend from 393.40 kg/ha in 2010 to 221.61 kg/ha in 2020, a decrease of 43.67%. COD pollutants are dominant among the water types, and NH3-N is the smallest. COD pollutant as a whole shows a trend of increasing, then decreasing, and then increasing in the first ten years, reaching a maximum value of 2998.71 kg/ha in 2019 and then decreasing to the lowest value of 809.92 kg/ha in 2020. The pollutant NH3-N shows a general decreasing trend in all water types. The process of change is first increasing, then decreasing, and then increasing again, rising to a maximum value of 671.34 kg/ha in 2019 and then decreasing to 181.32 kg/ha in 2020, with a decrease of 73 percent in one year. In the constructed land type, COD pollutants accounted for about 90%, reaching a maximum value of 33,565.7 kg/ha in 2020. NH3-N values accounted for a smaller proportion, and the two types of pollutants in the unutilized land type did not change significantly during the study period. COD pollutants showed a decreasing trend, decreasing from 3.99 kg/ha in 2010 to 0.15 kg/ha in 2010, a decrease of 96%. NH3-N pollutant reached a maximum value of 13.49 kg/ha in 2014 and decreased to 0.15 kg/ha in 2020.

3.2. SD Analysis

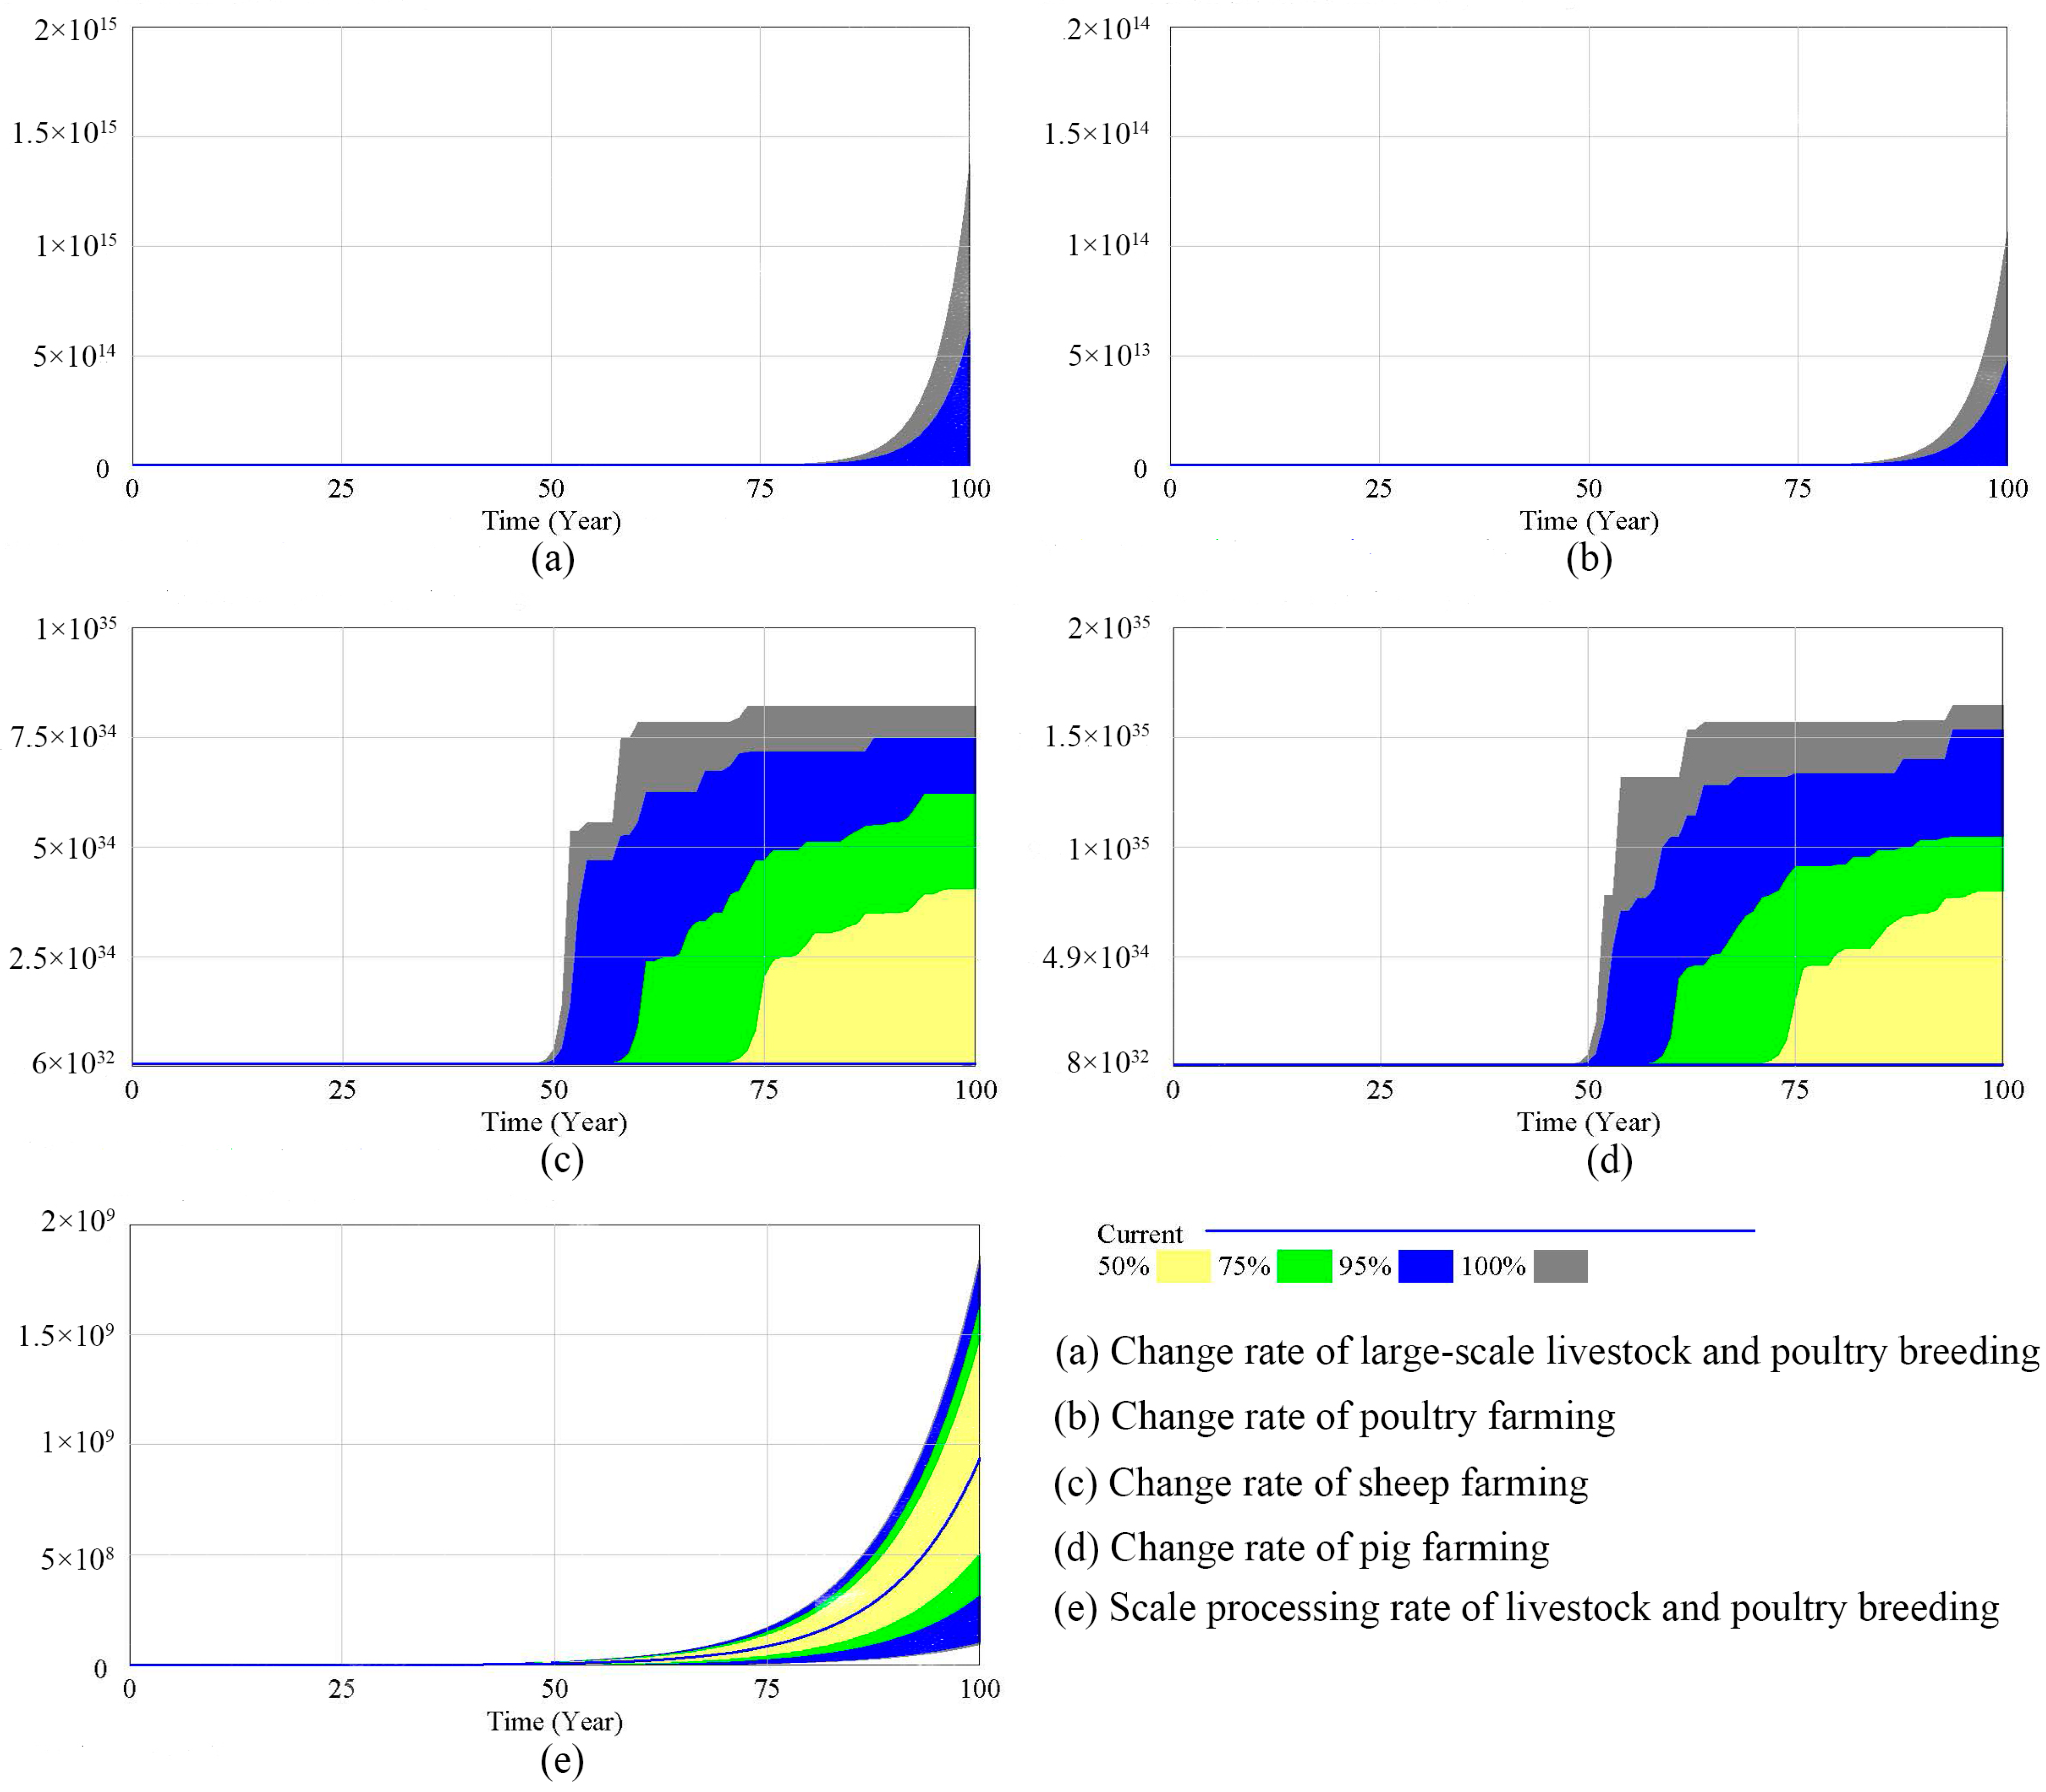
3.2.1. Sensitivity Analysis of a SD Model for NPS Pollution

We set the range of population change rate, GDP change rate, and rural sewage treatment rate to obtain the change in the actual generation of agricultural NPS pollutants, as shown in Figure 6. The total population of the Nansi Lake Basin increased from 22,117,700 in 2010 to 22,209,500 in 2020, and the rate of population change from 2010 to 2020 is 0.03‰. The range of change of the population change rate is set to be 0–10‰. The impact of population change is small in the first 25 years, and the impact gradually appears after 50 years. The total GDP of the Nansi Lake Basin was 523.29 billion yuan in 2010, increasing to 878.37 billion yuan in 2020, with an annual growth rate of 4.82% from 2010 to 2020. Setting the range of GDP change rate from 0% to 6% shows that the impact of GDP change on the generation of NPS pollutants is small in the first 75 years, especially in the first 25 years; there is basically no impact. After a field investigation of the South Lake Basin 2020, the rural sewage treatment rate is basically at 50%. Setting the change range of rural domestic sewage treatment rate is 50–95%. The change in rural domestic sewage treatment rate is very sensitive to the impact of the actual generation of agricultural NPS pollutants, and the impact is basically similar in the next 100 years.
We set the range of changes in the rate of construction land occupied by arable land, the rate of investment in land remediation, the proportion of soil testing and formulation, the amount of fertilizer used per unit area, and the amount of pesticide used per unit area to obtain the changes in the actual amount of agricultural NPS pollutants as shown in Figure 7. The total area of construction land in 2020 in the Nansi Lake Basin is 611,305.50 ha, compared with 531,352.21 ha in 2010, an increase of 79,953.29 ha, an increase of 15.05%; the increase in construction land mainly occupies arable land, gardens, forests, and unused land, of which the occupied area of arable land is 55,974.64 ha, accounting for about 70%. Setting the change range of construction-occupied cropland rate as 0–95%, the change of construction-occupied cropland rate is less sensitive to the influence of the actual amount of agricultural NPS pollutants generated and only slightly changed after 50 years. From 2010 to 2020, the area of increased cropland in the Nansi Lake Basin for finishing development and reclamation is 56,661.65 ha, with a total investment of 63.42 billion, averaging 0.60 billion yuan per year, accounting for about 1‰ of the total GDP. Setting the change range of the investment rate of land reclamation as 1–10‰, the change of the rate of construction of arable land is less sensitive to the impact of the actual amount of agricultural NPS pollutants, and the impact is very small in the whole simulation period (100 years). Nansi Lake Basin is a traditional agricultural planting area and livestock and fishery breeding area with a large amount of NPS pollution. Since 2005, the Nansi Lake Basin has been promoting the comprehensive use of straw and soil testing and formula application of fertilizer in the whole county system, and the rate of soil testing and formula application of fertilizer has basically been maintained at more than 50%. Setting the change range of soil testing and formula fertilization as 50–85%, the change of soil testing and formula fertilization is very sensitive to the impact of the actual generation of agricultural NPS pollutants, and the impact tends to decrease with the passage of time, but the change of its value within the first 75 years of the simulation period is very sensitive to the impact of the actual generation of agricultural NPS pollutants. In 2020, the fertilizer and pesticide use in Nansi Lake Basin will be 295.61 t and 1.68 t, respectively, with the pesticide use 1.48 t less than that in 2010 and the fertilizer use 11.82 t more than that in 2010; in 2010, the fertilizer and pesticide use per unit area will be 967.92 kg/ha and 107.80 kg/ha respectively; in 2020, the fertilizer and pesticide The use of fertilizer and pesticide per unit area in 2020 will be 974.71 kg/ha and 55.39 kg/ha respectively. Setting the range of changes in fertilizer and pesticide use per unit area as −30–30%, the impact of changes in fertilizer and pesticide use per unit area on the actual generation of agricultural NPS pollutants is basically similar, and both are insensitive and only in the 25 years after the simulation period, changes in the values of these values are sensitive to the impact of the actual generation of agricultural NPS pollutants.
We set the range of changes in the rate of change of large livestock and poultry farming, poultry farming, sheep farming, swine farming, and the rate of large-scale treatment of livestock and poultry farming to obtain the changes in the actual production of agricultural NPS pollutants as shown in Figure 8. The changes in the production of agricultural NSP pollutants in the Nansi Lake Basin in 2020 are as follows. Relative to 2010, in 2020, the number of large livestock and poultry, poultry, sheep, and pig farming in the Nansi Lake Basin decreased by 50.92%, 10.42%, 59.79%, and 21.70%, respectively. Setting the rate of change (−30–30%) of large livestock and poultry, sheep, and pig farming quantities, respectively, for sensitivity testing, it can be seen that the rate of change of large livestock and poultry, poultry, sheep and pig farming quantities in the first 50 years of the simulation period is not sensitive to the actual amount of agricultural NPS pollutants, in which the changes in the amount of large livestock and poultry farming have a similar impact on the actual amount of agricultural NPS pollutants, only in the second 20 years of the simulation period shows a The changes in the amount of sheep and pig farming have a similar impact on the actual amount of agricultural NPS pollutants generated, with a basic impact in the first 50 years of the modeling period, and a sudden change and a surge in impact in the second 50 years. By 2020, the large-scale treatment rate of livestock and poultry farming in the Nansi Lake Basin will basically reach more than 50%. Setting the livestock and poultry farming large-scale treatment rate (0–95%) for sensitivity test, the livestock and poultry farming large-scale treatment rate on the impact on the actual amount of agricultural NPS pollutants generated in the entire simulation period (100 years) is very sensitive, is the key factor of the actual amount of agricultural NPS pollution.
We set the proportion of investment in agricultural NPS pollution treatment (0–1%) for the sensitivity test, and the changes in the actual generation of agricultural NPS pollutants are shown in Figure 9. It can be seen that the effect of the proportion of investment in agricultural NPS pollution GDP on the actual generation of agricultural NPS pollutants is not sensitive over the whole simulation period (100 years).
From the sensitivity test of each key factor of each subsystem above, the rate of change of population, the rate of change of GDP, the rate of rural sewage treatment, the proportion of the area of soil application of fertilizer, the rate of change of the number of livestock and poultry farming, and the rate of treatment of livestock and poultry farming on a large scale are the key and sensitive factors.

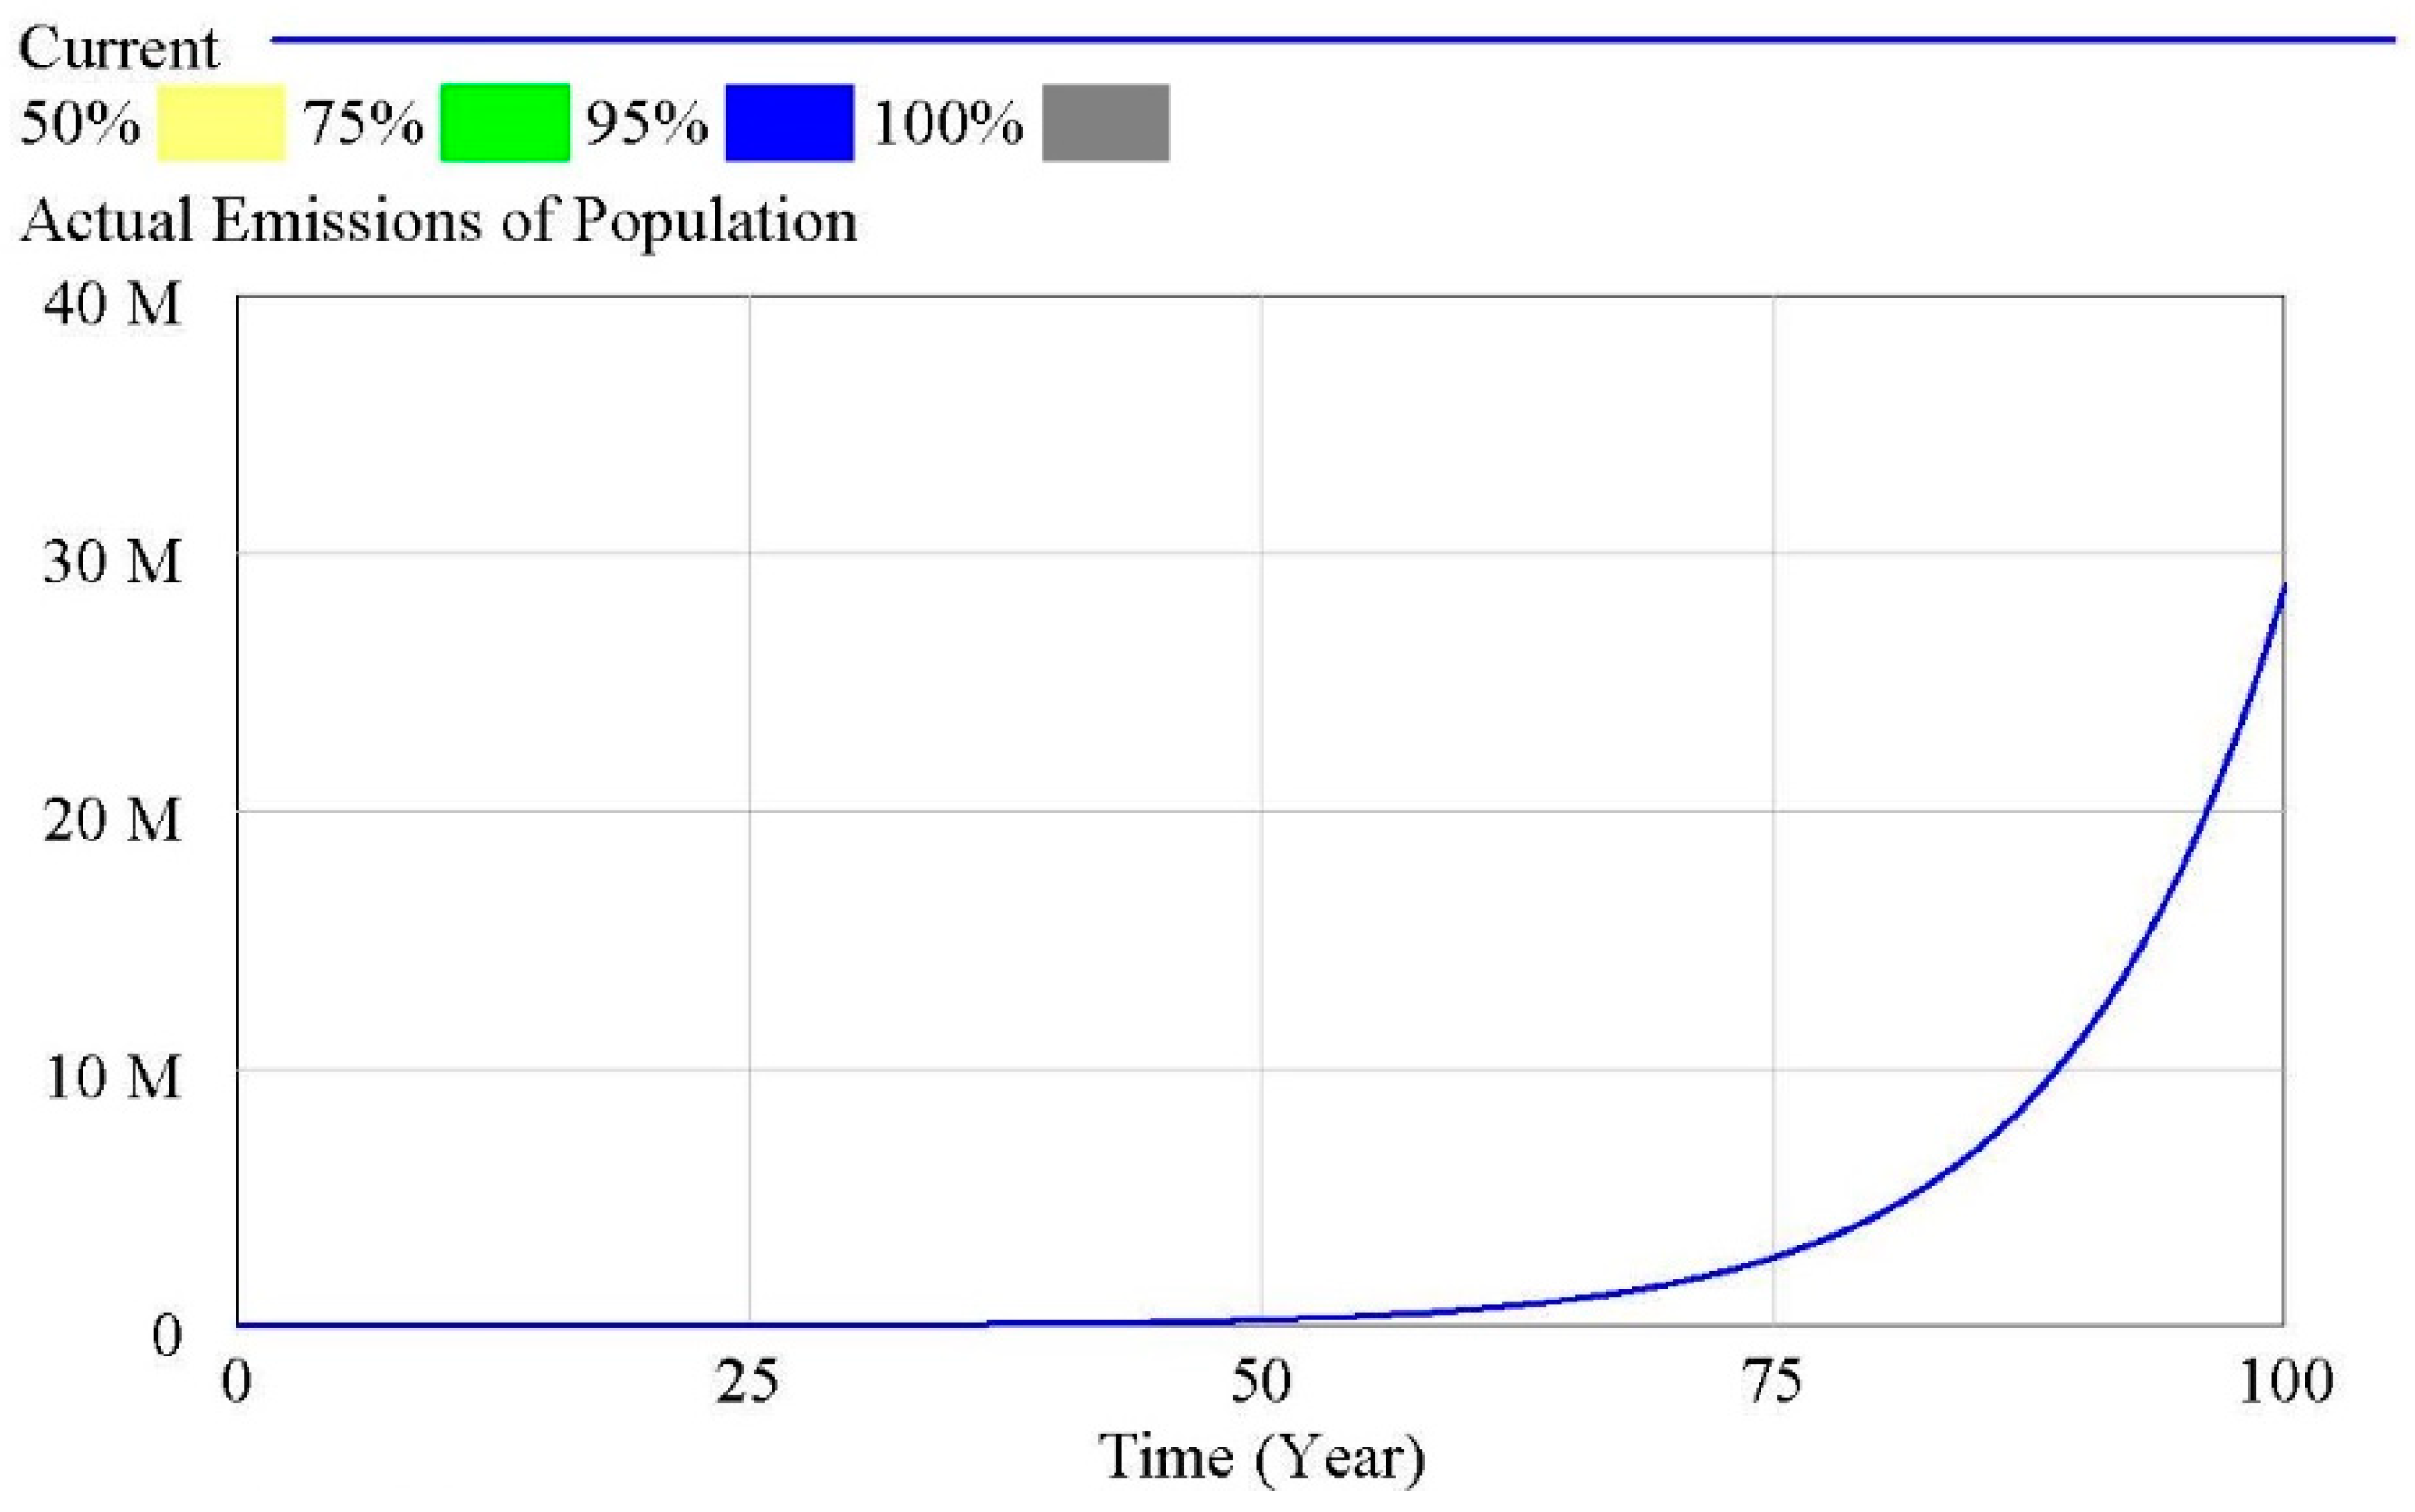
3.2.2. Modelling the SD of NPS Pollution

Based on the results of the parameter sensitivity and agricultural NPS pollution reduction potential analyses and considering the possible future economic and social development trends and investment requirements for agricultural NPS pollution management, nine development scenarios were set up. The first is the economic and social development target, which is divided into three levels: low-speed development (B1), medium-speed development (B2), and high-speed development (B3). The second is the environmental governance level determined through environmental governance investment, which is divided into three scenarios: low (A1), medium (A2), and high (A3). Nine development scenarios can be generated through the cross-combination of different objectives, in which the three scenarios on the diagonal (A1B1, A2B2, A3B3) are the cases where the economic and social objectives and the agricultural NPS pollution treatment import objectives are at the same desired level; the three scenarios on the lower right side of the diagonal (A2B1, A3B1, A3B2) have agricultural NPS pollution treatment import objectives higher than economic and social targets; for the three scenarios on the upper left side of the diagonal (A1B3, A2B3, A1B2), their economic and social development targets are higher than the agricultural NPS pollution treatment import targets. The specific development scenarios are presented in Table 7.
Figure 10 and Figure 11 illustrate the total pollutants entering the river under various scenarios. If the basin follows the current development trajectory, it will remain overloaded with pollutants beyond 2030 under the Class III water quality standard. Rural domestic sewage is the primary pollution source in the Nansi Lake Basin, and the total pollutant discharge is shaped by changes in the rural population. With shifts in rural demographics, COD discharge initially declines before increasing, while NH3-N discharge initially rises and then declines.
By simulating the actual generation of COD pollutants under the nine scenarios in the Nansi Lake Basin area from 2020 to 2050 (Figure 10), it can be concluded that, from 2020 to 2050, the actual generation of pollutants under the scenarios of A1B1, A1B2, and A1B3 has always shown a decreasing trend from one year to another, which indicates that only if the use of fertilizer and pesticide has always been kept in the scenario of low import, the COD pollutants and pesticides are always kept at low import, the actual generation of COD pollutants will be reduced, on the contrary, the increase of fertilizer and pesticide use will increase the actual generation of COD.
By analyzing the actual generation of NH3-N pollutants under the nine scenarios in the Nansi Lake Basin area from 2020 to 2050 (Figure 11), it can be seen that under scenarios A1B1 and A1B2, the actual generation of NH3-N pollutants shows a decreasing trend from year to year, especially under scenario A1B1, and the actual generation in 2025 is lower than that in 2020 by 481.88 t, whereas under the A1B3 scenario, the actual generation of NH3-N pollutants shows an increasing trend year by year, and the actual generation in 2025 is 291.97 t higher than that in 2020, in addition to that, the actual generation of NH3-N pollutants in scenarios A2B1, A3B1, and A3B3 shows an increasing trend to a greater or lesser extent.

4. Discussion

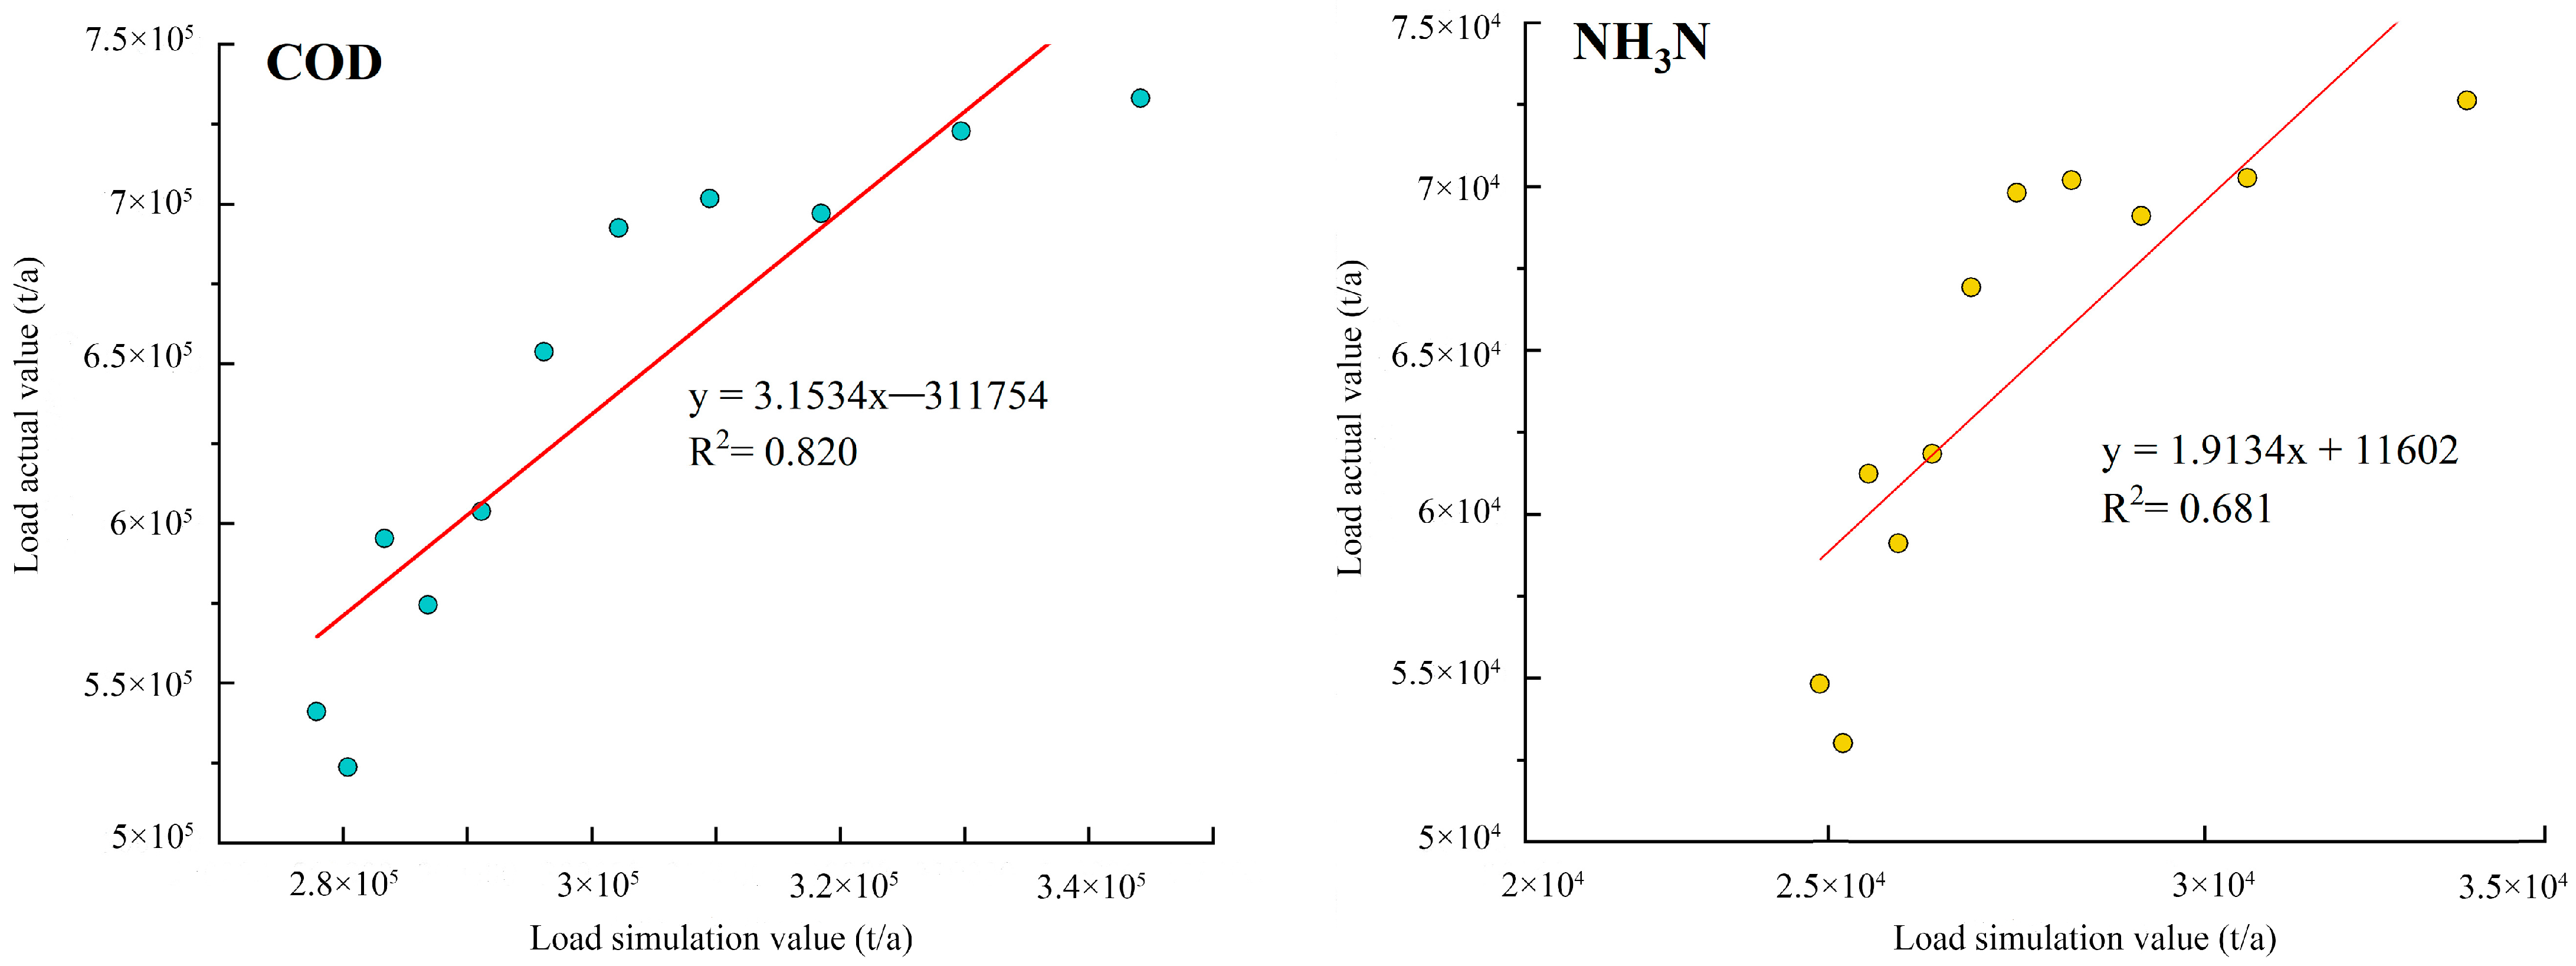
4.1. Model Validity Testing

In this study, the results of the SD simulation of pollutant generation from 2010 to 2020 were examined against the actual pollution loads in the Nansi Lake Basin, and the correlation coefficient R2 was used to judge the simulation accuracy. The results are shown in Figure 12. If the correlation coefficients are all greater than 0.40, it means that the fitting accuracy is high. The highest correlation coefficient was 0.82 for COD, which had the highest fitting accuracy, and the correlation coefficient for NH3-N was 0.68. The results showed that the correlation between the simulation results and the actual pollution loads in this study was high, and therefore, the simulation results were more accurate and reliable.

4.2. Sources of NPS Pollution

Studies have shown that the same land use produces different NPS exports at different spatial locations due to soil type and slope [22]. In the northeastern part of the Nansi Lake Basin, the land use type is dominated by forest and grassland, and the vegetation can effectively store water, so the flow remains low [53]. When the land use changed from 2010 to 2020, the loads of COD and NH3-N produced changes, respectively, but the magnitude of the changes was lower than that of the NPS pollution produced by the rural livelihoods, which was in line with the results of the previous study inconsistent [54,55]. Excessive fertilizers, rural residents, and dispersed livestock farms constitute a significant portion of the basin [56]. Therefore, the effects of land use change on both pollutants are mainly related to changes in the proportion of cultivated land, high slope difference, or specific slopes [57,58]. Figure 3 and Figure 4 show the spatial distribution of COD and NH3-N loads in the Nansi Lake Basin. The spatial differentiation of NPS pollutants in each region was large. The highest loads were found in Heze, where soil erosion was caused by frequent planting and cultivation, the land use type was dominated by arable land, and most of the COD and NH3-N entered the water mainly through the adsorption of sed-impends. The results were consistent with previous studies, confirming that soil erosion is a significant contributor to NPS pollution [28,59]. The annual average total COD discharged to the water environment from pollution sources in the Nansi Lake Basin from 2010 to 2020 was 640.6 thousand t, of which rural life was the main agricultural NPS pollution COD in the area pollution source, with an emission ratio of 52.85%. The analysis of the NH3-N emission accounting process revealed that the annual average total amount of NH3-N discharged to the water environment from pollution sources in the Nansi Lake Basin from 2010 to 2020 was 29,900,000 t, of which rural living and livestock and poultry farming, with emission ratios of 47.55% and 35.36%, respectively, were the major NH3-N pollution sources of agricultural NPS pollution in the county, which was roughly the same as that in the previous study [60,61]. Excessive waste in fertilizer use and low nitrogen utilization efficiency are the direct root causes of large amounts of nitrogen emissions from agricultural cultivation [62]. In contrast, the nitrogen recycling rate in livestock and poultry farming is higher, but excessive total nitrogen production from livestock and poultry wastes, coupled with the lack of pollutant treatment facilities, results in nitrogen nutrients being arbitrarily piled up or directly discharged without being utilized or processed. This is an important source of agricultural NPS pollution [63]. The main characteristics of NPS pollution are that it comes from a wide range of sources, is dispersed, and is influenced by multiple factors such as climate, topography, and soil conditions. Through the study in this paper, we have identified in depth the different contributions of pollution load from different sources, such as farmland fertilization, animal husbandry, urban runoff, etc., to water bodies. This provides a scientific basis for quantifying the pollution risk from different sources and helps to formulate precise abatement and management measures. For example, by studying the loss of nitrogen and other nutrients in agricultural runoff, it is possible to promote precision fertilizer application, reduce the use of pesticides and fertilizers, or introduce natural filtration mechanisms such as buffer zones and wetlands so as to reduce pollution in water bodies [58]. Such optimal management not only improves water quality but also maintains the sustainability of agricultural production.

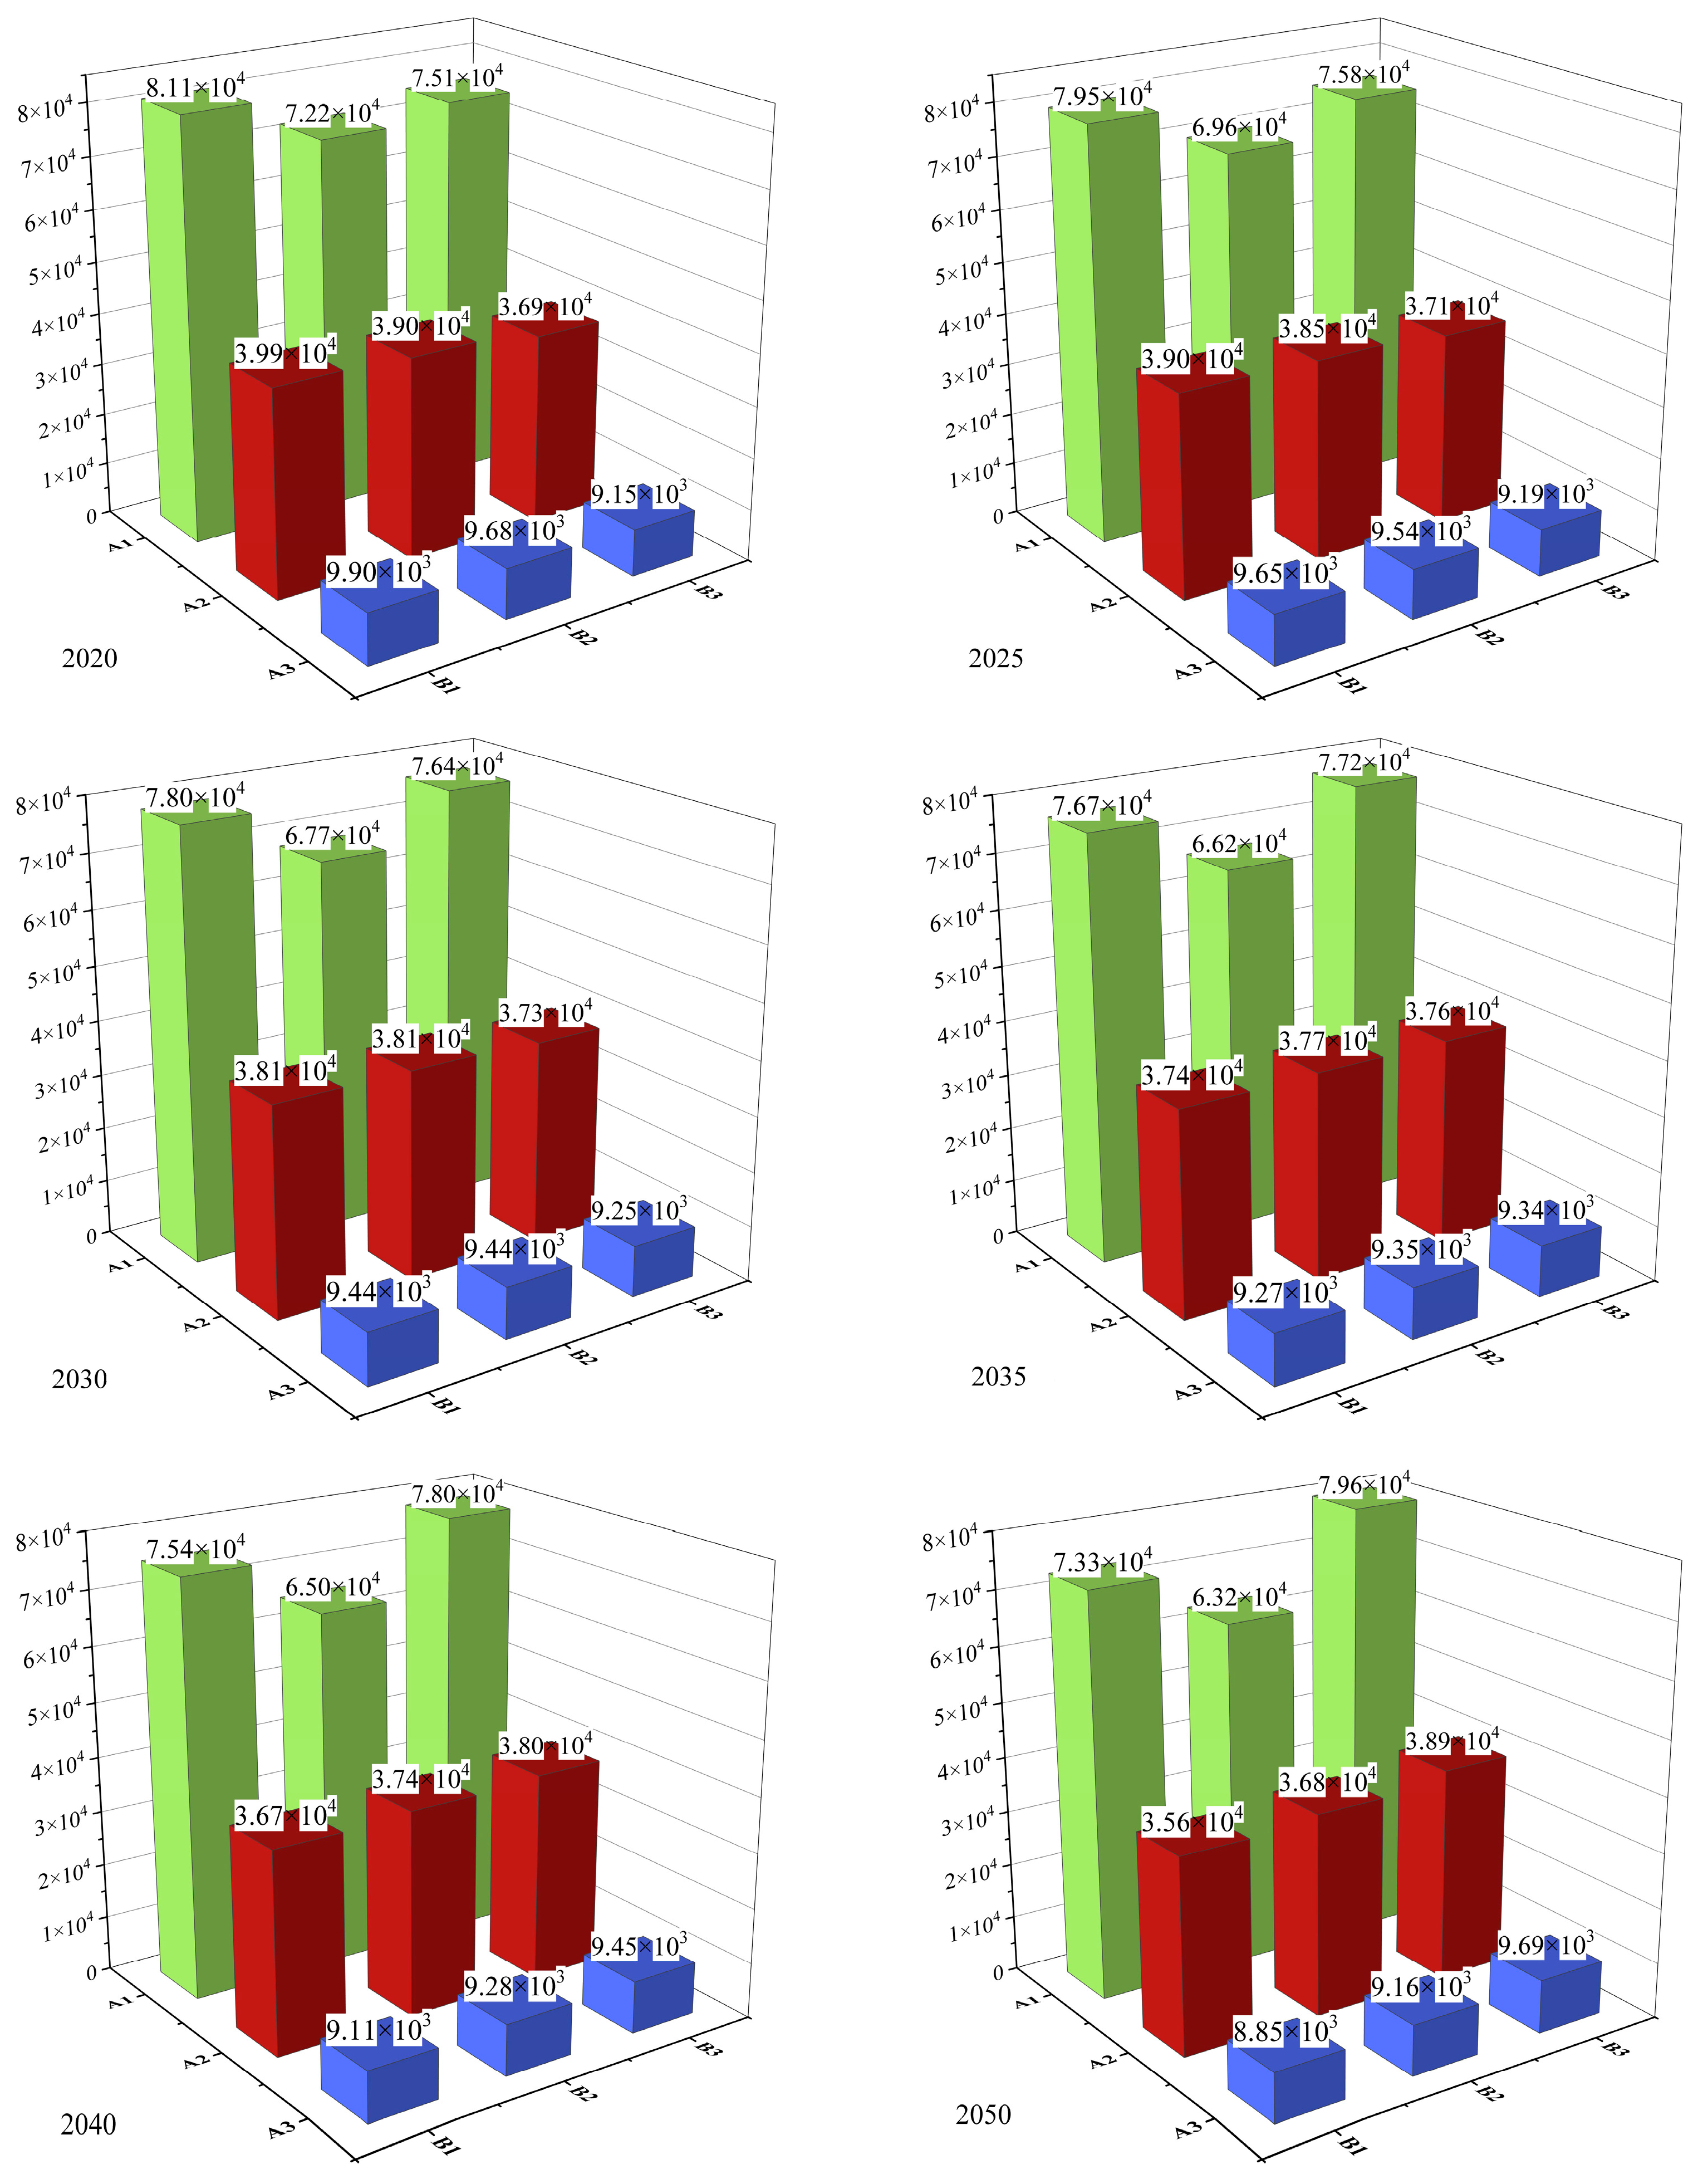
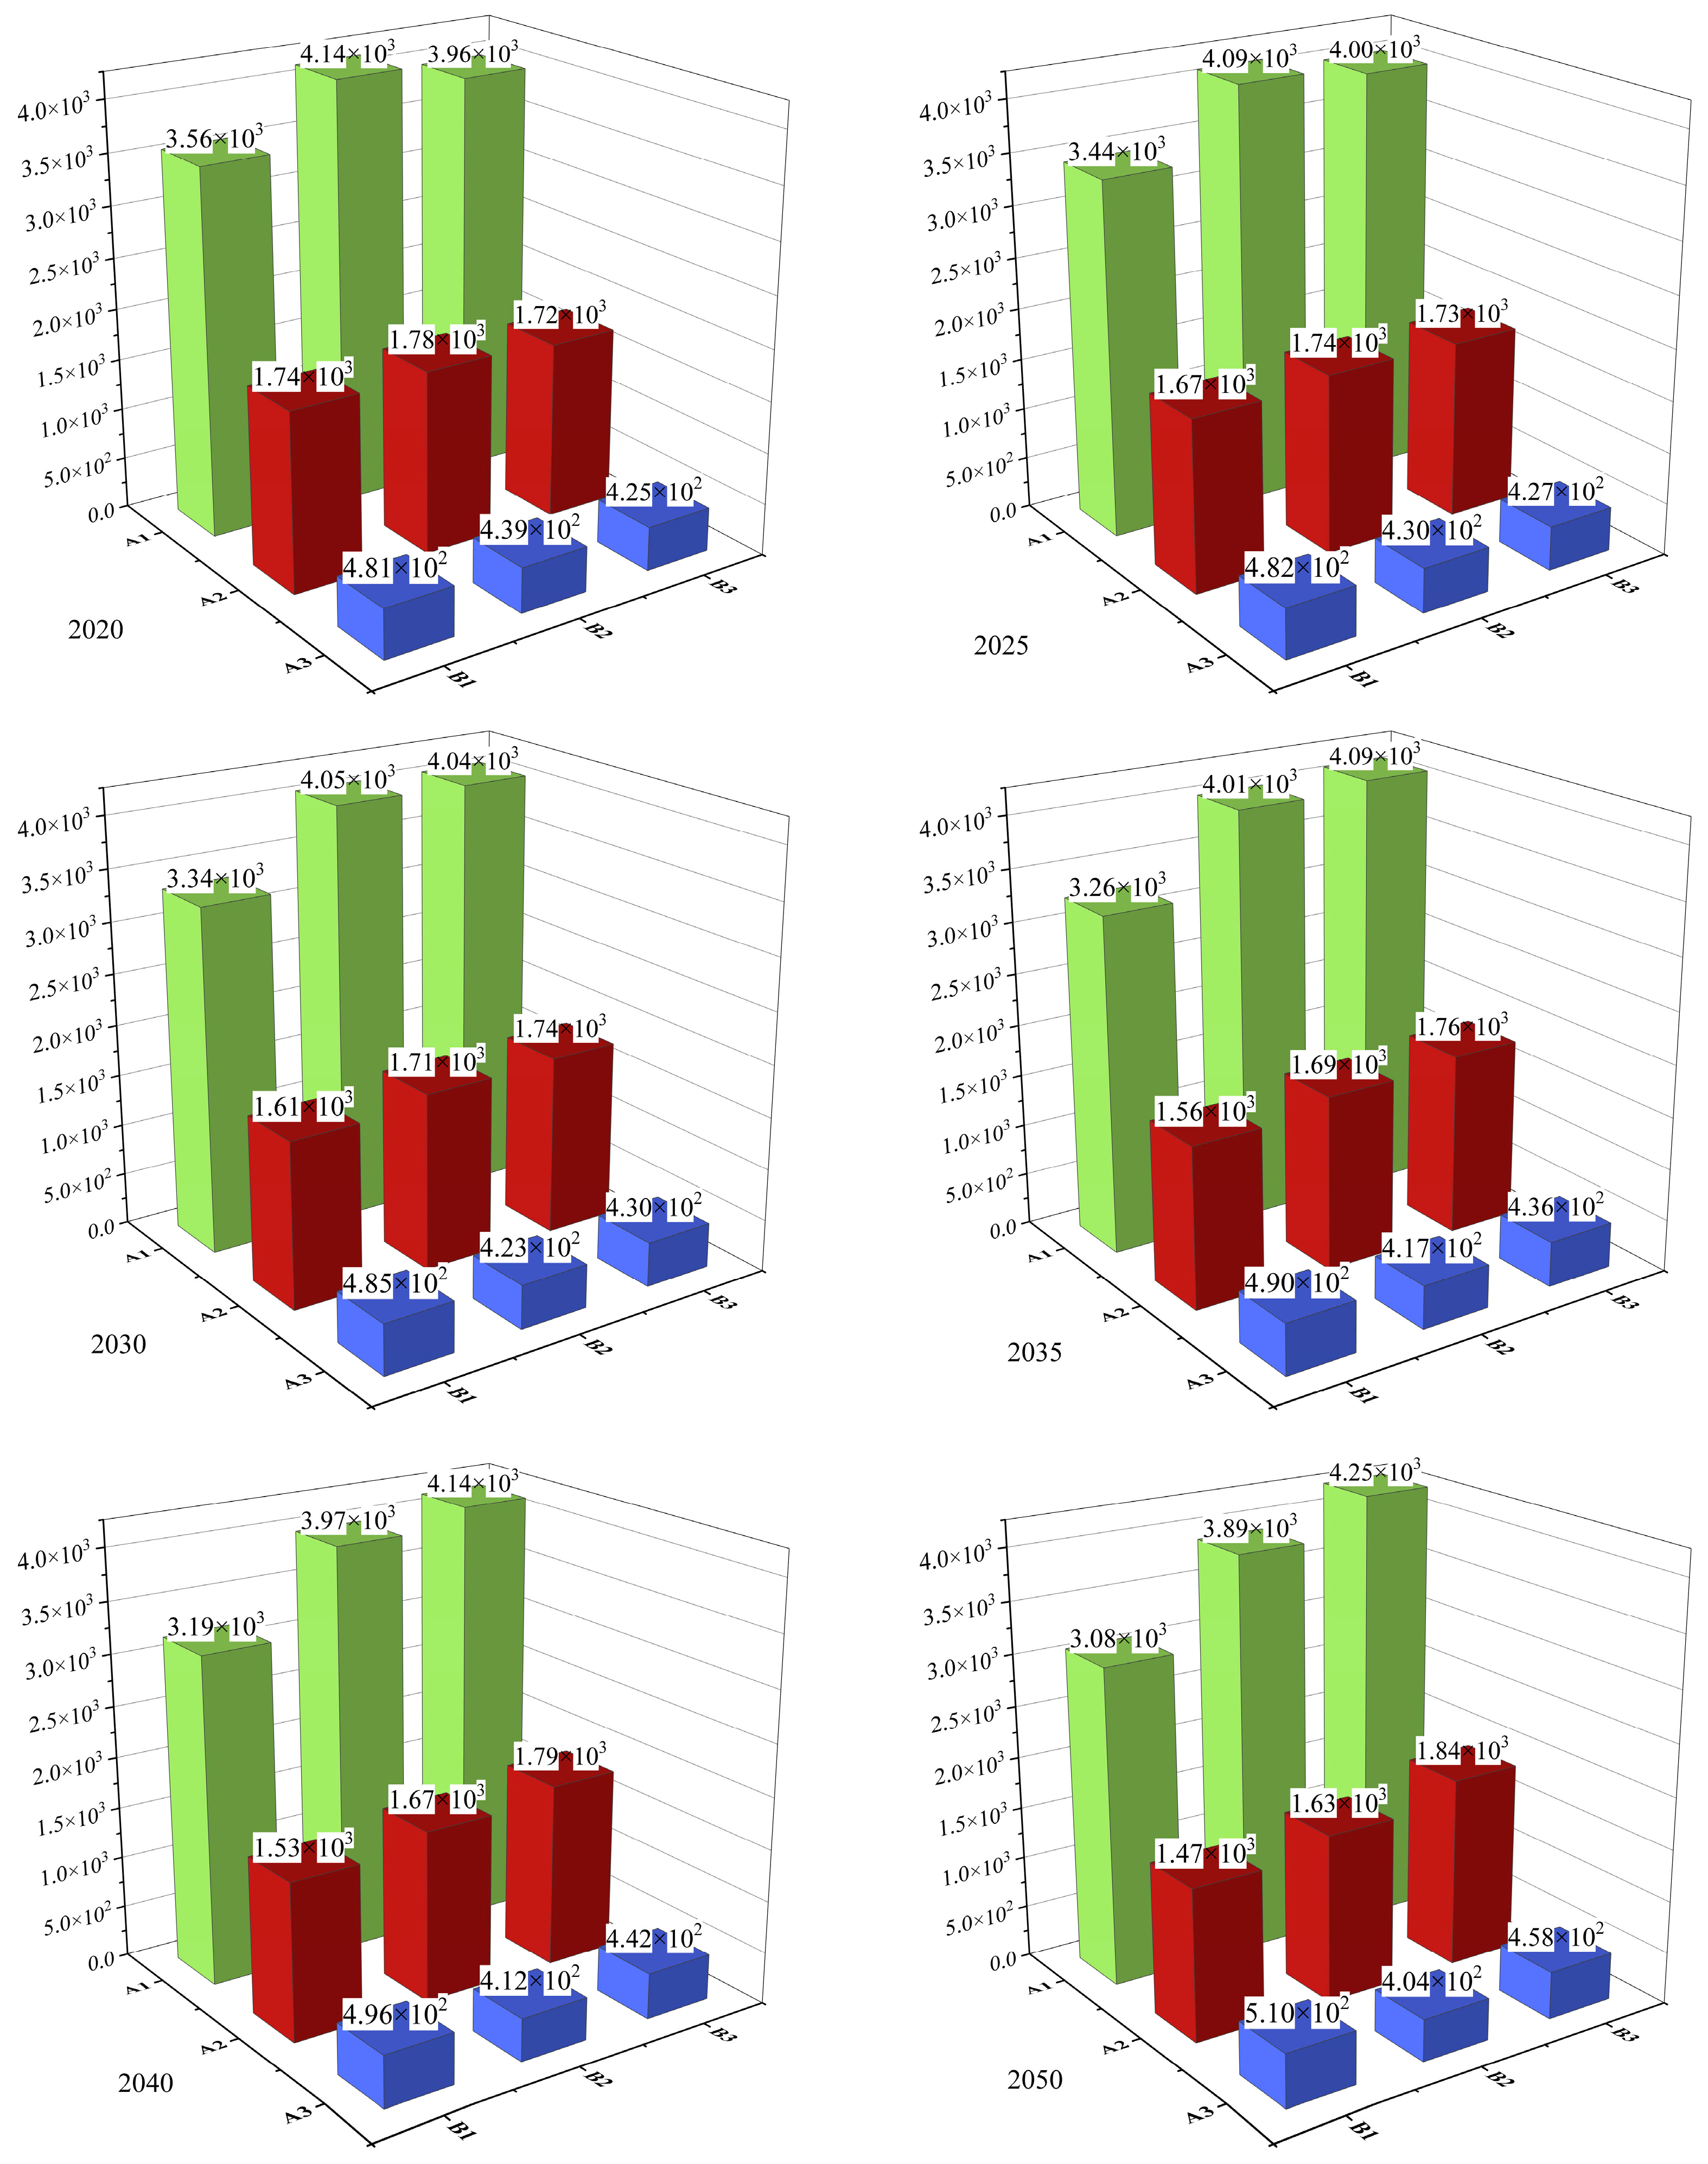
4.3. Modelling of NPS Pollution under Different Scenarios

Models simplify complex systems and aid in understanding specific issues [35]. While various types predict NPS pollution, like Stormwater Management Models (SWMM), Soil and Water Assessment Tools [64], and Geographic Information System (GIS) models [65], SD models are transparent, participatory, and cost less in time and money. However, SD modeling offers the additional advantage of focusing on comparing different scenarios rather than making precise predictions [64,66,67]. Under the status quo continuum scenario, the pollution load value of COD was consistently higher than that of NH3-N, and therefore, COD was the main limiting factor for agricultural NPS pollution in the Nansi Lake Basin. From the simulation results under the A1B3 scenario, the total COD and NH3-N emissions in the region will continue to rise rapidly from 2021 to 2050 if we do not intensify our efforts to combat agricultural NPS pollution and only pursue the economic benefits of high growth. Despite the small increase in fertilizer nitrogen use, agricultural cultivation is still the largest contributor to nitrogen pollution, and because of the rapid expansion of the scale of farming, the local capacity to treat and comprehensively utilize livestock and poultry pollutants is simply not able to meet the realistic demand for emissions, livestock, and poultry farming may become the largest source of nitrogen pollution growth in the future. Policies aimed at reducing emissions from pollution sources include reducing water quotas for urban residents and industrial value-added, adjusting coefficients for residential and industrial effluent discharge, and increasing sewage treatment plant efficiency rates. This aligns with findings from previous studies [68]. To mitigate agricultural runoff pollution, reducing the net irrigation quota for rice and increasing the irrigation water use coefficient proved more effective in reducing pollutants entering the river. This finding is consistent with the research by Zhang et al. [2]. Observing NH3-N levels entering the lake under different scenarios revealed that the connectivity of rural domestic sewers and the efficiency of sewage treatment facilities significantly influence the amount of domestic sewage discharged into the river. Rural areas discharge a substantial proportion of pollutants, aligning with findings by Sušnik et al. [38]. Future water environment management in the basin should prioritize expanding the sewage network’s coverage area and enhancing sewage collection and treatment rates [69]. The ability to respond to extreme events can be strengthened by simulating NPS source pollution conditions under different scenarios through the SD model. The research enables better prediction of and response to trends in NPS pollution under extreme conditions, leading to the development of appropriate buffer measures and policies. However, the complexity of NPS pollution makes it difficult to address through a single measure, and in-depth studies provide basic data for the formulation of scientific and comprehensive policies and regulations. For example, by assessing the impacts of different pollution sources on water quality, it is possible to prioritize the reduction of pollutants and prompt local governments or industries to adopt more precise management practices to comply with environmental protection standards [39].

4.4. Study Limitations and Future Directions

To address the problem of NPS pollution management in the Nansi Lake Basin, the SD method was used to elaborate the relationship between rural living subsystems, planting subsystems, and animal husbandry subsystems to construct a simulation model of NPS pollution in the Nansi Lake Basin, to study the intrinsic operation mechanism of the NPS pollution system, and to explore the impacts of different scenarios on the NPS pollution in the Nansi Lake Basin. However, in order to better provide new ideas for future research, the following limitations should be noted [70]. In the optimization process of this model, although the model parameters can be increased or decreased arbitrarily, there is a certain reasonable range of parameter adjustments, and values beyond this range will have no practical significance, so it is not so easy to realize the optimization of the scenarios in the SD model, and it is necessary to combine it with other relevant analysis techniques. It should also be noted that the ECM and the IECM are empirical models, and the export coefficients are influenced by rainfall, topography, soil type, etc. Therefore, the relationship between the export coefficients and their influencing factors needs to be evaluated in future studies [2,3,71].

5. Conclusions

In this study, the loading characteristics spatial and temporal evolution patterns of two NPS pollutants, COD and NH3-N, were quantitatively assessed from 2010 to 2020 in the Nansi Lake Basin as an example. Based on the investigation of the regional prevention and control strategies and technological systems of the agricultural NPS pollution, a SD simulation model was constructed to simulate and analyse the NPS pollution under different development and treatment scenarios. The simulation analysis was carried out. The current status of NPS pollution load in the Nansi Lake Basin is poor, and the level of pollution load is high, with obvious geographical differences. From 2010 to 2020, the pollution loads of both pollutants showed a decreasing trend, among which the pollution load of NH3-N showed the greatest change, decreasing by 27.51% during the 11-year period. The spatial distribution of each pollutant is somewhat similar, with smaller pollution loads in Jining and Zaozhuang and relatively larger pollution loads in Heze and Ningyang. From 2010 to 2020, the main sources of NH3-N pollution from NPS pollution in the region were rural living and livestock farming. Therefore, improving the village sewage system and efficiently treating the rural farming sewage system are of great significance for the management of NPS pollution in the Nansi Lake Basin. Under the status quo continuous scenario, the pollution load value of COD is always higher than that of NH3-N, so COD is the main limiting factor for agricultural NPS pollution in the Nansi Lake Basin.

Author Contributions

Conceptualization, M.J.; Methodology, J.L., C.L., M.X., S.W., L.Y. and B.Z.; Software, J.L., C.L. and L.Y.; Resources, M.X. and M.L.; Data curation, M.L., M.J. and S.W.; Writing—original draft, J.L. and B.Z.; Writing—review and editing, B.Z.; Funding acquisition, L.Y. and B.Z. All authors have read and agreed to the published version of the manuscript.

Funding

This research was funded by Baolei Zhang grant number ZR2021ME203, funded by Le Yin grant number ZR2021QD127, and funded by Le Yin grant number 42201308. Moreover, this research was also funded by the Shandong Province Undergraduate Teaching Reform Project (Z20220004) and Jinan City-School Integration Project (JNSX2023036).

Informed Consent Statement

Informed consent was obtained from all subjects involved in the study. Written informed consent has been obtained from the patient(s) to publish this paper.

Data Availability Statement

The original contributions presented in the study are included in the article, further inquiries can be directed to the corresponding author/s.

Conflicts of Interest

The authors declare no conflicts of interest.

References

  1. Cai, Y.; Rong, Q.; Yang, Z.; Yue, W.; Tan, Q. An export coefficient based inexact fuzzy bi-level multi-objective programming model for the management of agricultural nonpoint source pollution under uncertainty. J. Hydrol. 2018, 557, 713–725. [Google Scholar] [CrossRef]
  2. Zhang, B.-L.; Cui, B.-H.; Zhang, S.-M.; Wu, Q.-Y.; Yao, L. Source apportionment of nitrogen and phosphorus from non-point source pollution in Nansi Lake Basin, China. Environ. Sci. Pollut. Res. 2018, 25, 19101–19113. [Google Scholar] [CrossRef]
  3. Guo, J.; Zuo, P.; Yang, L.; Pan, Y.; Wang, L. Quantitative identification of non-point sources of nitrate in urban channels based on dense in-situ samplings and nitrate isotope composition. Chemosphere 2021, 263, 128219. [Google Scholar] [CrossRef] [PubMed]
  4. Corwin, L.D. Non-point Pollution Modeling Based on GIS. Soil Water Conserv. 1998, 1, 75–88. [Google Scholar]
  5. Li, Y.; Wang, H.; Deng, Y.; Liang, D.; Li, Y.; Gu, Q. Applying water environment capacity to assess the non-point source pollution risks in watersheds. Water Res. 2023, 240, 120092. [Google Scholar] [CrossRef] [PubMed]
  6. Zhao, X.; Shi, J.; Xue, L.; Li, W.; Zamanian, K.; Han, J.; Chen, S. Water Point and Non-Point Nitrogen Pollution Due to Land-Use Change and Nitrate Deposition in China from 2000 to 2020. Water 2024, 16, 1396. [Google Scholar] [CrossRef]
  7. Corwin, L.D.; Loague, K.M. Applications of GIS to the Modeling of Non-Point Source Pollutants in the Vadose Zone; Bouyoucos Conference 1995: Riverside, CA, USA; Soil Science Society of America: Madison, WI, USA, 1996. [Google Scholar]
  8. Griffin, R., Jr. Introducing NPS water pollution. EPA J. 1991, 17, 6–9. [Google Scholar]
  9. Lena, B.V. Nutrient Preserving in Riverine Transitional Strip. J. Hum. Environ. 1994, 3, 342–347. [Google Scholar]
  10. Foy, R.H. The contribution of agricultural phosphorus to eutrophication. Proc.-Fertil. Soc. 2002, 365, 1–32. [Google Scholar]
  11. Kronvang, B.; Græsbøll, P.; Larsen, S.E.; Svendsen, L.M. Diffuse nutrient losses in Denmark. Water Sci. Technol. 1996, 33, 81–88. [Google Scholar] [CrossRef]
  12. Boers, P.C. Nutrient emissions from agriculture in the Netherlands, causes and remedies. Water Sci. Technol. 1996, 33, 183–189. [Google Scholar] [CrossRef]
  13. Chang, M.; McBroom, M.W.; Beasley, R.S. Roofing as a source of nonpoint water pollution. J. Environ. Manag. 2004, 73, 307–315. [Google Scholar] [CrossRef]
  14. Zou, L.; Liu, Y.; Wang, Y.; Hu, X. Assessment and analysis of agricultural non-point source pollution loads in China: 1978–2017. J. Environ. Manag. 2020, 263, 110400. [Google Scholar] [CrossRef]
  15. Schaffner, M.; Bader, H.-P.; Scheidegger, R. Modeling the contribution of point sources and non-point sources to Thachin River water pollution. Sci. Total Environ. 2009, 407, 4902–4915. [Google Scholar] [CrossRef] [PubMed]
  16. Ongley, E.D.; Xiaolan, Z.; Tao, Y. Current status of agricultural and rural non-point source Pollution assessment in China. Environ. Pollut. 2010, 158, 1159–1168. [Google Scholar] [CrossRef]
  17. Duncan, R. Regulating agricultural land use to manage water quality: The challenges for science and policy in enforcing limits on non-point source pollution in New Zealand. Land Use Policy 2014, 41, 378–387. [Google Scholar] [CrossRef]
  18. Chang, X.; Jia, Z.; Feng, J.; Duan, T.; Li, Y.X. Refining the diagnostics of non-point source metals pollution to urban lakes based on interaction normalized PMF coupled with Bayesian network. Environ. Pollut 2022, 304, 119194. [Google Scholar] [CrossRef] [PubMed]
  19. Guo, W.; Fu, Y.; Ruan, B.; Ge, H.; Zhao, N. Agricultural non-point source pollution in the Yongding River Basin. Ecol. Indic. 2014, 36, 254–261. [Google Scholar] [CrossRef]
  20. Li, C.-H.; Wang, Y.-K.; Ye, C.; Wei, W.-W.; Zheng, B.-H.; Xu, B. A proposed delineation method for lake buffer zones in watersheds dominated by non-point source pollution. Sci. Total Environ. 2019, 660, 32–39. [Google Scholar] [CrossRef]
  21. Wang, S.; Wang, Y.; Wang, Y.; Wang, Z. Assessment of influencing factors on non-point source pollution critical source areas in an agricultural watershed. Ecol. Indic. 2022, 141, 109084. [Google Scholar] [CrossRef]
  22. Wang, W.; Chen, L.; Shen, Z. Dynamic export coefficient model for evaluating the effects of environmental changes on non-point source pollution. Sci. Total Environ. 2020, 747, 141164. [Google Scholar] [CrossRef]
  23. Li, H.; Zhang, J.; Zhang, S.; Zhang, W.; Zhang, S.; Yu, P.; Song, Z. A framework to assess spatio-temporal variations of potential non-point source pollution risk for future land-use planning. Ecol. Indic. 2022, 137, 108751. [Google Scholar] [CrossRef]
  24. Rudra, R.; Dickinson, W.; Euw, E.V. The Importance of Precise Rainfall Inputs in Nonpoint Source Pollution Modeling. Environ. Sci. Trans. ASABE 1993, 36, 44. [Google Scholar] [CrossRef]
  25. Xue, J.; Wang, Q.; Zhang, M. A review of non-point source water pollution modeling for the urban–rural transitional areas of China: Research status and prospect. Sci. Total Environ. 2022, 826, 154146. [Google Scholar] [CrossRef]
  26. Tiyasha; Tung, T.M.; Yaseen, Z.M. A survey on river water quality modelling using artificial intelligence models: 2000–2020. J. Hydrol. 2020, 585, 124670. [Google Scholar] [CrossRef]
  27. Amin, M.G.M.; Veith, T.L.; Collick, A.S.; Karsten, H.D.; Buda, A.R. Simulating hydrological and nonpoint source pollution processes in a karst watershed: A variable source area hydrology model evaluation. Agric. Water Manag. 2017, 180, 212–223. [Google Scholar] [CrossRef]
  28. Shah, V.; Shen, Z.; Chen, L.; Hong, Q.; Xie, H.; Qiu, J.; Liu, R. Vertical Variation of Nonpoint Source Pollutants in the Three Gorges Reservoir Region. PLoS ONE 2013, 8, e71194. [Google Scholar] [CrossRef]
  29. Islam, F.; Lian, Q.; Ahmad, Z.U.; Zappi, M.E.; Yao, L.; Gang, D.D. Nonpoint Source Pollution. Water Environ. Res. 2018, 90, 1872–1898. [Google Scholar] [CrossRef] [PubMed]
  30. Nobre, R.L.G.; Caliman, A.; Cabral, C.R.; Araújo, F.d.C.; Guérin, J.; Dantas, F.d.C.C.; Quesado, L.B.; Venticinque, E.M.; Guariento, R.D.; Amado, A.M.; et al. Precipitation, landscape properties and land use interactively affect water quality of tropical freshwaters. Sci. Total Environ. 2020, 716, 137044. [Google Scholar] [CrossRef] [PubMed]
  31. Sarkar, S.; Yonce, H.N.; Keeley, A.; Canfield, T.J.; Butcher, J.B.; Paul, M.J. Integration of SWAT and HSPF for Simulation of Sediment Sources in Legacy Sediment-Impacted Agricultural Watersheds. JAWRA J. Am. Water Resour. Assoc. 2019, 55, 497–510. [Google Scholar] [CrossRef] [PubMed]
  32. Liu, R.M.; Yang, Z.F.; Ding, X.W.; Shen, Z.Y.; Wu, X.; Liu, F. Effect of Land Use/Cover Change on Pollution Load of Non-Point Source in Upper Reach of Yangtze River Basin. Environ. Sci. 2006, 12, 2407–2414. [Google Scholar]
  33. Johnes, P.J. Evaluation and management of the impact of land use change on the nitrogen and phosphorus load delivered to surface waters: The export coefficient modelling approach. J. Hydrol. 1996, 183, 3–4. [Google Scholar] [CrossRef]
  34. Rudra, R.P.; Mekonnen, B.A.; Shukla, R.; Shrestha, N.K.; Goel, P.K.; Daggupati, P.; Biswas, A. Currents Status, Challenges, and Future Directions in Identifying Critical Source Areas for Non-Point Source Pollution in Canadian Conditions. Agriculture 2020, 10, 468. [Google Scholar] [CrossRef]
  35. Hui, D.; Kuai, P.; Li, W.; Liu, N. Evaluating the Effects of Land Use Planning for Non-Point Source Pollution Based on a System Dynamics Approach in China. PLoS ONE 2015, 10, e0135572. [Google Scholar] [CrossRef]
  36. Guan, D.; Gao, W.; Su, W.; Li, H.; Hokao, K. Modeling and dynamic assessment of urban economy–resource–environment system with a coupled system dynamics–geographic information system model. Ecol. Indic. 2011, 11, 1333–1344. [Google Scholar] [CrossRef]
  37. Shen, Q.; Chen, Q.; Tang, B.-S.; Yeung, S.; Hu, Y.; Cheung, G. A system dynamics model for the sustainable land use planning and development. Habitat Int. 2009, 33, 15–25. [Google Scholar] [CrossRef]
  38. Sušnik, J.; Vamvakeridou-Lyroudia, L.S.; Savić, D.A.; Kapelan, Z. Integrated System Dynamics Modelling for water scarcity assessment: Case study of the Kairouan region. Sci. Total Environ. 2012, 440, 290–306. [Google Scholar] [CrossRef]
  39. Zhang, B.; Le, Y.; Zhang, S.; Bernard, E.; Lawrence, T. GIS and L-THIA Based Analysis on Variations of Non-point Pollution in Nansi Lake Basin, China. J. Donghua Univ. Engl. Ed. 2016, 33, 851–858. [Google Scholar]
  40. Yanan, W.; Kun, Z.; Baolei, Z. Effects of Wlater Polutant Emission Standard in Watersheds of South-to-North Water Diversion Project on Economy of Cities along the Water Transfer Line in Shandong Province. South-North Water Transf. Water Sci. Technol. 2013, 11, 81–85. [Google Scholar]
  41. Bureau, B.S. Beijing Statistical Yearbook; China Statistics Press: Beijing, China, 2021. [Google Scholar]
  42. Worrall, F.; Burt, T.P. The impact of land-use change on water quality at the catchment scale: The use of export coefficient and structural models. J. Hydrol. 1999, 221, 75–90. [Google Scholar] [CrossRef]
  43. Wang, Y.; Liang, J.; Yang, J.; Ma, X.; Li, X.; Wu, J.; Yang, G.; Ren, G.; Feng, Y. Analysis of the environmental behavior of farmers for non-point source pollution control and management: An integration of the theory of planned behavior and the protection motivation theory. J. Environ. Manag. 2019, 237, 15–23. [Google Scholar] [CrossRef]
  44. Cheng, X.; Chen, L.; Sun, R.; Jing, Y. An improved export coefficient model to estimate non-point source phosphorus pollution risks under complex precipitation and terrain conditions. Environ. Sci. Pollut. Res. 2018, 25, 20946–20955. [Google Scholar] [CrossRef] [PubMed]
  45. Rui, Z. Characteristics of Non-Point Source Pollution Load and Its Influence on Water Quality in Ciyao River Basin. Master’s Thesis, Taiyuan University of Technology, Taiyuan, China, 2022. [Google Scholar] [CrossRef]
  46. Shuo, W. Simulation Study on Contribution of Agricultural Non-pointSource Pollution to Pollution Load in Wang-Beng Section of Huaihe River Basin. Master’s Thesis, Anhui University of Science and Technology, Huainan, China, 2021. [Google Scholar] [CrossRef]
  47. Xia, Y.C.; Yuan, Y.B.; Zhan, L.; He, C.; Xia, J.X. Refined Estimation and Empirical Study of Non-point Source Pollution Load in Small Watershed. A Case Study of langhua River Basin Chengdu. J. Chang. River Sci. Res. Inst. 2024, 41, 55–61+69. [Google Scholar]
  48. Chen, Y.; Yuan, Q.; Han, F.; Zhou, L.; Hong, S. Estimation of Non-point Source Pollution Load of Yangtze Watershed Based on Improved Export Coefficient Model. J. Geomat. 2017, 42, 96–99+104. [Google Scholar]
  49. Han, R. Study on the Characteristics and Control of Non-Point Source Pollution in the Hanjiang River Basin Take the Yangxian Section above as an Example. Master’s Thesis, Xi’an University of Technology, Xi’an, China, 2021. [Google Scholar] [CrossRef]
  50. Gong, S.F.; Ding, W.H.; Ju, X.H.; Xiao, N.W.; Ye, Q.S.; Huang, J.; Li, H. Source Analysis and Control Strategies of Non-Point Source Pollution in Typica Agricultural Small Watershed: A Case Study of Danjiangkou Water Conservation Area. Sci. Agric. Sin. 2021, 54, 3919–3931. [Google Scholar]
  51. Phan, T.D.; Bertone, E.; Stewart, R.A. Critical review of system dynamics modelling applications for water resources planning and management. Clean. Environ. Syst. 2021, 2, 100031. [Google Scholar] [CrossRef]
  52. Wilkins, A.K.; Tidor, B.; White, J.; Barton, P.I. Sensitivity Analysis for Oscillating Dynamical Systems. SIAM J. Sci. Comput. 2009, 31, 2706–2732. [Google Scholar] [CrossRef] [PubMed]
  53. Zhu, C.; Li, Y. Long-term hydrological impacts of land use/land cover change from 1984 to 2010 in the Little River Watershed, Tennessee. Int. Soil Water Conserv. Res. 2014, 2, 11–22. [Google Scholar] [CrossRef]
  54. Abdulkareem, J.H.; Sulaiman, W.N.A.; Pradhan, B.; Jamil, N.R. Long-Term Hydrologic Impact Assessment of Non-point Source Pollution Measured Through Land Use/Land Cover (LULC) Changes in a Tropical Complex Catchment. Earth Syst. Environ. 2018, 2, 67–84. [Google Scholar] [CrossRef]
  55. Ouyang, W.; Wu, Y.; Hao, Z.; Zhang, Q.; Bu, Q.; Gao, X. Combined impacts of land use and soil property changes on soil erosion in a mollisol area under long-term agricultural development. Sci. Total Environ. 2018, 613–614, 798–809. [Google Scholar] [CrossRef]
  56. Wu, L.; Long, T.-y.; Liu, X.; Guo, J.-s. Impacts of climate and land-use changes on the migration of non-point source nitrogen and phosphorus during rainfall-runoff in the Jialing River Watershed, China. J. Hydrol. 2012, 475, 26–41. [Google Scholar] [CrossRef]
  57. Cheng, J.; Lee, X.; Tang, Y.; Pan, W.; Gao, W.; Chen, Y.; Wang, B.; Cheng, H. Changes in above- and below-ground nitrogen stocks and allocations following the conversion of farmland to forest in rocky desertification regions. Agric. Ecosyst. Environ. 2016, 232, 9–16. [Google Scholar] [CrossRef]
  58. Guan, D.; Zhao, Z.; Tan, J. Dynamic simulation of land use change based on logistic-CA-Markov and WLC-CA-Markov models: A case study in three gorges reservoir area of Chongqing, China. Environ. Sci. Pollut. Res. 2019, 26, 20669–20688. [Google Scholar] [CrossRef]
  59. Rozos, E.; Dimitriadis, P.; Bellos, V. Machine Learning in Assessing the Performance of Hydrological Models. Hydrology 2021, 9, 5. [Google Scholar] [CrossRef]
  60. Niraula, R.; Kalin, L.; Srivastava, P.; Anderson, C.J. Identifying critical source areas of nonpoint source pollution with SWAT and GWLF. Ecol. Model. 2013, 268, 123–133. [Google Scholar] [CrossRef]
  61. Li, L.; Gou, M.; Wang, N.; Ma, W.; Xiao, W.; Liu, C.; La, L. Landscape configuration mediates hydrology and nonpoint source pollution under climate change and agricultural expansion. Ecol. Indic. 2021, 129, 107959. [Google Scholar] [CrossRef]
  62. Wu, J.; Lu, J. Landscape patterns regulate non-point source nutrient pollution in an agricultural watershed. Sci. Total Environ. 2019, 669, 377–388. [Google Scholar] [CrossRef]
  63. Shang, X.; Wang, X.; Zhang, D.; Chen, W.; Chen, X.; Kong, H. An improved SWAT-based computational framework for identifying critical source areas for agricultural pollution at the lake basin scale. Ecol. Model. 2012, 226, 1–10. [Google Scholar] [CrossRef]
  64. Araujo-Pradere, E.A.; Fuller-Rowell, T.J. STORM: An empirical storm-time ionospheric correction model 2. Validation. Radio Sci. 2002, 37. [Google Scholar] [CrossRef]
  65. Maillard, P.; Pinheiro Santos, N.A. A spatial-statistical approach for modeling the effect of non-point source pollution on different water quality parameters in the Velhas river watershed–Brazil. J. Environ. Manag. 2008, 86, 158–170. [Google Scholar] [CrossRef]
  66. Polyakov, V.; Fares, A.; Kubo, D.; Jacobi, J.; Smith, C. Evaluation of a non-point source pollution model, AnnAGNPS, in a tropical watershed. Environ. Model. Softw. 2007, 22, 1617–1627. [Google Scholar] [CrossRef]
  67. Wu, S.; Bashir, M.A.; Raza, Q.-U.-A.; Rehim, A.; Geng, Y.; Cao, L. Application of riparian buffer zone in agricultural non-point source pollution control—A review. Front. Sustain. Food Syst. 2023, 7, 985870. [Google Scholar] [CrossRef]
  68. Wang, K.; Lin, Z. Characterization of the nonpoint source pollution into river at different spatial scales. Water Environ. J. 2018, 32, 453–465. [Google Scholar] [CrossRef]
  69. Huang, C.; Zhao, D.; Fan, X.; Liu, C.; Zhao, G. Landscape dynamics facilitated non-point source pollution control and regional water security of the Three Gorges Reservoir area, China. Environ. Impact Assess. Rev. 2022, 92, 106696. [Google Scholar] [CrossRef]
  70. Jin, B.; Liu, X.; Tan, J.; Shao, X.; Cheng, J. Effect of Plant Buffer Zone–Antifouling Curtain Wall on Reducing Non-Point Source Pollution in Paddy Fields, China. Sustainability 2022, 14, 44. [Google Scholar] [CrossRef]
  71. Lencha, S.M.; Ulsidso, M.D.; Muluneh, A. Evaluation of Seasonal and Spatial Variations in Water Quality and Identification of Potential Sources of Pollution Using Multivariate Statistical Techniques for Lake Hawassa Watershed, Ethiopia. Appl. Sci. 2021, 11, 8991. [Google Scholar] [CrossRef]
Figure 1. Location map of the study area (Source of figure: produced by the author).
Sustainability 16 07831 g001
Figure 2. Location map of the study area (Source of figure: produced by the author).
Sustainability 16 07831 g002
Figure 3. Spatial and temporal distribution of COD NPS pollution loads in the Nansi Lake Basin (Source of figure: produced by the author).
Sustainability 16 07831 g003
Figure 4. Spatial and temporal distribution of NH3-N NPS pollution loads in the Nansi Lake Basin (Source of figure: produced by the author).
Sustainability 16 07831 g004
Figure 5. Sources of COD and NH3-N NPS pollution in the Nansi Lake Basin (Source of figure: produced by the author).
Sustainability 16 07831 g005
Figure 6. Sensitivity analysis of the rural livelihood subsystem (Source of figure: produced by the author).
Sustainability 16 07831 g006
Figure 7. Sensitivity analysis of the plantation subsystem (Source of figure: produced by the author).
Sustainability 16 07831 g007
Figure 8. Sensitivity analysis of the livestock and poultry farming subsystem (Source of figure: produced by the author).
Sustainability 16 07831 g008
Figure 9. Sensitivity analysis of actual emissions pollution (Source of figure: produced by the author).
Sustainability 16 07831 g009
Figure 10. Scenario matrix for COD loads in the Nansi Lake Basin for significant years (Source of figure: produced by the author).
Sustainability 16 07831 g010
Figure 11. Scenario matrix for NH3-N loads in the Nansi Lake Basin for significant years (Source of figure: produced by the author).
Sustainability 16 07831 g011
Figure 12. The relationship between actual and simulation value of NPS pollution (Source of figure: produced by the author).
Sustainability 16 07831 g012
Table 1. Natural geography of the study area.
NameAnnual Precipitation/mmMonitoring Cross SectionRunoff Volume/108 m3Land Use Share in 2020
Dongyu River647.90Xiyao0.30CL 80%, BL 17%
Wanfu River660.40Gaohe Bridge0.10CL 81%, BL 15%
Zhuzhaoxin River645.80Yulou0.60CL 78%, BL 17%
Zhushui River682.50105 Road Bridge0.10CL 78%, BL 15%, GL 4%
Liangji River682.50Liji0.70CL 80%, BL 15%
Guangfu River682.50Xishifo0.70CL 80%, BL 17%
Si River773.80Yingou0.60CL 64%, BL 12%, GL 14%, WL 7%
Baima River682.50Malou0.40CL 70%, BL 15%
Beisha River775.20Wangchao Bridge0.20CL 53%, BL 8%, GL27%, WL 5%
Chengguo River817.90Qunle Bridge1.10CL 56%, BL 14%, GL 20%, WL 5%
Xinxue River820.80Ruhukou2.40CL 41%, BL 9%, GL 31%, WL 15%
Note: CL is cropland; GL is grassland; BL is construction land; WL is Forest. Source of table: produced by the author.
Table 2. Other relevant studies on the value of export coefficients for different land use types: kg/(hm2·a).
Study AreaPollutantsExport Coefficient ValueReferences
CroplandForestGrasslandConstructionWaterUnused Land
Ciyao River BasinCOD58.0014.0015.0094.007.0020.00Zhang [45]
NH3-N1.891.170.501.361.492.04
Huai River BasinCOD28.0032.50----Wang [46]
NH3-N0.420.05----
Yanghua River BasinCOD24.5032.5018.00100.00--Xia et al. [47]
NH3-N0.400.750.801.10--
Yangtze River BasinCOD10.5216.1011.2339.0510.965.26Chen et al. [48]
NH3-N------
Han River BasinCOD18.6313.578.6127.835.96-Han [49]
NH3-N3.501.030.161.502.08-
Note: The data in this table are derived from the references and have been labeled in the table. Source of table: produced by the author.
Table 3. Other relevant studies on the value of export coefficients for different livestock and poultry farming and rural life: kg/a.
Study AreaPollutantsExport Coefficient ValueReferences
CattleGoatPigPoultryRural Living
Huai River BasinCOD-4.4030.001.1710.10Wang [46]
NH3-N-0.060.100.00340.16
Han River BasinCOD112.000.4411.340.1525.00Han [49]
NH3-N3.370.290.860.011.05
Danjiangkou Water Conservation AreaCOD7.960.444.910.2823.36Gong et al. [50]
NH3-N----
Note: The data in this table are derived from the references and have been labeled in the table. Source of table: produced by the author.
Table 4. The export coefficients are taken into account in this study.
TypesPollutantsUnitCODNH3-N
Rural livingRural peoplekg/a25.001.05
Livestock and poultry farmingCattlekg/a112.003.37
Goatkg/a0.440.29
Pigkg/a11.340.44
Poultrykg/a0.150.01
Pesticides and fertilizersPesticidekg/(hm2·a)0.860.06
Fertilizerkg/(hm2·a)11.520.78
Land useCroplandkg/(hm2·a)28.791.94
Forestkg/(hm2·a)19.040.75
Grasslandkg/(hm2·a)11.610.33
Constructionkg/(hm2·a)53.631.43
Waterkg/(hm2·a)7.971.79
Unused landkg/(hm2·a)12.632.04
Note: COD is fully referred to as chemical oxygen demand; NH3-N is fully referred to as ammonia nitrogen. The data in this table are derived from the references and have been labeled in the text. Source of table: produced by the author.
Table 5. NPS load in 2020 for counties in Nansi Lake Basin.
Counties (t/a)COD (t/a)NH3-N (t/a)NPS Load (t/a)
Rencheng County10,060.90457.5010,518.40
Yanzhou County6247.09293.356540.44
Weishan County12,984.69692.9713,677.66
Yutai County9738.09451.6610,189.75
Jinxiang County12,027.99617.0812,645.07
Jiaxiang County19,725.54869.5920,595.14
Wenshang County18,183.73788.5918,972.32
Sishui County16,894.99817.8817,712.88
Liangshan County31,763.751246.6933,010.45
Qufu County11,757.03571.6412,328.68
Zoucheng County20,286.72962.4721,249.19
Chengwu County17,868.32855.0618,723.37
Juye County27,026.501291.2728,317.77
Yuncheng County37,449.291666.2939,115.58
Juancheng County20,900.12970.0921,870.21
Cao County49,805.192226.9852,032.17
Shan County29,555.621387.5730,943.19
Dongming County25,884.241187.1727,071.41
Dingtao County16,443.87775.2917,219.16
Mudan County29,536.491353.1230,889.61
Shanting County16,301.12761.8717,062.98
Taierzhuang County11,354.88486.4411,841.32
Shizhong County8491.08369.728860.81
Xuecheng County10,446.59460.1510,906.74
Yicheng County13,428.50608.2014,036.70
Tengzhou County38,849.371715.6940,565.06
Ningyang County18,031.74822.3118,854.04
Total541,043.4224,706.62565,750.04
Note: COD is fully referred to as chemical oxygen demand; NH3-N is fully referred to as ammonia nitrogen, and NPS is fully referred to as a non-point source. Source of table: produced by the author.
Table 6. NPS pollution loads from different land use types in the Nansi Lake Basin.
YearCroplandForestGrassland
CODNH3-NCODNH3-NCODNH3-N
201062,650.794215.53542.8721.40393.4011.18
201151,071.913436.433243.83127.87330.969.40
201251,302.683451.963018.23118.98326.969.29
201356,381.153793.671824.7571.93341.119.69
201458,920.393964.531228.0148.41348.189.89
201561,459.634135.38631.2824.89355.2510.09
201655,593.833740.691697.3666.91334.569.51
201755,864.203758.891613.1463.59364.5810.36
201853,520.333601.182391.8894.29228.646.50
201947,064.683166.802852.22191.28147.494.19
202060,344.564060.351733.3028.91221.616.30
YearWaterConstructionUnused land
CODNH3-NCODNH3-NCODNH3-N
2010941.83210.8528,112.41749.643.990.65
20112317.80518.892,8417.98757.794.400.71
20122412.11540.0028,970.53772.524.840.78
20131600.89358.3930,130.76803.468.2912.67
20141195.28267.5930,710.88818.936.0813.49
2015789.67176.7931,290.99834.401.860.30
20161443.14323.0830,708.62818.876.722.70
20171410.72315.8230,669.83817.845.531.54
20181828.93409.4429,459.02785.5511.249.06
20192998.77671.325,799.79687.974.640.75
2020809.92181.3233,565.70895.060.950.15
Note: COD is fully referred to as chemical oxygen demand; NH3-N is fully referred to as ammonia nitrogen. Source of table: produced by the author.
Table 7. Scenario simulation parameter settings.
TypesVariable NameUnitCurrent ValueLow-SpeedMedium-SpeedHigh-Speed
Socio-economicRate of population change0.3800.200.60
Urbanization rate%24243040
Rate of change in GDP%4.82268
GDP investment rate in land rehabilitation1234
Livestock and poultryRate of change in large livestock farming−6.27−6−0.801
Rate of change in poultry farming−1−0.90−0.801
Rate of change in sheep farming−7.95−7−0.801
Rate of change in pig farming−2.20−2−0.801
Pollution managementRate of change in pesticide use per acre%−5.58−10−15−30
Rate of change in fertilizer use per acre%−0.37−1−5−8
Livestock and poultry farming pollution treatment rate on a large scale%50608095
GDP investment share of agricultural NPS pollution351015
Weighting of soil testing and fertilizer application%50608095
Note: GDP is fully referred to as Gross Domestic Product. Source of table: produced by the author.
Disclaimer/Publisher’s Note: The statements, opinions and data contained in all publications are solely those of the individual author(s) and contributor(s) and not of MDPI and/or the editor(s). MDPI and/or the editor(s) disclaim responsibility for any injury to people or property resulting from any ideas, methods, instructions or products referred to in the content.

