Article

Effects of Industrial Structure on the Green Utilization Efficiency of Urban Land: A Case Study of the Bohai Rim Region, China

College of Geography and Environment, Shandong Normal University, Jinan 250358, China
*
Author to whom correspondence should be addressed.
Sustainability 2024, 16(17), 7832; https://doi.org/10.3390/su16177832
Submission received: 21 July 2024 / Revised: 31 August 2024 / Accepted: 5 September 2024 / Published: 8 September 2024

Abstract

:
The green utilization of urban land is a critical component of regional high-quality development. Enhancing the green utilization efficiency of urban land (GUEUL) is of great significance to improving the quality of ecological environment and achieving a green lifestyle and low-carbon production. With the process of urbanization, the industrial structure is constantly adjusted, which has an impact on the structure and efficiency of urban land utilization. Taking 43 cities in the Bohai Rim region as an example, the super-efficiency slack-based measure model with undesirable outputs (super-SBM-undesirable model) was employed to evaluate the GUEUL from 2006 to 2021, and the panel quantile model was used to explore the impact of industrial structure on GUEUL. The results showed that the GUEUL in the Bohai Rim region appeared a fluctuating upward trend from 0.664 in 2006 to 0.837 in 2021. High-value zones shifted from western Liaoning province and southern Shandong province to a “C”-shaped belt around the coastline and expanded continuously, while low-value zones decreased significantly. Furthermore, the influence of industrial structure on GUEUL was significantly positive, but there were significant differences among different efficiency levels. Industrial structure upgrading exerted the most significant effect on GUEUL improvement in low-value zones, while industrial structure rationalization was dominant in high-value zones, and the influence of industrial structure technologization was more significant in medium-low-value zones. Therefore, differentiated industrial structure adjustment policies should be formulated based on the actual condition of each city to improve GUEUL.

1. Introduction

With the process of urbanization in China, urban land use is constantly increasing, which provides a guarantee for urban development. However, there are also some problems restricting regional sustainable development [1], such as unreasonable layout and disorderly expansion of urban land and inefficient land use [2,3,4]. These problems not only result in the occupation of a large amount of arable land resources [5] but also cause waste of land resources and produce many social, economic, and ecological environmental problems. Based on China’s national conditions, the “green development concept” was put forward in the “12th Five-Year Plan” (2011–2015) to preserve arable land resources and improve the regional ecological environment. Green development requires the adoption of low-carbon and environmentally friendly production methods, and the efficient use of production factors across all facets of development [6,7], aiming to promote coordinated development of economy, society, and environment. In this context, paying attention to the green utilization efficiency of urban land (GUEUL) will positively influence the urbanization process in China, benefitting improvement in the quality of urban development and promoting harmonious coexistence between human beings and nature.
Scholars have combined the concept of green development with urban land use and conducted extensive research on the green utilization of urban land. Guided by the idea of sustainable development, the purpose of green utilization of urban land is to integrate the concept of green development into the entire process of urban land use, so as to achieve efficient land use, and emphasize the coordinated development of economic, social, and ecological benefits [7]. GUEUL refers to the degree to which the economic output and social service function are maximized and the pollution emission intensity is minimized by optimizing resource allocation and reducing energy consumption [8,9]. GUEUL is an important index to measure the green and sustainable utilization of urban land. Based on the connotation of GUEUL, scholars have constructed the evaluation system from different perspectives, such as the “input + output” index system based on inputs, desired outputs, and undesired outputs [7,10], and the evaluation system by selecting indicators from three dimensions: structural efficiency, scale efficiency, and intensive efficiency [11]. With the wide application of mathematical models, the evaluation methods of GUEUL have gradually diversified, which can be mainly divided into three major categories: the multi-indicator comprehensive evaluation method, parametric method, and data envelopment analysis (DEA). The early evaluation of urban land use efficiency mainly used multi-indicator comprehensive evaluation, which calculated indicator weight based on the entropy weighting method [5], hierarchical analysis (AHP) [12], and principal component analysis [13]. Parametric methods mainly include stochastic frontier analysis (SFA) [14] and the Douglas production function measure [15]. However, the parametric method has high requirements for the distribution form of errors in the model setting, so it is difficult to construct an accurate production function. DEA method has been continuously improved into the slack-based measure (SBM) model [3] and the super-SBM model [16] on the basis of traditional Banker, Charnes, and Cooper (BCC) and Charnes, Cooper, and Rhodes (CCR) models [17]. Due to its ability to objectively and effectively evaluate decision-making units with multi-inputs and multi-outputs, the super-SBM model has gradually become an important method to evaluate the GUEUL and has been well applied in practice. Scholars have studied the influencing factors of GUEUL using the generalized method of moments (GMM) model [18], Tobit model [3], threshold effect model [19], and spatial Durbin model [11] to study the influencing factors of GUEUL. Studies have shown that economic development [20,21,22], technological innovation [18,20], population density [23], environmental regulation [24], industrial agglomeration [25], and industrial structure [20,26] have impacts on GUEUL. However, because of regional differences, the influencing factors of GUEUL vary in different cities. The process of urban development is accompanied by industrial structure adjustment, which is inextricably linked with the production factors allocation, e.g., land, and has become an important factor affecting GUEUL. The influence of industrial structure adjustment on GUEUL is complex. Liu et al. believed that in the short term, industrial structure adjustment might have a negative influence on GUEUL, while in the long term, it would have a significant influence on the enhancement in GUEUL [11]. Xue et al. [20] found that there was a positive relationship between the proportion of the secondary industry and urban land utilization efficiency. However, Fu and Wang [27] found that when the competitive relationship between industries made the crowding effect greater than the agglomeration effect, the industrial structure would exert a restrictive influence on GUEUL. Previous studies have mainly focused on the GUEUL at the national level [28,29] and in metropolitan areas [30,31] and urban agglomerations [32]. The research on GUEUL in China has mainly focused on the Yellow River Basin [20] and the Yangtze River Economic Belt [10,33,34], with less research on the Bohai Rim region. When it comes to the measurement of industrial structure, it is usually characterized by industrial structure upgrading and industrial structure rationalization [35]. There is a lack of attention on industrial structure technologization. The analysis methods of influencing factors in existing studies can identify the main influencing factors of GUEUL in a certain period from the overall perspective of the study area but fail to reflect the regional differences of the influencing factors.
Although many achievements have been made in the research on GUEUL, the research content and methods still need to be improved. Due to the different functions and development bases, the industrial structures and development stages vary among cities. Land resources provide a spatial carrier for industrial development, while the industrial structure affects the land use structure and land use pattern. Adjustments to industrial structure often leads to changes in land use efficiency, especially the expansion of the tertiary industry and the introduction of high-tech industries, which improve GUEUL. Under the guidance of the green development concept, how is the GUEUL in different cities? What is the changing trend? How do we scientifically quantify the industrial structure and assess the impact of industrial structure adjustment on GUEUL at different development levels? Research on these issues will help managers take effective measures to promote GUEUL.
The Bohai Rim region is economically prosperous, but the contradiction between humans and land cannot be ignored. The traditional industrial production mode and outdated industrial structures not only affect land use efficiency but also have an adverse impact on the ecological environment. Enhancing GUEUL is a requirement for land resource management, as well as the realistic demand for ecological environment protection. Therefore, based on the panel data of 43 prefectural-level and above cities in the Bohai Rim region, this paper evaluated the GUEUL from 2006 to 2021 using the super-SBM-undesirable model and analyzed its spatial and temporal evolution characteristics. Furthermore, industrial structure upgrading, industrial structure rationalization and industrial structure technologization were introduced to improve the quantitative method of industrial structure, and the panel quantile model was used to analyze the impact of industrial structure on GUEUL at different efficiency levels, so as to propose more targeted strategies and suggestions for improving GUEUL in the Bohai Rim region and promoting high-quality urban development.

2. Data and Methods

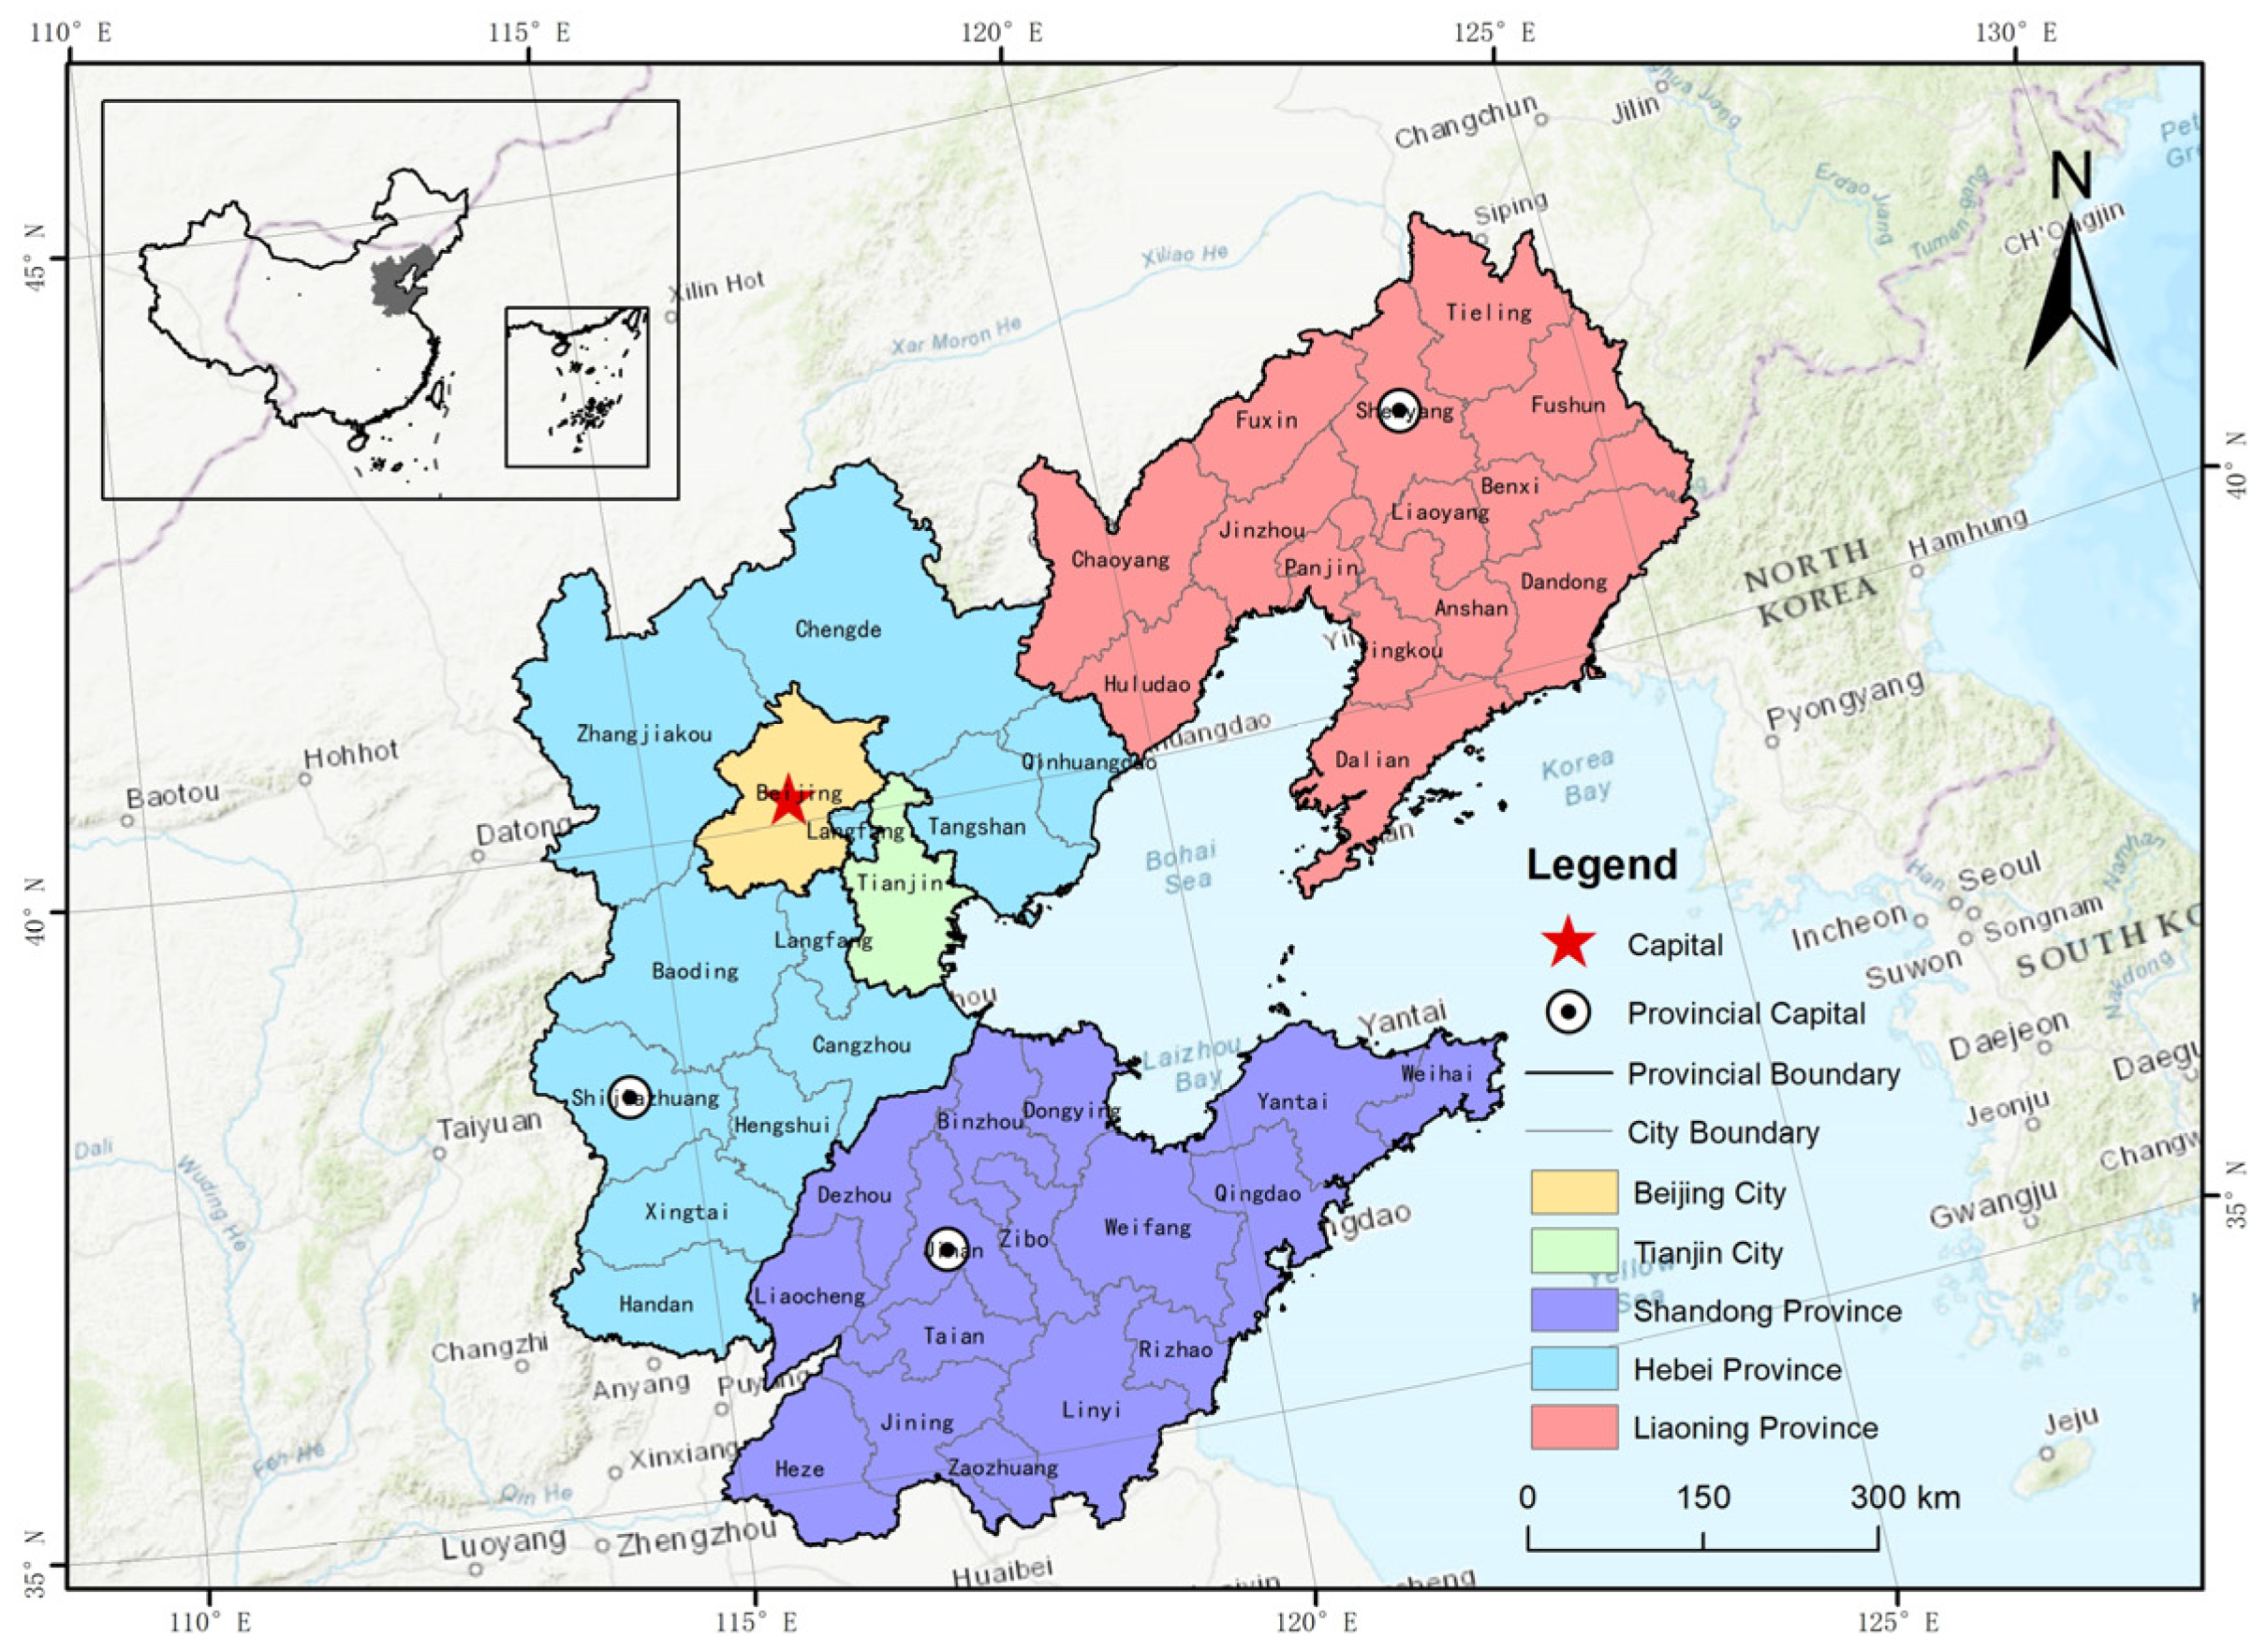
2.1. Study Area and Data Source

The Bohai Rim region is taken as the study area. Based on the principle of “coastal contiguity, the integrity of research unit and the relevance of regional development to the Bohai Rim”, and referring to the existing studies [36,37], the Bohai Rim region is identified as including three provinces and two cities: Liaoning province, Hebei province, Shandong province, Beijing city, and Tianjin city (Figure 1).
As the “third growth pole” of China’s economy, the Bohai Rim region shoulders the important responsibility of implementing major national strategies such as the coordinated development of Beijing–Tianjin–Hebei, the ecological protection and high-quality development of the Yellow River Basin, and the comprehensive revitalization of the northeastern region. Meanwhile, Bohai Rim region is facing serious challenges, such as extensive use and disorderly expansion of urban land [38]. The Bohai Rim region is densely populated, with a population density of 486 people per square kilometer in 2021, higher than the national average of 147 people per square kilometer. The supply–demand contradiction of land resources is prominent, and the tension between human socioeconomic activities and ecological changes is intensifying. Notably, in the Bohai Rim region, industrial cities account for 55.88%, mainly heavy industry and resource-based industries, resulting in serious environmental pollution problems. In 2021, industrial soot emissions accounted for 25.07% of the total national emissions [39]. Additionally, in the Bohai Rim region, there are developed cities with special functions, such as the capital Beijing and Tianjin, as well as many third-tier cities with low production efficiency and underdeveloped economy, and the imbalance of economic development between regions is becoming more and more obvious. Therefore, it is urgent to research the GUEUL and its influencing factors in the Bohai Rim region.
In this study, the Bohai Rim region is taken as the study area, including 43 cities at and above the prefecture level. Infrastructure land data were taken from the China Urban Construction Statistical Yearbook (2006–2021), the per capita disposable income of urban residents and the output data of related industries were taken from the Statistical Yearbook of each city. Carbon emissions data were acquired from the China Carbon Accounting Database (https://www.ceads.net.cn), and green invention patent authorization data were extracted from the China Research Data Service Platform (https://www.cnrds.com). The other socioeconomic statistical data were gathered from China Urban Statistical Yearbook (2007–2022), with individual missing data supplemented through provincial and municipal statistical yearbooks.

2.2. Methodology

2.2.1. Super-SBM-Undesirable Model

As a non-parametric method, data envelopment analysis (DEA) can objectively and effectively evaluate decision-making units with multiple input and output indicators; thus, it has gradually become a mainstream method to evaluate GUEUL. The super-SBM-undesirable model can accurately evaluate the efficiency of decision-making units with multi-inputs and multi-outputs without the need to preset a specific function form. Furthermore, by introducing the concept of super-efficiency, this model is able to effectively distinguish the decision-making units that are at the forefront of efficiency. Critically, this model takes into account undesirable outputs to ensure that the adverse consequences caused by these outputs are fully considered in the efficiency evaluation process, which is of great significance for accurately assessing GUEUL. Referring to the formula derived by Cheng [40], the super-SBM-undesirable model was used to evaluate the GUEUL in the Bohai Rim region. The formula is as follows:
ρ = m i n 1 + 1 m i = 1 m s i x x i 0 1 1 s 1 + s 2 ( k = 1 s 1 s k y y k 0 + k = 1 s 1 s l z z l 0 ) s . t .             x i 0 j = 1 n λ j x j s i x , i ;                             y k 0 j = 1 n λ j y j + s k y , k ;                         z l 0 j = 1 n λ j z j s l z , l ;   s i x 0 , s k y 0 , s l z 0 , λ j 0 , i , j , k , l ;
where ρ is the value of GUEUL; x, y, and z represent input variables, desired output variables, and unexpected output variables, respectively; m, s1, and s2 are the number of input variables, desired output variables, and unexpected output variables, respectively; s is the slack variable; s i x and s l z are the redundancy of input variable i and unexpected output variables l, respectively; s k y is the shortfall of desired output variable k; n is the number of decision-making units; and λj is the weight vector of unit j.

2.2.2. Panel Quantile Model

The traditional regression model is a regression to the mean, which analyzes the effect of explanatory variables on the conditional expectation of dependent variables. It does not take into account the fact that there may be differences in the effect of explanatory variables on the dependent variables when the dependent variables are at different levels. The development gap among cities in the Bohai Rim region is significant, and the GUEUL and its influencing factors are also different. Traditional regression models can only analyze the influencing factors of GUEUL at a regional scale, while the panel quantile model can specifically explore the influencing factors at different levels of GUEUL. The quantile regression model [41] can estimate the effect of the independent variables on the dependent variables at each quantile [42], avoiding the influence of extreme values and making the regression results more robust. Therefore, referring to related studies [43], the panel quantile regression model was employed to examine the influence of industrial structure on GUEUL under different levels of GUEUL. The formula is as follows:
Q τ ρ i t = β 1 τ I S U i t + β 2 τ I S R i t + β 3 τ I S T i t + γ τ C o n t r o l i t + μ i + δ t + ε i t
where i and t denote city and year, respectively; Q τ ρ i t is the τ quartile of GUEUL; ISU, ISR, and IST are core explanatory variables, respectively; β is the correlation coefficient; Control represents the control variables related to GUEUL; γ is the coefficient of control variables; μ i denotes an individual fixed effect; δ t denotes a time fixed effect, and ε i t is the error term.

2.3. Variables

2.3.1. Dependent Variable: GUEUL (ρ)

Drawing on the connotation of GUEUL and referring to previous studies [8,18], indicators were selected to construct the evaluation index system for GUEUL, encompassing production inputs, desired outputs, and non-desired outputs (Table 1).
Input indicators included capital, and resources categorized by land, water, energy, and labor. The built-up area was chosen as the land input indicator. The fixed capital stock was used as the capital input indicators, which was calculated by the perpetual inventory method, with the base year set at 2006 and a depreciation rate of 9.6% [34]. The total urban water supply was selected to reflect water resource consumption. Energy input was represented by the energy consumption per unit of GDP. The number of employees in secondary and tertiary industries was chosen to represent labor input.
The desired output indicators reflect the economic, social, and environmental benefits of urban land use. The value added by the secondary and tertiary industries was used to reflect the economic output level of urban land use. Social output is a multidimensional indicator. People are the main body of society, so the utilization of land resources should continually cater to the material and spiritual needs of human beings, thereby improving social welfare and well-being [10]. Consequently, the social development index was used to reflect the social benefits of urban land use. Thus, some indicators were selected to construct an index system, such as the per capita disposable income of urban residents, infrastructure completeness, the number of hospital beds per 10,000 people, and the proportion of expenditure on science and education in government fiscal expenditure. The entropy weight method was used to calculate the indicator weight, and the weighted index model was used to calculate the social development index. The green coverage rate in built-up areas was used to characterize the environmental benefits. The three major industrial pollutants (industrial wastewater, sulfur dioxide, and soot emissions), were taken as indicators of undesired output. As the DEA model requires that the output indicators should not be too numerous, the entropy weight method was used to calculate the indicator weight and the weighted index model was applied to calculate the comprehensive index of industrial pollutants [44]. In addition, carbon emissions, a pollutant of concern in the process of urban land use [8], were incorporated into the undesired output indicators as well.

2.3.2. Core Explanatory Variables

(1)
Industrial structure upgrading (ISU)
ISU refers to the degree to which the industrial structure transitions from low level to high level. Currently, China is experiencing a phase of industrial structural transformation, marked predominantly by a shift from the secondary to the tertiary industry. Thus, drawing on the study of Du et al. [45], this study employed the ratio of the output value of the tertiary industry to that of the secondary industry to characterize the level of ISU.
(2)
Industrial structure rationalization (ISR)
ISR is the degree to which it involves the continuous coupling and coordination between factor input structure and economic output structure. Drawing on existing studies [46,47], the adjusted Theil index was used to calculate the ISR. According to the characteristics of urban land use, the data of secondary and tertiary industries were used to calculate ISR. The formula is as follows:
T L = i = 2 3 Y i Y l n ( Y i L i / Y L )
I S R = 1 T L
where i = 2 and 3, respectively, representing the second and third industries; Y is gross regional product; L is the number of employees in the secondary and tertiary industries; TL is the Thiel index. When the system is in a state of complete equilibrium, TL = 0. The closer TL is to 0, the more rational the industrial structure; conversely, the larger the TL, the more irrational the industrial structure. ISR indicates the degree of industrial structure rationalization. The greater the RIS, the smaller deviation of industrial structure and the more rational the industrial structure.
(3)
Industrial structure technologization (IST)
High-technology industries (manufacturing) are characterized by a relatively higher proportion of research and development (R&D) expenditure in main business income. To measure the level of IST, this study employed the ratio of the output value of high-technology industries to the total output value. Based on the Classification of High-tech Industries (Manufacturing) (2017) and compared with the Classification of National Economic Industries (GB/T 4754-2017) [48], the output value of high-tech industries is calculated by summing the output value of pharmaceutical manufacturing, railway, shipbuilding, aerospace, and other transportation equipment manufacturing; computer, communication, and other electronic equipment manufacturing; and instrument manufacturing.

2.3.3. Control Variables

This study selected economic support (EC), level of science and technology innovation (lnST), environmental regulation (ER), and population density (PD) as control variables. The proportion of science and technology expenditure in government fiscal expenditure was used to indicate the government’s economic support. Science and technology innovation can enhance the marginal transformation rate of production factors in the process of land use [49]. In order to reduce the absolute differences between data, the natural logarithm of the number of green invention patent applications was used to measure the level of science and technology innovation. Referring to the environmental protection vocabulary selected by Zhang and Chen [50], the frequency of terms related to “environmental protection” in government work reports was used to characterize the intensity of environmental regulation.

3. Results

3.1. GUEUL Evaluation in the Bohai Rim Region

3.1.1. Overall Characteristics

The GUEUL was calculated by MATLAB 2020a annually and was categorized into four levels using single standard deviation: low-value zone (0.447–0.495), medium-low-value zone (0.496–0.725), medium-high-value zone (0.726–0.955), and high-value zone (0.956–1.227).
On the whole, the GUEUL in the Bohai Rim region showed a fluctuating upward trend from 0.664 in 2006 to 0.837 in 2021 (Figure 2). At the same time, its changes were characterized by obvious stages. From 2006 to 2021, the changes in GUEUL can be divided into three stages: the continuous upward period from 2006 to 2009, the fluctuating downward period from 2010 to 2016, and the fluctuating upward period from 2017 to 2021 (Table 2). During the continuous upward period (2006–2009), the GUEUL in the Bohai Rim region continued to improve, with an average increase of 18.70%. This stage was characterized by a significant increase of the medium-high-value zones and high-value zones, as well as a corresponding decrease of the low-value zones and medium-low-value zones. During the fluctuating downward period (2010–2016), the average efficiency decreased by 12.18%, which was mainly manifested in the increase of the low-value zones and medium-low-value zones, particularly the obvious increase of the medium-low-value zones, and the decrease of the medium-high-value zones and high-value zones. During the fluctuating upward period (2017–2021), the number of high-value zones increased by 8, accounting for 46.51%, while the number of other types decreased to varying degrees.

3.1.2. Evolution Characteristics

The GUEUL in 2006, 2011, 2016, and 2021 were selected to analyze its spatial evolution characteristics in the Bohai Rim region (Figure 3).
In 2006, the high-value zones were clustered in the western of Liaoning province and the southern region of Shandong province, while the medium-low-value zones and the medium-high-value zones were scattered around the periphery of the high-value zones and Beijing–Tianjin region. The low-value zones were widely distributed in the western of Hebei province and most of Shandong province. In 2011, the overall GUEUL in the Bohai Rim region improved significantly. Specifically, the GUEUL in the Beijing–Tianjin–Hebei region experienced a significant enhancement, although Zhangjiakou, Shijiazhuang, and Xingtai still remained in the low-value zones. In Shandong province, the medium-high-value zones and high-value zones of GUEUL began to shift towards Qingdao, Jinan, and their surrounding areas. While Liaoning’s GUEUL experienced a certain degree of decline, with a noticeable reduction in the number of high-value zones, which were mainly concentrated in the southwest coastal cities. In 2016, due to the remarkable results of eliminating outdated production capacity, the GUEUL in the Beijing–Tianjin–Hebei region and Shandong province continued to improve. The high-value zones were clustered around Beijing, Tianjin, Jinan, and Qingdao, which was consistent with the level of socioeconomic development. In contrast, Liaoning province, with a large proportion of industrial enterprises, has long relied on industrial development to drive economic growth. This development model has resulted in inefficient expansion of urban land, and has exacerbated environmental pollution, resulting in a decline in GUEUL. By 2016, the number of low-value zones and medium-low-value zones increased and were distributed in contiguous areas. From 2016 to 2021, the overall GUEUL in the Bohai Rim region saw another significant increase. In 2021, the high-value zones were distributed in a “C”-shaped pattern along the coast, showing the characteristics of the “core periphery”. Meanwhile, the GUEUL in Shijiazhuang and Xingtai was still not optimistic. As the provincial capital, Shijiazhuang’s GUEUL did not align with its economic development level. By analyzing the index data, we found that the large number of redundant input elements and insufficient social output were the key to restricting the improvement of GUEUL. The GUEUL of Xingtai remained at a low level from 2006 to 2021, which may be the result of its geographical location in the southwest of Hebei province, far away from the development center, and is less driven by the radiation of Beijing and Tianjin, resulting in a low level of economic development and a slow growth rate of per capita GDP. To sum up, from 2006 to 2021, there were obvious spatial differences in GUEUL in the Bohai Rim region, and its change characteristics were not consistent across different regions. The spatial distribution of high-value zones underwent a notable change, shifting from the initial concentration in the western Liaoning province and the southwest Shandong province to the rapid increase in coastal cities, forming a “C”-shaped distribution, which exhibits a “core periphery” pattern. Meanwhile, the distribution of low-value zones gradually contracted from an initial continuous distribution in Hebei province and Shandong province to the final distribution only in Shijiazhuang and Xingtai.

3.2. Regression Results and Analysis

3.2.1. Unit Root Test and Cointegration Test

Unit root tests, including LLC, HT, and IPS, were used to prevent spurious regression and make sure the estimation results valid. A variable is considered stable only when it passes all three tests simultaneously. The test results indicated that variable IST did not pass the HT test, variable PD did not pass the LLC and HT tests, while all other variables passed all three tests (Table 3). Therefore, this study performed first-order differences on the variables and retested their stationary, and all variables passed the tests, indicating that the data were stationary and first-order single integration. The Pedroni test was employed to assess cointegration among the variables to determine if there existed a long-term equilibrium relationship. The test results rejected the null hypothesis at the 1% significance level, suggesting that there was a cointegration relationship between the GUEUL and the explanatory variables. Consequently, the raw data can be used for regression analysis.

3.2.2. Fixed-Effect Panel Quantile Regression

When the data are non-normally distributed, panel quantile regression estimates are more robust than the OLS model regression results [51]. In this paper, Stata17.0 was used to perform quantile regression on the GUEUL and its influencing factors in the Bohai Rim region from 2006 to 2021. Before the regression, the F-test was applied to decide whether the fixed effect model or the mixed effect model should be used, and the test results showed that the p-value of the F-test was 0.0000, which strongly rejected the null hypothesis, so it was considered that the fixed effect model was superior to the mixed effect model. Secondly, the LM test was conducted to decide whether to use the random effect model or the mixed effect model, and the test results strongly rejected the null hypothesis of “no individual random effects”, suggesting that the random effect model was preferred over the mixed effect model. Finally, the Hausman test yielded a p-value of 0.005, which rejected the null hypothesis of “accepting random effects”; thus, the fixed effect model was optimal. Based on the above tests, the fixed-effect panel quantile regression was adopted, and four representative quantiles (Q20, Q40, Q60, and Q80) were selected to reveal the influence of industrial structure on GUEUL at different quantile levels in the Bohai Rim region (Table 4). The four models Q20–Q80 were, respectively, used to illustrate the influence of industrial structure on GUEUL at low, medium-low, medium-high, and high levels.
(1)
Industrial structure upgrading (ISU)
ISU passed the 1% significance test at each quantile point, with the regression coefficients consistently positive and decreasing over time. At different levels of the GUEUL, ISU exerted a significant positive influence, which indicated that the transition from the secondary to the tertiary industry can effectively enhance the GUEUL. With the level of ISU increased, production factors flow towards service industries and technology-intensive industries, thereby improving the economic benefits of urban land use. In addition, compared with traditional industries, ISU can also reduce industrial waste emissions and improve the ecological benefits of urban land use. This effect was most pronounced in cities with low GUEUL, where GUEUL increased 0.0066% for every 1% increase in ISU.
(2)
Industrial structure rationalization (ISR)
The regression coefficients of ISR were positive at all quantile points, and the largest coefficient was found at quantile point Q80. It indicates that the ISR has a promoting effect on GUEUL in the Bohai Rim region, and this promoting effect is greater in the high-value zones. The improvement in ISR level means that in the process of resource allocation, the input structure of production factors becomes more reasonable, with the redundancy rate of input factors gradually reduced, so that GUEUL can be significantly improved.
(3)
Industrial structure technologization (IST)
IST demonstrated a significant positive impact on the GUEUL, and this positive impact was more significant in the medium-low-value zones, with an increase in industrial structure technology index by 1% and the GUEUL by 1.2547%. In the medium-high-value and high-value zones, the promoting effect of the IST on GUEUL was relatively weaker. The increasing proportion of high-tech industries can improve resource utilization efficiency through deep processing of existing resources and extension of industrial chain. Simultaneously, it can also improve the purification and treatment rate of pollutants and the comprehensive utilization rate of wastes, reduce pollutant emissions, and effectively improve GUEUL.
(4)
Control Variables
The regression coefficients of economic support (EC) at each quantile were significantly positive, indicating that economic support had a positive impact on the GUEUL, which was consistent with the conclusion obtained by Wang et al. [52]. With the improvement of economic development level, the increase in government investment in scientific and technological research enhanced the utilization efficiency of resource and energy utilization and promoted the transition of land use from extensive to intensive, resulting in an improvement in GUEUL.
The level of science and technology innovation (lnST) was significantly negative in all quantiles, indicating the current level of technological innovation has not yet formed a positive driving mechanism for GUEUL in the Bohai Rim region. The possible reasons are, first, that due to the relatively poor innovation foundation in this region at this stage, a large amount of investment has high risk and slow return, and second, the patent conversion mechanism is not perfect, and enterprises frequently operate with a profit-maximizing orientation, resulting in the achievements of technological innovation are not widely applied to promote cleaner production and environmental governance, but cause an increase in costs, and potentially even hinder economic growth. Therefore, at this stage, it is difficult for technological innovation to promote GUEUL in the Bohai Rim region.
Environmental regulation (ER) had a positive impact on GUEUL at quantile Q80 but had a significant negative impact on GUEUL at other quantiles. In the Bohai Rim region, environmental protection policies can guide enterprises to take energy-saving and emission reduction measures to improve GUEUL, which verifies Porter’s hypothesis. Although the implementation of environmental protection policies will result in increased costs in the short term, it can effectively improve the productivity of enterprises, increase the output per unit area, and reduce resource waste and environmental damage in the long run, so as to improve GUEUL.
The influence of population density (PD) on GUEUL exhibited a significant negative effect across all quantiles, which indicated that an increase in population density would suppress the GUEUL. The Bohai Rim region is densely populated, and under the current economic and technological conditions, the pressure on land resources is greater. Population growth will further exacerbate the contradiction between humans and land, posing greater challenges for urban development and urban land use in the Bohai Rim region.

3.2.3. Robustness Test

A robustness test was performed in this study by excluding potential outliers (each variable’s tails were trimmed by 1% on both ends) to guarantee the robustness of the regression outcomes. The regression results (Table 5.) showed that the impacts of all explanatory variables on GUEUL remained significant and exhibited no significant discrepancies with the conclusions in Table 4, suggesting that the regression results were robust.

4. Discussion

4.1. Indicators and Research Methods

Based on the availability of data, the indicators used in this paper include three sources: the China Carbon Accounting Database, the China Research Data Service Platform, and the Statistical Yearbook. Although the different data sources may cause certain deviations, the data used in this study are all from authoritative official statistics, and they refer to municipal districts, which can ensure the consistency and comparability of the data to a certain extent and reflect the actual conditions of the Bohai Rim region. The industrial structures of cities in the Bohai Rim region vary due to the influences of city functions, levels of economic development, and historical industrial foundations. This study measured industrial structure from three dimensions: ISU, ISR, and IST. Compared with the existing studies, the IST, reflecting the scientific and technological level of industry structure, was added to further improve the quantitative method of industrial structure. In terms of analyzing influencing factors, most studies have explored the impact of specific factors or several factors on GUEUL from the overall perspective of the study area. This study employed the panel quantile regression method to refine the impact of industrial structure on GUEUL under different efficiency levels, which can reflect the regional differences in the influencing factors and provide support for exploring the differentiated paths to improve GUEUL.

4.2. Differences in the Impacts of Industry Structure

This study shows that under different levels of GUEUL, the influence of industrial structure on GUEUL varies. Targeted measures aimed at optimizing the industrial structure should be taken to enhance GUEUL in the future. In the low-value zones of GUEUL, such as Chengde, Xingtai, Zhangjiakou, and other resource-based cities, due to incomplete shift from the resource-dependent development model, these cities have extensive land use, high energy consumption, and insufficient output, resulting in low land use efficiency. This result is consistent with the conclusions of previous studies [53,54], which indicates that the GUEUL of resource-based cities is relatively low. Due to the low starting point of ISU in these cities, the industrial structure has great potential for improvement. The key to improving GUEUL in these cities is to improve the level of ISU by promoting the transition from secondary to tertiary industries. Studies have shown that economic development can promote the improvement of GUEUL [11,17,18]. However, in the medium-low-value zones of GUEUL, such as Shijiazhuang, Shenyang, and Weifang, there is a mismatch between GUEUL and economic development. This finding is corroborated by the research of Wang et al. [35], suggesting that unreasonable resource allocation has a negative impact on GUEUL. These cities possess a substantial stock of fixed capital, yet excessive investment has led to resource wastage and overcapacity, which consequently causes environmental problems and restricts the enhancement of GUEUL. Given their robust economic foundation, these cities can learn from the experience of other advanced cities, actively introduce high-tech talents and technologies to develop high-tech industries. The development of high-tech industries will significantly improve resource utilization efficiency, increase economic benefits, and reduce environmental pollution; therefore, increasing the proportion of high-tech industries is an effective means to promote GUEUL. In cities with significantly improved GUEUL, such as Tianjin, Handan, Dalian, Jinan, Benxi, Yantai, and Weihai, the expansion rate of urban land is relatively fast, and the structure of input factors is reasonable, which realizes the efficient use of land resources. Consequently, in the high-value and medium-high-value zones of GUEUL, it is the most effective way to improve GUEUL by improving the ISR to realize the coordinated development of various industries.

4.3. Policy Implications

The change of GUEUL is closely related to environmental protection policies. Guided by the policy of “energy conservation and emission reduction” proposed in the “11th Five-Year Plan” (2006–2010), the new industrial production concept was applied to gradually reduce energy consumption and pollutant emissions, so that the GUEUL was improved during this period. During the period of the “12th Five-Year Plan” (2011–2015), there was a robust promotion of ecological civilization construction with the green development ethos imposing more exacting standards for environmental protection and regional sustainability. During this period, industrial cities eliminated a large number of outdated and inefficient industries to improve the ecological environment and promote intensive land use. However, due to the high-tech industry and the tertiary industry having not yet formed a perfect industrial chain, coupled with the “three-phase superposition” (the period of shifting growth rates, the period of structural adjustment pains, and the period of consumption of previous stimulus policies), the level of economic output decreased, resulting in a short-term downward trend for GUEUL. With the continuous promotion of the green development concept and the implementation of environmental protection policies, “transformation of Old-New-Driving-Forces” has brought new urban economic growth points, and the GUEUL has been improved. Policy guidance may have an impact on economic output and bring a short period of pain, but in the long run, it will certainly promote the steady improvement of GUEUL. In the future, the improvement of GUEUL in the Bohai Rim region still need the guidance and support of policies. On the one hand, under the guidance of the concept of green development, according to the characteristics of urban development, scientific industrial development policies should be formulated to balance economic development and environmental protection, so as to promote GUEUL. On the other hand, we should develop the tertiary industry and high-tech industries to optimize the industrial structure and formulate incentive policies for scientific and technological innovation to guide and encourage enterprises to develop and apply more efficient and environmentally friendly production technologies, so as to improve GUEUL.

4.4. Limitation and Future Research

The evaluation of GUEUL is a complex and systematic process. Although a comprehensive index system has been established to measure GUEUL in this study, the index system still needs to be improved due to the limitations of data availability and quantification. In the future, more data sources should be considered to select evaluation indicators and further improve the index system. Moreover, there are numerous factors that influence the GUEUL, and this study only analyzes the impact of industrial structure on GUEUL. In the future, the comprehensive impact of multiple factors on GUEUL should be analyzed from a broader perspective, and the interaction of green land use between regions should be explored.

5. Conclusions

The green utilization of urban land is conducive to promoting regional high-quality development. Based on the concept of green development, an evaluation index system of GUEUL was constructed in this paper. Furthermore, the super-SBM-undesirable model was employed to evaluate the GUEUL of 43 cities in the Bohai Rim region. The panel quantile model was used to explore how industrial structure affected the GUEUL at different levels. The main conclusions are as follows:
From 2006 to 2021, the GUEUL increased from 0.664 to 0.837 in the Bohai Rim region. The spatial distribution of the GUEUL displayed significant heterogeneity. The high-value zones approximated a coastal “C” shape, which gradually expanded over the study period. Medium-high-value zones and medium-low-value zones were situated around the periphery of the high-value zones. The number of low-value zones decreased significantly, only in Shijiazhuang and Xingtai at the end of the study period. The GUEUL in the study area showed a “core periphery” distribution pattern.
Industrial structure exerted a significant positive influence on GUEUL, but the in-fluence was different at different levels of GUEUL. ISU had the greatest effect in low-value zones, ISR was the most effective way to improve the GUEUL in high-value zones, and IST played the greatest role in medium-low-value zones. Therefore, when optimizing the industrial structure, it is essential to take into account the characteristics of each city to formulate differentiated policies.

Author Contributions

Conceptualization, T.G.; methodology, X.W.; validation, X.W.; data curation, T.G.; writing—original draft preparation, T.G.; writing—review and editing, X.W.; visualization, T.G.; supervision, X.W. All authors have read and agreed to the published version of the manuscript.

Funding

This research received no external funding.

Institutional Review Board Statement

Not applicable.

Informed Consent Statement

Not applicable.

Data Availability Statement

The original contributions presented in the study are included in the article; further inquiries can be directed to the corresponding author.

Conflicts of Interest

The authors declare no conflicts of interest.

References

  1. Tang, L.; Liu, J.; Ma, X. Research on coordination between urban construction land consumption intensity and socio-economic development level: From the perspective of urban development stages. China Land Sci. 2018, 31, 73–82. [Google Scholar]
  2. Wang, S.; Yang, C.; Li, Z. Spatio-temporal evolution characteristics and spatial interaction spillover effects of new-urbanization and green land utilization efficiency. Land 2021, 10, 1105. [Google Scholar] [CrossRef]
  3. Yu, J.; Zhou, K.; Yang, S. Land use efficiency and influencing factors of urban agglomerations in China. Land Use Policy 2019, 88, 104143. [Google Scholar] [CrossRef]
  4. Kuang, B.; Lu, X.; Han, J.; Fan, X.; Zuo, J. How urbanization influence urban land consumption intensity: Evidence from China. Habitat. Int. 2020, 100, 102103. [Google Scholar] [CrossRef]
  5. Bren D Amour, C.; Reitsma, F.; Baiocchi, G.; Barthel, S.; Güneralp, B.; Erb, K.; Haberl, H.; Creutzig, F.; Seto, K.C. Future urban land expansion and implications for global croplands. Proc. Natl. Acad. Sci. USA 2017, 114, 8939–8944. [Google Scholar] [CrossRef]
  6. Krekel, C.; Kolbe, J.; Wüstemann, H. The greener, the happier? The effect of urban land use on residential well-being. Ecol. Econ. 2016, 121, 117–127. [Google Scholar] [CrossRef]
  7. Lin, Q.; Ling, H. Study on green utilization efficiency of urban land in Yangtze River Delta. Sustainability 2021, 13, 11907. [Google Scholar] [CrossRef]
  8. Liang, L.; Yong, Y.; Yuan, C. Measurement of Urban Land Green Use Efficiency and Its Spatial Differentiation Characteristics: An Empirical Study based on 284 Cities. China Land Sci. 2019, 33, 80–87. [Google Scholar]
  9. Wen, L.; Sun, S. Does emission trading system improve the urban land green use efficiency? Empirical evidence from Chinese cities. Environ. Sci. Pollut. Res. Int. 2023, 30, 121666–121683. [Google Scholar] [CrossRef]
  10. Tan, S.; Hu, B.; Kuang, B.; Zhou, M. Regional differences and dynamic evolution of urban land green use efficiency within the Yangtze River Delta, China. Land Use Policy 2021, 106, 105449. [Google Scholar] [CrossRef]
  11. Liu, J.; Hou, X.; Wang, Z.; Shen, Y. Study the effect of industrial structure optimization on urban land-use efficiency in China. Land Use Policy 2021, 105, 105390. [Google Scholar] [CrossRef]
  12. Osman, T.; Divigalpitiya, P.; Arima, T. Driving factors of urban sprawl in Giza Governorate of Greater Cairo Metropolitan Region using AHP method. Land Use Policy 2016, 58, 21–31. [Google Scholar] [CrossRef]
  13. Salvati, L. Monitoring high-quality soil consumption driven by urban pressure in a growing city (Rome, Italy). Cities 2013, 31, 349–356. [Google Scholar] [CrossRef]
  14. Ferreira, M.D.P.; Féres, J.G. Farm size and Land use efficiency in the Brazilian Amazon. Land Use Policy 2020, 99, 104901. [Google Scholar] [CrossRef]
  15. Liu, Y.; Zhang, Z.; Zhou, Y. Efficiency of construction land allocation in China: An econometric analysis of panel data. Land Use Policy 2018, 74, 261–272. [Google Scholar] [CrossRef]
  16. Cao, X.; Liu, Y.; Li, T.; Liao, W. Analysis of spatial pattern evolution and influencing factors of regional land use efficiency in China based on ESDA-GWR. Sci. Rep. 2019, 9, 520. [Google Scholar] [CrossRef]
  17. Cui, X.; Fang, C.; Wang, Z.; Bao, C. Spatial relationship of high-speed transportation construction and land-use efficiency and its mechanism: Case study of Shandong Peninsula urban agglomeration. J. Geogr. Sci. 2019, 29, 549–562. [Google Scholar] [CrossRef]
  18. Hu, W.; Li, Z.; Chen, D.; Zhu, Z.; Peng, X.; Liu, Y.; Liao, D.; Zhao, K. Unlocking the potential of collaborative innovation to narrow the inter-city urban land green use efficiency gap: Empirical study on 19 urban agglomerations in China. Environ. Impact. Asses. 2024, 104, 107341. [Google Scholar] [CrossRef]
  19. Wang, P.; Shao, Z.; Wang, J.; Wu, Q. The impact of land finance on urban land use efficiency: A panel threshold model for Chinese provinces. Growth Chang. 2021, 52, 310–331. [Google Scholar] [CrossRef]
  20. Xue, D.; Yue, L.; Ahmad, F.; Draz, M.U.; Chandio, A.A.; Ahmad, M.; Amin, W. Empirical investigation of urban land use efficiency and influencing factors of the Yellow River basin Chinese cities. Land Use Policy 2022, 117, 106117. [Google Scholar] [CrossRef]
  21. Zhu, X.; Zhang, P.; Wei, Y.; Li, Y.; Zhao, H. Measuring the efficiency and driving factors of urban land use based on the DEA method and the PLS-SEM model—A case study of 35 large and medium-sized cities in China. Sustain. Cities Soc. 2019, 50, 101646. [Google Scholar] [CrossRef]
  22. Feng, Y.; Li, Y.; Nie, C. The effect of place-based policy on urban land green use efficiency: Evidence from the Pilot Free-Trade Zone establishment in China. Land 2023, 12, 701. [Google Scholar] [CrossRef]
  23. Zhou, Y.; Lu, Y. Spatiotemporal evolution and determinants of urban land use efficiency under green development orientation: Insights from 284 cities and eight economic zones in China, 2005–2019. Appl. Geogr. 2023, 161, 103117. [Google Scholar] [CrossRef]
  24. Lu, X.; Tao, X. Local Government Environmental Attention and Urban Land Green Use Efficiency in China: The Intermediary Role of Industrial Restructuring. Land 2023, 13, 21. [Google Scholar] [CrossRef]
  25. Hu, H.; Pan, L.; Jing, X.; Li, G.; Zhuo, Y.; Xu, Z.; Chen, Y.; Wang, X. The spatiotemporal non-stationary effect of industrial agglomeration on urban land use efficiency: A case study of Yangtze River Delta, China. Land 2022, 11, 755. [Google Scholar] [CrossRef]
  26. Chang, J.; Wang, W.; Liu, J. Industrial upgrading and its influence on green land use efficiency. Sci. Rep. 2023, 13, 2813. [Google Scholar] [CrossRef]
  27. Fu, H.; Wang, Z. Relationship Between Regional Industrial Structure Adjustment and Land Use Efficiency: An Investigation Based on the Level of Urbanization. China Land Sci. 2020, 34, 69–78. [Google Scholar]
  28. Martinho, V.J.P.D. Efficiency, total factor productivity and returns to scale in a sustainable perspective: An analysis in the European Union at farm and regional level. Land Use Policy 2017, 68, 232–245. [Google Scholar] [CrossRef]
  29. Estoque, R.C.; Ooba, M.; Togawa, T.; Hijioka, Y.; Murayama, Y. Monitoring global land-use efficiency in the context of the UN 2030 Agenda for Sustainable Development. Habitat. Int. 2021, 115, 102403. [Google Scholar] [CrossRef]
  30. Masini, E.; Tomao, A.; Barbati, A.; Corona, P.; Serra, P.; Salvati, L. Urban growth, land-use efficiency and local socioeconomic context: A comparative analysis of 417 metropolitan regions in Europe. Environ. Manag. 2019, 63, 322–337. [Google Scholar] [CrossRef]
  31. Gao, X.; Zhang, A.; Sun, Z. How regional economic integration influence on urban land use efficiency? A case study of Wuhan metropolitan area, China. Land Use Policy 2020, 90, 104329. [Google Scholar] [CrossRef]
  32. Wang, X.; Shen, X.; Pei, T. Efficiency loss and intensification potential of urban industrial land use in three major urban agglomerations in China. Sustainability 2020, 12, 1645. [Google Scholar] [CrossRef]
  33. Dong, Y.; Jin, G.; Deng, X. Dynamic interactive effects of urban land-use efficiency, industrial transformation, and carbon emissions. J. Clean. Prod. 2020, 270, 122547. [Google Scholar] [CrossRef]
  34. Tang, Y.; Wang, K.; Ji, X.; Xu, H.; Xiao, Y. Assessment and spatial-temporal evolution analysis of urban land use efficiency under green development orientation: Case of the Yangtze River Delta urban agglomerations. Land 2021, 10, 715. [Google Scholar] [CrossRef]
  35. Wang, Z.; Fu, H.; Liu, H.; Liao, C. Urban development sustainability, industrial structure adjustment, and land use efficiency in China. Sustain. Cities Soc. 2023, 89, 104338. [Google Scholar] [CrossRef]
  36. Tan, F.; Kong, Q. Uncovering the driving mechanism of regional synergistic development based on Haken model: Case of the Bohai Rim region. Environ. Dev. Sustain. 2020, 22, 3291–3308. [Google Scholar] [CrossRef]
  37. Liu, Y.; Yang, R. The spatial pattern measure of urban-rural development transformation in the Bohai Rim region in China. Acta. Geogr. Sin. 2015, 70, 248–256. [Google Scholar]
  38. He, S.; Shao, X. Spatial Clustering and Coupling Coordination of Population-Land-Economic Urbanization in Beijing-Tianjin-Hebei Region. Econ. Geogr. 2018, 38, 95–102. [Google Scholar]
  39. Di, K.; Liu, Z.; Chai, S.; Li, K.; Li, Y. Spatial correlation network structure of green innovation efficiency and its driving factors in the Bohai Rim region. Environ. Dev. Sustain. 2023. [Google Scholar] [CrossRef]
  40. Cheng, G. Data Envelopment Analysis: Methods and MaxDEA Software, 1st ed.; Intellectual Property Publishing House: Beijing, China, 2014. [Google Scholar]
  41. Koenker, R.; Bassett Jr, G. Regression quantiles. Econometrica 1978, 46, 33–50. [Google Scholar] [CrossRef]
  42. Opoku, E.E.O.; Aluko, O.A. Heterogeneous effects of industrialization on the environment: Evidence from panel quantile regression. Struct. Chang. Econ. Dyn. 2021, 59, 174–184. [Google Scholar] [CrossRef]
  43. Zhu, H.; Duan, L.; Guo, Y.; Yu, K. The effects of FDI, economic growth and energy consumption on carbon emissions in ASEAN-5: Evidence from panel quantile regression. Econ. Model. 2016, 58, 237–248. [Google Scholar] [CrossRef]
  44. Xie, H.; Chen, Q.; Lu, F.; Wang, W.; Yao, G.; Yu, J. Spatial-temporal disparities and influencing factors of total-factor green use efficiency of industrial land in China. J. Clean. Prod. 2019, 207, 1047–1058. [Google Scholar] [CrossRef]
  45. Du, K.; Cheng, Y.; Yao, X. Environmental regulation, green technology innovation, and industrial structure upgrading: The road to the green transformation of Chinese cities. Energ. Econ. 2021, 98, 105247. [Google Scholar] [CrossRef]
  46. Zhao, J.; Jiang, Q.; Dong, X.; Dong, K.; Jiang, H. How does industrial structure adjustment reduce CO2 emissions? Spatial and mediation effects analysis for China. Energ. Econ. 2022, 105, 105704. [Google Scholar] [CrossRef]
  47. Wang, X.; Song, J.; Duan, H. Coupling between energy efficiency and industrial structure: An urban agglomeration case. Energy 2021, 234, 121304. [Google Scholar] [CrossRef]
  48. GB/T 4754-2017; Industrial classification for national economic activities. National Bureau of Statistics, China Institute of Standardization; Beijing, China, 2017.
  49. Zhang, R.; Wen, J.; Wang, N.; Mou, S. Impact of scientific and technological innovation on green use efficiency of urban land: A case study of 48 districts and counties in the Wuhan Metropolitan Area. Resour. Sci. 2023, 45, 264–280. [Google Scholar] [CrossRef]
  50. Zhang, J.; Chen, S. Financial Development, Environmental Regulations and Green Economic Transition. J. Financ. Econ. 2021, 47, 78–93. [Google Scholar]
  51. Xie, Z.; Wu, R.; Wang, S. How technological progress affects the carbon emission efficiency? Evidence from national panel quantile regression. J. Clean. Prod. 2021, 307, 127133. [Google Scholar] [CrossRef]
  52. Wang, A.; Lin, W.; Liu, B.; Wang, H.; Xu, H. Does smart city construction improve the green utilization efficiency of urban land? Land 2021, 10, 657. [Google Scholar] [CrossRef]
  53. Chen, W.; Chen, W.; Ning, S.; Liu, E.; Zhou, X.; Wang, Y.; Zhao, M. Exploring the industrial land use efficiency of China’s resource-based cities. Cities 2019, 93, 215–223. [Google Scholar] [CrossRef]
  54. Ge, X.; Liu, X. Urban land use efficiency under resource-based economic transformation—A case study of Shanxi Province. Land 2021, 10, 850. [Google Scholar] [CrossRef]
Figure 1. Location of the study area.
Sustainability 16 07832 g001
Figure 2. GUEUL in Bohai Rim region from 2006 to 2021.
Sustainability 16 07832 g002
Figure 3. Spatial distribution of the GUEUL in the Bohai Rim region.
Sustainability 16 07832 g003
Table 1. The index evaluation system of GUEUL.
Layer of
Criteria
Layer of
Factors
Layer of IndicatorsUnit
Input
indicator
LandUrban built-up areakm2
CapitalFixed capital stock10,000 yuan
Water
resources
Total urban water supply10,000 tons
EnergyEnergy consumption per unit of GDPTons of standard coal/10,000 yuan
LaborNumber of employees in the secondary and tertiary industries10,000 people
Desired output indicatorEconomic
benefits
Value-added of secondary and tertiary industries100 million yuan
Social
benefits
Social development index——
Environmental
benefits
Green coverage rate in built-up areas%
Undesired output indicatorindustrial pollutionIndustrial pollutant composite index——
carbon footprintCarbon emissions from urban built-up land10,000 tons
Table 2. GUEUL in the Bohai Rim region.
PeriodRate of Efficiency Change (%)Change in the Number of Evaluation Units (Units)
Low-Value ZoneMedium-Low-Value ZoneMedium-High-Value ZoneHigh-Value Zone
Continuous upward period (2006–2009)18.70−7−227
Fluctuating downward period (2010–2016)−12.1828−4−6
Fluctuating upward period (2017–2021)13.96−2−4−28
Table 3. Unit root test results.
VariableLLCHTIPSFindings
ρ−6.5825 ***
(0.0000)
0.3628 ***
(0.000)
−5.5935 ***
(0.0000)
stationary
ISU−8.0525 ***
(0.0000)
−0.1626 ***
(0.0000)
−12.2569 ***
(0.0000)
stationary
ISR−9.0916 ***
(0.0000)
0.1558 ***
(0.0000)
−7.9616 ***
(0.0000)
stationary
IST−8.2536 ***
(0.0000)
0.5583
(0.2579)
−4.0749 ***
(0.0000)
non-stationary
EC−5.3737 ***
(0.0000)
0.2459 ***
(0.0000)
−8.7070 ***
(0.0000)
stationary
lnST−5.1355 ***
(0.0000)
0.1950 ***
(0.0000)
−9.2648 ***
(0.0000)
stationary
ER−7.3823 ***
(0.0000)
0.0769 ***
(0.0000)
−10.3359 ***
(0.0000)
stationary
PD2.1432
(0.9840)
0.5350
(0.1048)
−9.2646 ***
(0.0000)
non-stationary
ρ−9.8346 ***
(0.0000)
−0.1965 ***
(0.0000)
−12.2919 ***
(0.0000)
stationary
∆ISU−14.0255 ***
(0.0000)
−0.4996 ***
(0.0000)
−15.3939 ***
(0.0000)
stationary
∆ISR−13.8165 ***
(0.0000)
−0.3533 ***
(0.0000)
−13.2326 ***
(0.0000)
stationary
∆IST−9.2888 ***
(0.0000)
−0.0508 ***
(0.0000)
−10.6169 ***
(0.0000)
stationary
∆EC−10.6387 ***
(0.0000)
−0.2667 ***
(0.0000)
−13.2615 ***
(0.0000)
stationary
∆lnST−11.4734 ***
(0.0000)
−0.3353 ***
(0.0000)
−13.9996 ***
(0.0000)
stationary
∆ER−11.8395 ***
(0.0000)
−0.4432 ***
(0.0000)
−14.7458 ***
(0.0000)
stationary
∆PD−4.9839 ***
(0.0000)
−0.0140 ***
(0.0000)
−13.2836 ***
(0.0000)
stationary
Notes: *** p < 0.01; the values in brackets are p-values.
Table 4. Results of fixed-effect panel quantile regression.
VariableQuantile Levels
Q20Q40Q60Q80
ISU0.0066 ***
(0.000)
0.0059 ***
(0.000)
0.0039 ***
(0.000)
0.0012 ***
(0.000)
ISR0.7601 ***
(0.000)
0.6945 ***
(0.000)
0.9512 ***
(0.000)
1.3375 ***
(0.000)
IST0.5152 ***
(0.000)
1.2547 ***
(0.000)
0.5904 **
(0.021)
0.3060 ***
(0.000)
EC0.0003
(0.827)
0.0053 ***
(0.006)
0.0173
(0.129)
0.0087 **
(0.040)
lnST−0.0176 ***
(0.000)
−0.0372 ***
(0.000)
−0.0277 ***
(0.000)
−0.0074 ***
(0.000)
ER−0.0286 **
(0.044)
−0.0923 ***
(0.000)
−0.0808 **
(0.025)
0.0552 ***
(0.001)
PD−0.3198 ***
(0.000)
−0.4390 ***
(0.000)
−0.3404 ***
(0.000)
−0.3989 ***
(0.000)
Notes: ** p < 0.05, *** p < 0.01; the values in brackets are standard error.
Table 5. Results of robustness test.
VariableQuantile Levels
Q20Q40Q60Q80
ISU0.0553 ***
(0.000)
0.0709 ***
(0.000)
0.0640 ***
(0.000)
0.0180 ***
(0.000)
ISR0.4566 ***
(0.000)
1.0915 ***
(0.000)
1.2617 ***
(0.000)
1.6698 ***
(0.000)
IST0.5081 ***
(0.000)
1.0755 ***
(0.000)
0.8632 **
(0.013)
0.3662 ***
(0.000)
EC0.0014
(0.509)
0.0083 ***
(0.006)
0.0074
(0.129)
0.0047 ***
(0.002)
lnST−0.0137 ***
(0.000)
−0.0550 ***
(0.000)
−0.0401 ***
(0.000)
−0.0209 ***
(0.000)
ER0.1036 **
(0.000)
−0.1881 ***
(0.000)
−0.2116 **
(0.025)
−0.0619 ***
(0.000)
PD−0.2242 ***
(0.000)
−0.3428 ***
(0.000)
−0.4953 ***
(0.000)
−0.2775 ***
(0.000)
Notes: ** p < 0.05, *** p < 0.01; the values in brackets are standard error.
Disclaimer/Publisher’s Note: The statements, opinions and data contained in all publications are solely those of the individual author(s) and contributor(s) and not of MDPI and/or the editor(s). MDPI and/or the editor(s) disclaim responsibility for any injury to people or property resulting from any ideas, methods, instructions or products referred to in the content.

