Study on Non-Point Source Pollution Prevention and Control System in Nansi Lake Basin Based on System Dynamics Approach
Abstract
:1. Introduction
2. Materials and Methods
2.1. Study Area
2.2. Datasets
2.3. Methods
2.3.1. Export Coefficient Model
2.3.2. The Export Coefficients for Different Land Use Types
2.3.3. System Dynamics
2.3.4. Sensitivity Analysis
3. Results
3.1. Trends in NPS Pollution
3.1.1. Status of NPS Pollution Loads
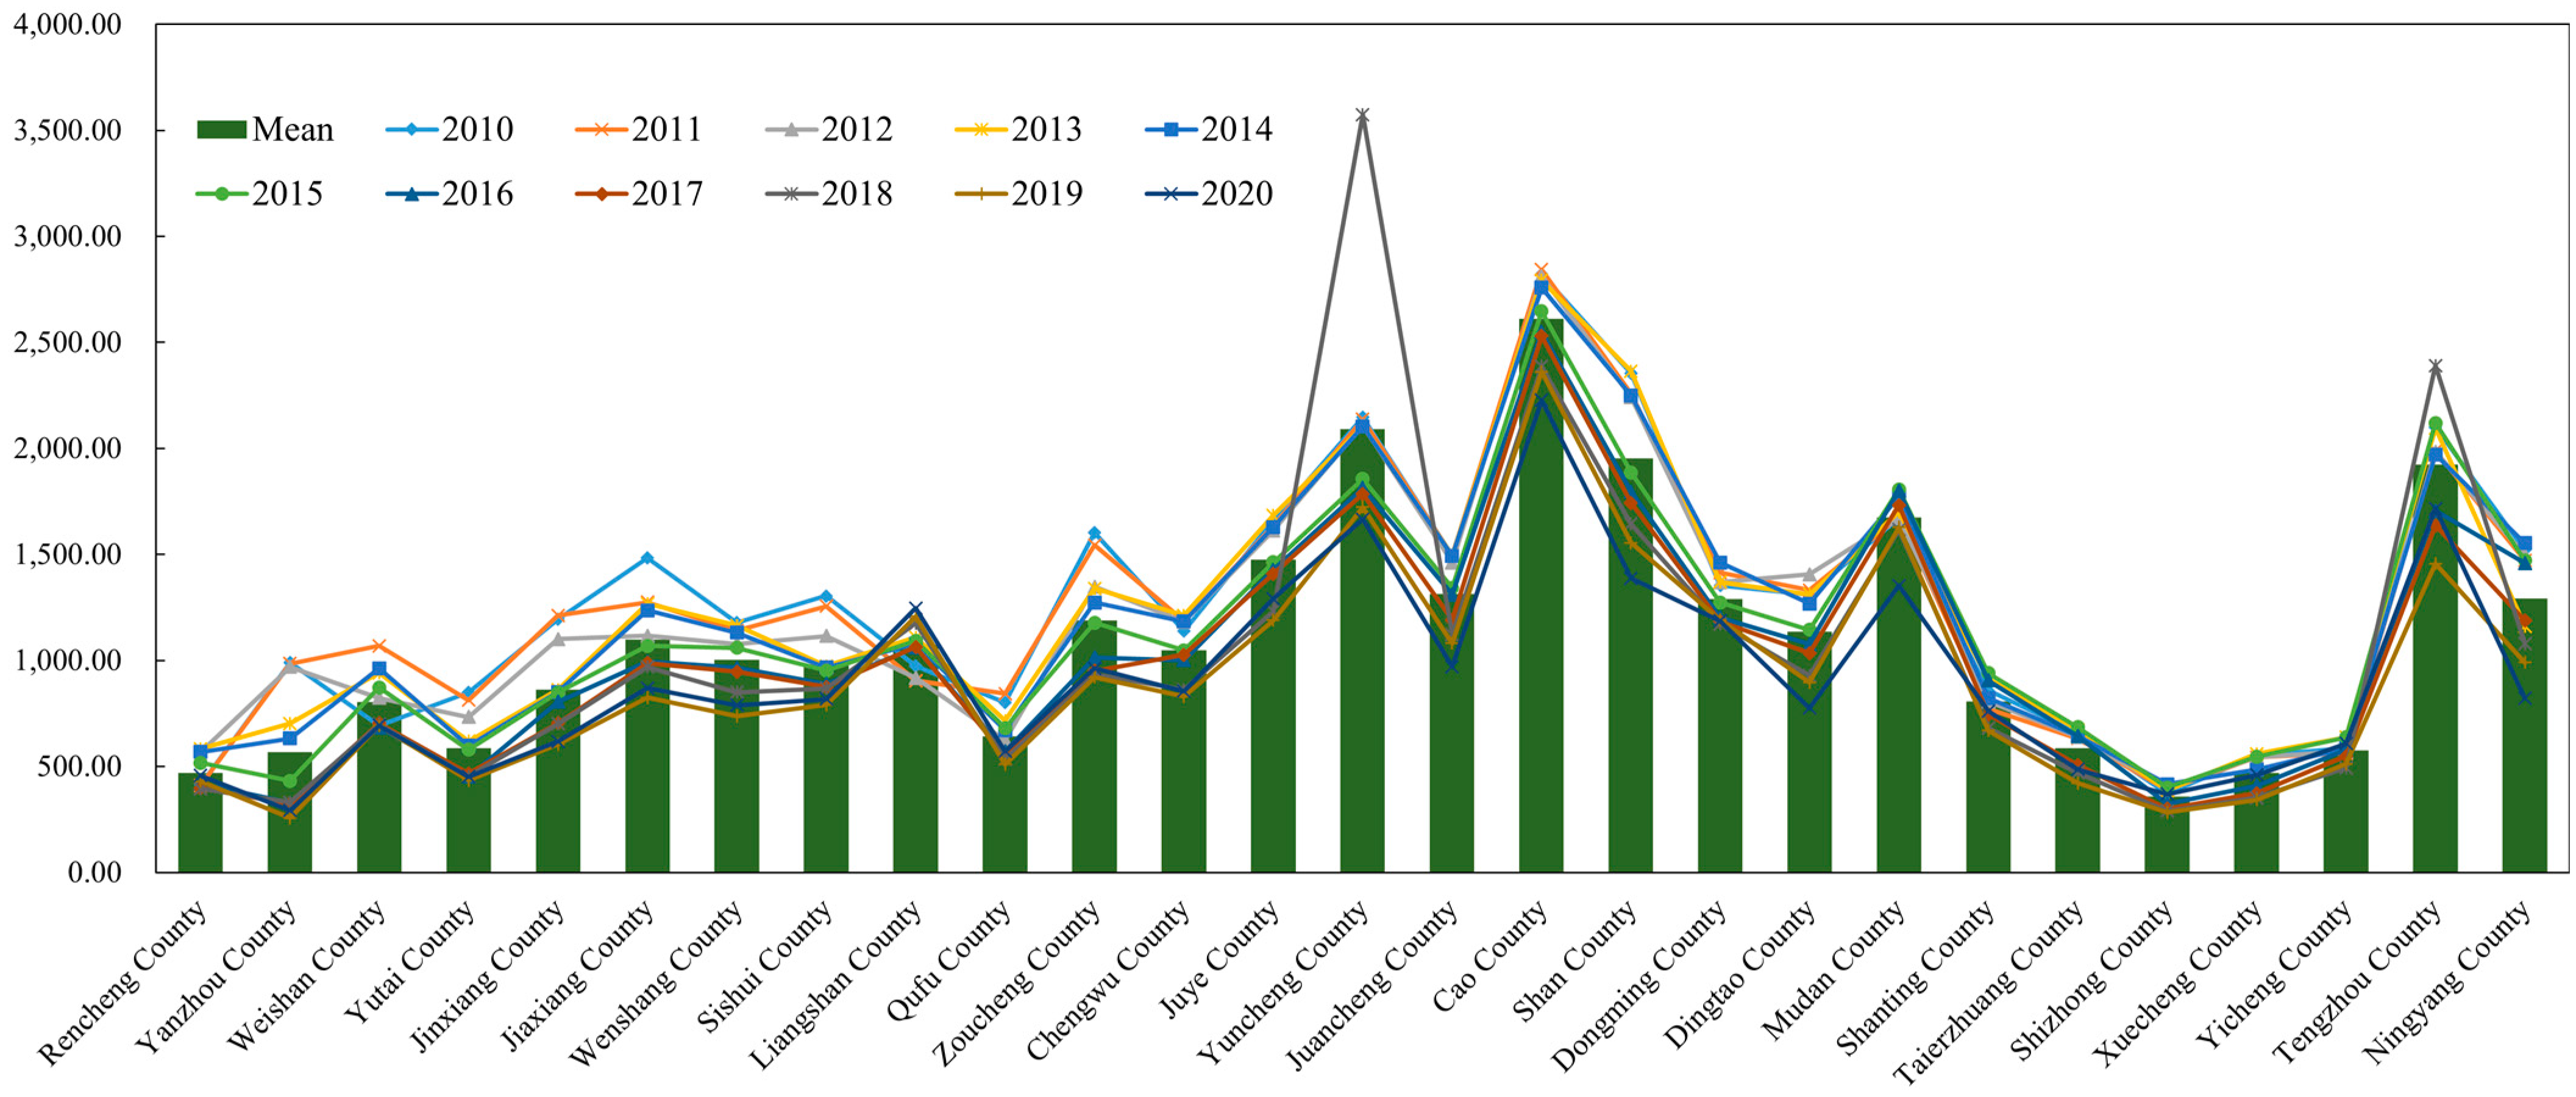
3.1.2. Spatial and Temporal Variation of NPS Loads
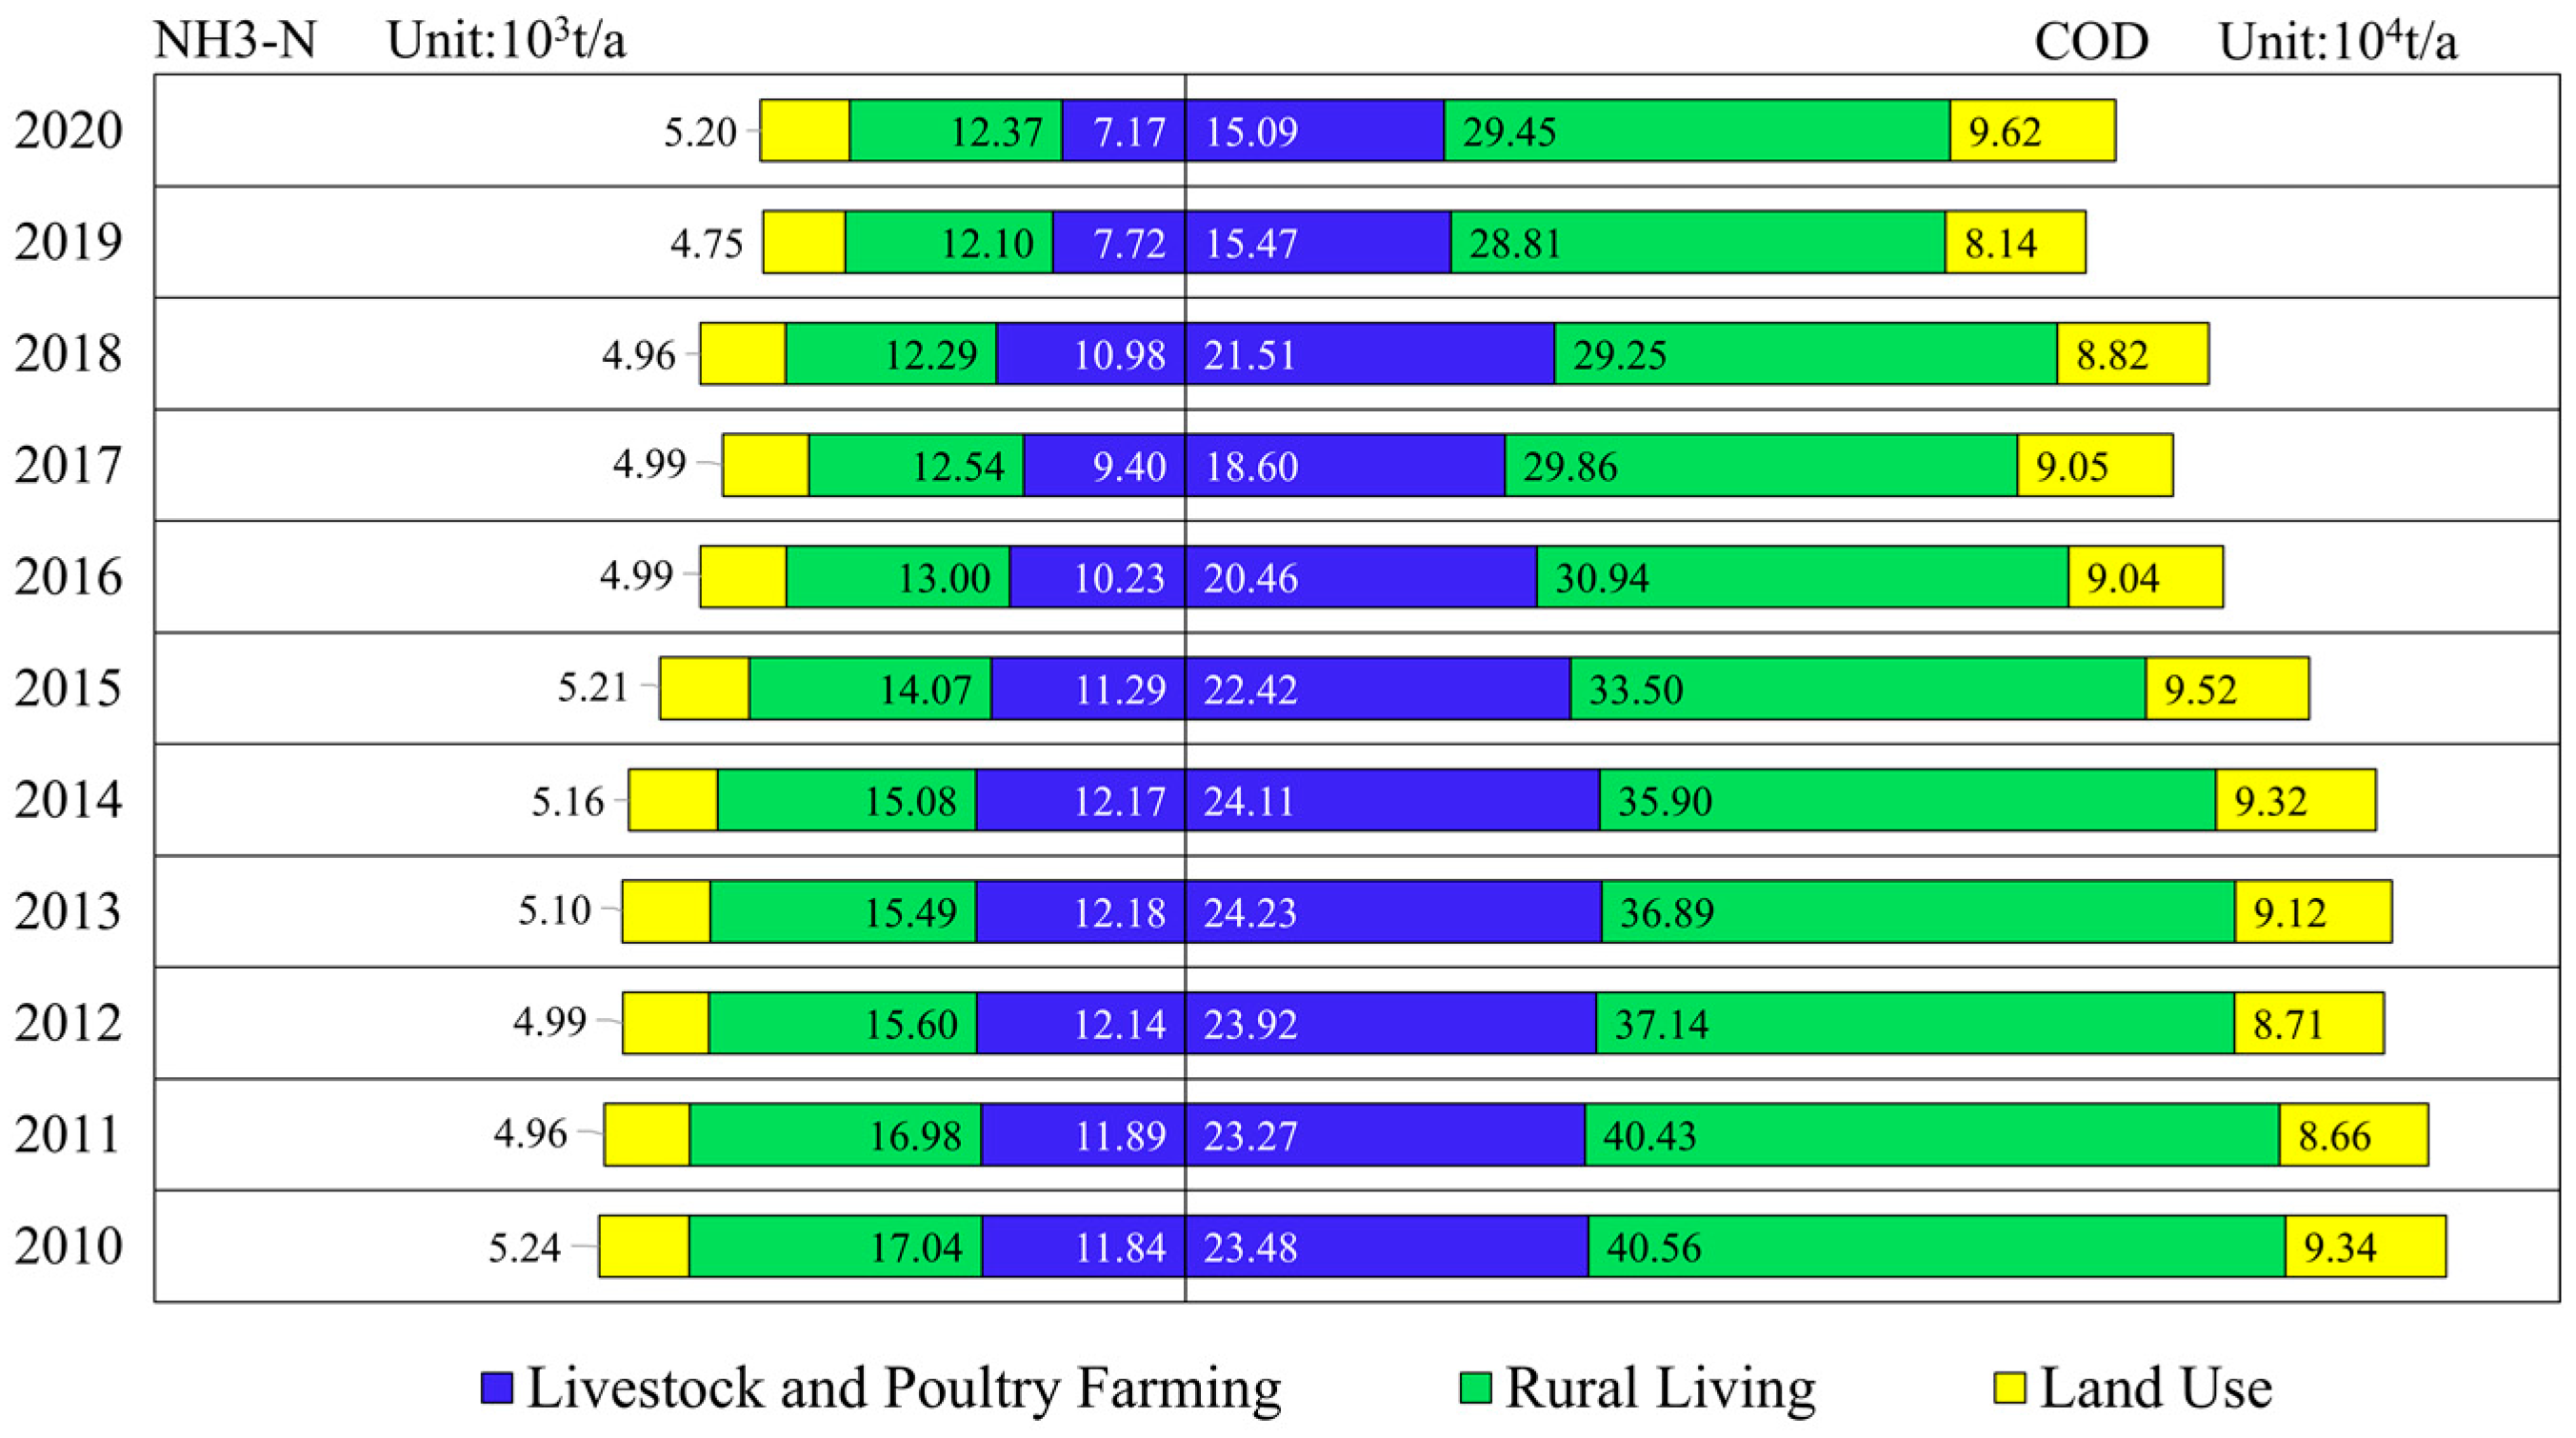
3.1.3. Analysis of Sources of NPS Pollution Loads
3.2. SD Analysis
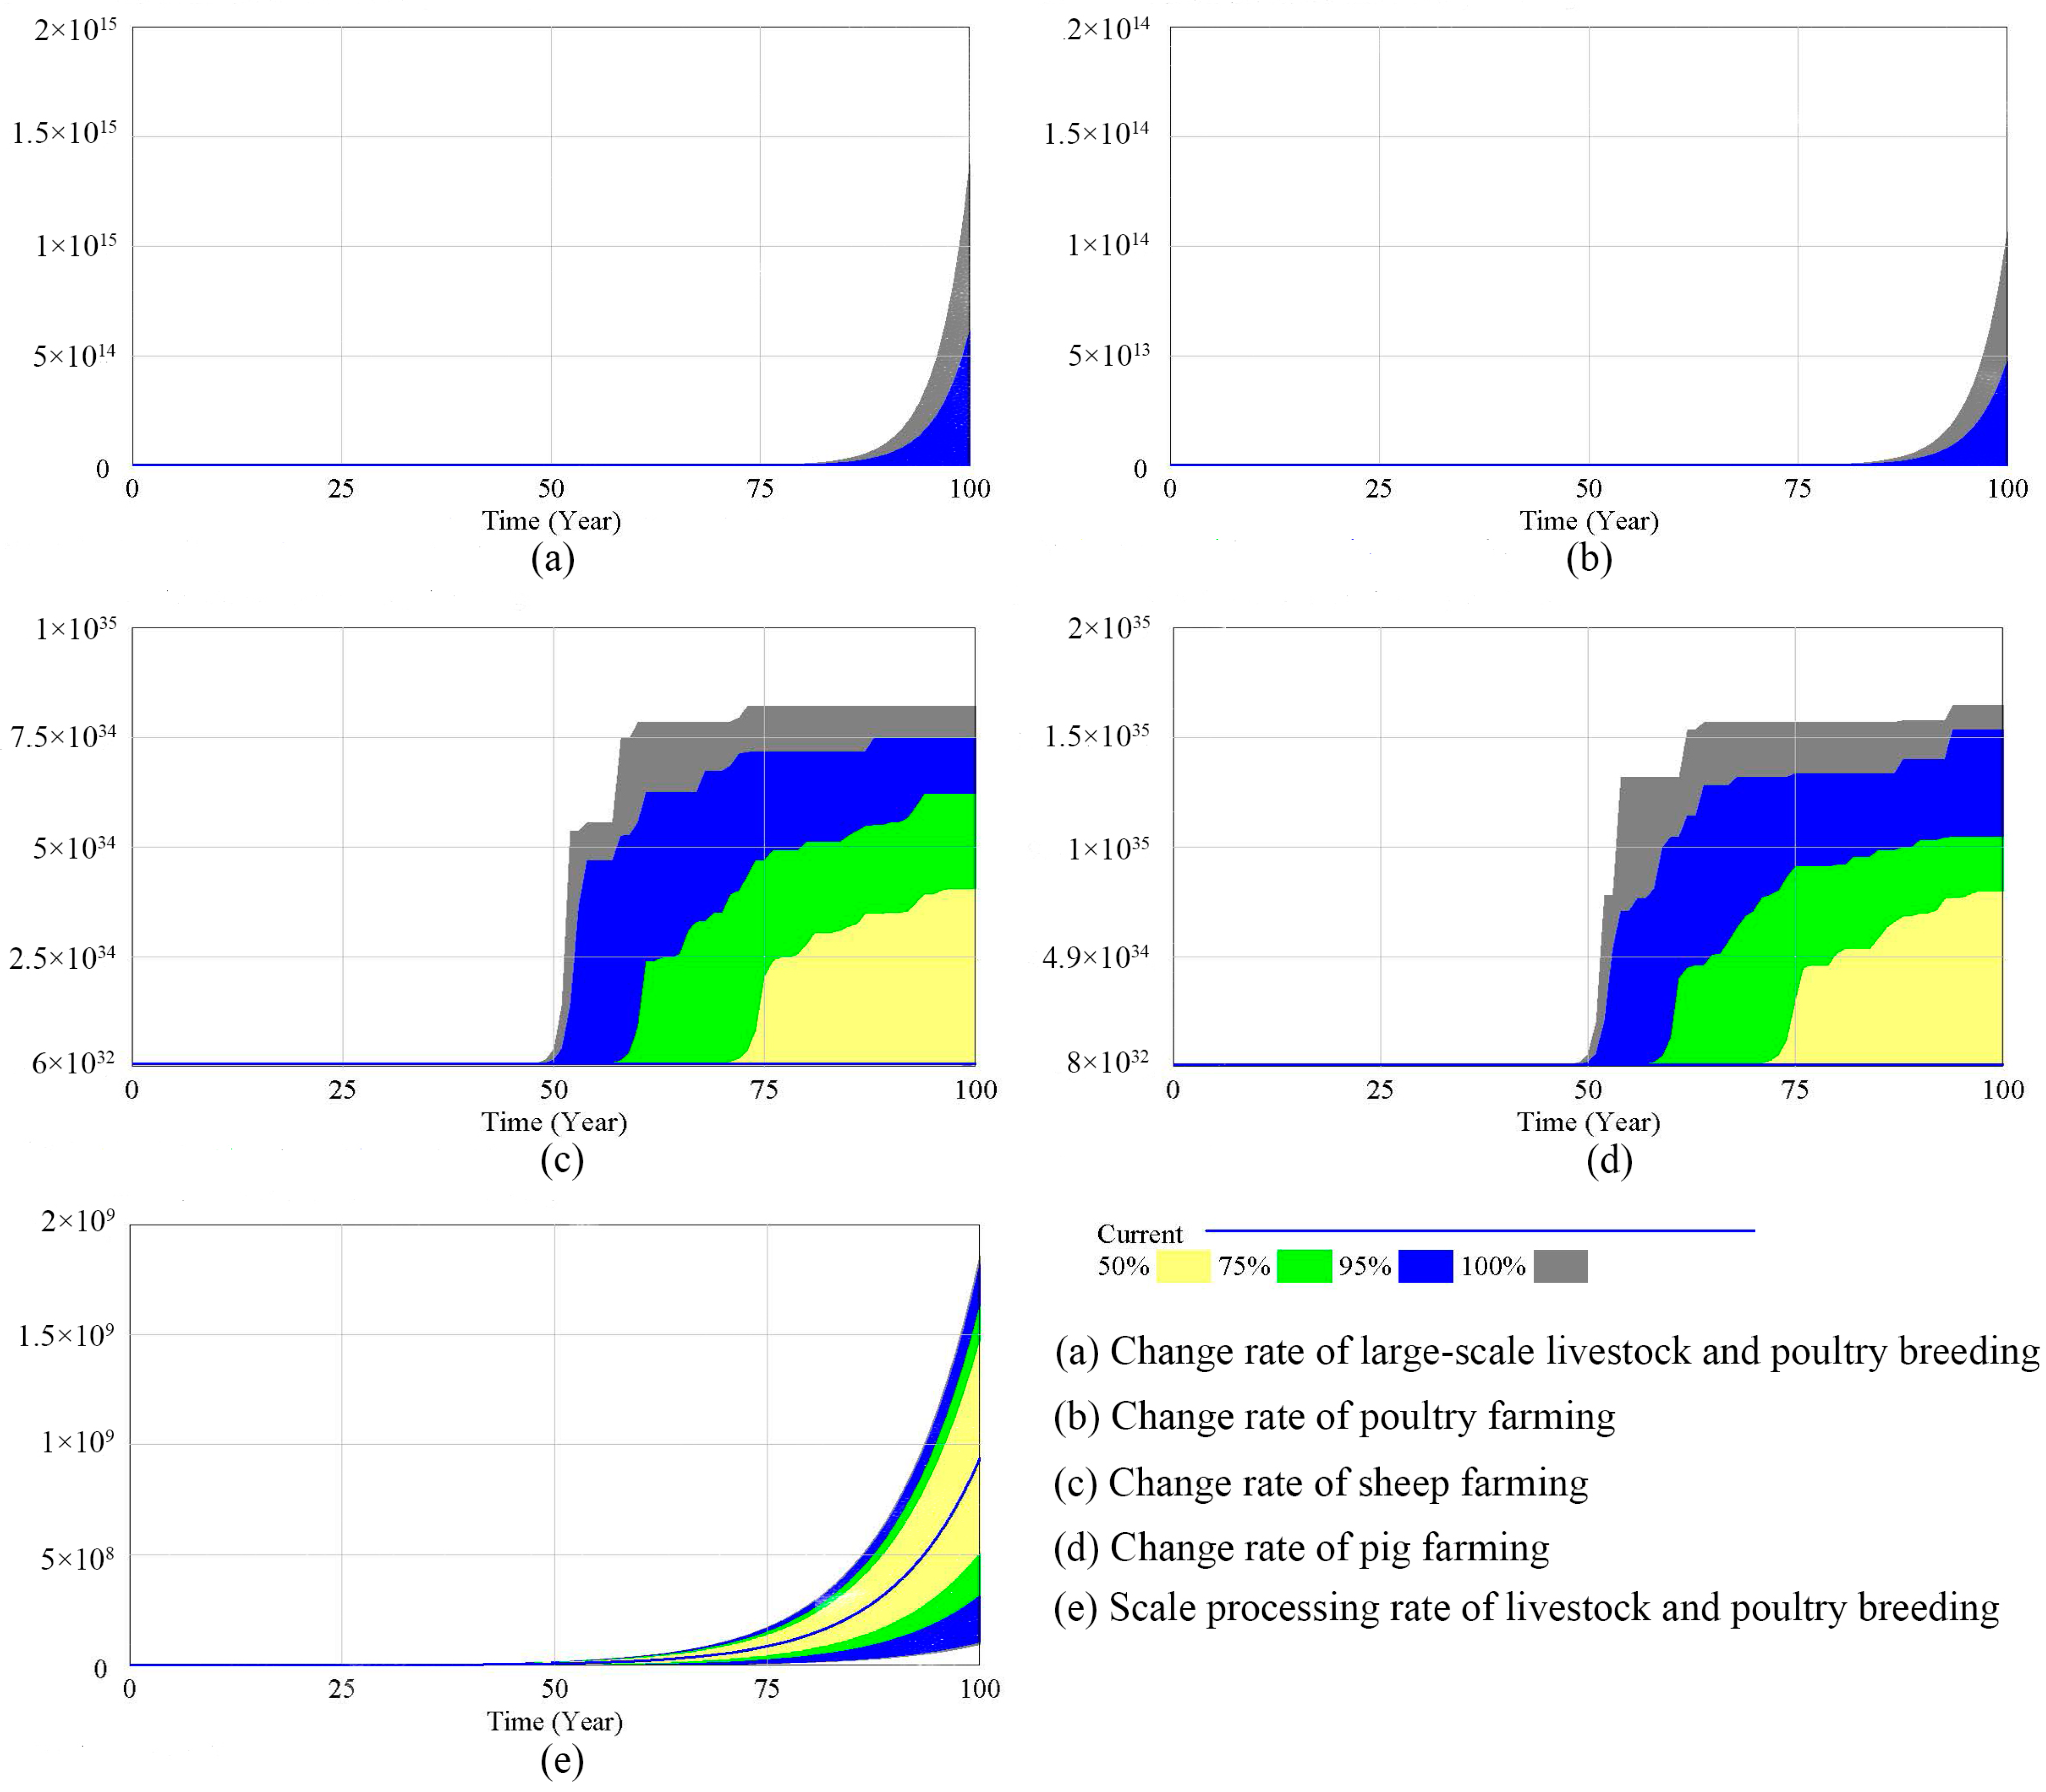
3.2.1. Sensitivity Analysis of a SD Model for NPS Pollution
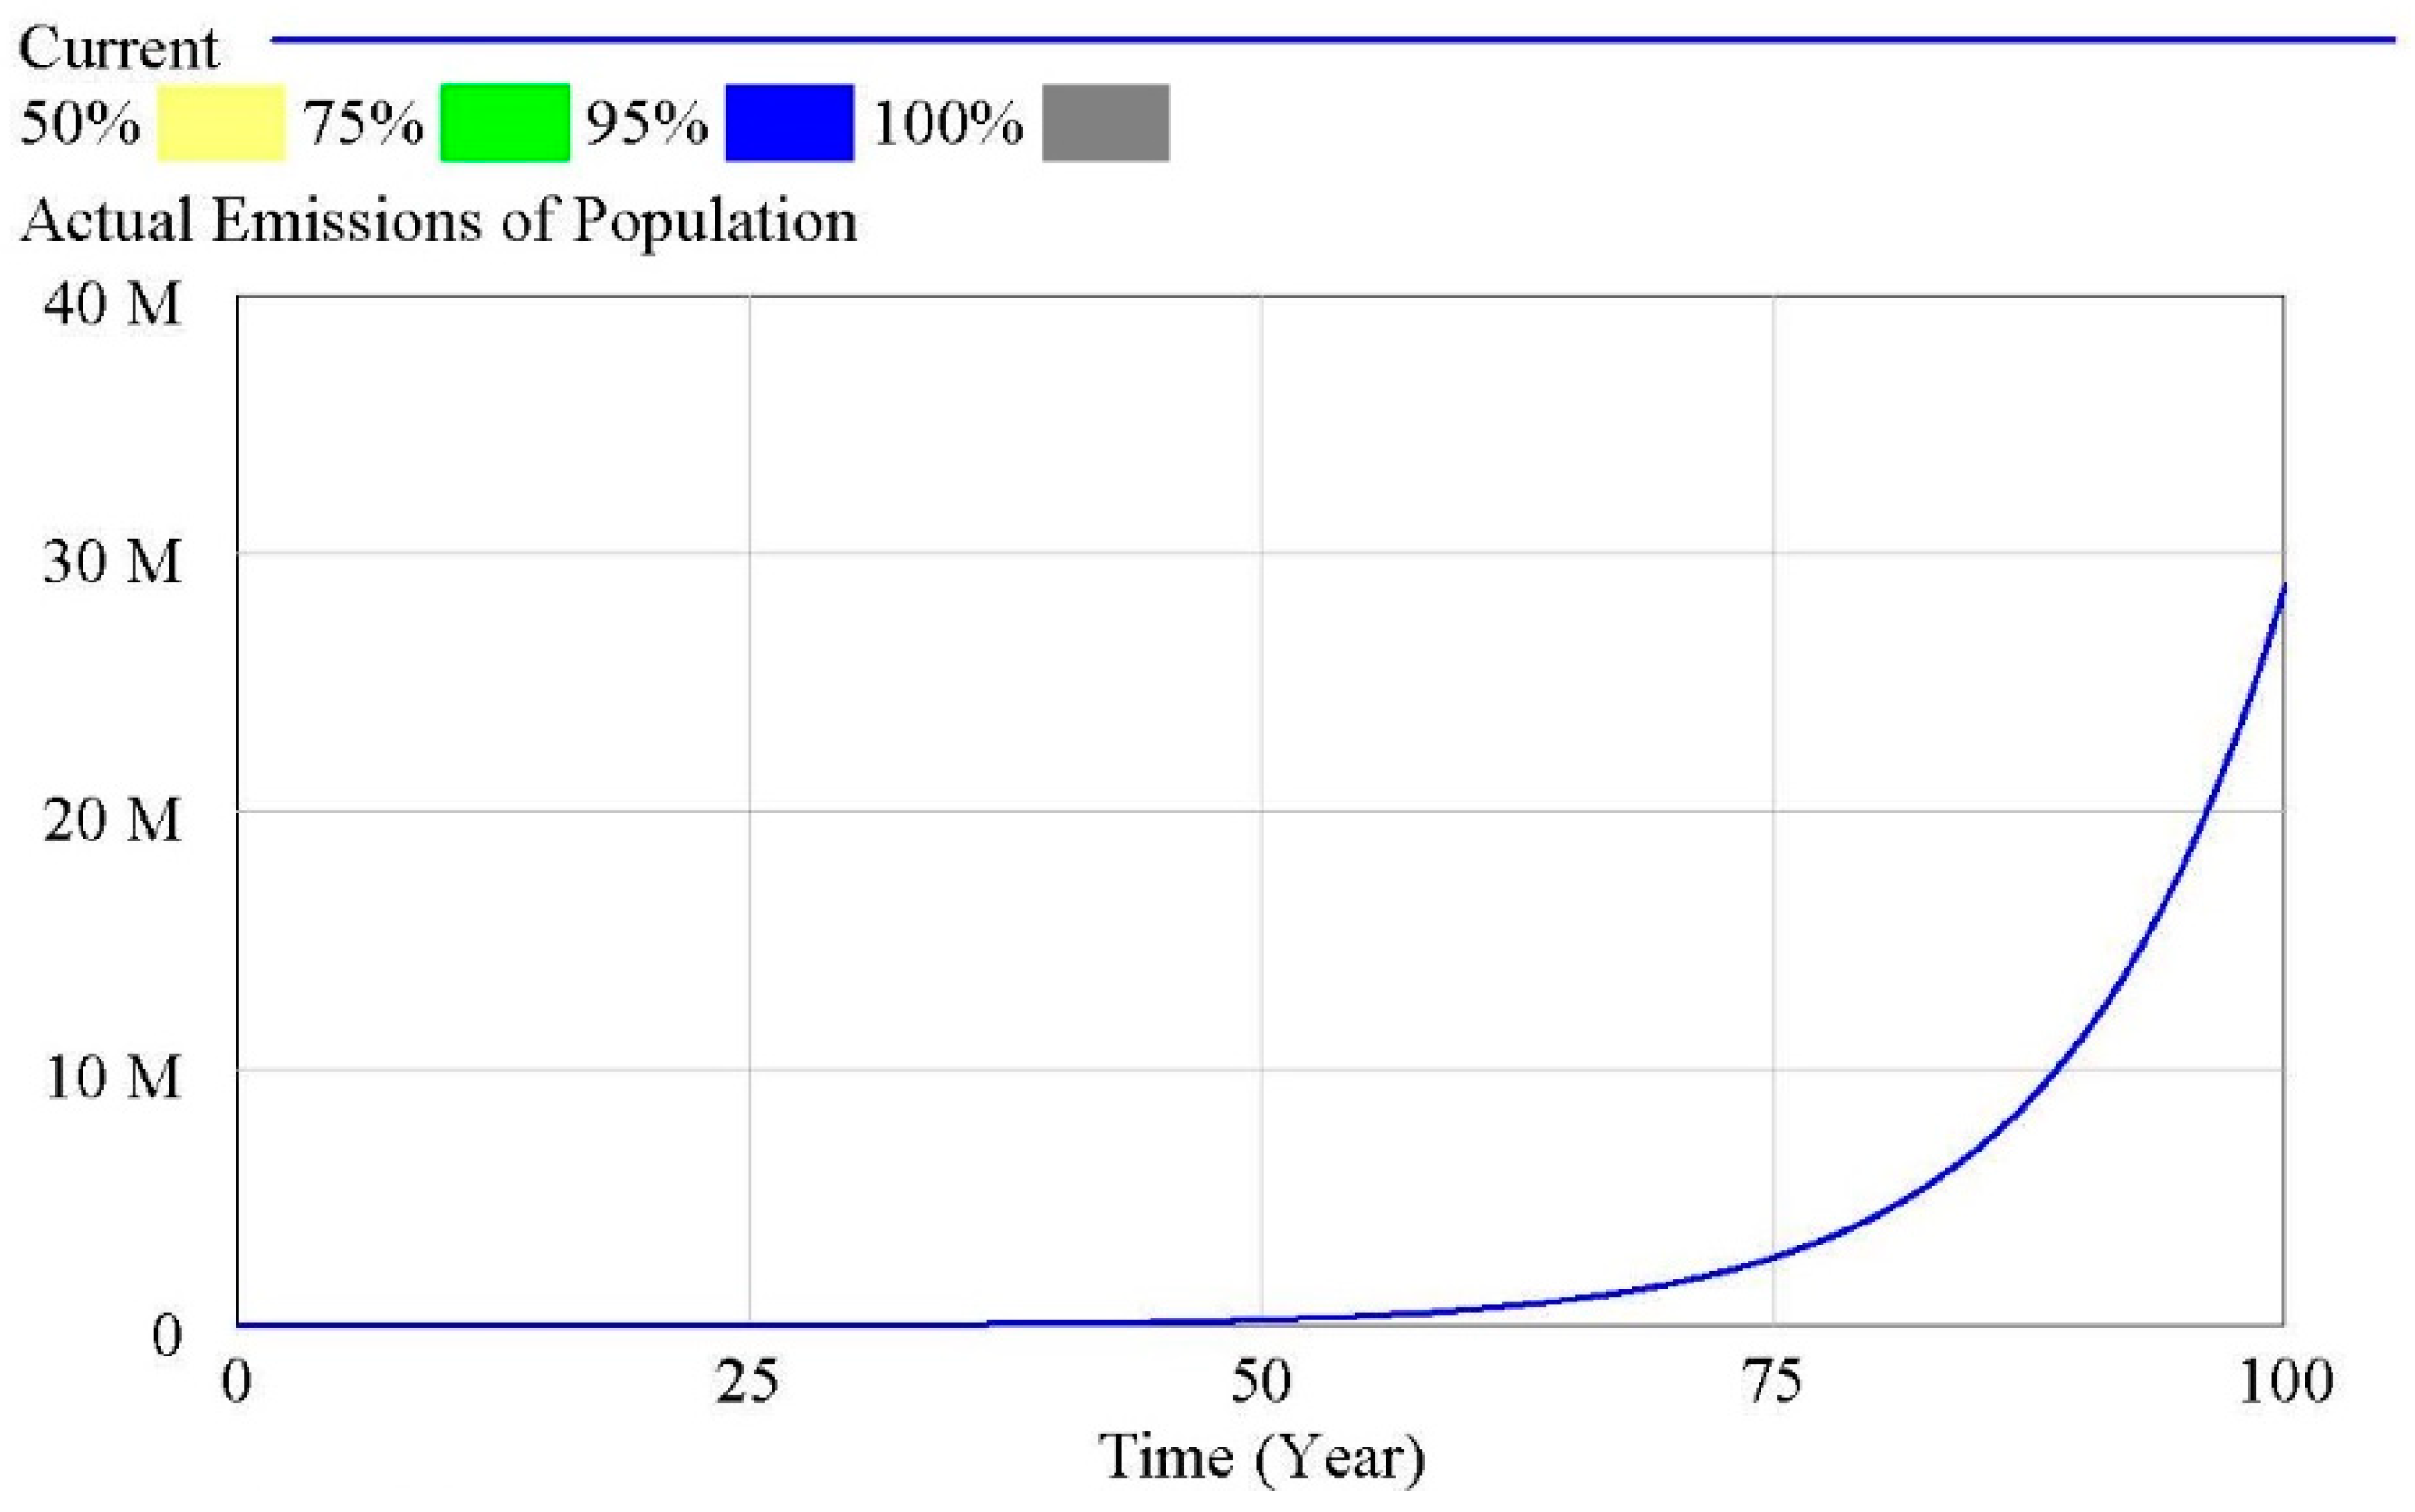
3.2.2. Modelling the SD of NPS Pollution
4. Discussion
4.1. Model Validity Testing
4.2. Sources of NPS Pollution
4.3. Modelling of NPS Pollution under Different Scenarios
4.4. Study Limitations and Future Directions
5. Conclusions
Author Contributions
Funding
Informed Consent Statement
Data Availability Statement
Conflicts of Interest
References
- Cai, Y.; Rong, Q.; Yang, Z.; Yue, W.; Tan, Q. An export coefficient based inexact fuzzy bi-level multi-objective programming model for the management of agricultural nonpoint source pollution under uncertainty. J. Hydrol. 2018, 557, 713–725. [Google Scholar] [CrossRef]
- Zhang, B.-L.; Cui, B.-H.; Zhang, S.-M.; Wu, Q.-Y.; Yao, L. Source apportionment of nitrogen and phosphorus from non-point source pollution in Nansi Lake Basin, China. Environ. Sci. Pollut. Res. 2018, 25, 19101–19113. [Google Scholar] [CrossRef]
- Guo, J.; Zuo, P.; Yang, L.; Pan, Y.; Wang, L. Quantitative identification of non-point sources of nitrate in urban channels based on dense in-situ samplings and nitrate isotope composition. Chemosphere 2021, 263, 128219. [Google Scholar] [CrossRef] [PubMed]
- Corwin, L.D. Non-point Pollution Modeling Based on GIS. Soil Water Conserv. 1998, 1, 75–88. [Google Scholar]
- Li, Y.; Wang, H.; Deng, Y.; Liang, D.; Li, Y.; Gu, Q. Applying water environment capacity to assess the non-point source pollution risks in watersheds. Water Res. 2023, 240, 120092. [Google Scholar] [CrossRef] [PubMed]
- Zhao, X.; Shi, J.; Xue, L.; Li, W.; Zamanian, K.; Han, J.; Chen, S. Water Point and Non-Point Nitrogen Pollution Due to Land-Use Change and Nitrate Deposition in China from 2000 to 2020. Water 2024, 16, 1396. [Google Scholar] [CrossRef]
- Corwin, L.D.; Loague, K.M. Applications of GIS to the Modeling of Non-Point Source Pollutants in the Vadose Zone; Bouyoucos Conference 1995: Riverside, CA, USA; Soil Science Society of America: Madison, WI, USA, 1996. [Google Scholar]
- Griffin, R., Jr. Introducing NPS water pollution. EPA J. 1991, 17, 6–9. [Google Scholar]
- Lena, B.V. Nutrient Preserving in Riverine Transitional Strip. J. Hum. Environ. 1994, 3, 342–347. [Google Scholar]
- Foy, R.H. The contribution of agricultural phosphorus to eutrophication. Proc.-Fertil. Soc. 2002, 365, 1–32. [Google Scholar]
- Kronvang, B.; Græsbøll, P.; Larsen, S.E.; Svendsen, L.M. Diffuse nutrient losses in Denmark. Water Sci. Technol. 1996, 33, 81–88. [Google Scholar] [CrossRef]
- Boers, P.C. Nutrient emissions from agriculture in the Netherlands, causes and remedies. Water Sci. Technol. 1996, 33, 183–189. [Google Scholar] [CrossRef]
- Chang, M.; McBroom, M.W.; Beasley, R.S. Roofing as a source of nonpoint water pollution. J. Environ. Manag. 2004, 73, 307–315. [Google Scholar] [CrossRef]
- Zou, L.; Liu, Y.; Wang, Y.; Hu, X. Assessment and analysis of agricultural non-point source pollution loads in China: 1978–2017. J. Environ. Manag. 2020, 263, 110400. [Google Scholar] [CrossRef]
- Schaffner, M.; Bader, H.-P.; Scheidegger, R. Modeling the contribution of point sources and non-point sources to Thachin River water pollution. Sci. Total Environ. 2009, 407, 4902–4915. [Google Scholar] [CrossRef] [PubMed]
- Ongley, E.D.; Xiaolan, Z.; Tao, Y. Current status of agricultural and rural non-point source Pollution assessment in China. Environ. Pollut. 2010, 158, 1159–1168. [Google Scholar] [CrossRef]
- Duncan, R. Regulating agricultural land use to manage water quality: The challenges for science and policy in enforcing limits on non-point source pollution in New Zealand. Land Use Policy 2014, 41, 378–387. [Google Scholar] [CrossRef]
- Chang, X.; Jia, Z.; Feng, J.; Duan, T.; Li, Y.X. Refining the diagnostics of non-point source metals pollution to urban lakes based on interaction normalized PMF coupled with Bayesian network. Environ. Pollut 2022, 304, 119194. [Google Scholar] [CrossRef] [PubMed]
- Guo, W.; Fu, Y.; Ruan, B.; Ge, H.; Zhao, N. Agricultural non-point source pollution in the Yongding River Basin. Ecol. Indic. 2014, 36, 254–261. [Google Scholar] [CrossRef]
- Li, C.-H.; Wang, Y.-K.; Ye, C.; Wei, W.-W.; Zheng, B.-H.; Xu, B. A proposed delineation method for lake buffer zones in watersheds dominated by non-point source pollution. Sci. Total Environ. 2019, 660, 32–39. [Google Scholar] [CrossRef]
- Wang, S.; Wang, Y.; Wang, Y.; Wang, Z. Assessment of influencing factors on non-point source pollution critical source areas in an agricultural watershed. Ecol. Indic. 2022, 141, 109084. [Google Scholar] [CrossRef]
- Wang, W.; Chen, L.; Shen, Z. Dynamic export coefficient model for evaluating the effects of environmental changes on non-point source pollution. Sci. Total Environ. 2020, 747, 141164. [Google Scholar] [CrossRef]
- Li, H.; Zhang, J.; Zhang, S.; Zhang, W.; Zhang, S.; Yu, P.; Song, Z. A framework to assess spatio-temporal variations of potential non-point source pollution risk for future land-use planning. Ecol. Indic. 2022, 137, 108751. [Google Scholar] [CrossRef]
- Rudra, R.; Dickinson, W.; Euw, E.V. The Importance of Precise Rainfall Inputs in Nonpoint Source Pollution Modeling. Environ. Sci. Trans. ASABE 1993, 36, 44. [Google Scholar] [CrossRef]
- Xue, J.; Wang, Q.; Zhang, M. A review of non-point source water pollution modeling for the urban–rural transitional areas of China: Research status and prospect. Sci. Total Environ. 2022, 826, 154146. [Google Scholar] [CrossRef]
- Tiyasha; Tung, T.M.; Yaseen, Z.M. A survey on river water quality modelling using artificial intelligence models: 2000–2020. J. Hydrol. 2020, 585, 124670. [Google Scholar] [CrossRef]
- Amin, M.G.M.; Veith, T.L.; Collick, A.S.; Karsten, H.D.; Buda, A.R. Simulating hydrological and nonpoint source pollution processes in a karst watershed: A variable source area hydrology model evaluation. Agric. Water Manag. 2017, 180, 212–223. [Google Scholar] [CrossRef]
- Shah, V.; Shen, Z.; Chen, L.; Hong, Q.; Xie, H.; Qiu, J.; Liu, R. Vertical Variation of Nonpoint Source Pollutants in the Three Gorges Reservoir Region. PLoS ONE 2013, 8, e71194. [Google Scholar] [CrossRef]
- Islam, F.; Lian, Q.; Ahmad, Z.U.; Zappi, M.E.; Yao, L.; Gang, D.D. Nonpoint Source Pollution. Water Environ. Res. 2018, 90, 1872–1898. [Google Scholar] [CrossRef] [PubMed]
- Nobre, R.L.G.; Caliman, A.; Cabral, C.R.; Araújo, F.d.C.; Guérin, J.; Dantas, F.d.C.C.; Quesado, L.B.; Venticinque, E.M.; Guariento, R.D.; Amado, A.M.; et al. Precipitation, landscape properties and land use interactively affect water quality of tropical freshwaters. Sci. Total Environ. 2020, 716, 137044. [Google Scholar] [CrossRef] [PubMed]
- Sarkar, S.; Yonce, H.N.; Keeley, A.; Canfield, T.J.; Butcher, J.B.; Paul, M.J. Integration of SWAT and HSPF for Simulation of Sediment Sources in Legacy Sediment-Impacted Agricultural Watersheds. JAWRA J. Am. Water Resour. Assoc. 2019, 55, 497–510. [Google Scholar] [CrossRef] [PubMed]
- Liu, R.M.; Yang, Z.F.; Ding, X.W.; Shen, Z.Y.; Wu, X.; Liu, F. Effect of Land Use/Cover Change on Pollution Load of Non-Point Source in Upper Reach of Yangtze River Basin. Environ. Sci. 2006, 12, 2407–2414. [Google Scholar]
- Johnes, P.J. Evaluation and management of the impact of land use change on the nitrogen and phosphorus load delivered to surface waters: The export coefficient modelling approach. J. Hydrol. 1996, 183, 3–4. [Google Scholar] [CrossRef]
- Rudra, R.P.; Mekonnen, B.A.; Shukla, R.; Shrestha, N.K.; Goel, P.K.; Daggupati, P.; Biswas, A. Currents Status, Challenges, and Future Directions in Identifying Critical Source Areas for Non-Point Source Pollution in Canadian Conditions. Agriculture 2020, 10, 468. [Google Scholar] [CrossRef]
- Hui, D.; Kuai, P.; Li, W.; Liu, N. Evaluating the Effects of Land Use Planning for Non-Point Source Pollution Based on a System Dynamics Approach in China. PLoS ONE 2015, 10, e0135572. [Google Scholar] [CrossRef]
- Guan, D.; Gao, W.; Su, W.; Li, H.; Hokao, K. Modeling and dynamic assessment of urban economy–resource–environment system with a coupled system dynamics–geographic information system model. Ecol. Indic. 2011, 11, 1333–1344. [Google Scholar] [CrossRef]
- Shen, Q.; Chen, Q.; Tang, B.-S.; Yeung, S.; Hu, Y.; Cheung, G. A system dynamics model for the sustainable land use planning and development. Habitat Int. 2009, 33, 15–25. [Google Scholar] [CrossRef]
- Sušnik, J.; Vamvakeridou-Lyroudia, L.S.; Savić, D.A.; Kapelan, Z. Integrated System Dynamics Modelling for water scarcity assessment: Case study of the Kairouan region. Sci. Total Environ. 2012, 440, 290–306. [Google Scholar] [CrossRef]
- Zhang, B.; Le, Y.; Zhang, S.; Bernard, E.; Lawrence, T. GIS and L-THIA Based Analysis on Variations of Non-point Pollution in Nansi Lake Basin, China. J. Donghua Univ. Engl. Ed. 2016, 33, 851–858. [Google Scholar]
- Yanan, W.; Kun, Z.; Baolei, Z. Effects of Wlater Polutant Emission Standard in Watersheds of South-to-North Water Diversion Project on Economy of Cities along the Water Transfer Line in Shandong Province. South-North Water Transf. Water Sci. Technol. 2013, 11, 81–85. [Google Scholar]
- Bureau, B.S. Beijing Statistical Yearbook; China Statistics Press: Beijing, China, 2021. [Google Scholar]
- Worrall, F.; Burt, T.P. The impact of land-use change on water quality at the catchment scale: The use of export coefficient and structural models. J. Hydrol. 1999, 221, 75–90. [Google Scholar] [CrossRef]
- Wang, Y.; Liang, J.; Yang, J.; Ma, X.; Li, X.; Wu, J.; Yang, G.; Ren, G.; Feng, Y. Analysis of the environmental behavior of farmers for non-point source pollution control and management: An integration of the theory of planned behavior and the protection motivation theory. J. Environ. Manag. 2019, 237, 15–23. [Google Scholar] [CrossRef]
- Cheng, X.; Chen, L.; Sun, R.; Jing, Y. An improved export coefficient model to estimate non-point source phosphorus pollution risks under complex precipitation and terrain conditions. Environ. Sci. Pollut. Res. 2018, 25, 20946–20955. [Google Scholar] [CrossRef] [PubMed]
- Rui, Z. Characteristics of Non-Point Source Pollution Load and Its Influence on Water Quality in Ciyao River Basin. Master’s Thesis, Taiyuan University of Technology, Taiyuan, China, 2022. [Google Scholar] [CrossRef]
- Shuo, W. Simulation Study on Contribution of Agricultural Non-pointSource Pollution to Pollution Load in Wang-Beng Section of Huaihe River Basin. Master’s Thesis, Anhui University of Science and Technology, Huainan, China, 2021. [Google Scholar] [CrossRef]
- Xia, Y.C.; Yuan, Y.B.; Zhan, L.; He, C.; Xia, J.X. Refined Estimation and Empirical Study of Non-point Source Pollution Load in Small Watershed. A Case Study of langhua River Basin Chengdu. J. Chang. River Sci. Res. Inst. 2024, 41, 55–61+69. [Google Scholar]
- Chen, Y.; Yuan, Q.; Han, F.; Zhou, L.; Hong, S. Estimation of Non-point Source Pollution Load of Yangtze Watershed Based on Improved Export Coefficient Model. J. Geomat. 2017, 42, 96–99+104. [Google Scholar]
- Han, R. Study on the Characteristics and Control of Non-Point Source Pollution in the Hanjiang River Basin Take the Yangxian Section above as an Example. Master’s Thesis, Xi’an University of Technology, Xi’an, China, 2021. [Google Scholar] [CrossRef]
- Gong, S.F.; Ding, W.H.; Ju, X.H.; Xiao, N.W.; Ye, Q.S.; Huang, J.; Li, H. Source Analysis and Control Strategies of Non-Point Source Pollution in Typica Agricultural Small Watershed: A Case Study of Danjiangkou Water Conservation Area. Sci. Agric. Sin. 2021, 54, 3919–3931. [Google Scholar]
- Phan, T.D.; Bertone, E.; Stewart, R.A. Critical review of system dynamics modelling applications for water resources planning and management. Clean. Environ. Syst. 2021, 2, 100031. [Google Scholar] [CrossRef]
- Wilkins, A.K.; Tidor, B.; White, J.; Barton, P.I. Sensitivity Analysis for Oscillating Dynamical Systems. SIAM J. Sci. Comput. 2009, 31, 2706–2732. [Google Scholar] [CrossRef] [PubMed]
- Zhu, C.; Li, Y. Long-term hydrological impacts of land use/land cover change from 1984 to 2010 in the Little River Watershed, Tennessee. Int. Soil Water Conserv. Res. 2014, 2, 11–22. [Google Scholar] [CrossRef]
- Abdulkareem, J.H.; Sulaiman, W.N.A.; Pradhan, B.; Jamil, N.R. Long-Term Hydrologic Impact Assessment of Non-point Source Pollution Measured Through Land Use/Land Cover (LULC) Changes in a Tropical Complex Catchment. Earth Syst. Environ. 2018, 2, 67–84. [Google Scholar] [CrossRef]
- Ouyang, W.; Wu, Y.; Hao, Z.; Zhang, Q.; Bu, Q.; Gao, X. Combined impacts of land use and soil property changes on soil erosion in a mollisol area under long-term agricultural development. Sci. Total Environ. 2018, 613–614, 798–809. [Google Scholar] [CrossRef]
- Wu, L.; Long, T.-y.; Liu, X.; Guo, J.-s. Impacts of climate and land-use changes on the migration of non-point source nitrogen and phosphorus during rainfall-runoff in the Jialing River Watershed, China. J. Hydrol. 2012, 475, 26–41. [Google Scholar] [CrossRef]
- Cheng, J.; Lee, X.; Tang, Y.; Pan, W.; Gao, W.; Chen, Y.; Wang, B.; Cheng, H. Changes in above- and below-ground nitrogen stocks and allocations following the conversion of farmland to forest in rocky desertification regions. Agric. Ecosyst. Environ. 2016, 232, 9–16. [Google Scholar] [CrossRef]
- Guan, D.; Zhao, Z.; Tan, J. Dynamic simulation of land use change based on logistic-CA-Markov and WLC-CA-Markov models: A case study in three gorges reservoir area of Chongqing, China. Environ. Sci. Pollut. Res. 2019, 26, 20669–20688. [Google Scholar] [CrossRef]
- Rozos, E.; Dimitriadis, P.; Bellos, V. Machine Learning in Assessing the Performance of Hydrological Models. Hydrology 2021, 9, 5. [Google Scholar] [CrossRef]
- Niraula, R.; Kalin, L.; Srivastava, P.; Anderson, C.J. Identifying critical source areas of nonpoint source pollution with SWAT and GWLF. Ecol. Model. 2013, 268, 123–133. [Google Scholar] [CrossRef]
- Li, L.; Gou, M.; Wang, N.; Ma, W.; Xiao, W.; Liu, C.; La, L. Landscape configuration mediates hydrology and nonpoint source pollution under climate change and agricultural expansion. Ecol. Indic. 2021, 129, 107959. [Google Scholar] [CrossRef]
- Wu, J.; Lu, J. Landscape patterns regulate non-point source nutrient pollution in an agricultural watershed. Sci. Total Environ. 2019, 669, 377–388. [Google Scholar] [CrossRef]
- Shang, X.; Wang, X.; Zhang, D.; Chen, W.; Chen, X.; Kong, H. An improved SWAT-based computational framework for identifying critical source areas for agricultural pollution at the lake basin scale. Ecol. Model. 2012, 226, 1–10. [Google Scholar] [CrossRef]
- Araujo-Pradere, E.A.; Fuller-Rowell, T.J. STORM: An empirical storm-time ionospheric correction model 2. Validation. Radio Sci. 2002, 37. [Google Scholar] [CrossRef]
- Maillard, P.; Pinheiro Santos, N.A. A spatial-statistical approach for modeling the effect of non-point source pollution on different water quality parameters in the Velhas river watershed–Brazil. J. Environ. Manag. 2008, 86, 158–170. [Google Scholar] [CrossRef]
- Polyakov, V.; Fares, A.; Kubo, D.; Jacobi, J.; Smith, C. Evaluation of a non-point source pollution model, AnnAGNPS, in a tropical watershed. Environ. Model. Softw. 2007, 22, 1617–1627. [Google Scholar] [CrossRef]
- Wu, S.; Bashir, M.A.; Raza, Q.-U.-A.; Rehim, A.; Geng, Y.; Cao, L. Application of riparian buffer zone in agricultural non-point source pollution control—A review. Front. Sustain. Food Syst. 2023, 7, 985870. [Google Scholar] [CrossRef]
- Wang, K.; Lin, Z. Characterization of the nonpoint source pollution into river at different spatial scales. Water Environ. J. 2018, 32, 453–465. [Google Scholar] [CrossRef]
- Huang, C.; Zhao, D.; Fan, X.; Liu, C.; Zhao, G. Landscape dynamics facilitated non-point source pollution control and regional water security of the Three Gorges Reservoir area, China. Environ. Impact Assess. Rev. 2022, 92, 106696. [Google Scholar] [CrossRef]
- Jin, B.; Liu, X.; Tan, J.; Shao, X.; Cheng, J. Effect of Plant Buffer Zone–Antifouling Curtain Wall on Reducing Non-Point Source Pollution in Paddy Fields, China. Sustainability 2022, 14, 44. [Google Scholar] [CrossRef]
- Lencha, S.M.; Ulsidso, M.D.; Muluneh, A. Evaluation of Seasonal and Spatial Variations in Water Quality and Identification of Potential Sources of Pollution Using Multivariate Statistical Techniques for Lake Hawassa Watershed, Ethiopia. Appl. Sci. 2021, 11, 8991. [Google Scholar] [CrossRef]




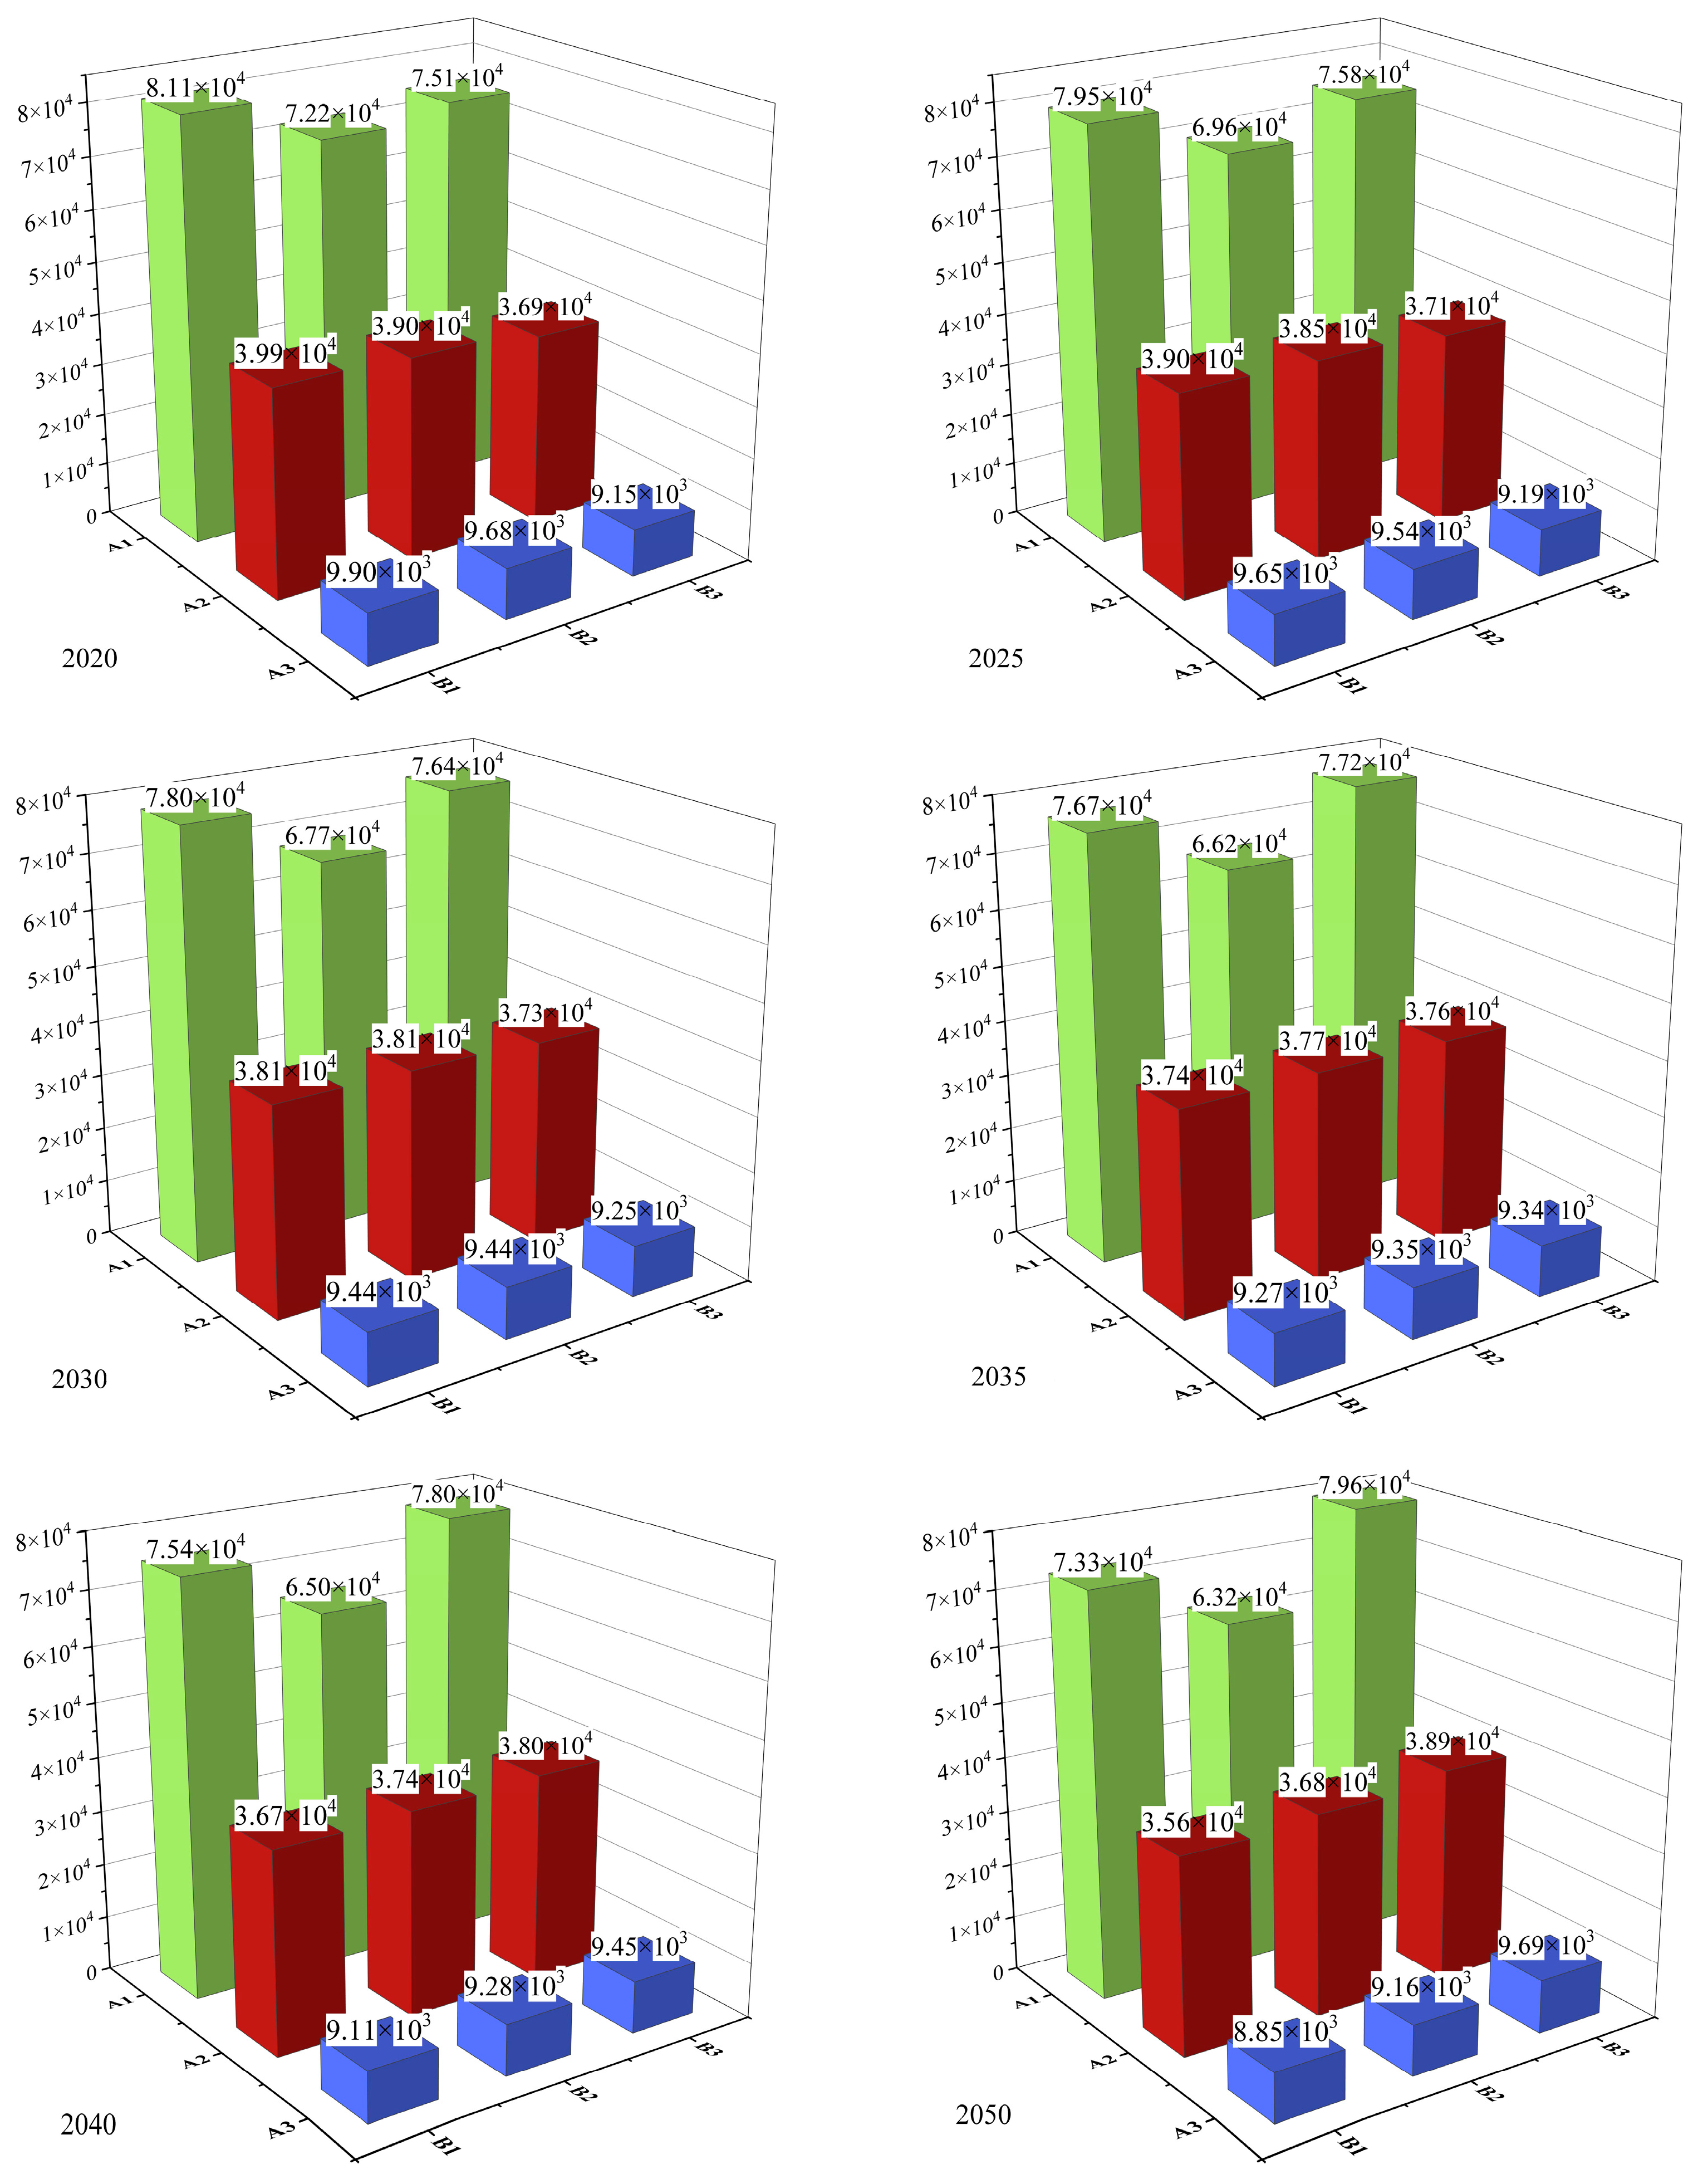
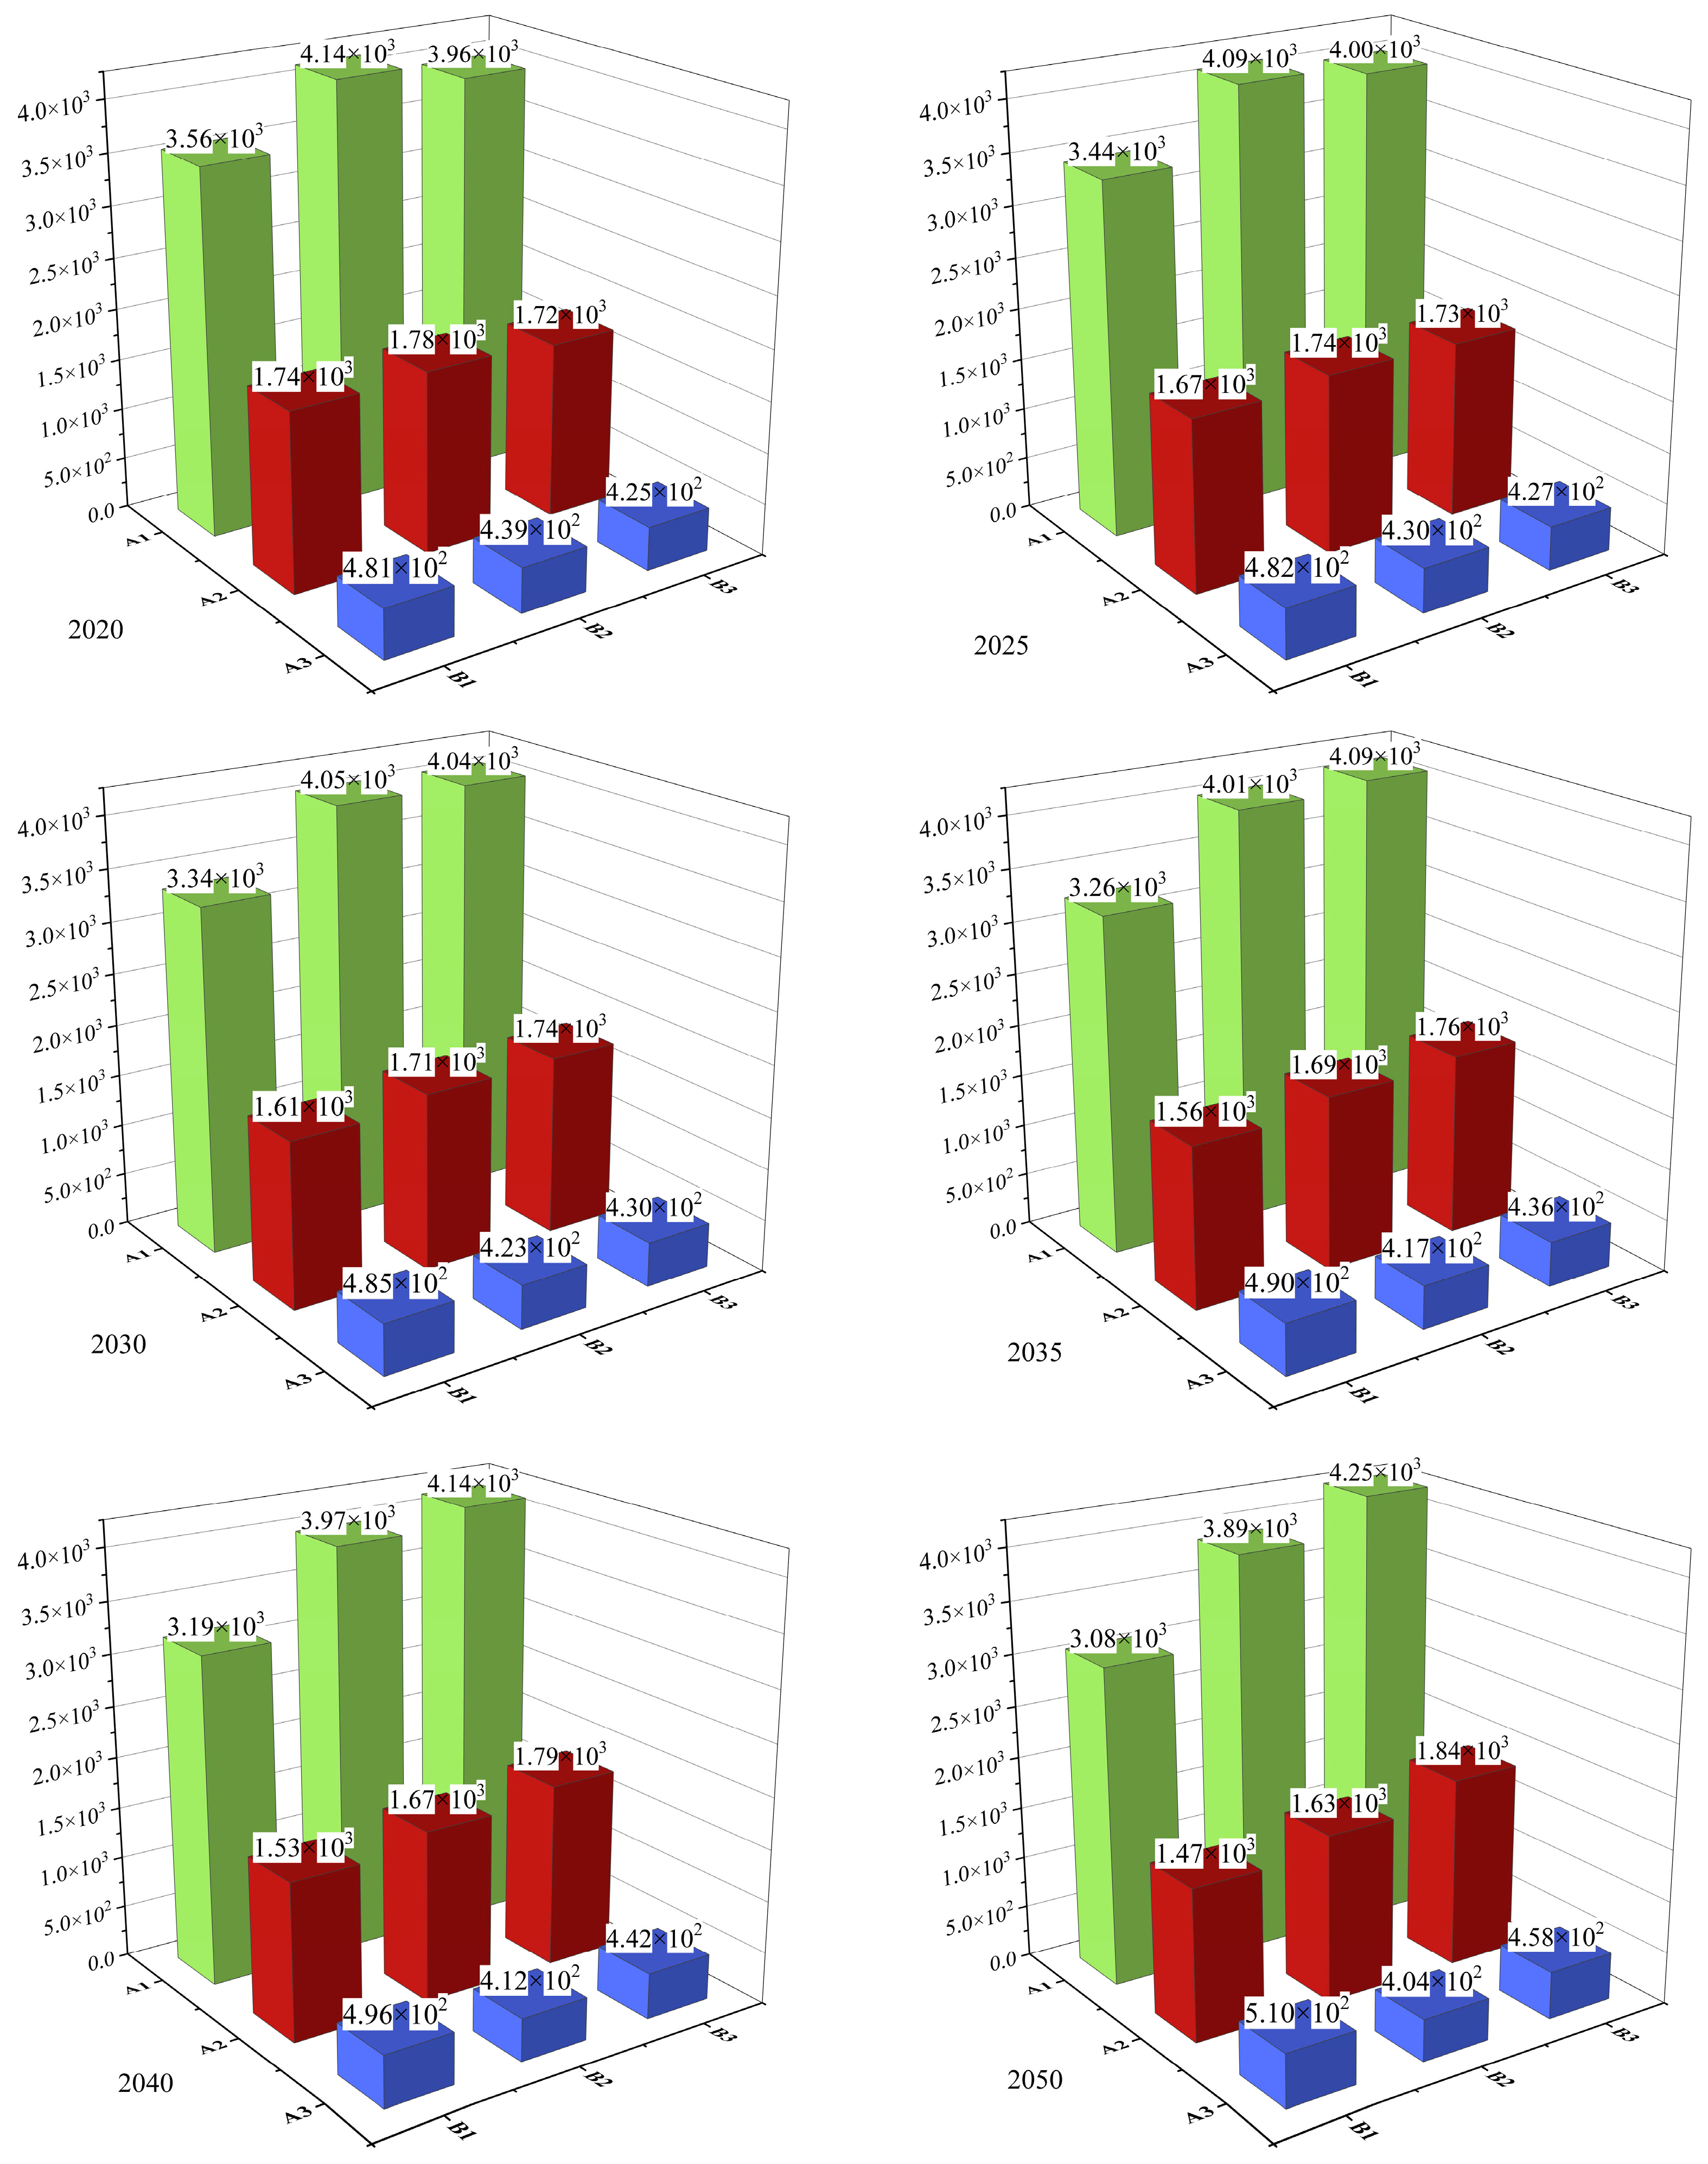
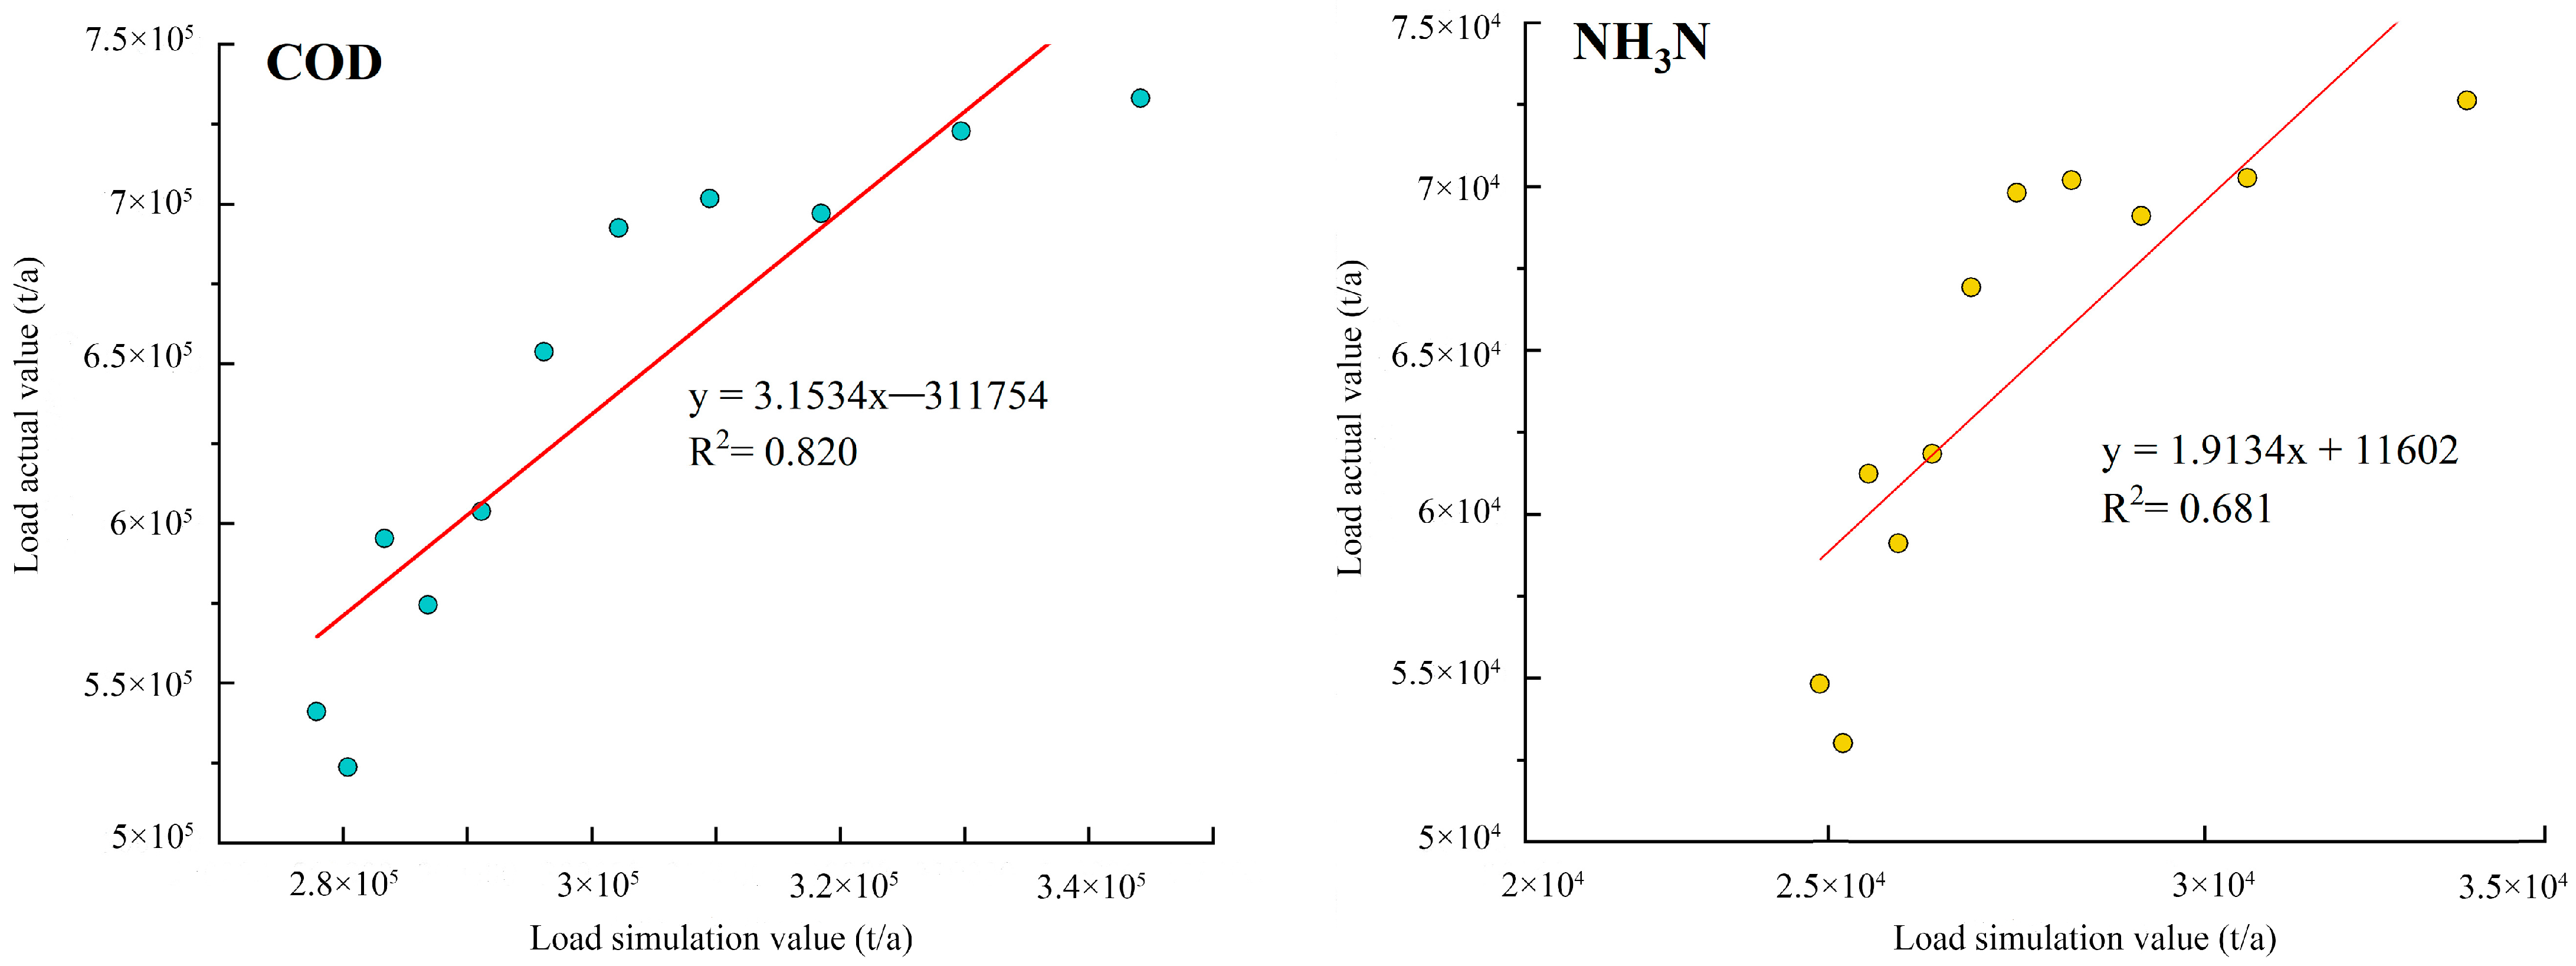
| Name | Annual Precipitation/mm | Monitoring Cross Section | Runoff Volume/108 m3 | Land Use Share in 2020 |
|---|---|---|---|---|
| Dongyu River | 647.90 | Xiyao | 0.30 | CL 80%, BL 17% |
| Wanfu River | 660.40 | Gaohe Bridge | 0.10 | CL 81%, BL 15% |
| Zhuzhaoxin River | 645.80 | Yulou | 0.60 | CL 78%, BL 17% |
| Zhushui River | 682.50 | 105 Road Bridge | 0.10 | CL 78%, BL 15%, GL 4% |
| Liangji River | 682.50 | Liji | 0.70 | CL 80%, BL 15% |
| Guangfu River | 682.50 | Xishifo | 0.70 | CL 80%, BL 17% |
| Si River | 773.80 | Yingou | 0.60 | CL 64%, BL 12%, GL 14%, WL 7% |
| Baima River | 682.50 | Malou | 0.40 | CL 70%, BL 15% |
| Beisha River | 775.20 | Wangchao Bridge | 0.20 | CL 53%, BL 8%, GL27%, WL 5% |
| Chengguo River | 817.90 | Qunle Bridge | 1.10 | CL 56%, BL 14%, GL 20%, WL 5% |
| Xinxue River | 820.80 | Ruhukou | 2.40 | CL 41%, BL 9%, GL 31%, WL 15% |
| Study Area | Pollutants | Export Coefficient Value | References | |||||
|---|---|---|---|---|---|---|---|---|
| Cropland | Forest | Grassland | Construction | Water | Unused Land | |||
| Ciyao River Basin | COD | 58.00 | 14.00 | 15.00 | 94.00 | 7.00 | 20.00 | Zhang [45] |
| NH3-N | 1.89 | 1.17 | 0.50 | 1.36 | 1.49 | 2.04 | ||
| Huai River Basin | COD | 28.00 | 32.50 | - | - | - | - | Wang [46] |
| NH3-N | 0.42 | 0.05 | - | - | - | - | ||
| Yanghua River Basin | COD | 24.50 | 32.50 | 18.00 | 100.00 | - | - | Xia et al. [47] |
| NH3-N | 0.40 | 0.75 | 0.80 | 1.10 | - | - | ||
| Yangtze River Basin | COD | 10.52 | 16.10 | 11.23 | 39.05 | 10.96 | 5.26 | Chen et al. [48] |
| NH3-N | - | - | - | - | - | - | ||
| Han River Basin | COD | 18.63 | 13.57 | 8.61 | 27.83 | 5.96 | - | Han [49] |
| NH3-N | 3.50 | 1.03 | 0.16 | 1.50 | 2.08 | - | ||
| Study Area | Pollutants | Export Coefficient Value | References | ||||
|---|---|---|---|---|---|---|---|
| Cattle | Goat | Pig | Poultry | Rural Living | |||
| Huai River Basin | COD | - | 4.40 | 30.00 | 1.17 | 10.10 | Wang [46] |
| NH3-N | - | 0.06 | 0.10 | 0.0034 | 0.16 | ||
| Han River Basin | COD | 112.00 | 0.44 | 11.34 | 0.15 | 25.00 | Han [49] |
| NH3-N | 3.37 | 0.29 | 0.86 | 0.01 | 1.05 | ||
| Danjiangkou Water Conservation Area | COD | 7.96 | 0.44 | 4.91 | 0.28 | 23.36 | Gong et al. [50] |
| NH3-N | - | - | - | - | |||
| Types | Pollutants | Unit | COD | NH3-N |
|---|---|---|---|---|
| Rural living | Rural people | kg/a | 25.00 | 1.05 |
| Livestock and poultry farming | Cattle | kg/a | 112.00 | 3.37 |
| Goat | kg/a | 0.44 | 0.29 | |
| Pig | kg/a | 11.34 | 0.44 | |
| Poultry | kg/a | 0.15 | 0.01 | |
| Pesticides and fertilizers | Pesticide | kg/(hm2·a) | 0.86 | 0.06 |
| Fertilizer | kg/(hm2·a) | 11.52 | 0.78 | |
| Land use | Cropland | kg/(hm2·a) | 28.79 | 1.94 |
| Forest | kg/(hm2·a) | 19.04 | 0.75 | |
| Grassland | kg/(hm2·a) | 11.61 | 0.33 | |
| Construction | kg/(hm2·a) | 53.63 | 1.43 | |
| Water | kg/(hm2·a) | 7.97 | 1.79 | |
| Unused land | kg/(hm2·a) | 12.63 | 2.04 |
| Counties (t/a) | COD (t/a) | NH3-N (t/a) | NPS Load (t/a) |
|---|---|---|---|
| Rencheng County | 10,060.90 | 457.50 | 10,518.40 |
| Yanzhou County | 6247.09 | 293.35 | 6540.44 |
| Weishan County | 12,984.69 | 692.97 | 13,677.66 |
| Yutai County | 9738.09 | 451.66 | 10,189.75 |
| Jinxiang County | 12,027.99 | 617.08 | 12,645.07 |
| Jiaxiang County | 19,725.54 | 869.59 | 20,595.14 |
| Wenshang County | 18,183.73 | 788.59 | 18,972.32 |
| Sishui County | 16,894.99 | 817.88 | 17,712.88 |
| Liangshan County | 31,763.75 | 1246.69 | 33,010.45 |
| Qufu County | 11,757.03 | 571.64 | 12,328.68 |
| Zoucheng County | 20,286.72 | 962.47 | 21,249.19 |
| Chengwu County | 17,868.32 | 855.06 | 18,723.37 |
| Juye County | 27,026.50 | 1291.27 | 28,317.77 |
| Yuncheng County | 37,449.29 | 1666.29 | 39,115.58 |
| Juancheng County | 20,900.12 | 970.09 | 21,870.21 |
| Cao County | 49,805.19 | 2226.98 | 52,032.17 |
| Shan County | 29,555.62 | 1387.57 | 30,943.19 |
| Dongming County | 25,884.24 | 1187.17 | 27,071.41 |
| Dingtao County | 16,443.87 | 775.29 | 17,219.16 |
| Mudan County | 29,536.49 | 1353.12 | 30,889.61 |
| Shanting County | 16,301.12 | 761.87 | 17,062.98 |
| Taierzhuang County | 11,354.88 | 486.44 | 11,841.32 |
| Shizhong County | 8491.08 | 369.72 | 8860.81 |
| Xuecheng County | 10,446.59 | 460.15 | 10,906.74 |
| Yicheng County | 13,428.50 | 608.20 | 14,036.70 |
| Tengzhou County | 38,849.37 | 1715.69 | 40,565.06 |
| Ningyang County | 18,031.74 | 822.31 | 18,854.04 |
| Total | 541,043.42 | 24,706.62 | 565,750.04 |
| Year | Cropland | Forest | Grassland | |||
|---|---|---|---|---|---|---|
| COD | NH3-N | COD | NH3-N | COD | NH3-N | |
| 2010 | 62,650.79 | 4215.53 | 542.87 | 21.40 | 393.40 | 11.18 |
| 2011 | 51,071.91 | 3436.43 | 3243.83 | 127.87 | 330.96 | 9.40 |
| 2012 | 51,302.68 | 3451.96 | 3018.23 | 118.98 | 326.96 | 9.29 |
| 2013 | 56,381.15 | 3793.67 | 1824.75 | 71.93 | 341.11 | 9.69 |
| 2014 | 58,920.39 | 3964.53 | 1228.01 | 48.41 | 348.18 | 9.89 |
| 2015 | 61,459.63 | 4135.38 | 631.28 | 24.89 | 355.25 | 10.09 |
| 2016 | 55,593.83 | 3740.69 | 1697.36 | 66.91 | 334.56 | 9.51 |
| 2017 | 55,864.20 | 3758.89 | 1613.14 | 63.59 | 364.58 | 10.36 |
| 2018 | 53,520.33 | 3601.18 | 2391.88 | 94.29 | 228.64 | 6.50 |
| 2019 | 47,064.68 | 3166.80 | 2852.22 | 191.28 | 147.49 | 4.19 |
| 2020 | 60,344.56 | 4060.35 | 1733.30 | 28.91 | 221.61 | 6.30 |
| Year | Water | Construction | Unused land | |||
| COD | NH3-N | COD | NH3-N | COD | NH3-N | |
| 2010 | 941.83 | 210.85 | 28,112.41 | 749.64 | 3.99 | 0.65 |
| 2011 | 2317.80 | 518.89 | 2,8417.98 | 757.79 | 4.40 | 0.71 |
| 2012 | 2412.11 | 540.00 | 28,970.53 | 772.52 | 4.84 | 0.78 |
| 2013 | 1600.89 | 358.39 | 30,130.76 | 803.46 | 8.29 | 12.67 |
| 2014 | 1195.28 | 267.59 | 30,710.88 | 818.93 | 6.08 | 13.49 |
| 2015 | 789.67 | 176.79 | 31,290.99 | 834.40 | 1.86 | 0.30 |
| 2016 | 1443.14 | 323.08 | 30,708.62 | 818.87 | 6.72 | 2.70 |
| 2017 | 1410.72 | 315.82 | 30,669.83 | 817.84 | 5.53 | 1.54 |
| 2018 | 1828.93 | 409.44 | 29,459.02 | 785.55 | 11.24 | 9.06 |
| 2019 | 2998.77 | 671.3 | 25,799.79 | 687.97 | 4.64 | 0.75 |
| 2020 | 809.92 | 181.32 | 33,565.70 | 895.06 | 0.95 | 0.15 |
| Types | Variable Name | Unit | Current Value | Low-Speed | Medium-Speed | High-Speed |
|---|---|---|---|---|---|---|
| Socio-economic | Rate of population change | ‰ | 0.38 | 0 | 0.20 | 0.60 |
| Urbanization rate | % | 24 | 24 | 30 | 40 | |
| Rate of change in GDP | % | 4.82 | 2 | 6 | 8 | |
| GDP investment rate in land rehabilitation | ‰ | 1 | 2 | 3 | 4 | |
| Livestock and poultry | Rate of change in large livestock farming | ‰ | −6.27 | −6 | −0.80 | 1 |
| Rate of change in poultry farming | ‰ | −1 | −0.90 | −0.80 | 1 | |
| Rate of change in sheep farming | ‰ | −7.95 | −7 | −0.80 | 1 | |
| Rate of change in pig farming | ‰ | −2.20 | −2 | −0.80 | 1 | |
| Pollution management | Rate of change in pesticide use per acre | % | −5.58 | −10 | −15 | −30 |
| Rate of change in fertilizer use per acre | % | −0.37 | −1 | −5 | −8 | |
| Livestock and poultry farming pollution treatment rate on a large scale | % | 50 | 60 | 80 | 95 | |
| GDP investment share of agricultural NPS pollution | ‰ | 3 | 5 | 10 | 15 | |
| Weighting of soil testing and fertilizer application | % | 50 | 60 | 80 | 95 |
Disclaimer/Publisher’s Note: The statements, opinions and data contained in all publications are solely those of the individual author(s) and contributor(s) and not of MDPI and/or the editor(s). MDPI and/or the editor(s) disclaim responsibility for any injury to people or property resulting from any ideas, methods, instructions or products referred to in the content. |
© 2024 by the authors. Licensee MDPI, Basel, Switzerland. This article is an open access article distributed under the terms and conditions of the Creative Commons Attribution (CC BY) license (https://creativecommons.org/licenses/by/4.0/).
Share and Cite
Liu, J.; Liu, C.; Xiao, M.; Li, M.; Jiang, M.; Wang, S.; Yin, L.; Zhang, B. Study on Non-Point Source Pollution Prevention and Control System in Nansi Lake Basin Based on System Dynamics Approach. Sustainability 2024, 16, 7831. https://doi.org/10.3390/su16177831
Liu J, Liu C, Xiao M, Li M, Jiang M, Wang S, Yin L, Zhang B. Study on Non-Point Source Pollution Prevention and Control System in Nansi Lake Basin Based on System Dynamics Approach. Sustainability. 2024; 16(17):7831. https://doi.org/10.3390/su16177831
Chicago/Turabian StyleLiu, Jiachen, Chunqiang Liu, Min Xiao, Meirui Li, Mingjun Jiang, Shicai Wang, Le Yin, and Baolei Zhang. 2024. "Study on Non-Point Source Pollution Prevention and Control System in Nansi Lake Basin Based on System Dynamics Approach" Sustainability 16, no. 17: 7831. https://doi.org/10.3390/su16177831
APA StyleLiu, J., Liu, C., Xiao, M., Li, M., Jiang, M., Wang, S., Yin, L., & Zhang, B. (2024). Study on Non-Point Source Pollution Prevention and Control System in Nansi Lake Basin Based on System Dynamics Approach. Sustainability, 16(17), 7831. https://doi.org/10.3390/su16177831


