

Laboratory and Field Performance Evaluation of NMAS 9.5, 8.0, and 5.6 mm SMA Mixtures for Sustainable Pavement


Abstract
1. Introduction
2. Experimental Program and Analysis Methods
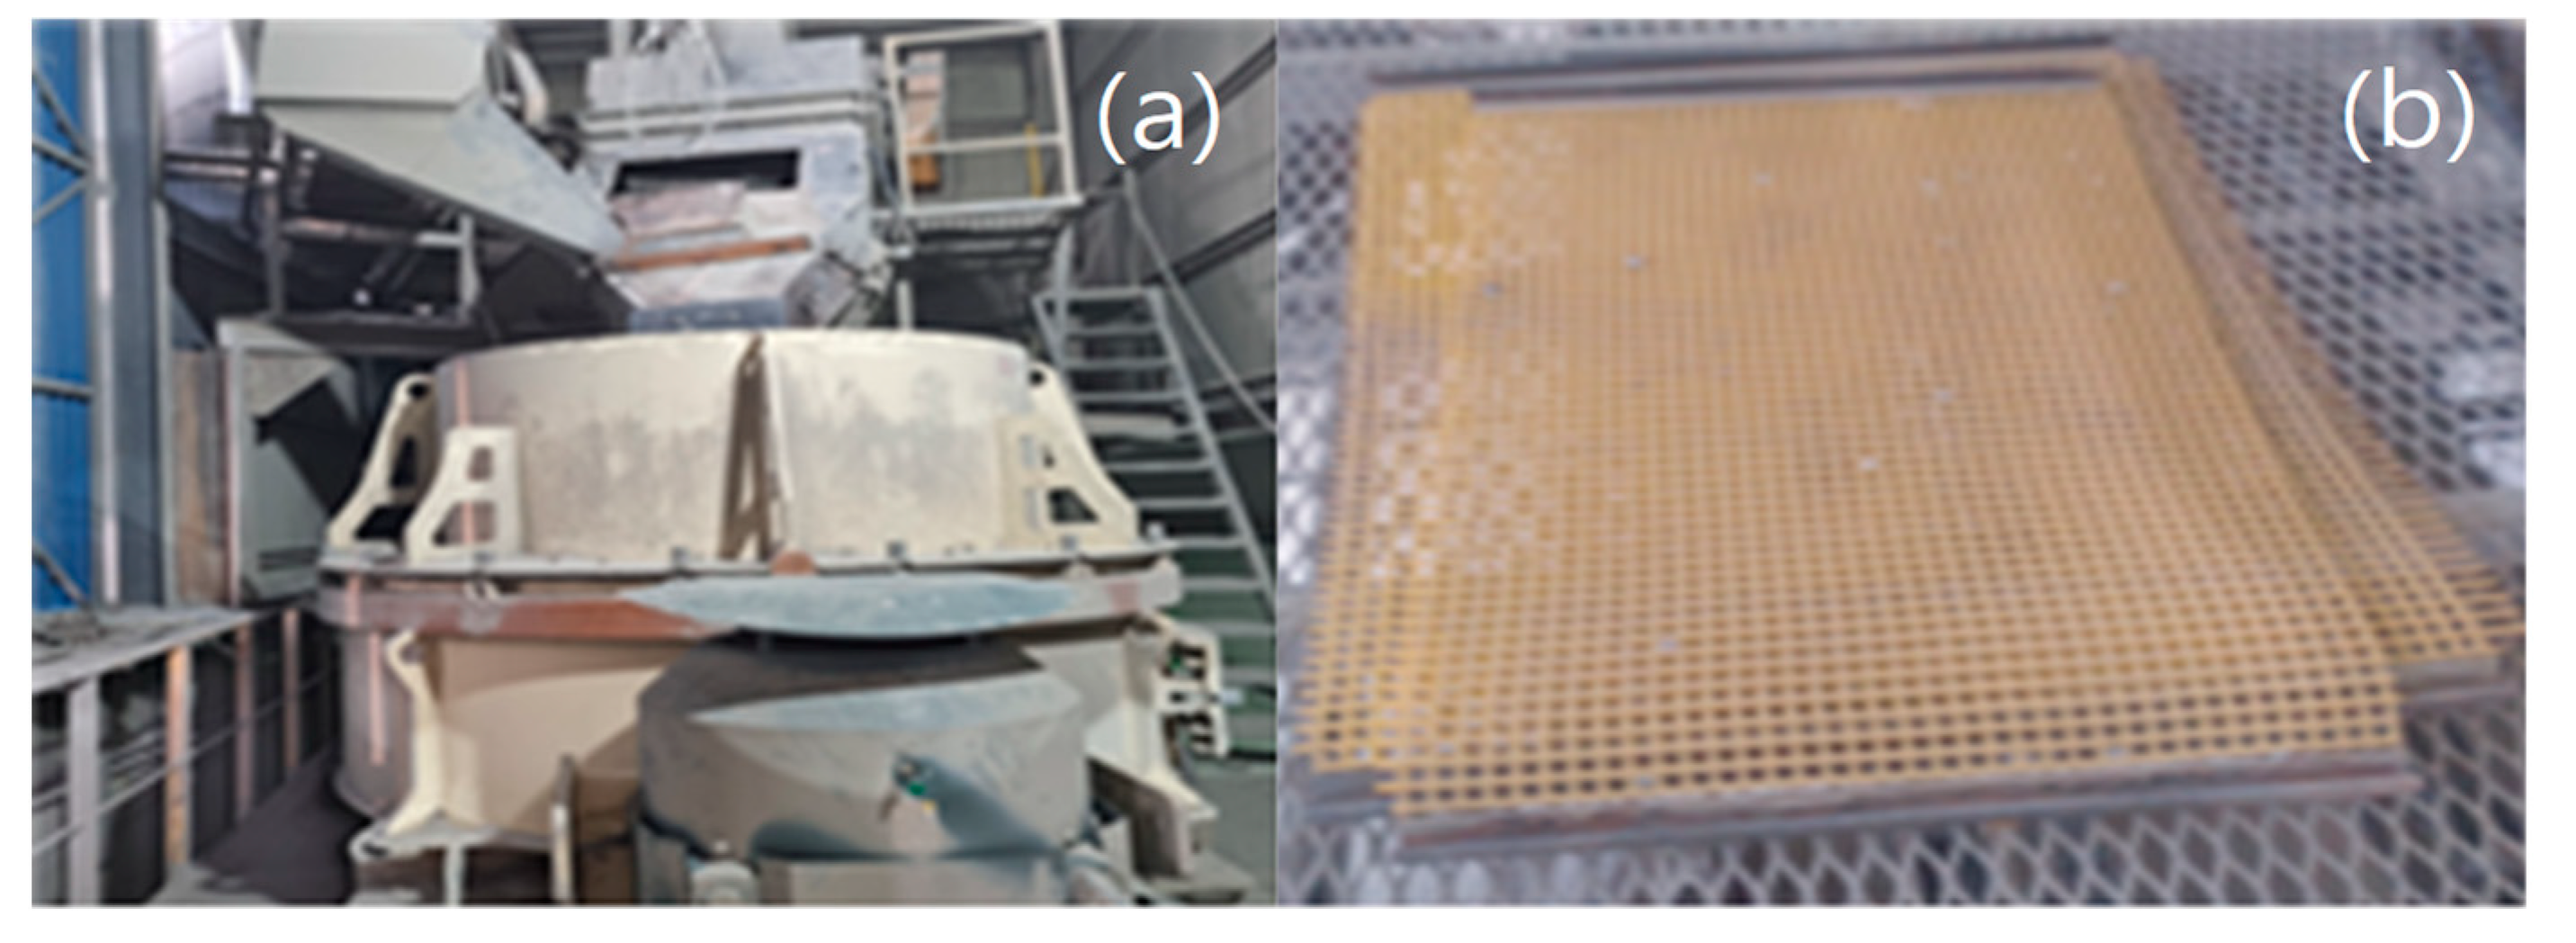
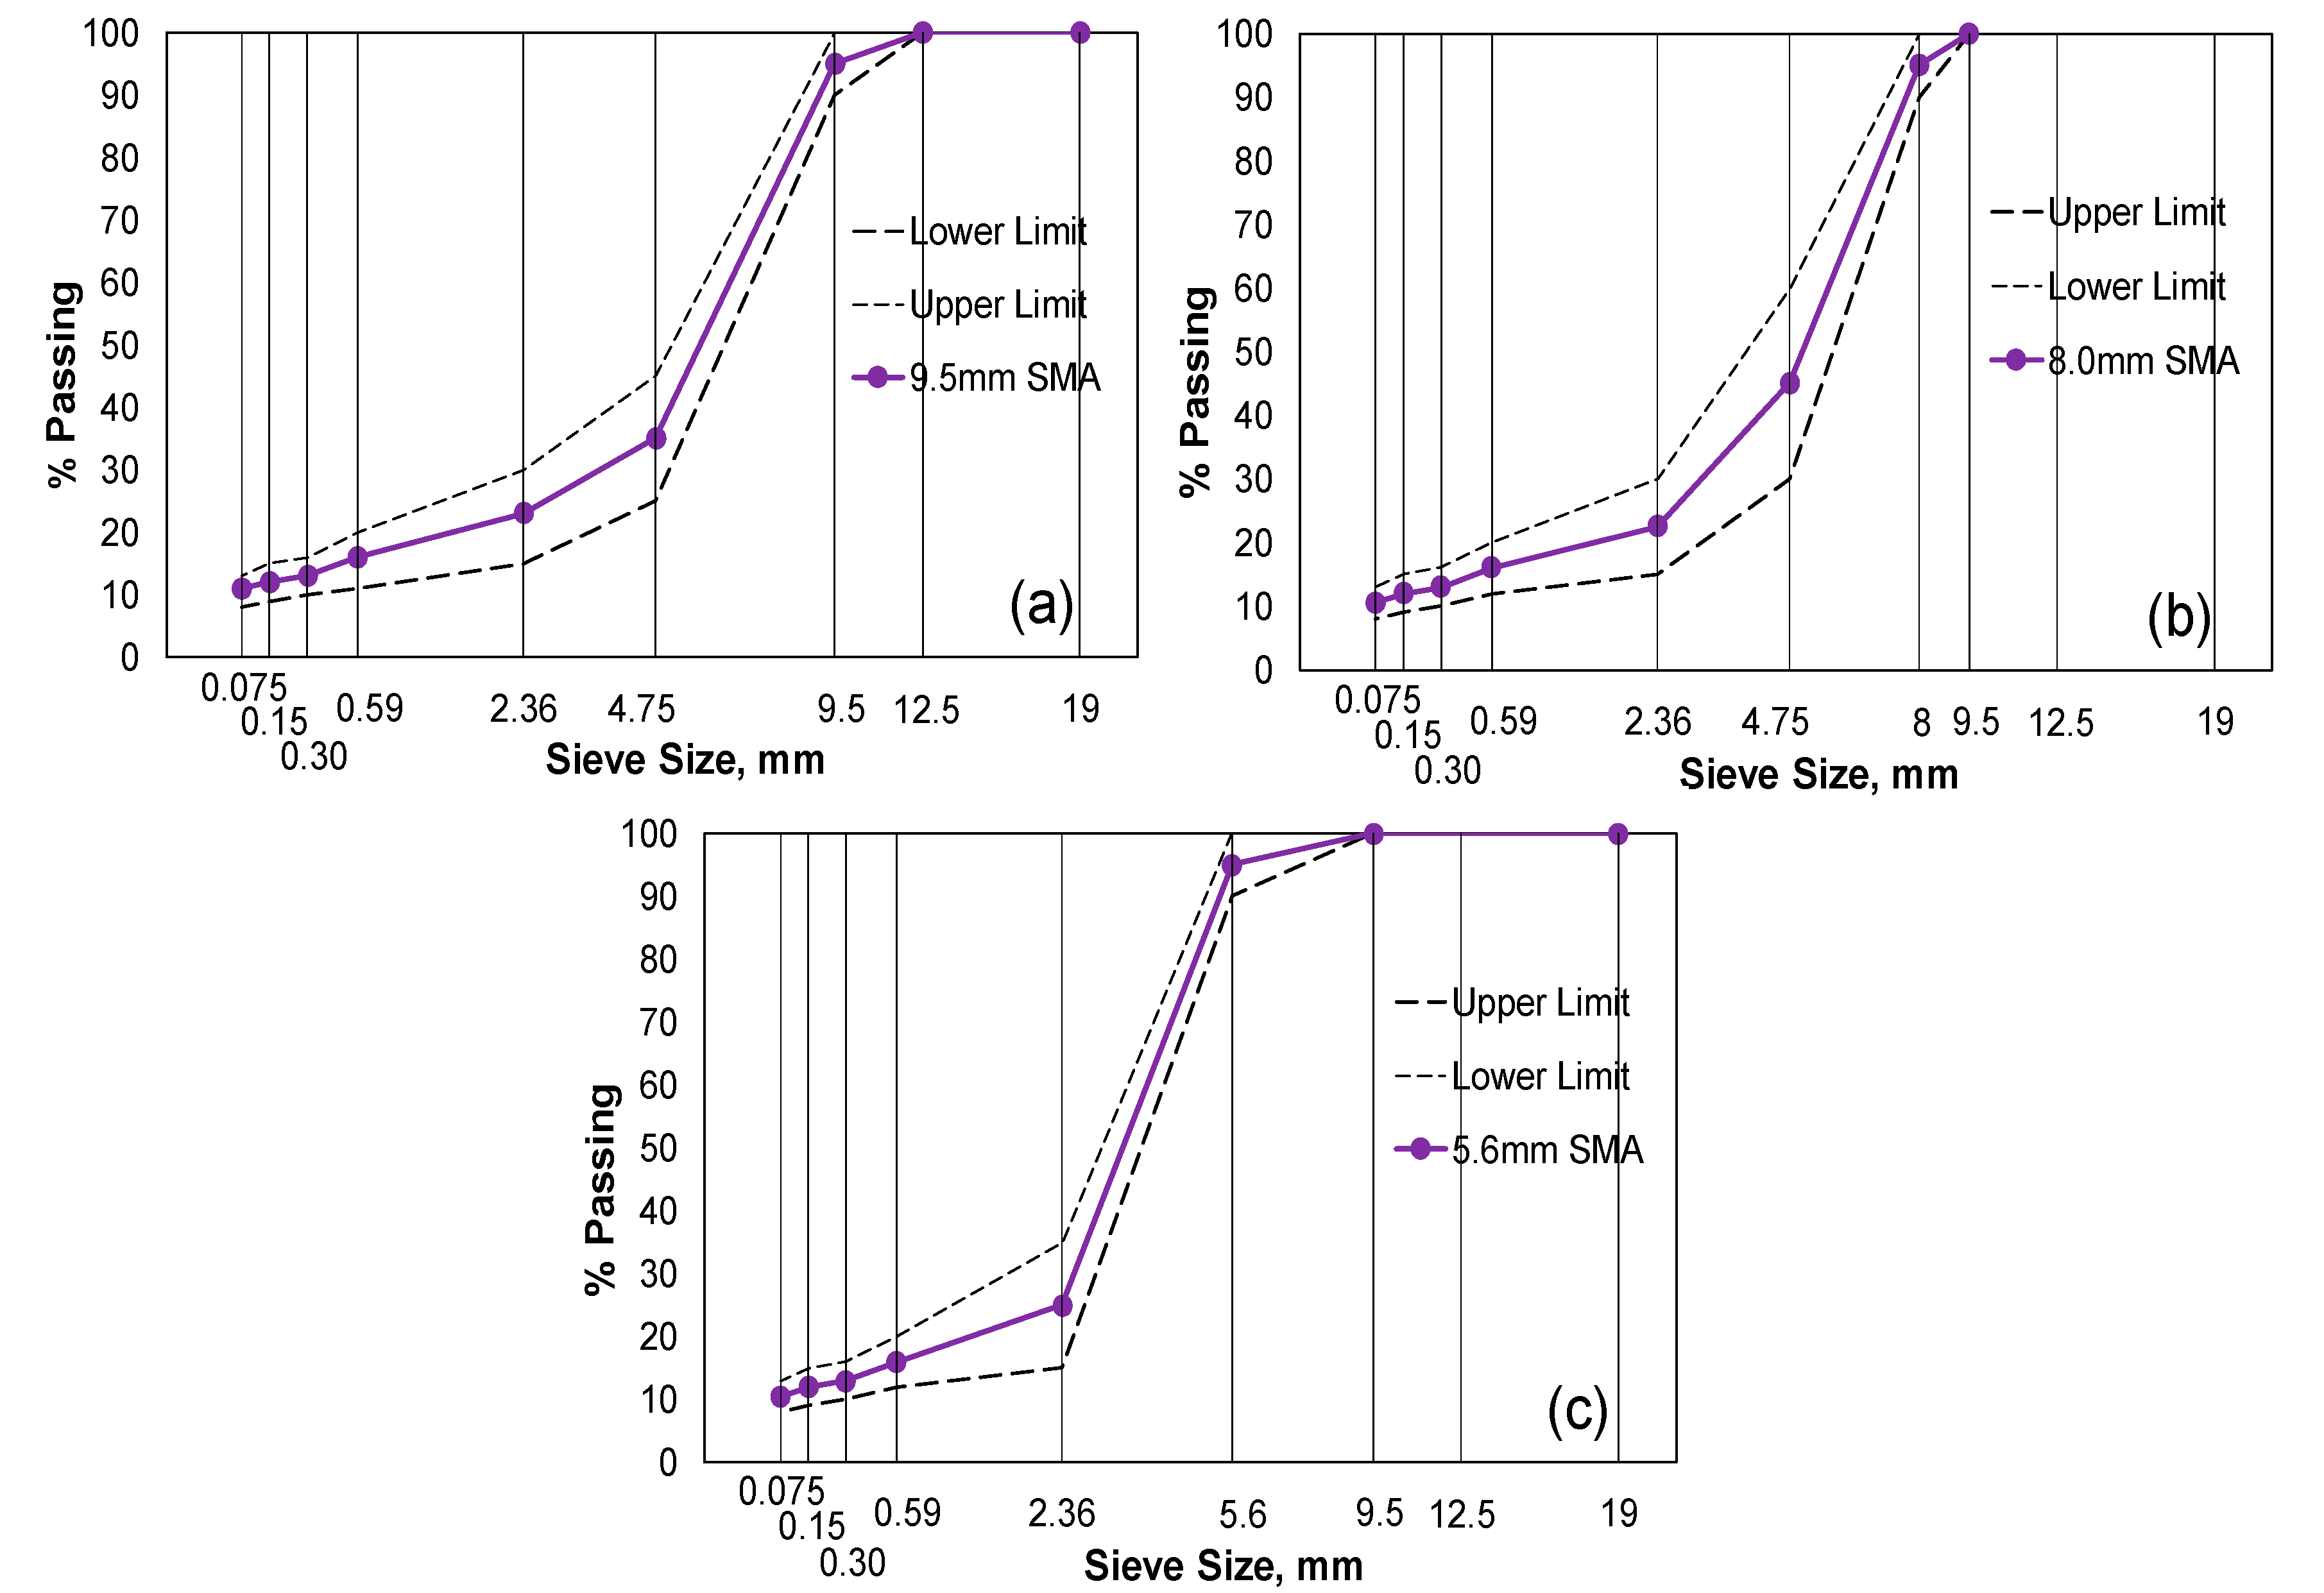
2.1. Material and Mix Design
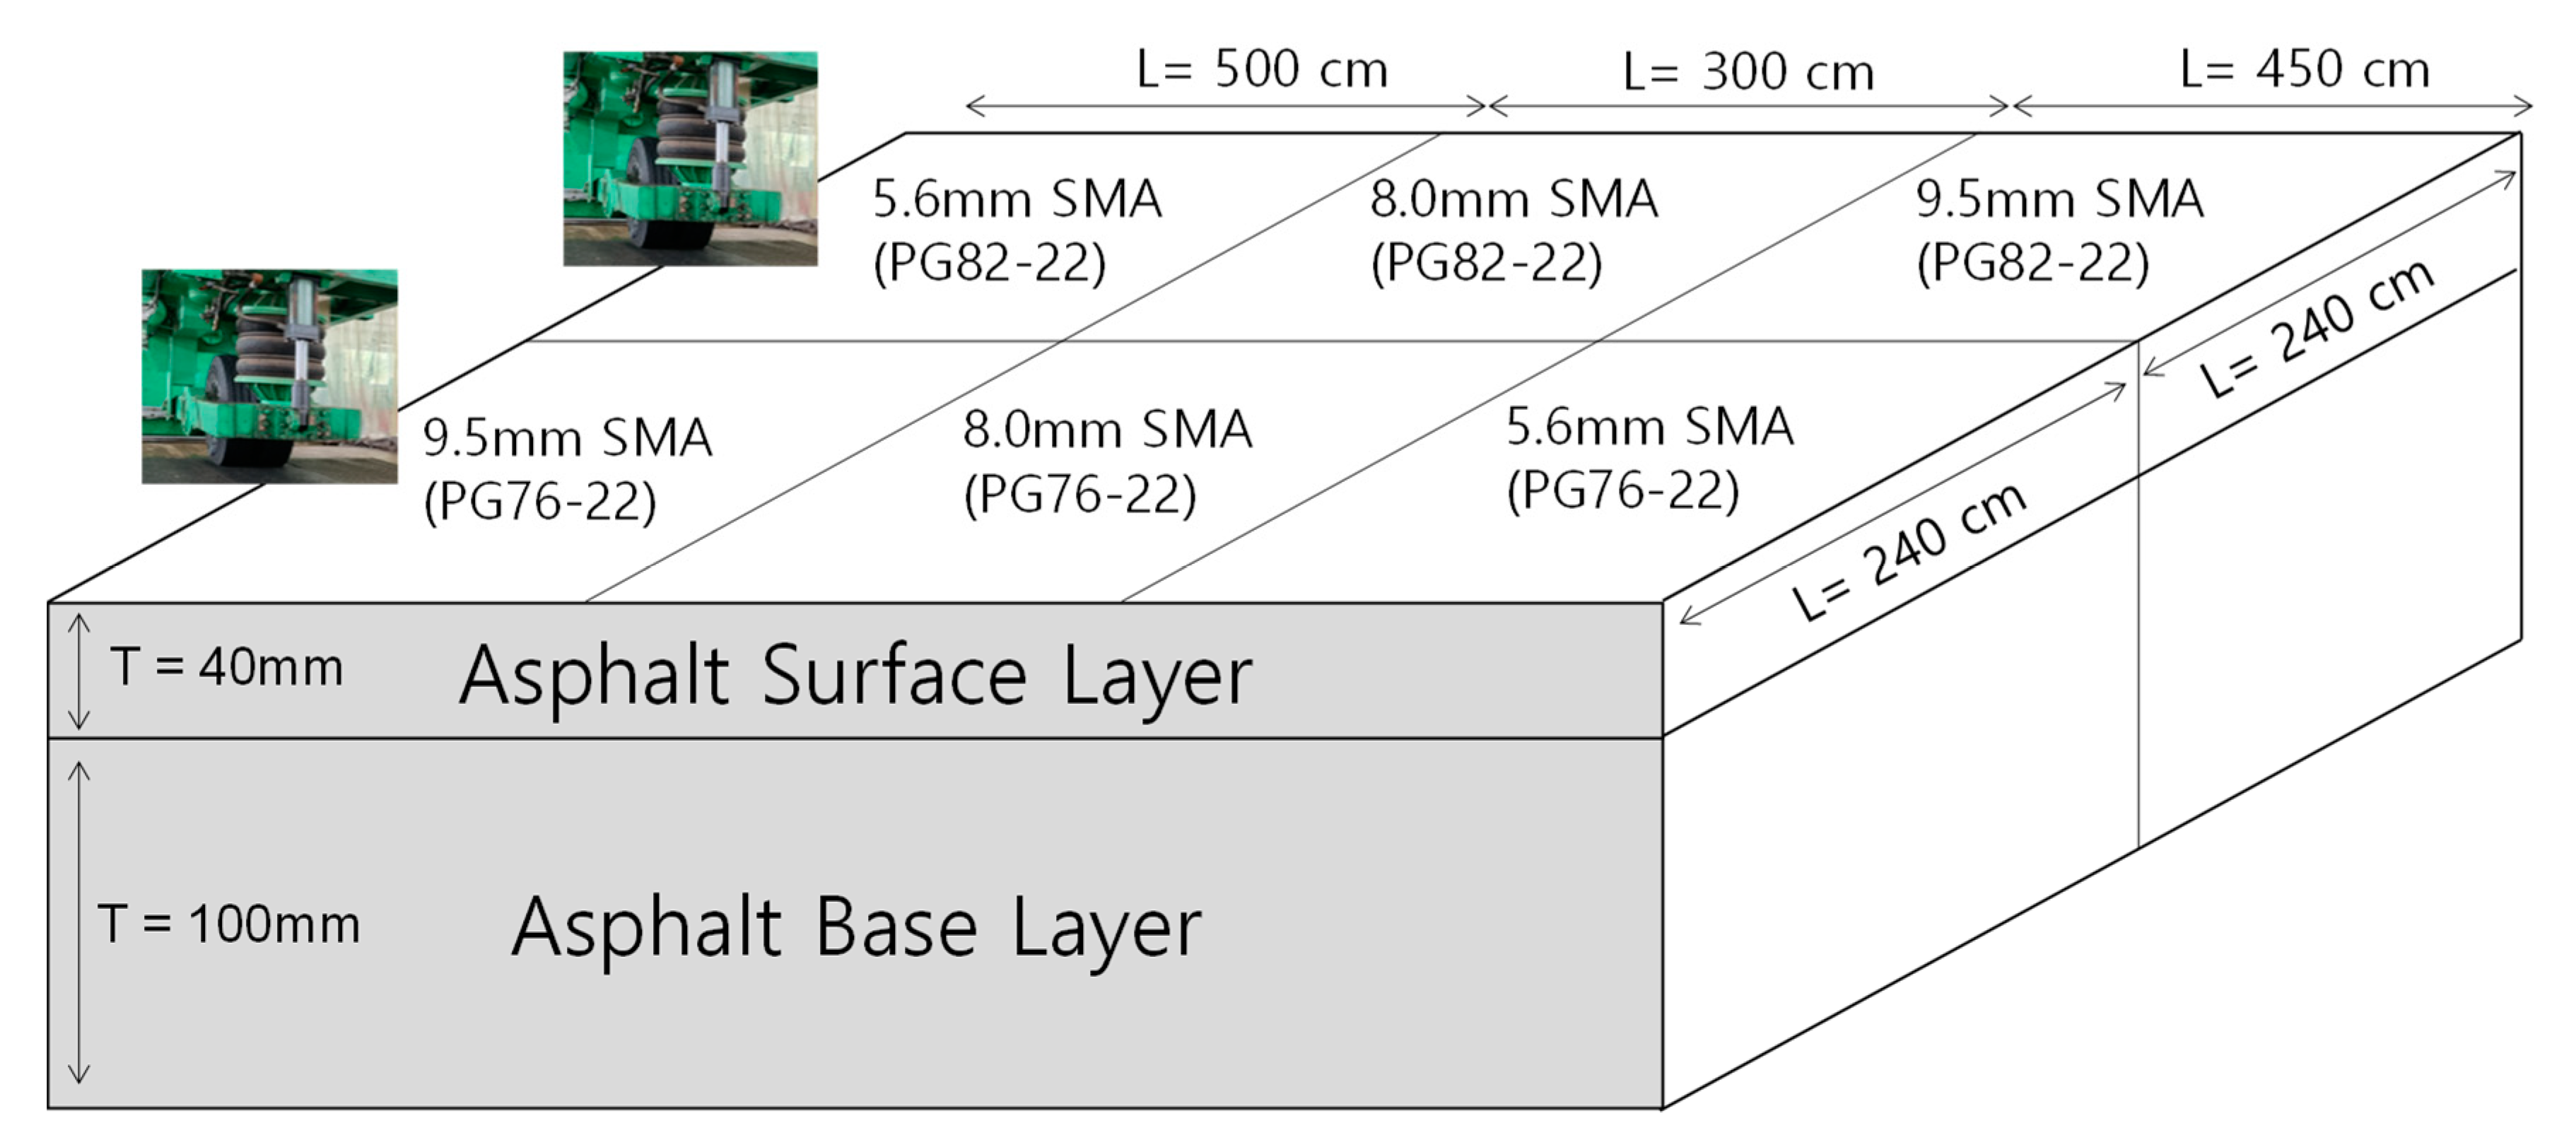
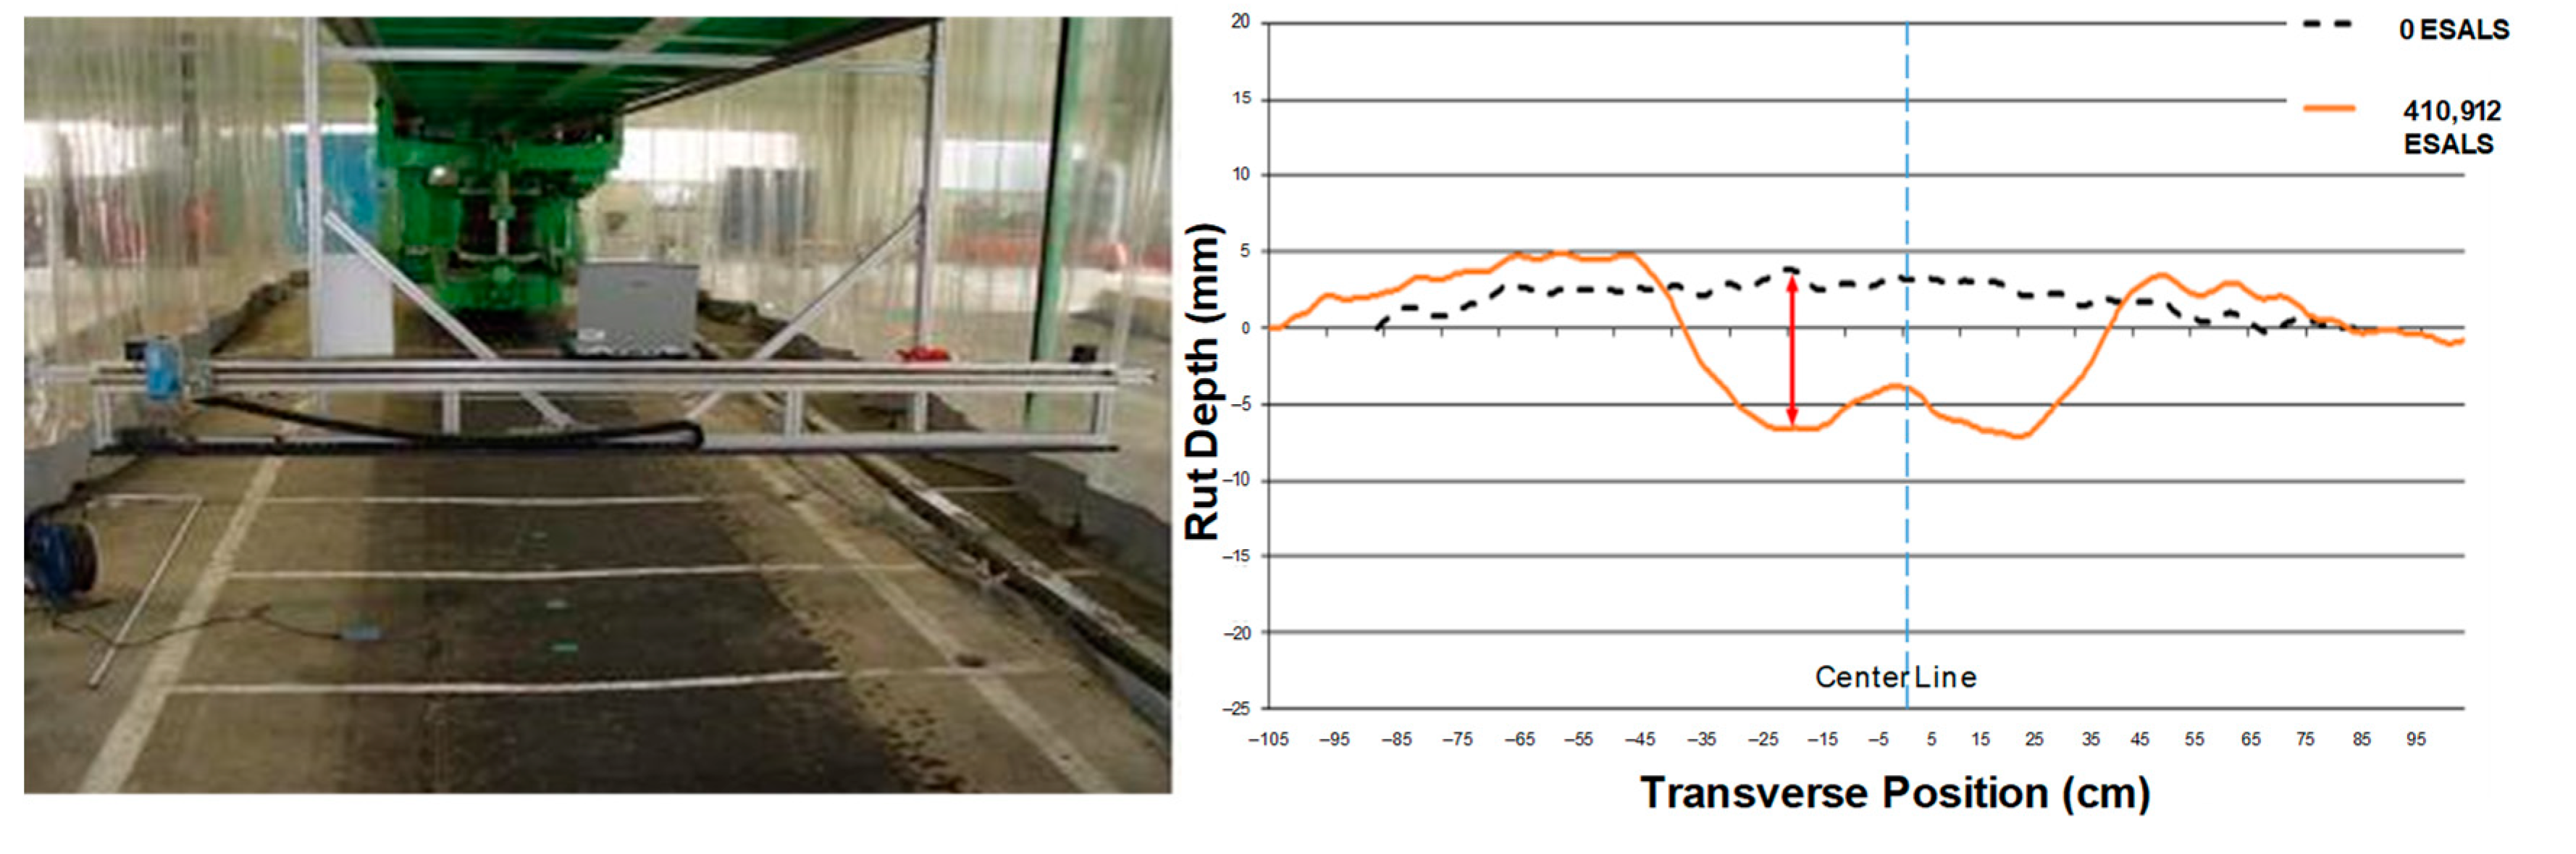
2.2. Full-Scale Accelerated Pavement Test
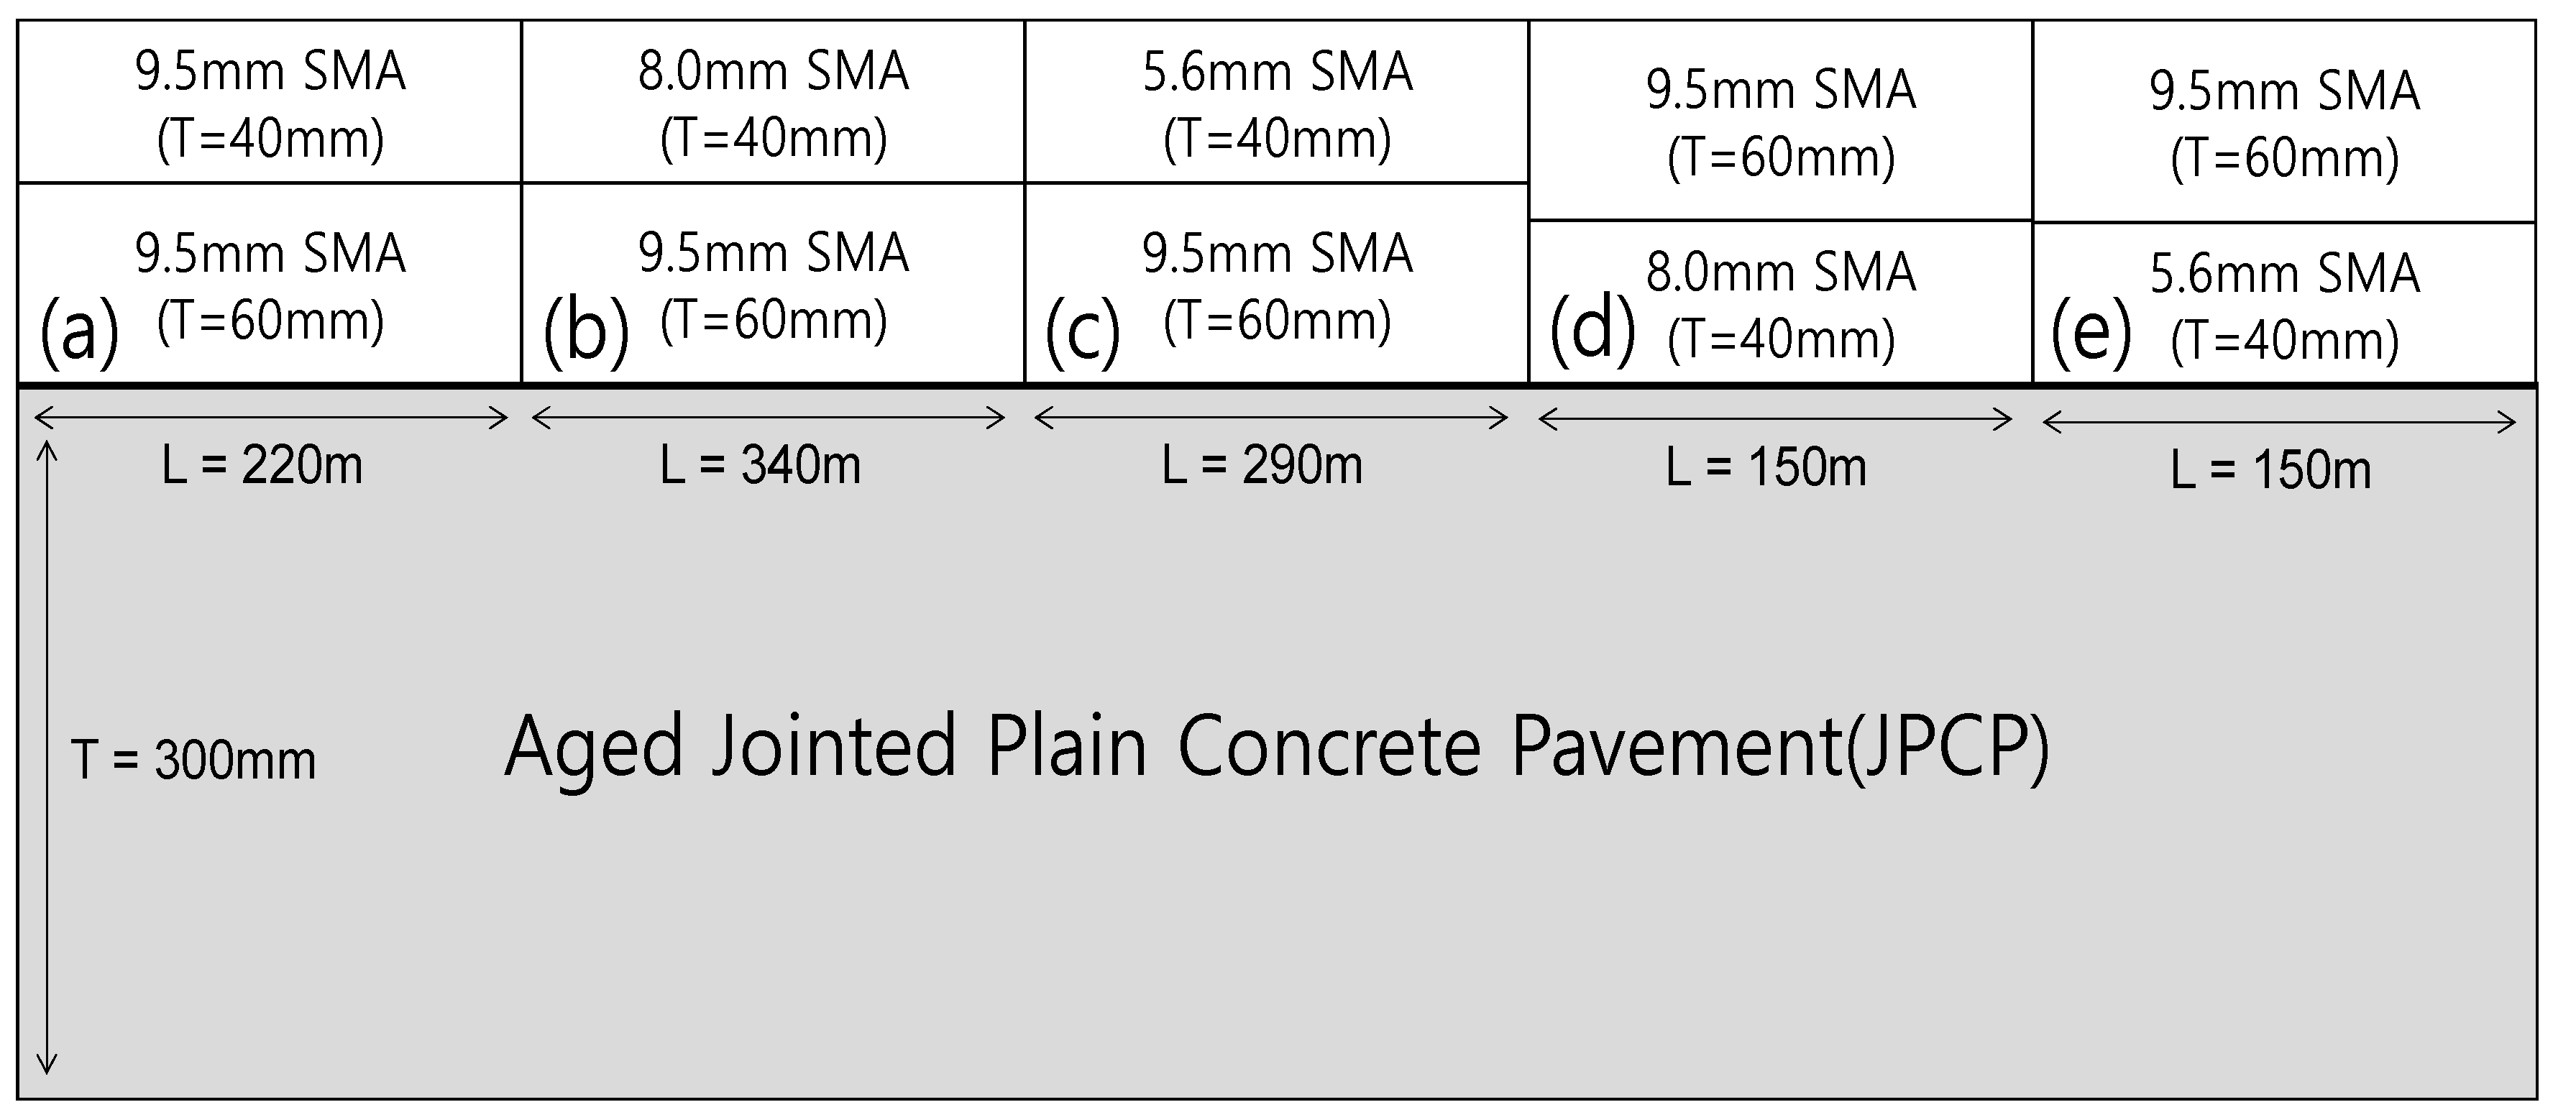
2.2.1. Test Bed Preparation
2.2.2. Rut Depth Analysis Method
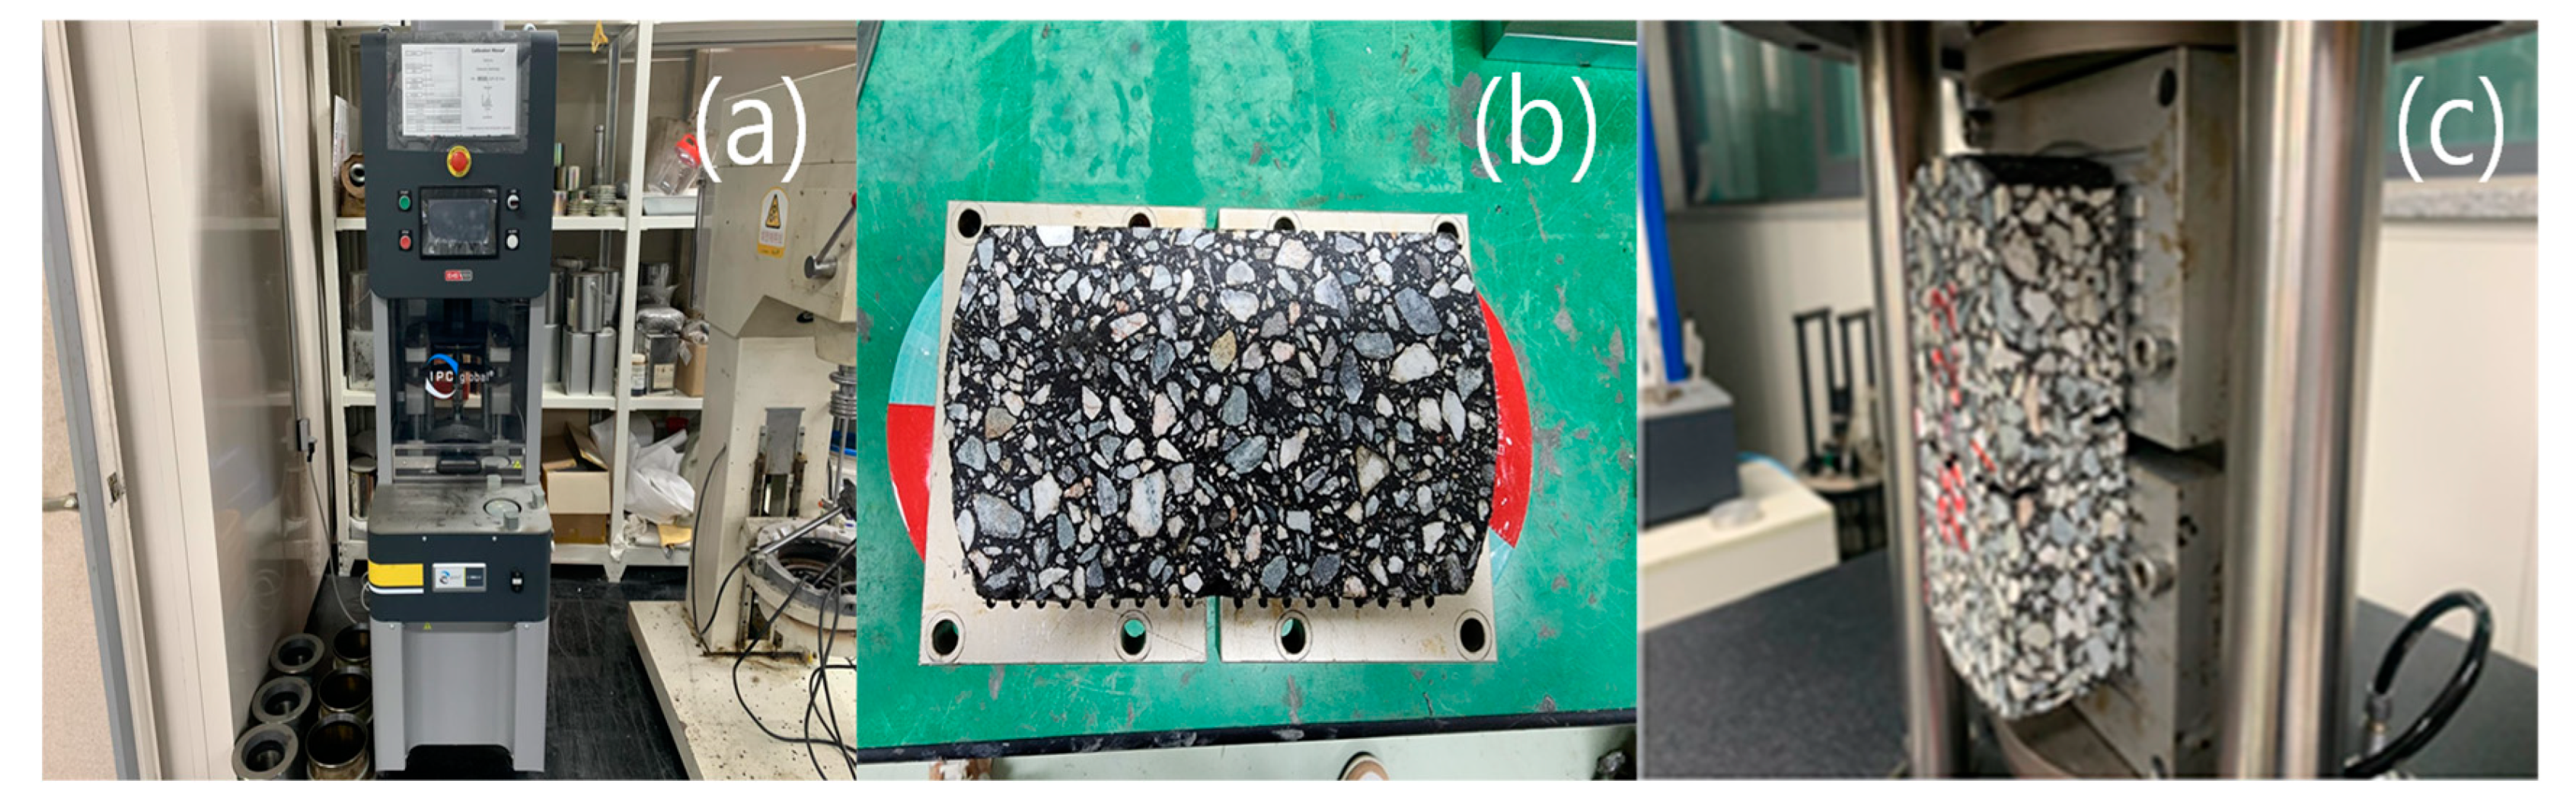
2.3. Reflective Cracking Test
2.3.1. Specimen Preparation
2.3.2. Testing Protocol and Analysis Method
3. Field Performance Evaluation and Analysis Methods
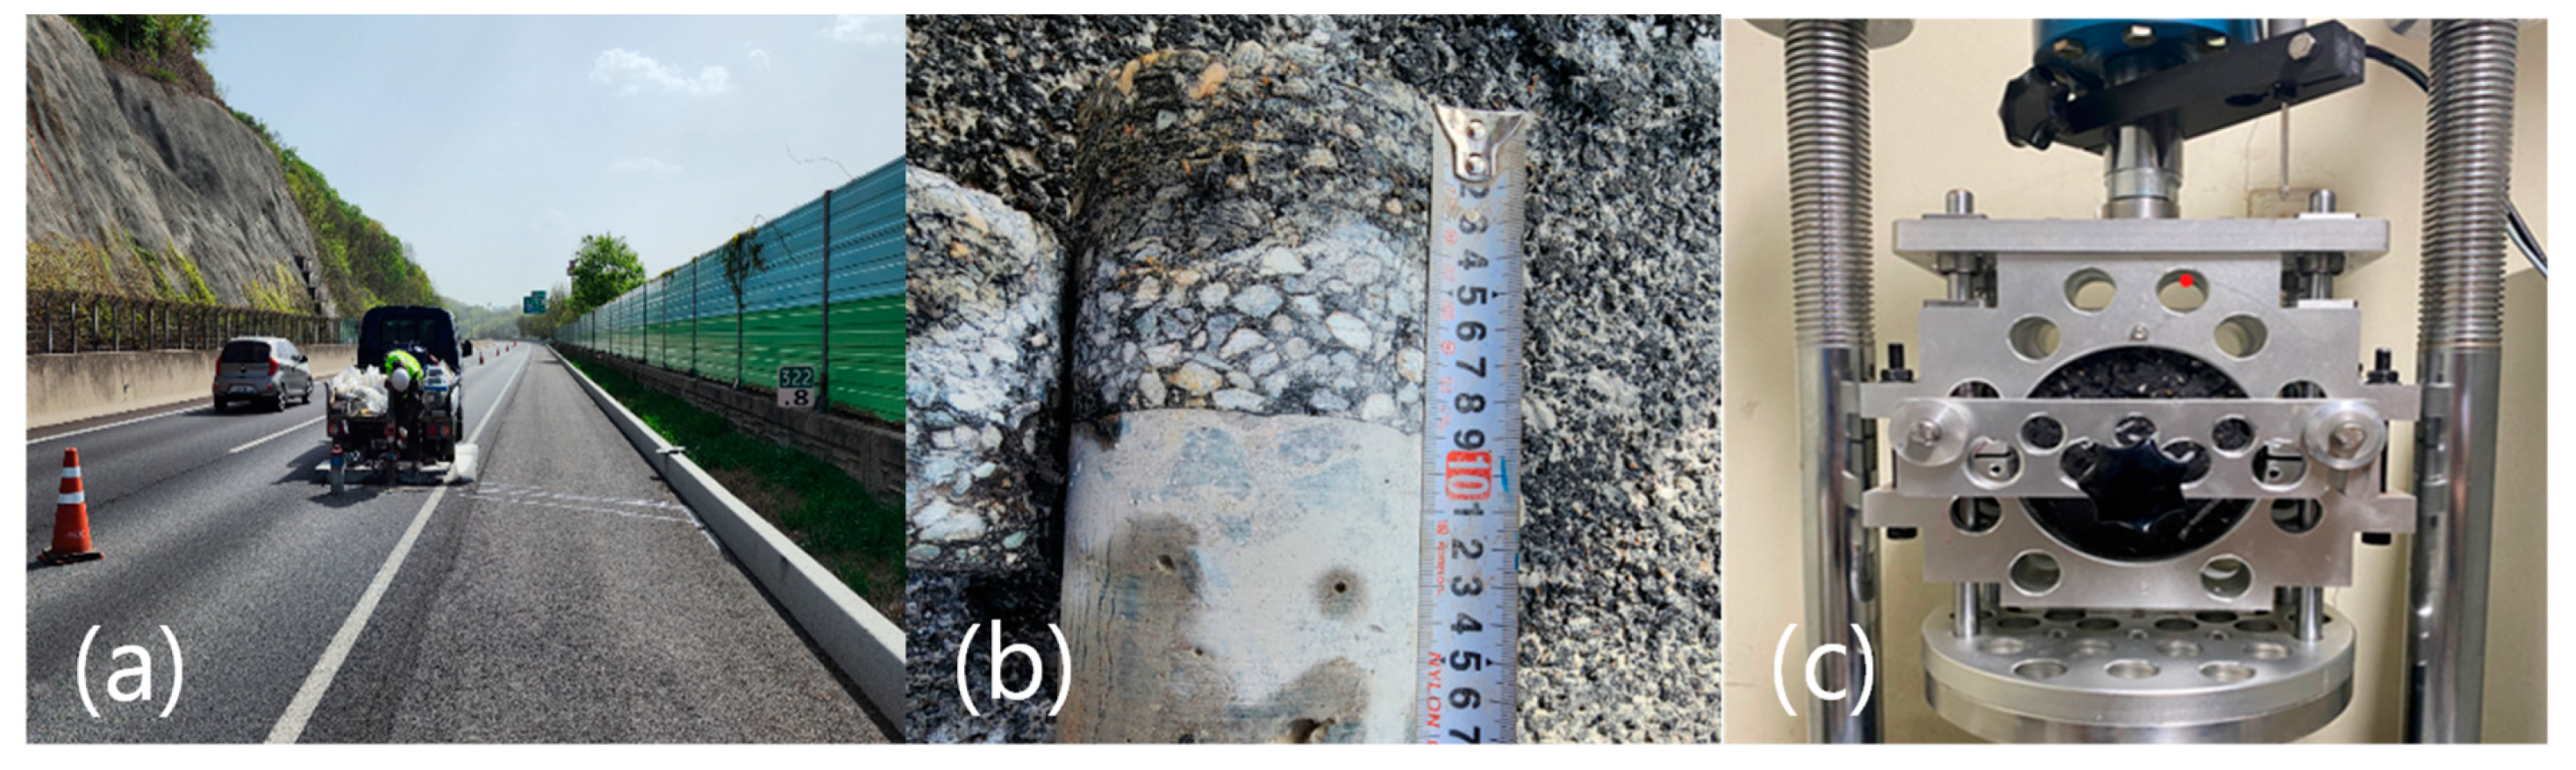
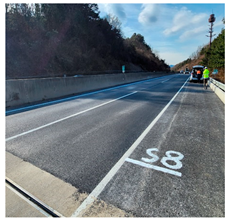
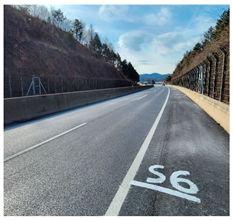
3.1. Field Trial Construction
3.2. Tire–Pavement Noise Measurement Using Close Proximity Method (CPX)
3.3. Skid Resistance Test
3.4. Shear Bond Strength Test
4. Discussion of Results
4.1. Accelerated Pavement Test
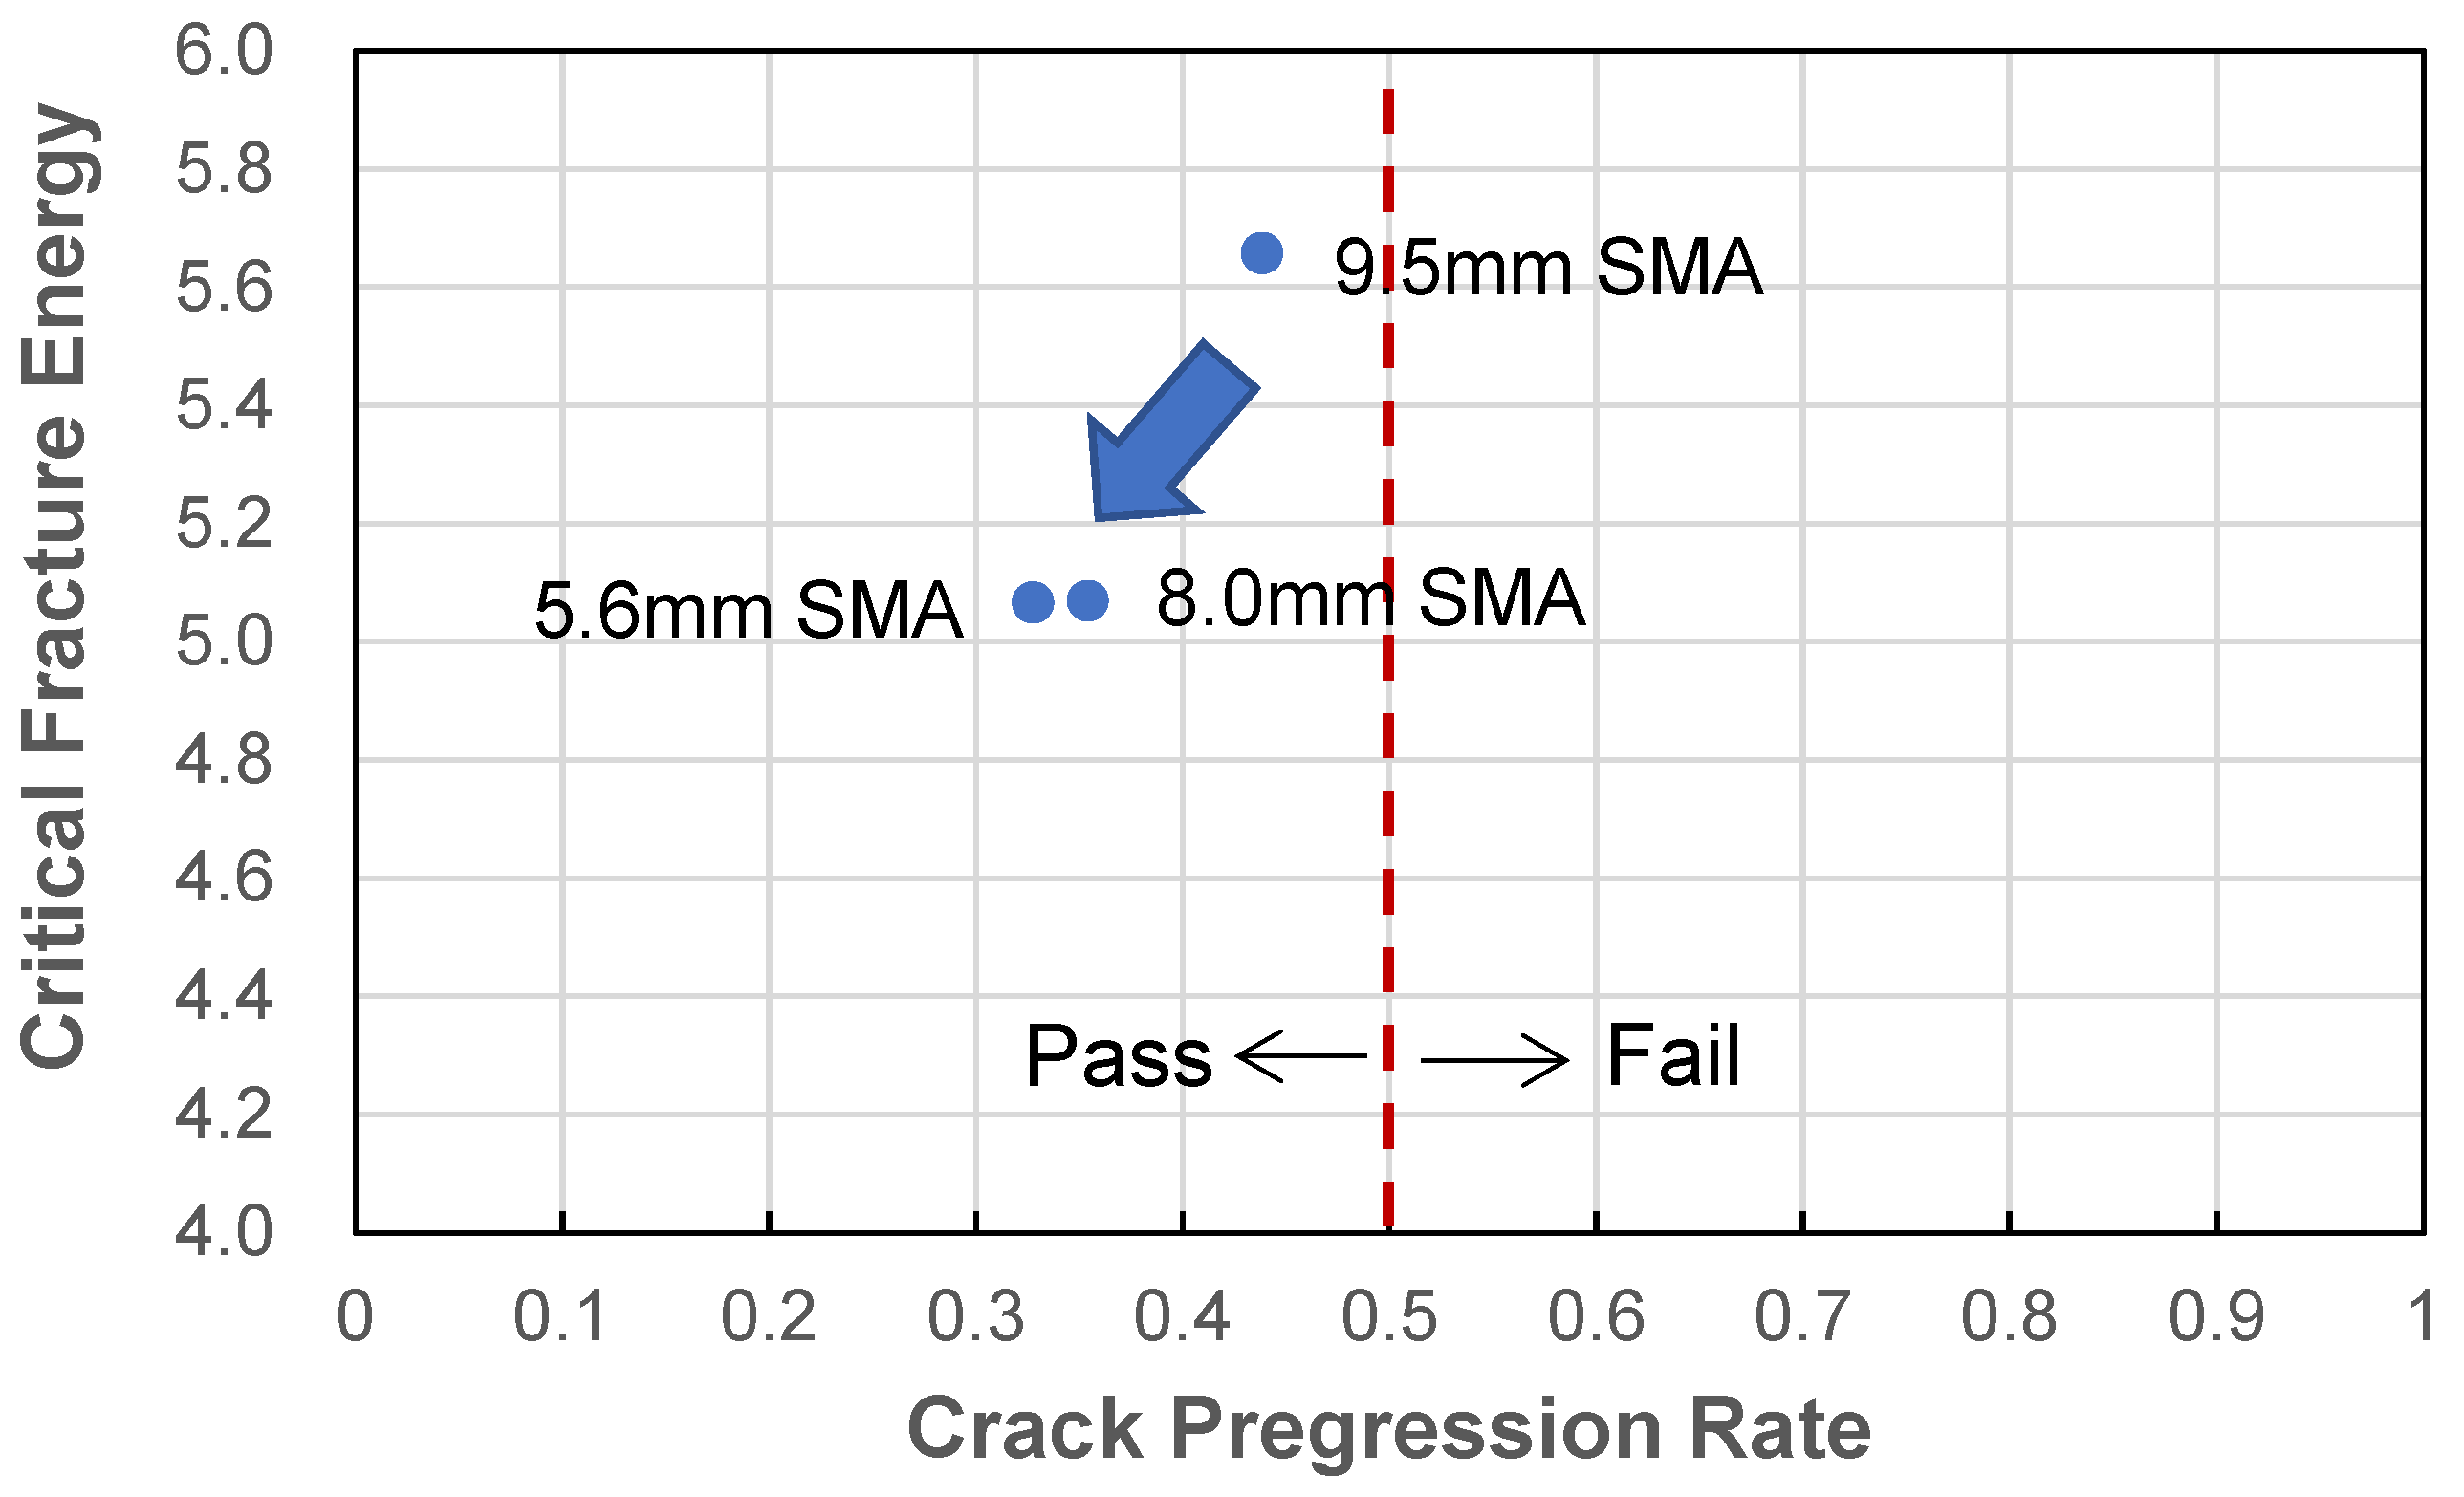
4.2. Reflective Cracking Test
4.3. Tire–Pavement Noise Measurement Using the Close Proximity Method (CPX)
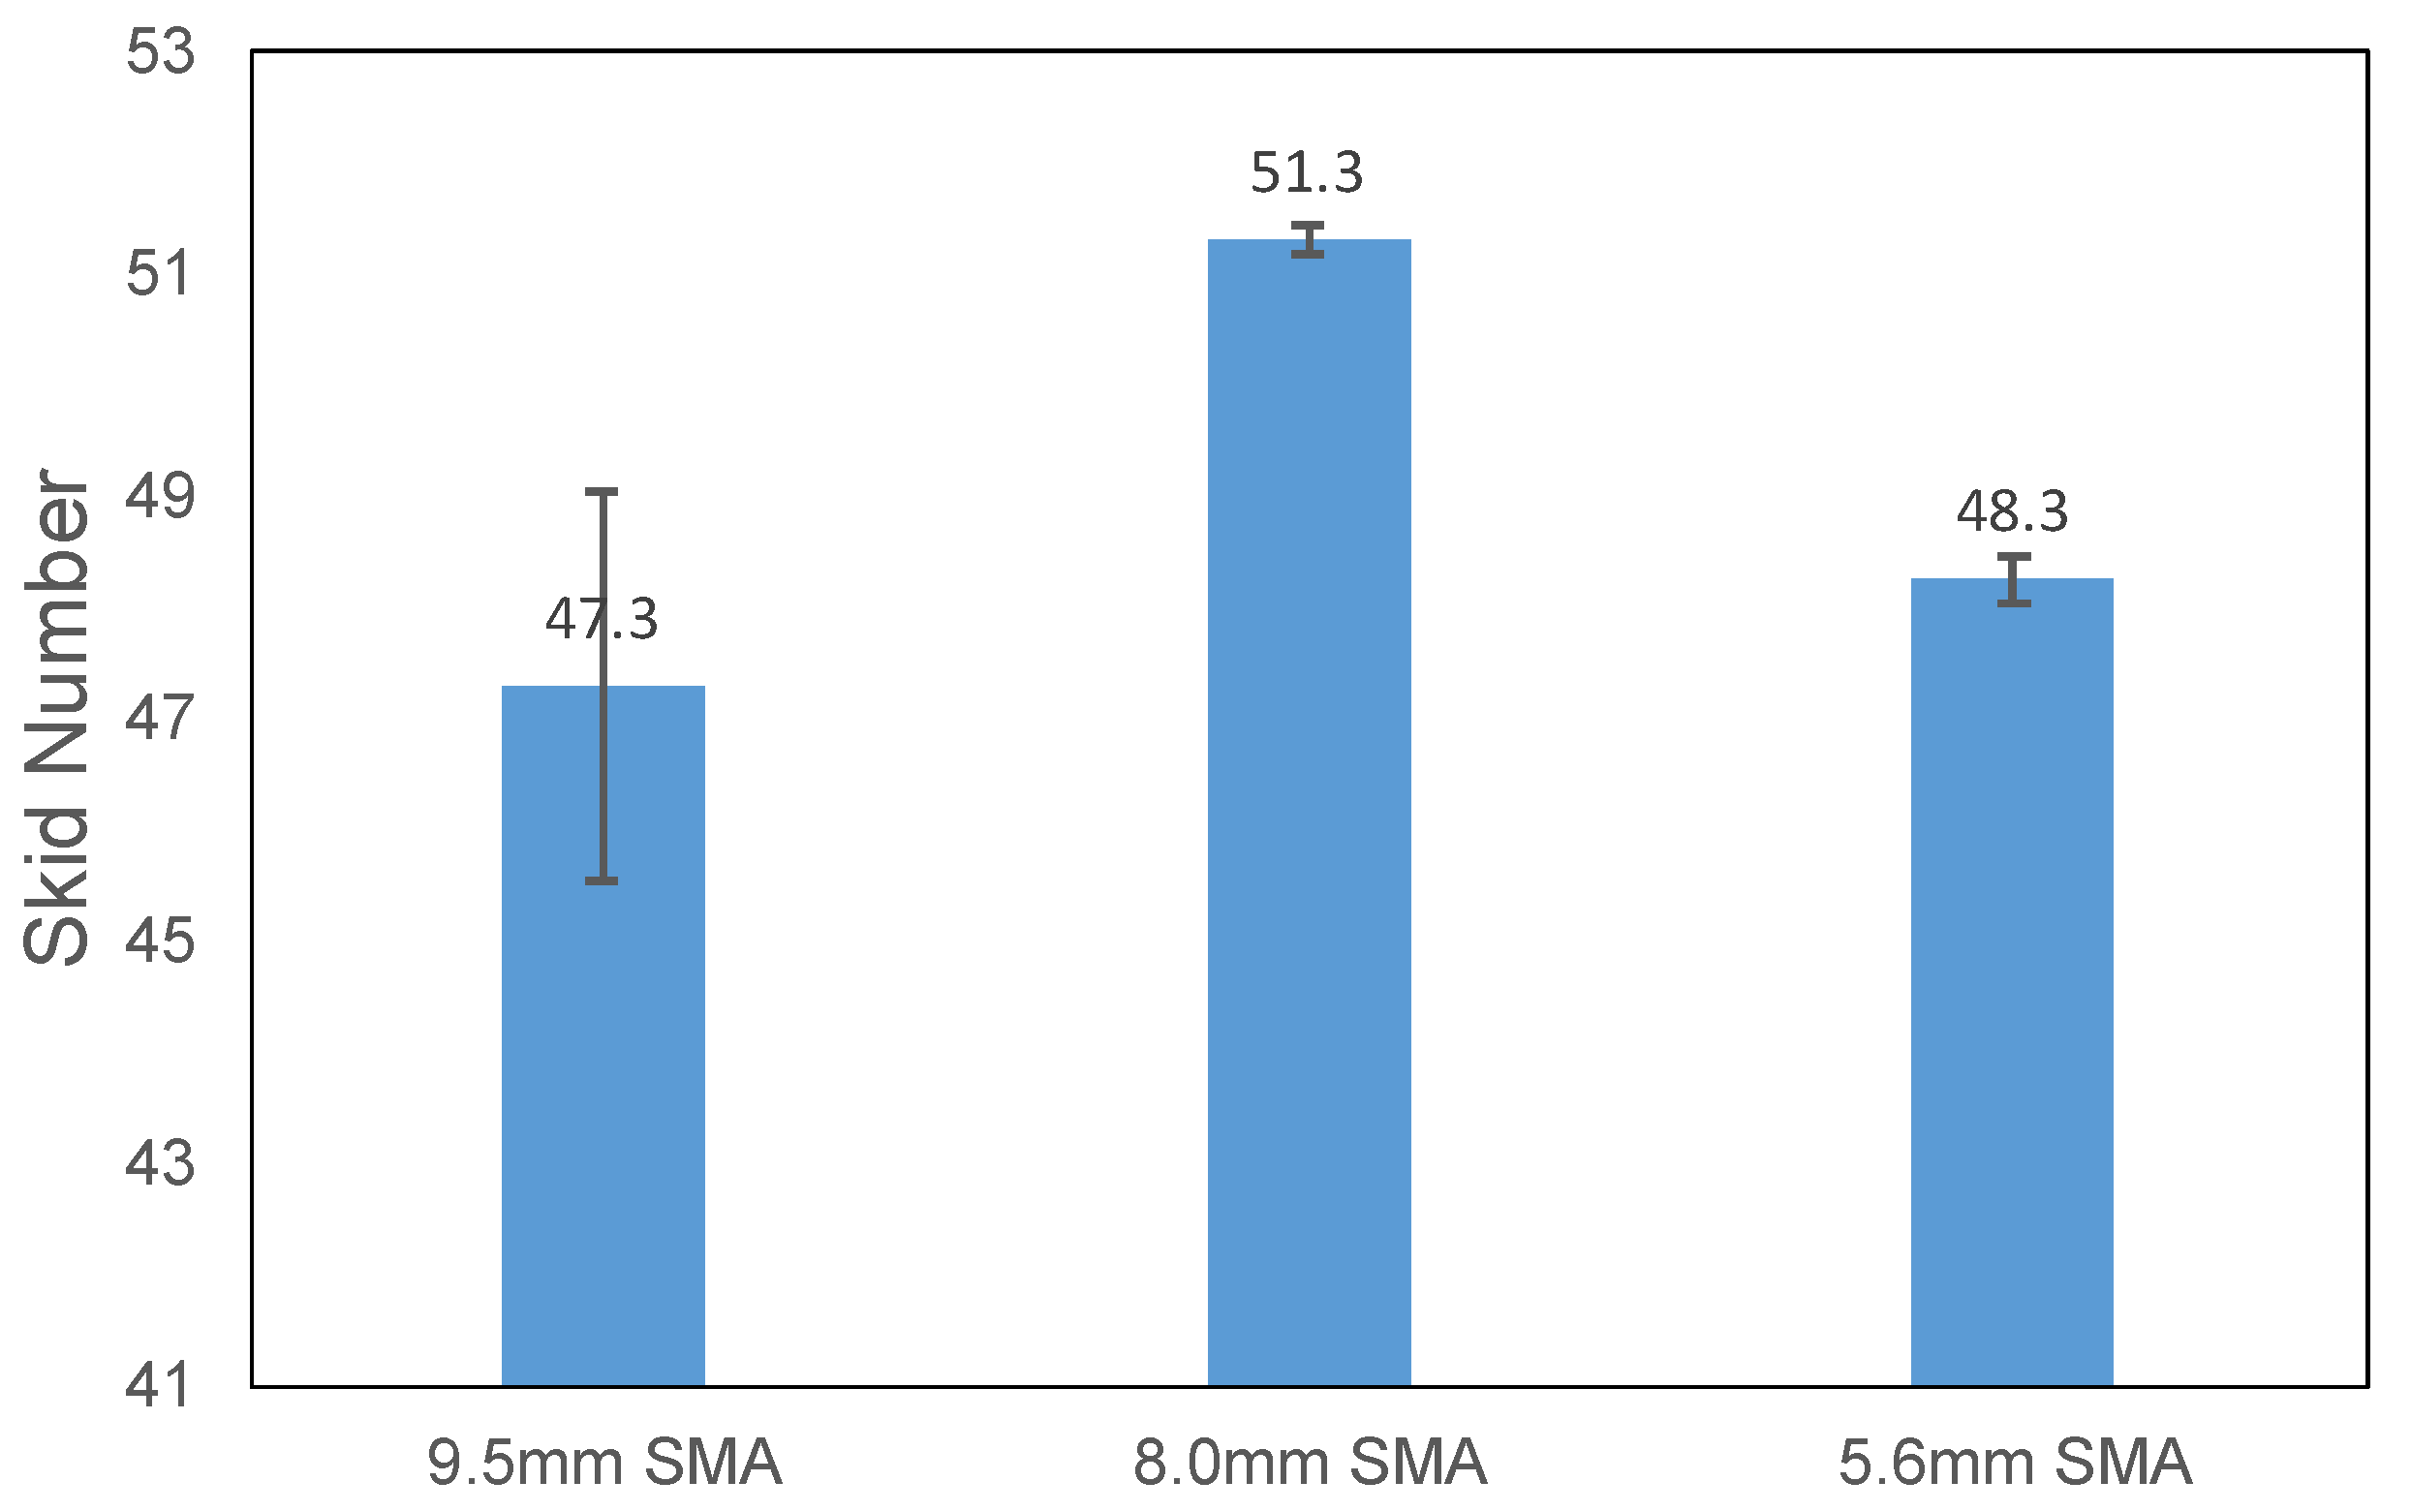
4.4. Skid Resistance Test
4.5. Shear Bond Strength Test
5. Conclusions
- The mix design and durability test results for the SMA mixtures indicate that as NMAS and design air voids decrease, the optimal asphalt content increases and thereby reduces the rutting resistance, improving the raveling resistance.
- The results of the indoor accelerated pavement tests show that to achieve the same rutting performance as that of the 9.5 mm SMA pavement with modified asphalt PG76-22, 8.0 mm SMA pavement requires the PG76-22 grade, and 5.6 mm SMA pavement requires the PG82-22 grade.
- Compared with 9.5 mm SMA mixtures, indoor reflective cracking tests indicated that 8.0 and 5.6 mm SMA mixtures had crack progression rate decreases of 22.2% and 25%.
- Compared with 9.5 mm SMA pavements, CPX measurements showed that at a speed of 100 km/h, the noise was reduced by 1.7 and 0.8 dB for 8.0 and 5.6 mm SMA pavements. At a speed of 80 km/h, the noise was reduced by 1.8 and 0.9 dB for 8.0 mm and 5.6 mm SMA pavements, respectively. SN measurements indicated that the skid resistance increased by 8.5% and 2.0% for 8.0 and 5.6 mm SMA pavements. Shear bond strength between the aged concrete and the SMA overlay pavement increased by an average of 150% for 8.0 and 5.6 mm SMA pavement.
- Overall, the 8 mm NMAS SMA mixture had superior durability and functionality for overlaying aged concrete pavements.
Author Contributions
Funding
Institutional Review Board Statement
Informed Consent Statement
Data Availability Statement
Conflicts of Interest
References
- Kreide, M.; Budija, M.; Carswell, J. The Original Stone Mastic Asphalt: The German Experience. In Proceedings of the 21st ARRB and 11th REAAA Conference, Melbourne, Australia, 18–23 May 2003. ISSN 0158-0728. [Google Scholar]
- National Asphalt Pavement Association Education Foundation. Hot Mix Asphalt Material, Mixture Design, and Construction, Maryland; National Asphalt Pavement Association Education Foundation: Greenbelt, MD, USA, 1996. [Google Scholar]
- Zhang, Y.; Sun, L.; Cheng, H. Effects of nominal maximum aggregate size and compaction effort on the mechanical properties of hot-mix asphalt. J. Constr. Build. Mater. 2022, 324, 126715. [Google Scholar] [CrossRef]
- Liu, H.; Hao, P.; Xu, J. Effects of Nominal Maximum Aggregate Size on the Performance of Stone Matrix Asphalt. Appl. Sci. 2017, 7, 126. [Google Scholar] [CrossRef]
- Cooley, L.A., Jr.; Brown, E.R. Potential of Using Stone Matrix Asphalt for Thin Overlays. Transp. Res. Rec. J. Transp. Res. Board 2001, 1749, 46–52. [Google Scholar] [CrossRef]
- Sarang, G.; Lekha, B.M.; Geethu, J.S.; Shankar, A.R. Laboratory performance of stone matrix asphalt mixtures with two aggregate gradations. J. Mod. Transp. 2015, 23, 130–136. [Google Scholar] [CrossRef]
- Woodward, D.; Millar, P.; Lantieri, C.; Sangiorgi, C.; Vignali, V. The wear of stone mastic asphalt due to slow speed high stress simulated laboratory trafficking. Constr. Build. Mater. 2016, 110, 270–277. [Google Scholar] [CrossRef]
- Rezvan, B.; Hassan, Z. Evaluation of rutting performance of stone matrix asphalt mixtures containing warm mix additives. J. Cent. South Univ. 2017, 24, 360–373. [Google Scholar] [CrossRef]
- Chen, D.H.; Won, M. CAM and SMA Mixtures to delay reflective cracking on PCC pavements. J. Constr. Build. Mater. 2015, 96, 226–237. [Google Scholar] [CrossRef]
- Cooley, L.A., Jr.; Hurley, G.C. Potential of Using Stone Matrix Asphalt (SMA) in Mississippi. National Center for Asphalt Technology; Auburn University: Auburn, AL, USA, 2004. [Google Scholar]
- Research Institute of Highway Ministry of Transport. Technical Specifications for Construction of Highway Asphalt Pavements. JTG F40; Research Institute of Highway Ministry of Transport: Beijing, China, 2004. [Google Scholar]
- AASHTO M 320; Standard Specification for Performance-Graded Asphalt Binder. AASHTO: Washington, DC, USA, 2023.
- AASHTO T 350; Standard Method of Test for Multiple Stress Creep Recovery (MSCR) Test of Asphalt Binder Using Dynamic Shear Rheometer (DSR). AASHTO: Washington, DC, USA, 2019.
- AASHTO T340; Standard Method of Test for Determining Rutting Susceptibility of Hot Mix Asphalt Using Asphalt Pavement Analyzer (APA). AASHTO: Washington, DC, USA, 2010.
- AASHTO T401; Standard Method of Test for Cantabro Abrasion Loss of Asphalt Mixture Specimens. AASHTO: Washington, DC, USA, 2022.
- Tex-248-F; Test Procedure for Overlay Test. Texas Department of Transportation: Austin, TX, USA, 2019.
- ISO 11819-2; Acoustics-Measurement of the Influence of Road Surfaces on Traffic Noise Part 2: The Close-Proximity Method. International Standard: Geneva, Switzerland, 2023.
- ASTM E2340; Standard Test Method for Measuring the Skid Resistance of Pavements and Other Trafficked Surfaces Using a Continuous Reading, Fixed-Slip Technique. ASTM International: West Conshohocken, PA, USA, 2021.
- Tex-249-F; Test Procedure for Shear Bond Strength Test. Texas Department of Transportation: Austin, TX, USA, 2019.
- Winer, G.; Balmer, H.; Kopac, R.; Brinkman. Pavement Texture and Available Skid Resistance. In Federal Highway Administration; U.S. Department of Transportation: Washington, DC, USA, 1997. [Google Scholar]
- Cenek, P.D.; Jamieson, N.J. Correlation of Skid Resistance Measuring Devices under Normal State Highway Survey Conditions; Opus International Consultants Central Laboratories: Lower Hutt, New Zealand, 2000. [Google Scholar]
- Noyce, D.A.; Hussain, U.B.; Josue, M.Y.; Jeremy, C.; Andrea, B. Incorporating Road Safety into Pavement Management: Maximizing Surface Friction for Road Safety Improvements; Midwest Regional University Transportation Center Traffic Operations and Safety (TOPS) Laboratory: Madison, WI, USA, 2007. [Google Scholar]
- Finnish Transport Agency. The Effect of Road Texture on Road Users and Road Maintenance, Road Department; Finnish Transport Agency: Helsinki, Finland, 2010. [Google Scholar]
- Woodside, A.; Woodward, D.; McErlean, P. Rolling Resistance of Surface Materials Affected by Surface Type, Tyre Load and Inflation Pressure; Maintenance and Rehabilitation of Pavements and Technological Control: Guimaraes, Portugal, 2003. [Google Scholar]


| Item | Criteria | 9.5 mm SMA | 8.0 mm SMA | 5.6 mm SMA | ||||
|---|---|---|---|---|---|---|---|---|
| Upper | Lower | Upper | Lower | Upper | Lower | |||
| Air Void (%) | 1 to 3 | 2.8 | 1.9 | 2.2 | 1.6 | 2.1 | 1.7 | |
| Asphalt Binder Content (%) | Above 6.9 | 6.9 | 7.2 | 7.0 | 7.2 | 7.2 | 7.4 | |
| VMA (%) | Above 18 | 18.2 | 18.0 | 18.1 | 18.5 | |||
| VFA (%) | Above 75 | 84.6 | 85.0 | 87.9 | 91.2 | 88.4 | 91.0 | |
| Cellulous Fiber Content (%) | 0.5 | |||||||
| Drain Down (%) | Below 0.3 | 0.18 | 0.14 | 0.15 | 0.17 | 0.17 | 0.18 | |
| Dynamic Stability (cycles/mm) | Above 2500 | 7417 | 6721 | 7277 | 6593 | 6772 | 5889 | |
| Cantabro Loss (%) | Below 12 | Below 12 | 4.3 | 3.9 | 4.1 | 3.8 | 3.6 | 3.1 |
| Below 6 | Below 6 | 10.9 | 9.1 | 10.7 | 8.8 | 9.6 | 7.5 | |
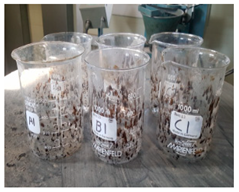 |  | 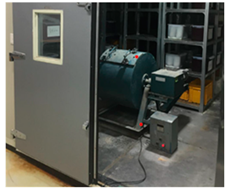 |
| Drain Down | Dynamic Stability | Cantabro Loss |
 |  |  |
| 9.5 mm SMA | 8.0 mm SMA | 5.6 mm SMA |
| SMA Mixture | Theoretical Maximum Specific Gravity | Air Void | ||
|---|---|---|---|---|
| NMAS | PG | Mix Design | Core | |
| 9.5 mm | 76-22 | 2.401 | 2.8 | 5.3 |
| 82-22 | 2.400 | 2.9 | 5.3 | |
| 8.0 mm | 76-22 | 2.385 | 2.8 | 4.6 |
| 82-22 | 2.384 | 2.8 | 4.6 | |
| 5.6 mm | 76-22 | 2.381 | 2.6 | 4.4 |
| 82-22 | 2.380 | 2.7 | 4.5 | |
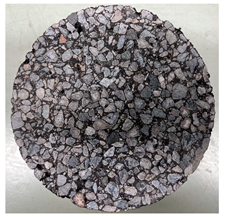
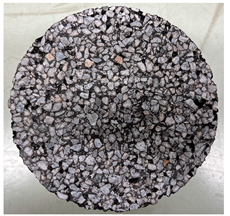
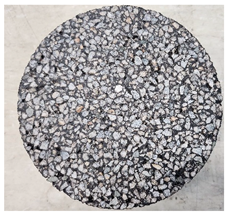
 |  |  | |||
| 9.5 mm SMA | 8.0 mm SMA | 5.6 mm SMA | |||
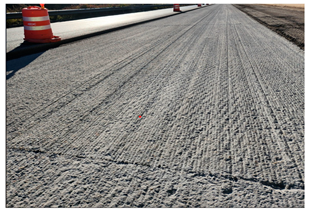 | 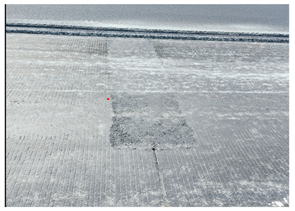 | ||||
| Aged jointed plain concrete pavement (JPCP) surfaces | |||||
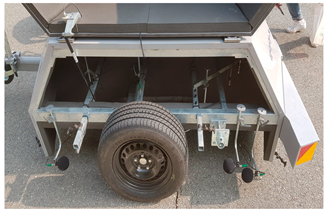 | 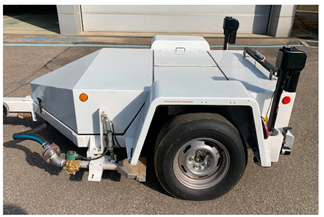 |
| (a) Tire–pavement noise measurement trailer | (b) Skid friction tester |
Disclaimer/Publisher’s Note: The statements, opinions and data contained in all publications are solely those of the individual author(s) and contributor(s) and not of MDPI and/or the editor(s). MDPI and/or the editor(s) disclaim responsibility for any injury to people or property resulting from any ideas, methods, instructions or products referred to in the content. |
© 2024 by the authors. Licensee MDPI, Basel, Switzerland. This article is an open access article distributed under the terms and conditions of the Creative Commons Attribution (CC BY) license (https://creativecommons.org/licenses/by/4.0/).
Share and Cite
Baek, C.; Kwon, O.; Lee, J. Laboratory and Field Performance Evaluation of NMAS 9.5, 8.0, and 5.6 mm SMA Mixtures for Sustainable Pavement. Sustainability 2024, 16, 7840. https://doi.org/10.3390/su16177840
Baek C, Kwon O, Lee J. Laboratory and Field Performance Evaluation of NMAS 9.5, 8.0, and 5.6 mm SMA Mixtures for Sustainable Pavement. Sustainability. 2024; 16(17):7840. https://doi.org/10.3390/su16177840
Chicago/Turabian StyleBaek, Cheolmin, Ohsun Kwon, and Jongsub Lee. 2024. "Laboratory and Field Performance Evaluation of NMAS 9.5, 8.0, and 5.6 mm SMA Mixtures for Sustainable Pavement" Sustainability 16, no. 17: 7840. https://doi.org/10.3390/su16177840
APA StyleBaek, C., Kwon, O., & Lee, J. (2024). Laboratory and Field Performance Evaluation of NMAS 9.5, 8.0, and 5.6 mm SMA Mixtures for Sustainable Pavement. Sustainability, 16(17), 7840. https://doi.org/10.3390/su16177840