Article

Effects of Varied Tillage Practices on Soil Quality in the Experimental Field of Red-Soil Sloping Farmland in Southern China

1
College of Water Conservancy, Yunnan Agricultural University, Kunming 650201, China
2
Green Smart Agricultural Field and Carbon Emission Reduction Engineering Research Center of University in Yunnan Province, Kunming 650201, China
3
Institute of International Rivers and Eco-Security, Yunnan University, Kunming 650500, China
4
Kunming Engineering Corporation Limited of Power China, Kunming 650051, China
*
Authors to whom correspondence should be addressed.
Sustainability 2024, 16(17), 7843; https://doi.org/10.3390/su16177843
Submission received: 19 June 2024 / Revised: 15 July 2024 / Accepted: 17 July 2024 / Published: 9 September 2024
(This article belongs to the Special Issue Sustainable Soil Management and Crop Production Research)

Abstract

:
Red-soil sloping farmland in southern China plays a crucial role in the local economy and food production. However, improper tillage practices have resulted in topsoil degradation and deteriorating soil quality. This study investigated changes in soil physico-chemical properties under four tillage methods—cross-slope ridge tillage (RT), down-slope ridge tillage (DT), plastic mulching (PM), and conventional tillage (CT)—on red-soil sloping farmland. The study applied the Soil Management Assessment Framework (SMAF) to assess the influence of these tillage practices on soil quality. Results indicated that PM can increase the total porosity of the soil, reduce soil bulk density, and simultaneously decrease soil surface-water evaporation, significantly improving the soil’s water-retention capacity. RT improved soil aggregate formation and stability, leading to increased macro-aggregate content, mean weight diameter, and soil water-stable aggregate stability rates. PM and RT effectively preserved soil nutrients like total nitrogen and organic matter, although PM lowered soil pH, potentially causing acidification. RT demonstrated the highest soil quality, with PM following. Crop growth positively impacted soil macro-aggregate content and stability, showing continuous improvement in soil structure and quality (p < 0.05). Priority should be given to RT in red-soil sloping farmland, followed by PM and CT, while avoiding DT if possible. This research furnishes valuable scientific substantiation for the selection of optimal tillage practices in the preservation of soil quality on red-soil slopes.

1. Introduction

Soil, an essential component of the global terrestrial ecosystem, is a vital and indispensable natural resource for human production and activities [1]. Natural soil undergoes continuous transformations through prolonged cultivation, fertilization, and other human activities, as well as natural processes, ultimately forming agricultural land [2]. The quality of cultivated soil serves as a sensitive indicator for assessing soil fertility and dynamic changes in soil management, influenced by various factors such as soil characteristics, tillage practices, and climate [3,4]. Hence, conducting precise assessments of the attributes and trends of cultivated soil quality holds immense importance for optimizing soil conditions and executing soil quality enhancement initiatives.
Soil quality evaluation quantitatively expresses the intrinsic properties of soil. Selecting appropriate evaluation indicators and constructing a logical evaluation system are fundamental prerequisites for accurately assessing soil quality [5]. Common methods used for soil quality assessment include index-based approaches, artificial neural networks, and grey relational analysis [6,7,8,9]. Among these approaches, the soil quality index (SQI) evaluation technique is extensively employed in soil quality assessment due to its versatility and ability to make quantitative adjustments [10]. To tackle the complexity and data redundancy stemming from multiple evaluation indicators, Larson and Pierce advocated for the adoption of a minimal data set (MDS) approach [11]. Currently, MDS evaluation techniques have achieved successful application in soil quality assessments across different scales [12,13,14]. Utilizing the MDS approach for selecting soil evaluation indicators effectively eliminates the need for using all indicators to assess soil quality, thereby avoiding information overlap and significantly simplifying the soil quality assessment process. Furthermore, the Soil Management Assessment Framework (SMAF), which combines principal component analysis (PCA) to generate a MDS of soil quality evaluation indicators and uses the index method to quantify soil quality, has been extensively utilized in studies related to soil quality assessment [13,15].
Red soil, an important agricultural resource in southern China, is extensively distributed in the low hilly regions located near the Yangtze River, covering a vast area of approximately 2.18 million km2 across 15 provinces including Yunnan, Jiangxi, Hunan, and Guangdong, accounting for around 22.7% of the country’s land area [16]. The hilly red-soil region, benefiting from favorable water, thermal, and climatic conditions, predominantly consists of sloped farmland, which serves as a crucial production base for the nation’s economy and food crops [17]. However, improper tillage practices over the years have resulted in significant challenges, including aggregate destruction, deterioration of the topsoil structure, increased soil erosion, and declining soil quality, posing significant obstacles to the sustainable development of regional agriculture [18,19]. Therefore, it is crucial to assess soil quality under various tillage practices and identify more suitable agricultural measures for red-soil sloping farmland.
Common tillage practices currently used in red-soil sloping farmland include cross-slope ridge tillage (RT), down-slope ridge tillage (DT), plastic mulching (PM), conventional tillage (CT), no tillage, and deep tillage [20,21]. Rational tillage practices can improve soil structure, enhance soil moisture retention, and play a significant role in improving soil quality and promoting sustainable agricultural development [22]. Studies have shown that, compared to no tillage, deep tillage reduces bulk density (BD), improves soil water-holding capacity, and promotes the formation of soil aggregates, leading to a significant enhancement of soil quality in red-soil sloping farmland [20,23]. PM diminishes soil water evaporation, elevates soil temperature, and notably enhances water-retention capability [24]. RT, compared to DT, enhances soil aggregate stability and significantly improves soil water-retention capacity [25]. Presently, studies examining the impacts of various tillage practices on soil quality in red-soil sloping farmland predominantly concentrate on no tillage and deep tillage, with relatively limited investigations on other practices. This has resulted in an incomplete understanding of the soil quality dynamics in red-soil sloping farmland under different tillage practices. Moreover, research has indicated that appropriate crop cultivation can enhance the physico-chemical properties of the topsoil and improve soil quality [26,27]. However, the effects of four tillage methods—RT, DT, PM, and CT—on changes in soil quality throughout the stages of crop growth are still largely undocumented in the current academic literature.
Therefore, this study specifically targeted red-soil sloping farmland and examined the variations in soil physico-chemical properties during different stages of crop growth under four typical tillage practices: RT, DT, PM, and CT. Additionally, a soil quality evaluation system for red-soil sloping farmland was developed based on the SMAF. Applying this framework, a quantitative analysis was carried out to examine the dynamic alterations in soil quality during crop growth with varying tillage practices. The objective of this study is to furnish scientific evidence for the selection of suitable tillage practices and efficient management of soil quality on red-soil slopes during crop growth.

2. Materials and Methods

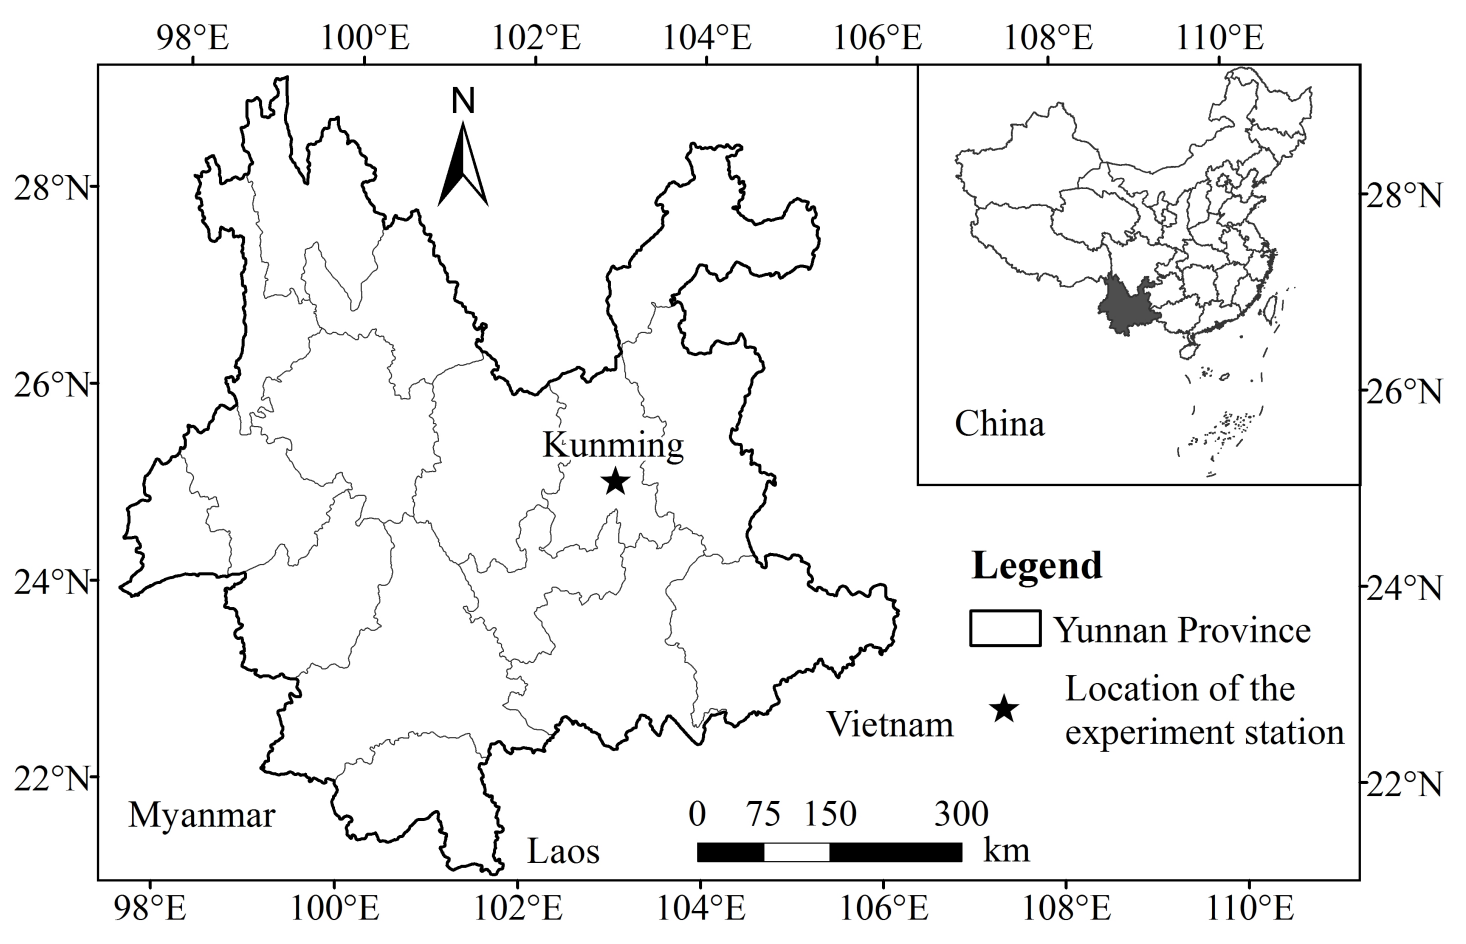
2.1. Study Site Description

The research took place at the Water-saving Irrigation Experimental Center of Yunnan Agricultural University (25°07′56″ N and 102°44′51″ E) in Kunming, Yunnan Province, China (Figure 1). The site lies at an elevation of 1930 m. The study site features a low-latitude plateau monsoon climate, exhibiting dry and cold winters as well as hot and rainy summers. The region experiences an annual sunshine duration of about 2327.5 h, accompanied by a frost-free period lasting 308 days. The average annual temperature stands at 14.9 °C, with the mean precipitation totaling 1000.5 mm, mainly concentrated between May and October. The average relative humidity remains at 76% throughout the year. This region represents a typical area for rain-fed agriculture. The experimental site is situated in the southern region of China characterized by red soil. The primary soil type in this region is red soil, classified as clay according to the international standard classification method. The basic physical and chemical properties of the soil under study are presented in Table 1.

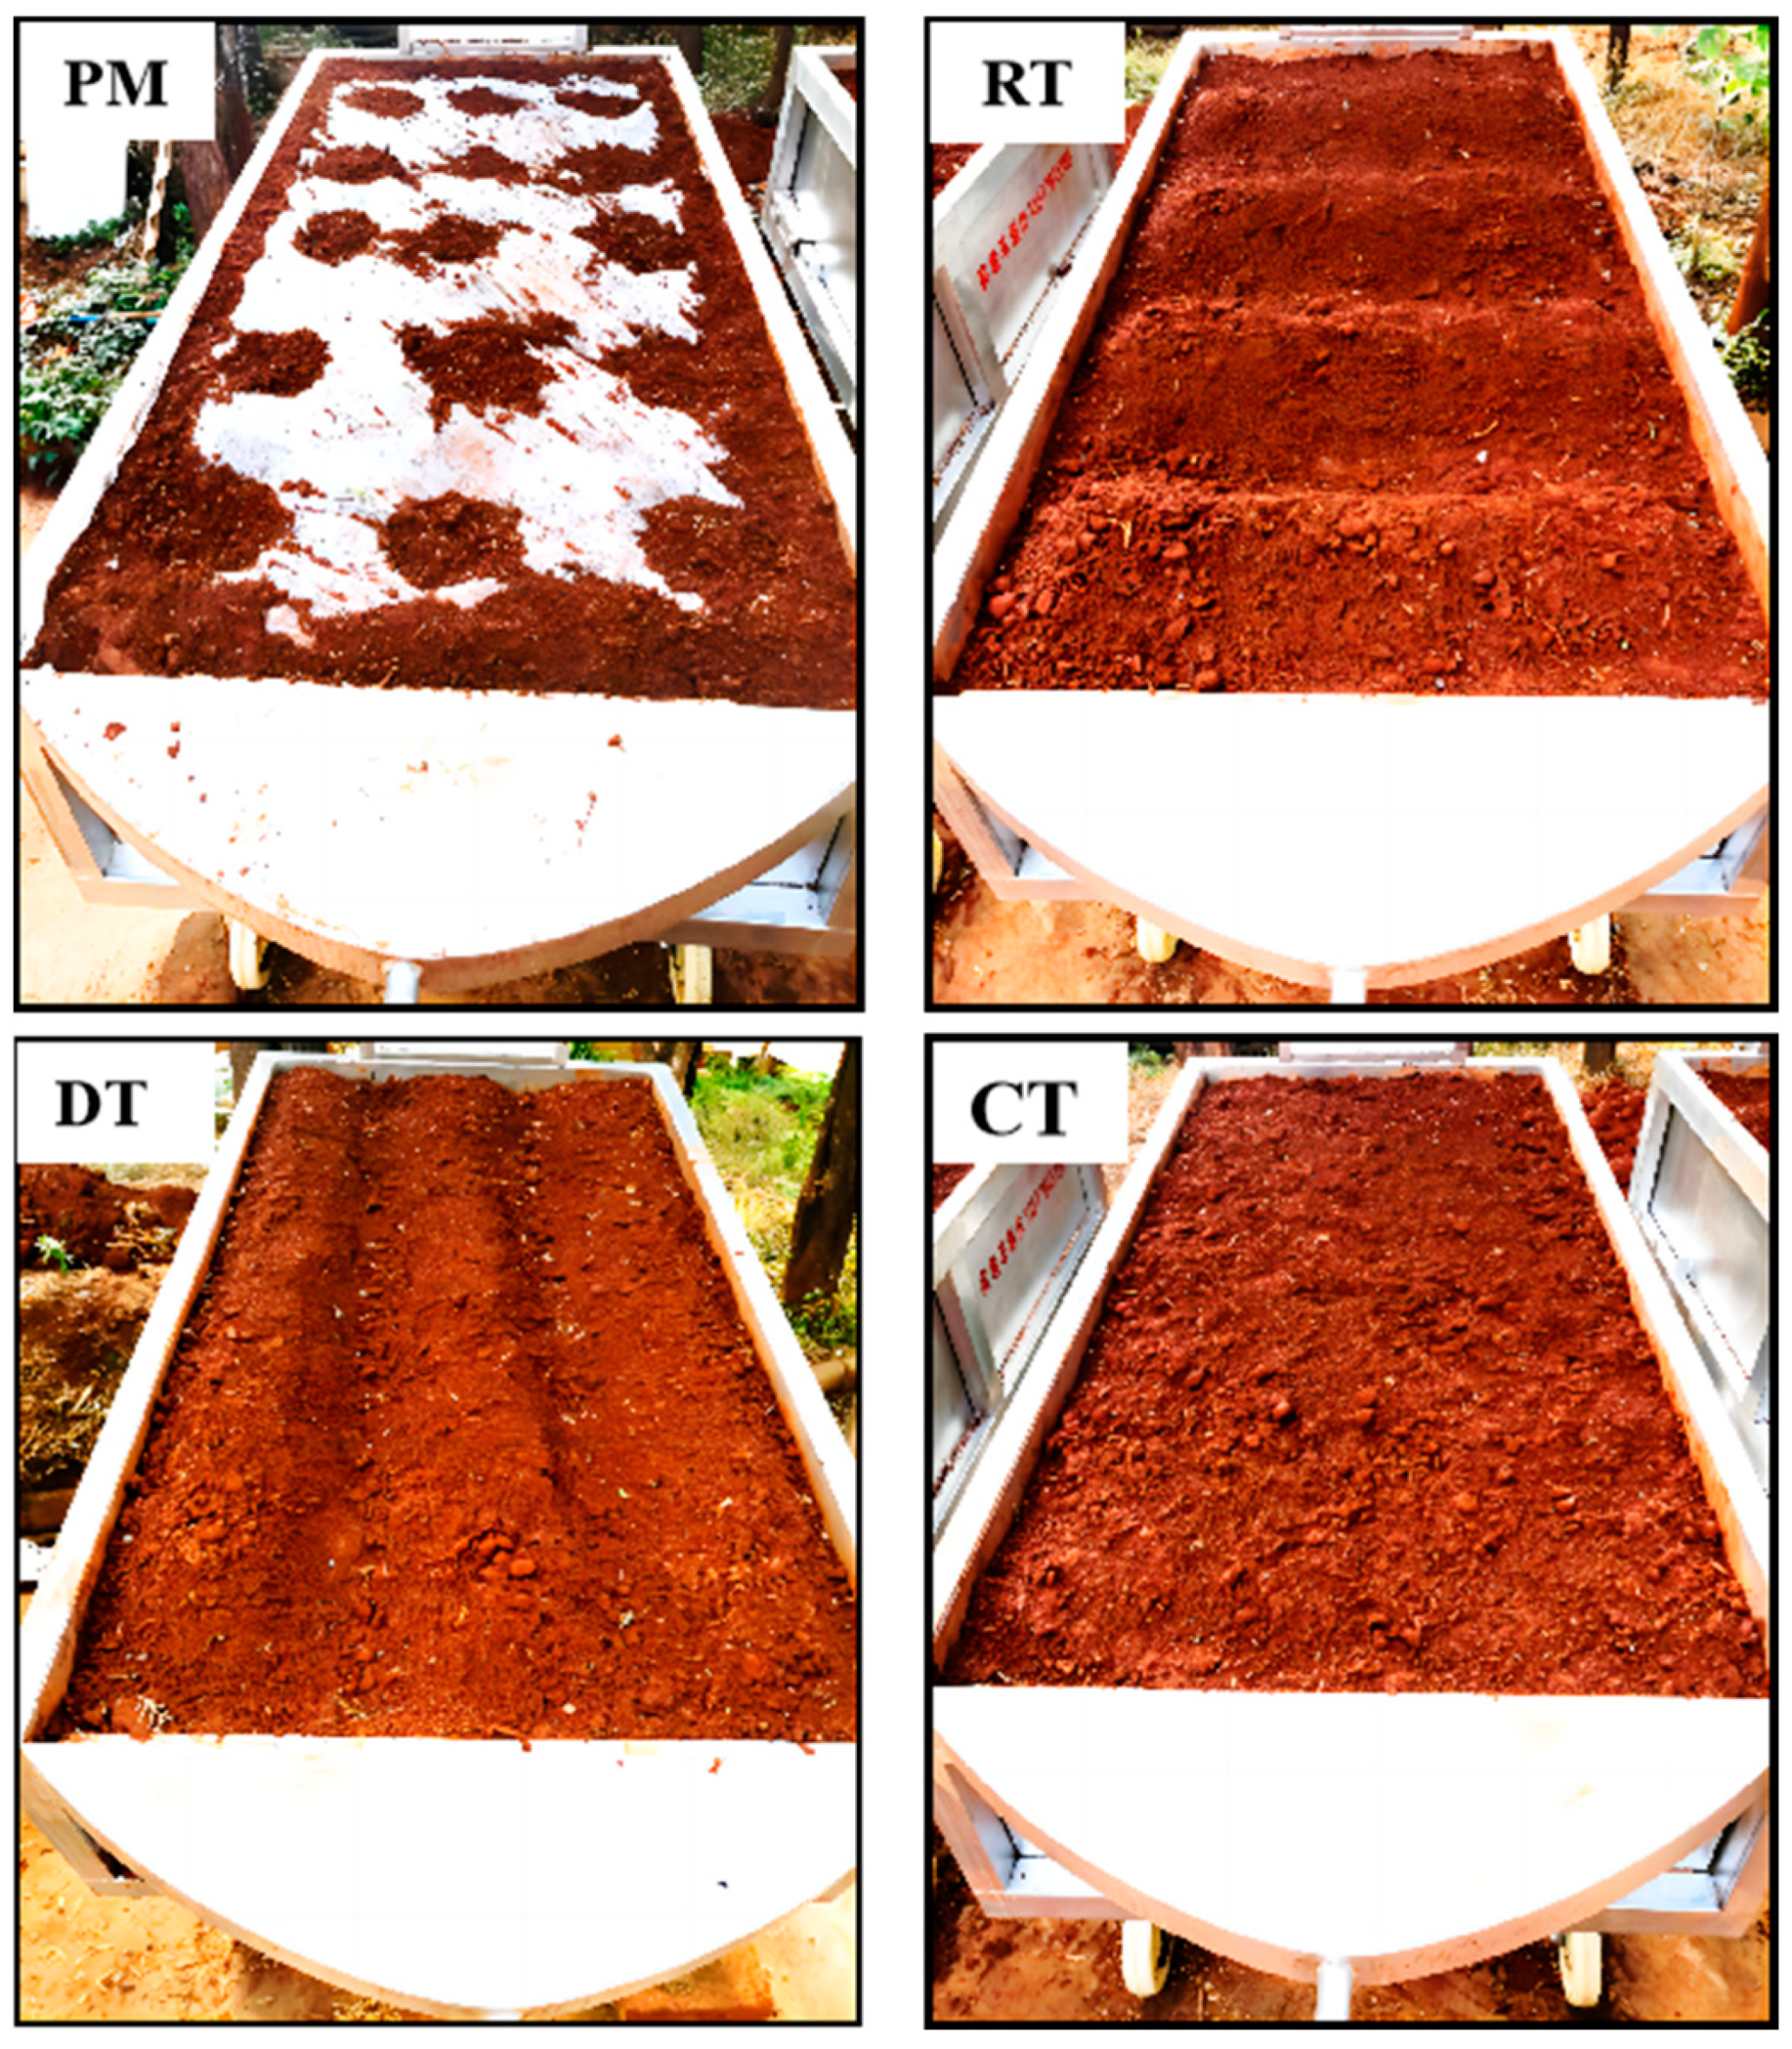
2.2. Experimental Design and Analyses of Soil-Sampling Indicators

This study recreated typical cultivation practices of red-soil sloping farmland in southern China by establishing experimental plots. The experimental area included four different tillage practice treatments: CT (crop planting without ridges along the slope direction), PM (plastic film covering after conventional tillage), RT (ridges perpendicular to the slope direction, 10 cm high), and DT (ridges parallel to the slope direction, 10 cm high) (Figure 2). The study adopted a randomized complete block design, with each treatment replicated three times. The experimental plots were made of stainless steel, measuring 160 cm (length) × 80 cm (width) × 30 cm (depth). To account for the varying slope gradients found in southern China’s red-soil areas, all plots had a consistent gradient of 10° [28]. The plots were filled with topsoil to a thickness of 30 cm, matching the typical tillage practice layer depth in red-soil sloping farmland (which ranges from 25 to 35 cm). Before crop planting, a watering treatment was applied to facilitate natural soil settlement and maintain a BD similar to that found in the natural state of red-soil sloping farmland.
The experimental plots were planted with maize using a locally predominant cultivar. Seed–hole planting with a density of approximately 90,000 plants per hectare was employed. The plants were spaced 30 cm apart horizontally and 40 cm apart vertically. Maize was sown on 21 May 2021 and harvested on 28 September 2021. The growth period consisted of three stages: early-growth stage, middle-growth stage, and maturity. Strict cultivation practices, based on local expertise in managing maize growth in red-soil sloping farmland, were implemented. Throughout the middle-growth stage, natural precipitation served as the primary water source for crop irrigation. Subsequently, irrigation was conducted biweekly for the remaining growth stages, delivering a quantity of 225 m3/ha (equivalent to 22.5 mm of water depth). Moreover, nitrogen fertilizer (urea with 46% nitrogen content) was administered during the mid-growth stage of the maize on June 22nd and July 26th, with each fertilizer application rate fixed at 75 kg/ha.
Soil sampling was conducted at three stages: early-growth (10 June 2021), mid-growth (18 July 2021), and maturity (7 September 2021). The “S”-shaped sampling method was used along the slope, selecting 5 representative points within the 0–30 cm soil layer. Approximately 2 kg of soil samples was collected from each point, taken to the laboratory, and air-dried naturally. These samples were later analyzed for soil aggregation and chemical indicators. Furthermore, soil samples were obtained utilizing a 100 cm3 cutting-ring method to measure BD, saturated moisture content (SMC), total porosity (TP), capillary porosity (CP), and other parameters related to soil water-holding capacity. Each physical and chemical property indicator was measured three times. Measurement and analysis methods can be found in Table 2.

2.3. Soil Quality Evaluation Methods

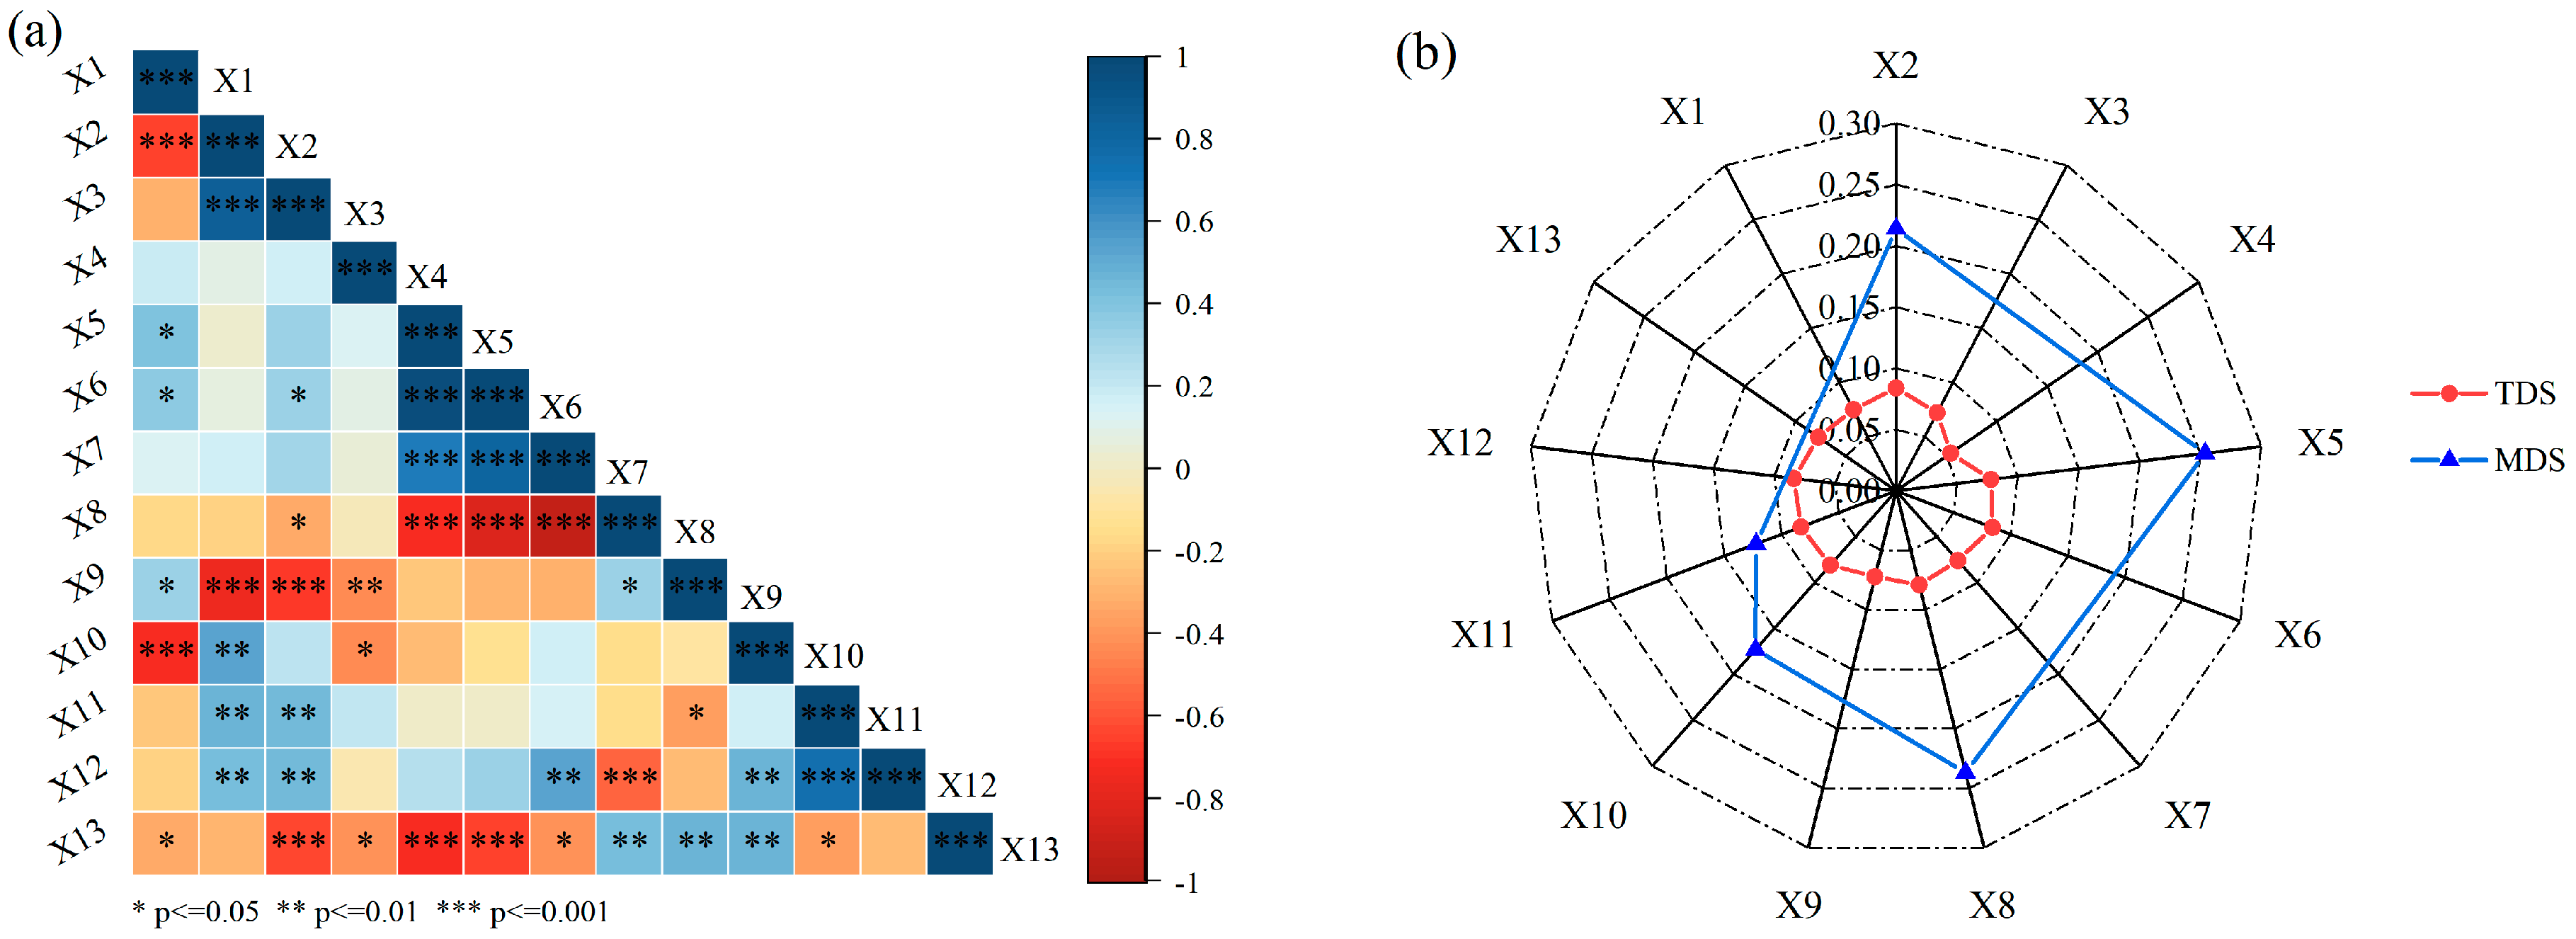
2.3.1. Establishment of the MDS

This study aimed to represent soil quality characteristics by selecting 13 indicators and establishing the total data set (TDS). PCA and the normalization value method were employed to pinpoint characteristic and independent evaluation indicators for establishing the MDS. The specific methodology involved was conducting principal component analysis to extract principal components with eigenvalues exceeding 1. Soil indicators with absolute loadings exceeding 0.5 in a principal component were aggregated. An evaluation indicator was designated to the group exhibiting the lowest correlation among other indicators in that principal component, provided it had loadings exceeding 0.5 in every principal component within the group. Norm values were calculated for each set of indicators, and those in the upper 90th percentile of the maximum norm value in each set were selected. In situations where the selected indicators showed significant correlations (p < 0.05) among themselves, the indicator with the highest norm value was included in the MDS. Alternatively, if no significant correlations were detected, all the indicators were included in the MDS.
The process for calculating the norm value for evaluation indicators is outlined as follows:
N i k = i = 1 k ( u i k 2 λ k )
where Nik represents the combined loading of the i-th variable on the top k principal components with eigenvalues ≥ 1; uik denotes the loading of the i-th variable on the k-th principal component; and λk stands for the eigenvalue of the k-th principal component.

2.3.2. Soil Quality Index Calculation (SQI)

The SQI is a comprehensive indicator that assesses the condition of the soil, with a higher value indicating better soil quality [38]. Membership functions were developed to establish the relationship between soil quality and evaluation indicators, categorized as S-shaped, inverse S-shaped, and parabolic functions. More information about the specific membership function for each indicator can be found in Table 2. Additionally, weights for soil quality evaluation indicators in the topsoil layer were determined through factor analysis. By utilizing the membership degree and weights of the evaluation indicators, the SQI was computed for both the total data set (TDS) and the modified data set (MDS). The formula for calculating this is presented below:
S Q I = i = 1 n W i N i
where Wi represents the weight of the i-th indicator, and Ni denotes the membership degree value of the i-th indicator.

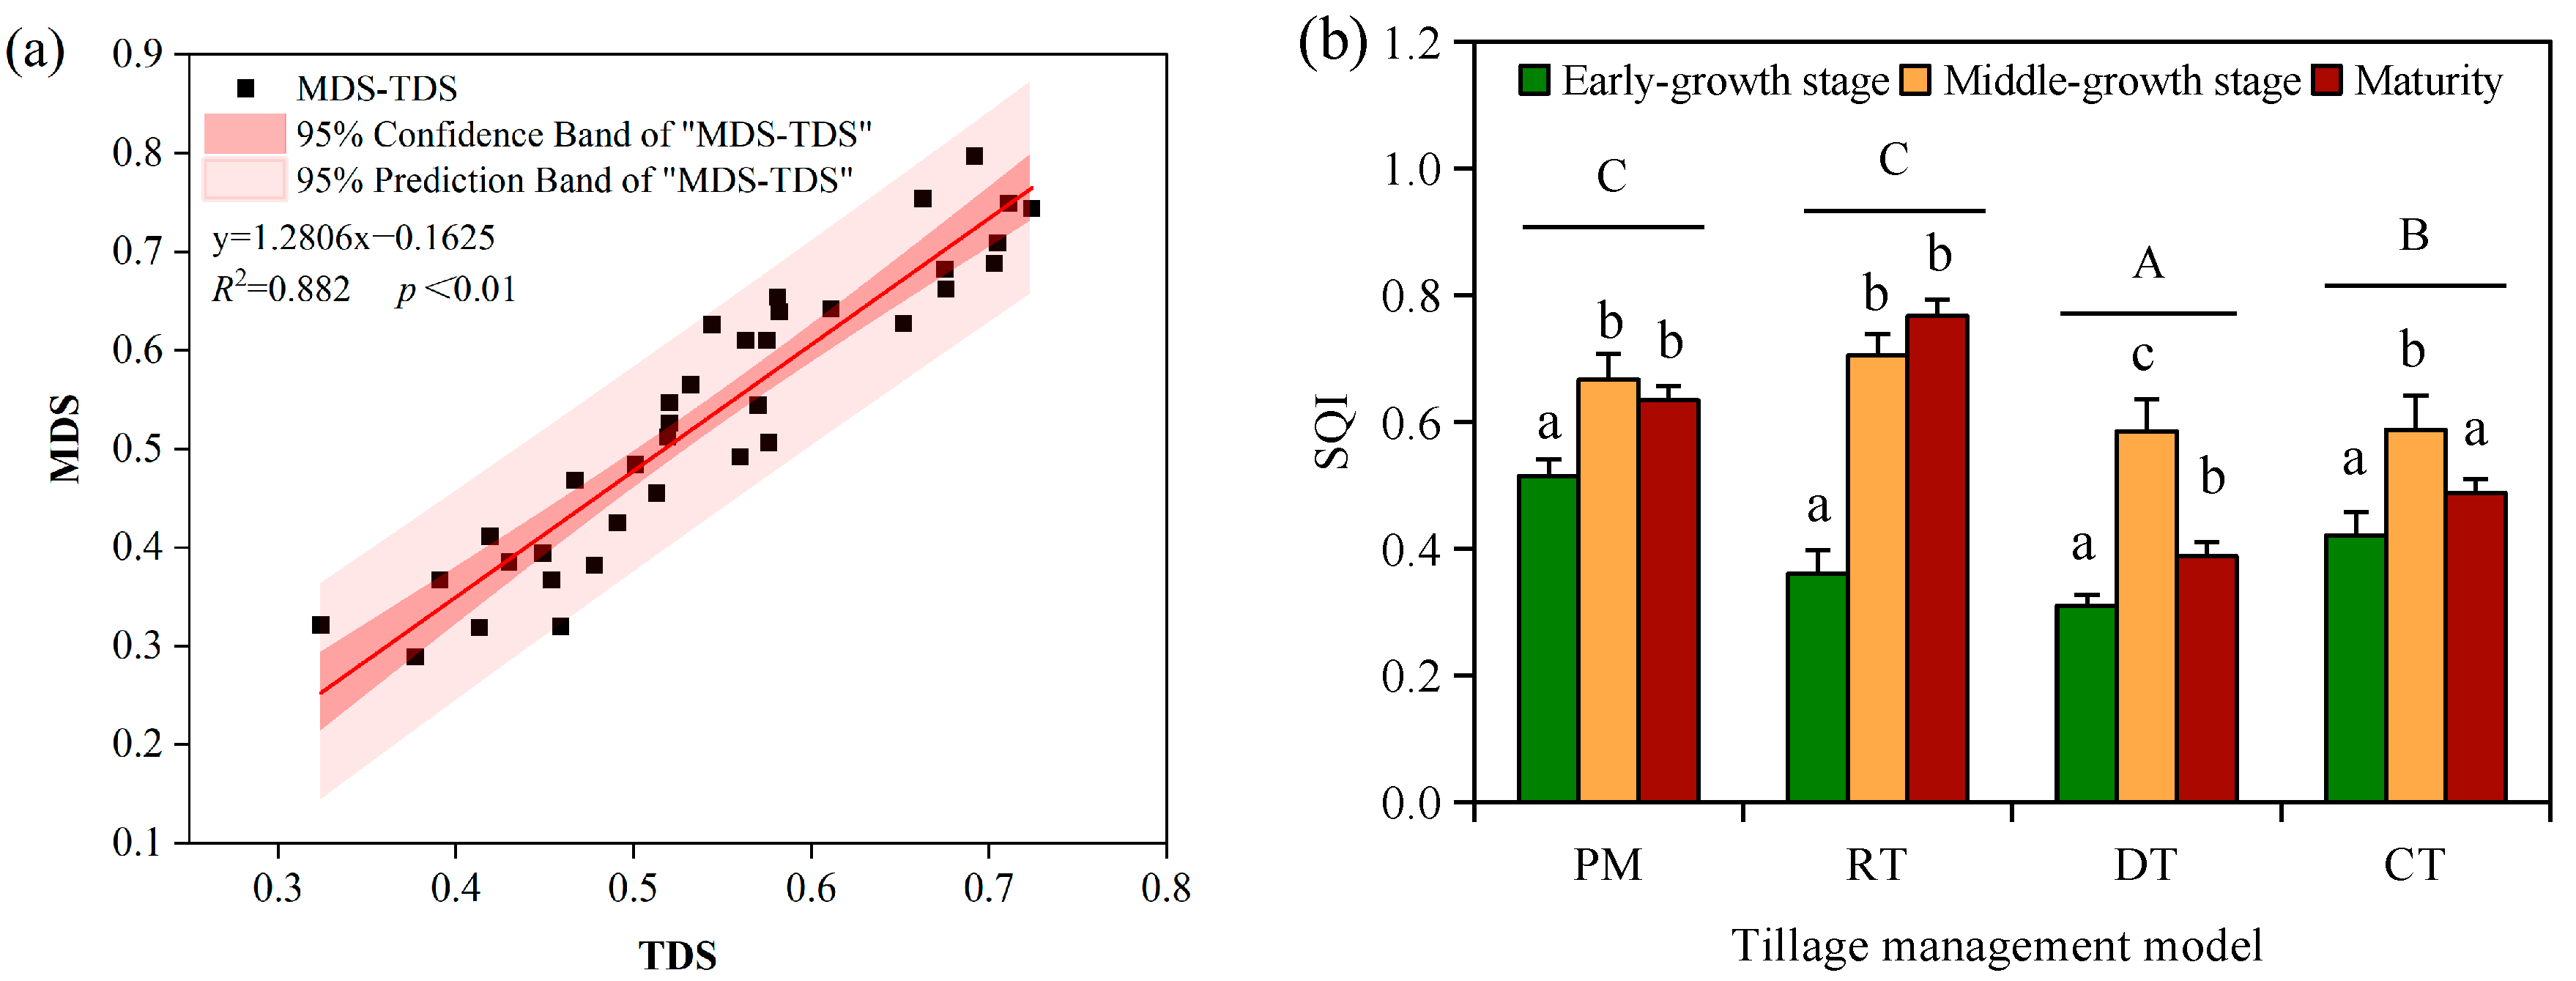
2.3.3. Accuracy Verification of SQI Evaluation

This study employed the Ef and ER measures to assess the accuracy of the SQI derived from the MDS indicator system for the topsoil layer [39], aiming to verify its accuracy. The higher precision of results obtained from the calculation based on the MDS is indicated by a closer proximity of the efficiency coefficient to 1 and the relative deviation coefficient to 0. Below is the formula for calculating this:
E f = 1 ( R 0 R c ) 2 ( R 0 R a ) 2 E R = n = 1 n R 0 n = 1 n R c n = 1 n R 0
where R0 and Ra represent the SQI and the average SQI, respectively, calculated using the TDS, while Rc is the SQI calculated based on the MDS.

2.4. Data Analyses

The initial data processing for this study was conducted using Excel 2020 application. Subsequent analyses, such as principal component analysis, correlation analysis, normality tests, and one-way ANOVA, were performed using SPSS 20.0 software. Graphs were created using Excel 2020, ArcGIS 10.5, and Origin 2021 applications.

3. Results

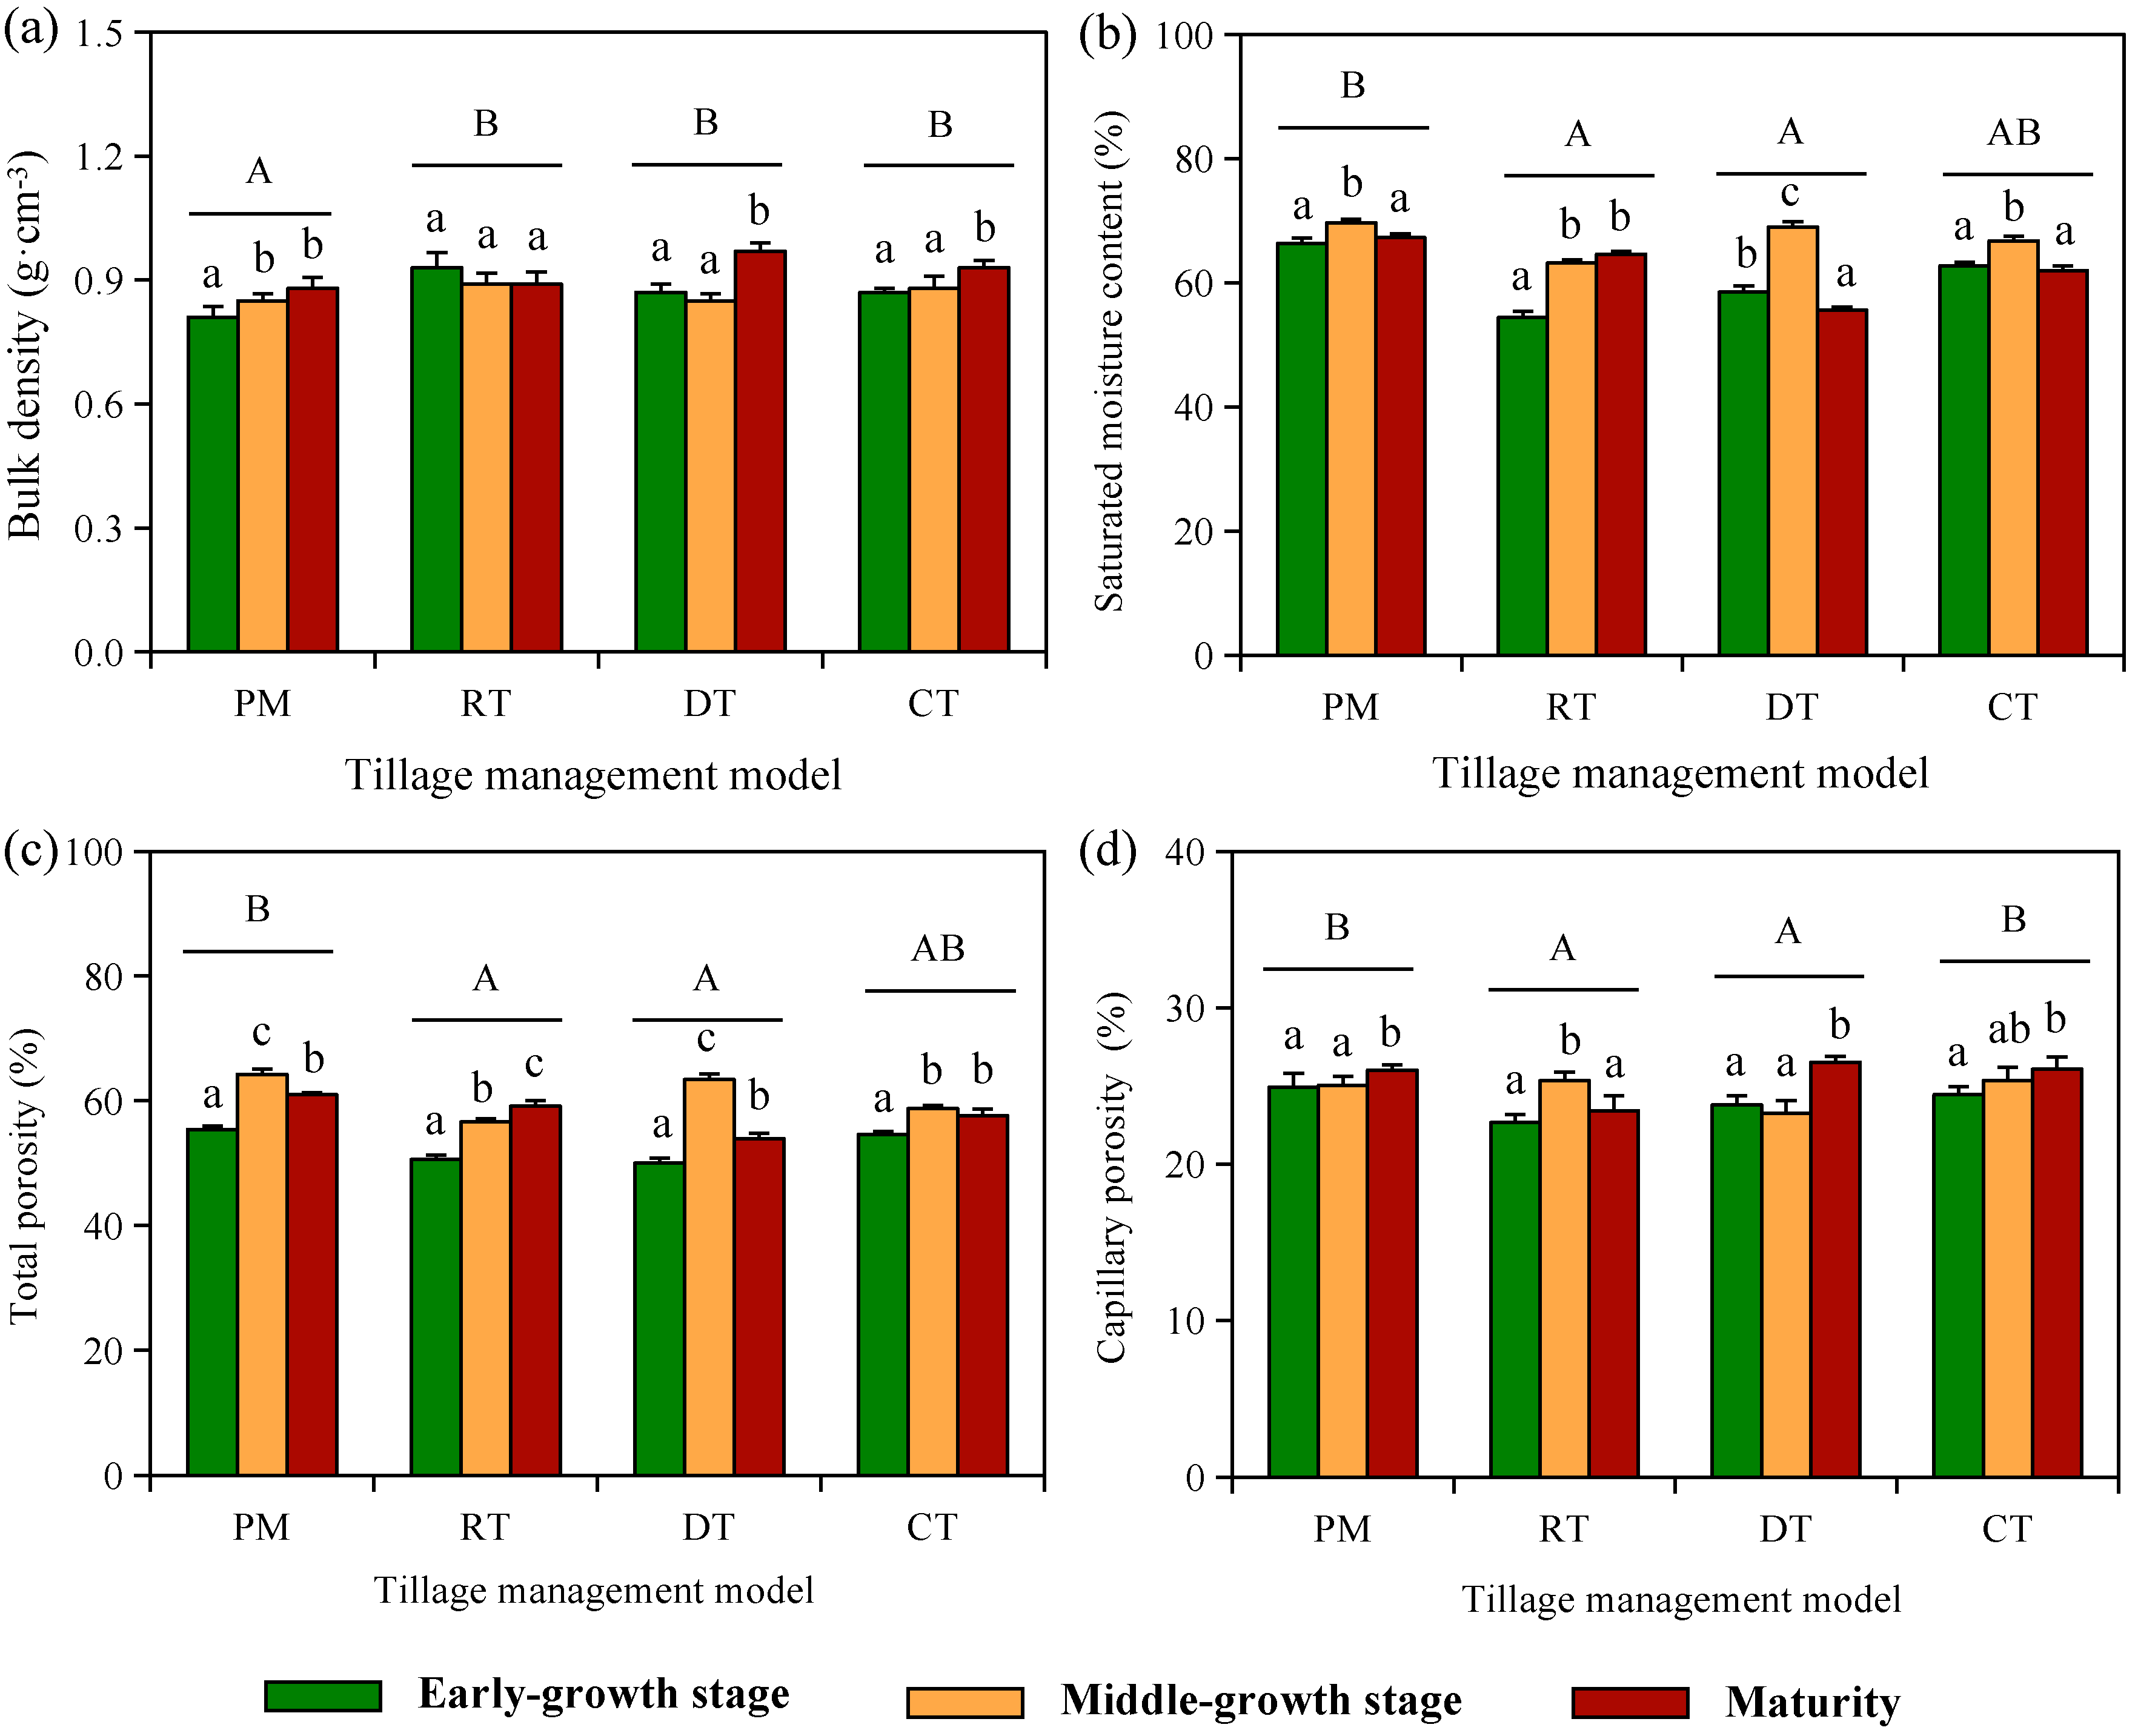
3.1. Changes in Soil Physical Properties Under Different Tillage Practices

3.1.1. Soil Water-Retention Characteristics

Significant differences are observed in soil water-retention characteristics among different tillage practices and at different growth stages of crops (Figure 3). When compared to the other three tillage practices, PM demonstrated increases ranging from 0.94% to 21.98% in SMC, 5.61% to 7.90% in TP, and −1.87% to 11.14% in CP (p < 0.05), while BD decreased by 8.99% to 10.00% (p < 0.05). In general, the relative magnitudes of SMC, TP, and CP among the tillage practices were as follows: PM > CT > DT > RT, whereas BD exhibited an overall trend of: RT > DT > CT > PM. From various growth stages, except for RT, the BD and CP of crops in crop maturity significantly increased by 6.91% to 11.68% and by 4.39% to 11.49%, respectively, compared to the early-growth stage (p < 0.05). Additionally, SMC and TP of PM, DT, and CT all displayed an initial significant increase followed by a subsequent decrease as the crop growth stage advanced (p < 0.05), while SMC and TP of RT exhibited a noteworthy increasing trend (p < 0.05).

3.1.2. Soil Aggregate Characteristics

(1).
Characteristics of Soil Aggregate Distribution
Compared to micro-aggregates within the <0.25 mm size range, the proportion of mechanically stable aggregates within the 0.25–10 mm size range is notably higher (Figure 4a). This predominance was particularly concentrated within the particle size distributions of 5–10 mm, 2–5 mm, and 0.5–1 mm. Additionally, the dominant particle size distribution was found in the range of 2–5 mm, with a content distribution ranging from 24.5% to 35.48%. When comparing different tillage practices, the content of macro-aggregates ranging from 0.25 to 10 mm generally follows the trend: RT > PM > CT > DT. The difference between RT and PM is relatively small, but they both exhibit significant differences compared to DT and CT. When analyzing the distribution characteristics of mechanically stable soil aggregates throughout various growth stages, it becomes evident that the content of macro-aggregates within the 0.25–10 mm size range consistently escalates as the crop advances through its growth stages, showcasing a pattern in size distribution where the maturity > middle-growth stage > early-growth stage.
After conducting both dry sieving and wet sieving on the soil, the results show that following wet sieving, micro-aggregates smaller than 0.25 mm dominate, accounting for a content distribution between 29.74% and 41.07% (Figure 4b). The content of macro-aggregates sharply decreases, especially for the particle sizes of 5–10 mm and 2–5 mm, indicating that compared to mechanical disruption, red-soil sloping land is more susceptible to erosion damage. When comparing different tillage practices, the pattern consistently shows a greater presence of macro-aggregates within the 0.25–10 mm size range in contrast to the proportion of micro-aggregates within the <0.25 mm size range. The ranking of macro-aggregate content within the 0.25–10 mm size range is as follows: RT > PM > CT > DT. Additionally, after wet sieving, macro-aggregates predominantly occur in the particle size range of 0.5–1 mm, with a distribution range of 26.03% to 32.22%. When comparing different crop growth stages, the correlation between the quantity of water-stable large aggregates and mechanically stable large aggregates remains consistent across all crop growth stages.
(2).
Soil Aggregate Stability
MWD and GMD are comprehensive indicators that characterize soil size distribution and the quality of soil structure. A larger value indicates stronger soil structure stability. In comparison to the other three tillage practices, RT demonstrates increases ranging from 1.88% to 25.16% in MWD and 5.41% to 21.45% in GMD (p < 0.05). The overall order of MWD among the tillage practices is RT > DT > CT > PM, while the trend for GMD is RT > PM > CT > DT (Figure 5a,b). Within the same growth stage, the RT consistently exhibits significantly higher values for both indicators compared to the other three tillage practices (p < 0.05). When comparing different stages of crop growth, both MWD and GMD exhibit a progressive increase in the following order: early-growth stage, middle-growth stage, and maturity, with statistically significant differences (p < 0.05).
PAD and WSAR are pivotal indicators that showcase soil aggregates’ resilience to disruption. In comparison to the other three tillage practices, RT shows reductions in PAD ranging from 1.87% to 13.82% (p < 0.05). The overall order of PAD among the tillage practices is DT > CT > PM > RT, while the trend for WSAR is the opposite (Figure 5c,d). Additionally, compared to CT and DT, PM demonstrates a significant advantage in improving the stability index of soil aggregates (p < 0.05). When assessing various growth phases of crops, it is noted that the stability index of soil aggregates shows a gradual increase across the following stages: early-growth stage, middle-growth stage and maturity. The WSAR, in contrast, exhibits a trend opposite to the stages mentioned earlier. Notably, both PM and RT significantly enhance the stability index of soil aggregates as crops progress from the early-growth stage to maturity (p < 0.05).

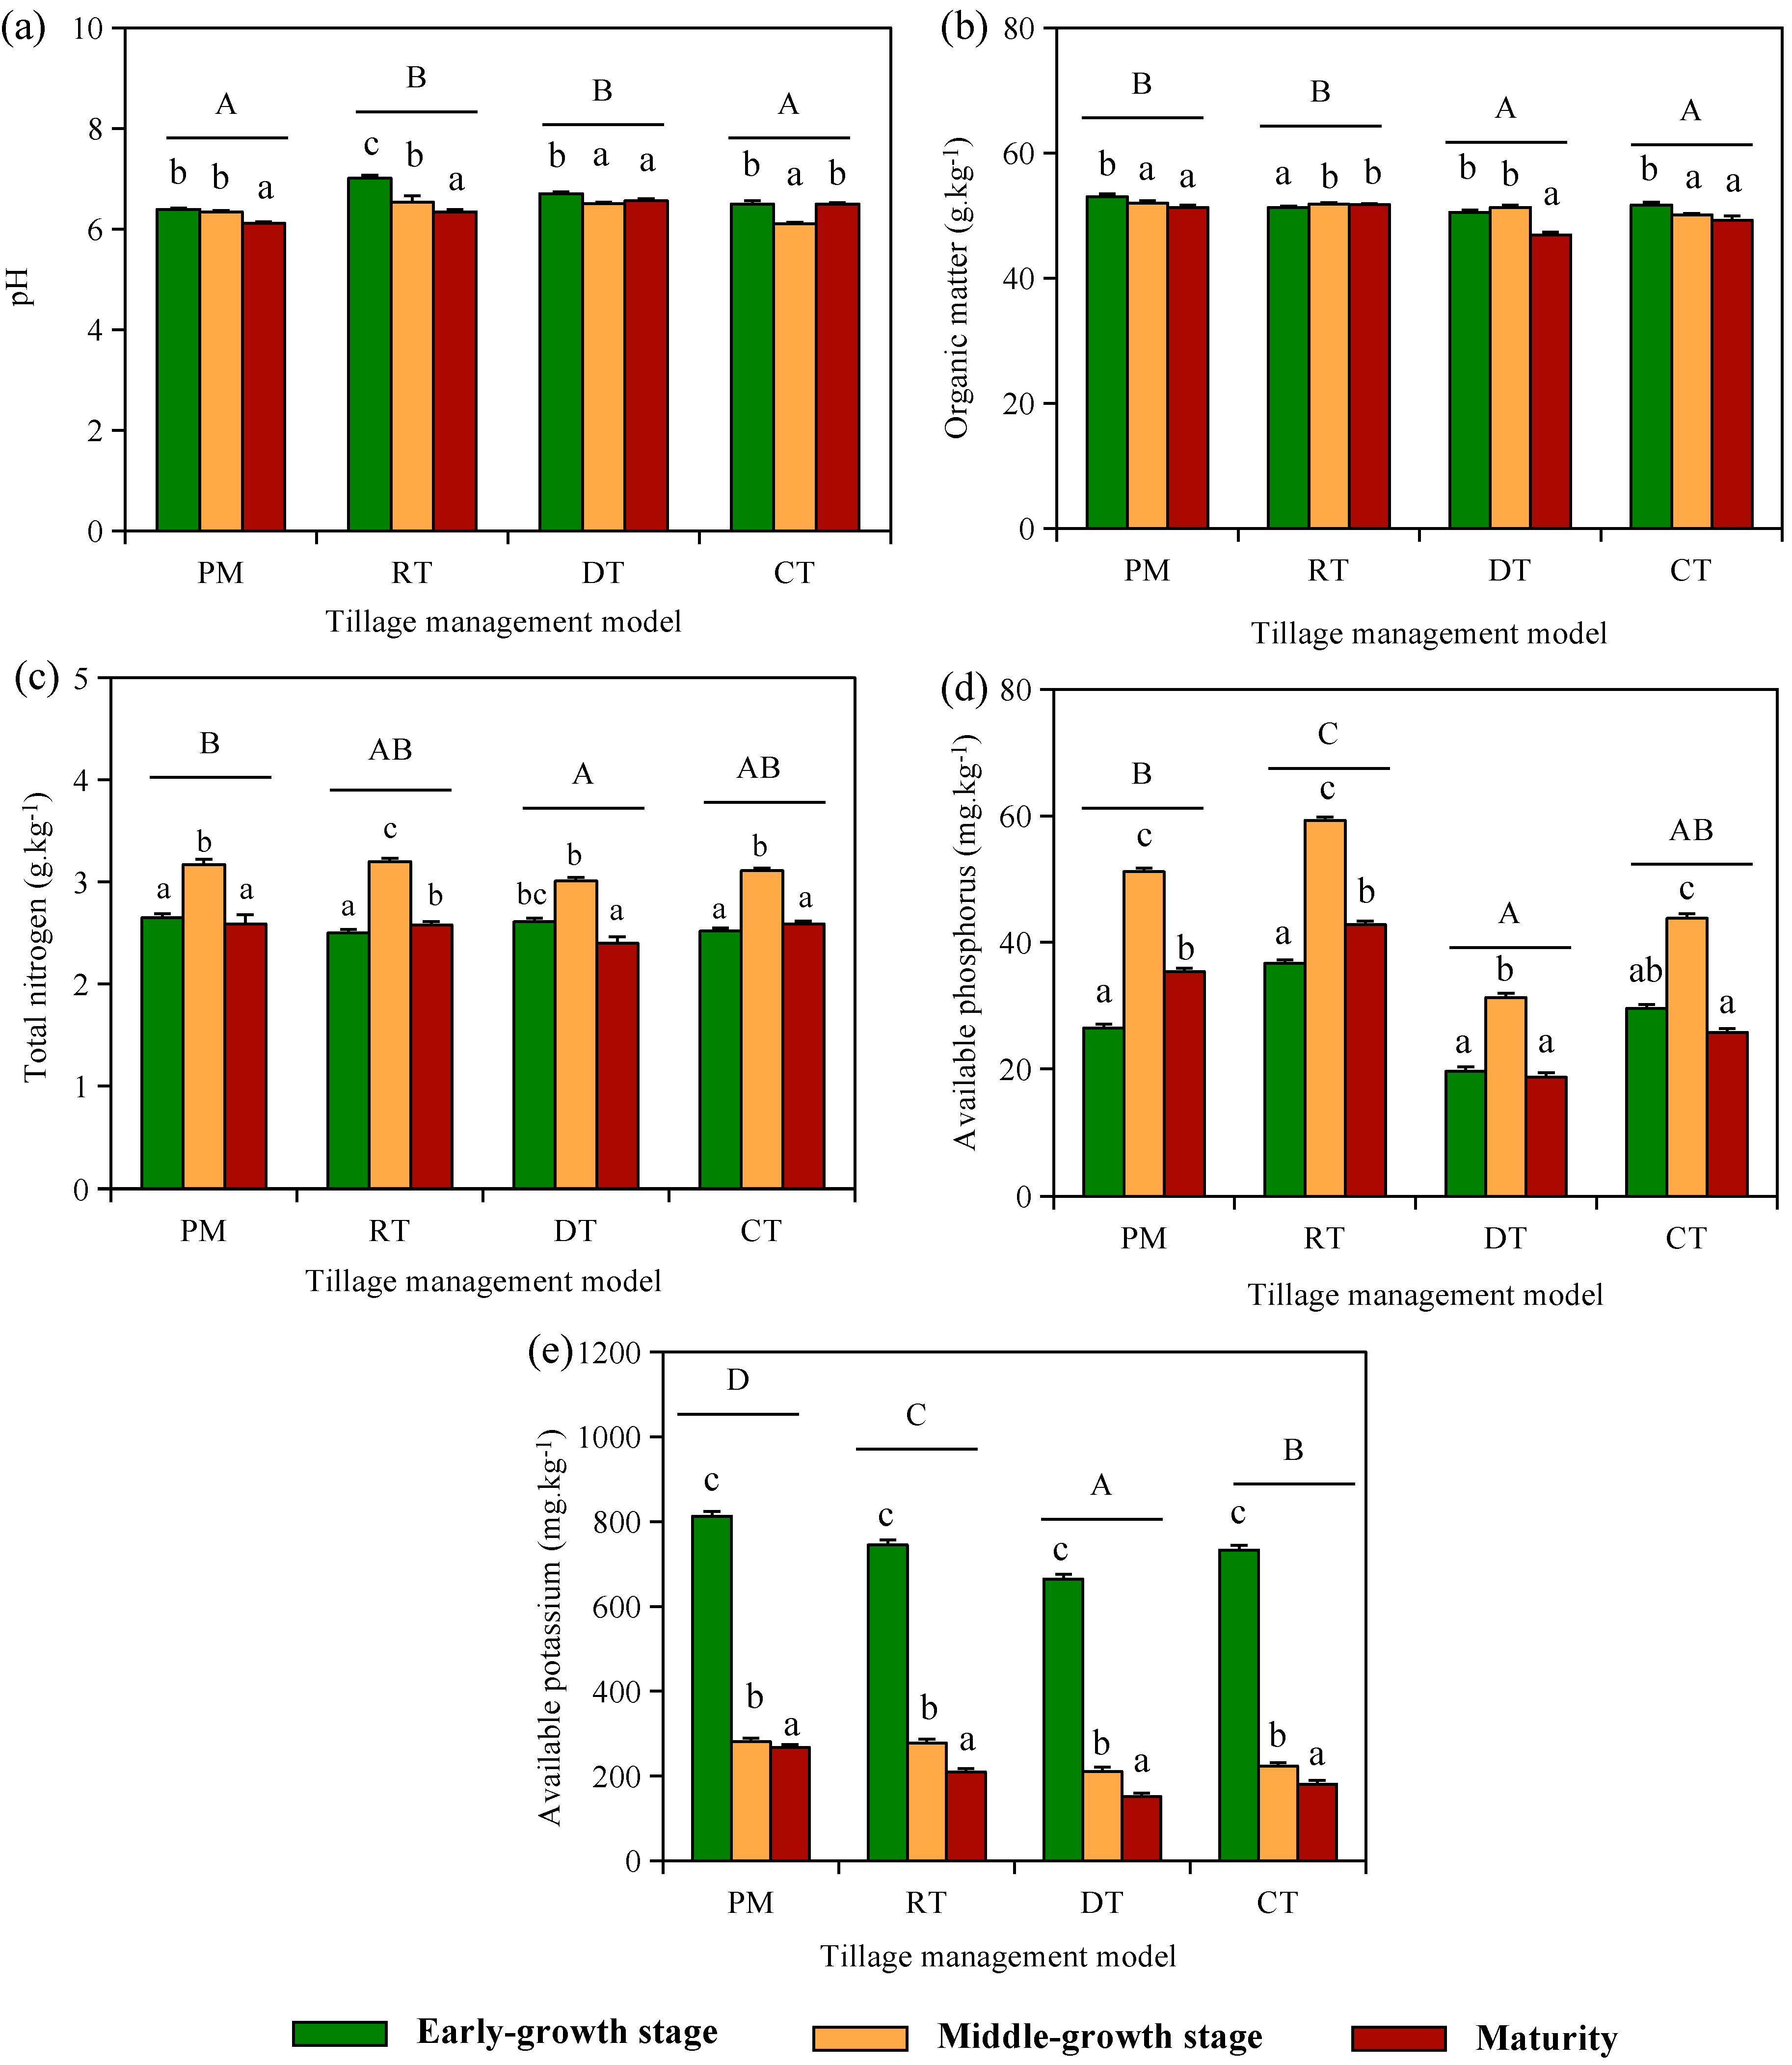
3.2. Changes in Soil Chemical Properties Under Different Tillage Practices

The pH, as an important chemical property of soil, is a crucial parameter that affects the status, transformation, and availability of soil nutrients. The overall order of pH among the tillage practices is: RT > DT > CT > PM (Figure 6a). Among these practices, RT and DT exhibit neutral soil pH characteristics, while CT and PM show weak acidity. This suggests that PM might contribute to soil acidification, potentially impacting the efficiency of soil nutrient utilization. During different growth stages, there is a significant decreasing trend in soil pH during maturity compared to the early-growth stage, except for the CT (p < 0.05).
TN and OM content are important indicators for assessing soil quality levels and studying the ecological environment. Generally, higher OM content in the soil leads to higher TN content. In comparison to the other three tillage practices, PM shows increasesranging from −1.01% to 9.30% in OM and −0.94% to 7.92% in TN (p < 0.05). The overall order of OM and TN among the tillage practices is PM > RT > CT > DT (Figure 6b,c). Furthermore, the fluctuations in soil TN and OM content adhere to the overall trend. Comparing different growth stages of crops, except for RT, the other three tillage practices show a significant decrease in OM content during maturity compared to the early-growth stage (p < 0.05).
AK and AP content are potential factors that affect crop growth. In comparison to the other three tillage practices, RT shows increases in AP ranging from 15.82% to 128.88% (p < 0.05), while the utilization of PM led to an increase in AK ranging from 9.13% to 75.66% (p < 0.05). The overall order of AP among the tillage practices is observed as RT > PM > CT > DT, while the order for AK is generally PM > RT > CT > DT (Figure 6d,e). The findings suggest that RT and PM notably improve the storage and supply capacity of phosphorus and potassium, respectively. Comparing different growth stages of crops, as the crop growth stage progresses, there is a significant increase followed by a significant decrease in AP content (p < 0.05). On the other hand, AK content shows a continuous and significant decreasing trend (p < 0.05) throughout the crop growth stages.

3.3. Changes in Soil Quality Under Different Tillage Practices

3.3.1. Establishing a MDS for Soil Quality Assessment

To enhance the efficiency of the soil evaluation system indicators and mitigate redundancies resulting from inter-correlations among evaluation indicators, PCA was utilized on the initial 13 selected evaluation indicators. Based on the PCA results (Table 3), four principal components exhibit eigenvalues exceeding 1, accounting for a cumulative contribution rate of 87.813% in the evaluation of topsoil quality in red-soil sloping cropland. This indicates that PC1 to PC4 collectively have strong explanatory power for the information contained in the original multiple indicators.
This study employed a component partitioning approach to classify the evaluated indicators into different groups. The first group includes SMC, TP, GMD, PAD, WSAR, pH, AP, and AK. The second group consists of BD and MWD. CP and OM are categorized into the third group, while TN belongs to the fourth group. Applying the MDS selection method based on these groups, comparisons were made between the norm values of each indicator (Table 3) and the inter-correlations among the indicators (Figure 7a). Consequently, five indicators were selected for the MDS in soil evaluation: SMC and PAD from the first group, MWD from the second group, OM from the third group, and TN from the fourth group. The screening efficiency of the MDS indicators reached 61.54%.

3.3.2. Rational Validation of MDS and Soil Quality Evaluation

The thoughtful choice of indicators for the MDS directly impacts the precision of soil quality evaluation in the topsoil layer. Therefore, validating the indicators of the MDS is a crucial step in the soil quality evaluation process. By analyzing the factor variances of the TDS and MDS using PCA, the weights for each indicator can be established (Figure 7b). By standardizing each indicator and inputting them into the SQI function, the SQI can be calculated for different data sets. The SQI based on the TDS ranges from 0.324 to 0.724, with an average of 0.545 ± 0.104 and a coefficient of variation of 19.17%. The SQI based on the MDS ranges from 0.289 to 0.797, with an average of 0.535 ± 0.142 and a coefficient of variation of 26.56%. Both data sets show moderate variability, with similar ranges and means. Additionally, from the results of linear regression analysis (Figure 8a), it is evident that the SQI based on the TDS correlates significantly positively with the index based on the MDS, with Ef and ER of 0.693 and 0.02, respectively. These results indicate that using the SQI established based on the MDS provides higher accuracy in evaluating red-soil sloping farmland, representing the information of the TDS for red-soil sloping farmland evaluation effectively.
The SQI derived from the MDS indicators is utilized to assess the quality levels of red-soil sloping farmland under various tillage practices (Figure 8b). Referring to the soil quality classification criteria in reference [40], this study divides the SQI for red-soil sloping farmland into categories ranging from high to low as follows: high (0.8–1.0), relatively high (0.6–0.8), moderate (0.4–0.6), relatively low (0.2–0.4), and low (0–0.2) ranges. The SQI exhibits significant differences among different tillage practices and crop growth stages (Figure 8b). In comparison to the other three tillage practices, RT exhibits an increment in SQI ranging from −29.91% to 97.68% (p < 0.05). The overall order of SQI among the tillage practices is RT > PM > CT > DT. The RT and PM show relatively higher levels of soil quality, while CT and RT are only at a moderate level. The average SQI value for RT is 41.69% higher than that of DT. Under the same management mode, there is a significant improvement in SQI during maturity compared to the early-growth stage (p < 0.05), with RT showing the most significant increase of 112.79%. These results indicate that under the same crop management mode, RT can more effectively maintain soil quality levels and promote soil health and sustainable utilization.

4. Discussion

4.1. Effect of Tillage Practices on Soil Quality in Red-Soil Slopes

Soil physico-chemical properties are widely used indicators for assessing topsoil quality as they are essential for maintaining balance among soil moisture, fertility, air, and heat [20]. Various tillage practices can induce alterations in soil physico-chemical characteristics, resulting in diverse effects on soil quality [41]. Among these, soil moisture functions as a vital transporter for nutrient movement and significantly influences crop growth, while the availability of water primarily constrains crop development [42]. Soil pore conditions and specific surface area are major factors determining soil water-holding capacity. It is widely acknowledged that a lower BD correlates with higher TP and macro-porosity, leading to enhanced water-holding capacity and water retention of the soil [43,44]. Researchers have investigated the impacts of various tillage practices on soil moisture dynamics, considering the attributes of red-soil sloping farmland in southern China, characterized by high clay content and restricted water storage capacity. The results show that different tillage practices alter the soil structure, leading to modifications in material cycling and energy conversion balance within the ecosystem [45]. This study compared the water-holding characteristics of four distinct tillage practices, namely PM, RT, DT, and CT. Analysis demonstrated that PM substantially reduces surface soil evaporation, mitigates soil erosion, and enhances the water-holding capacity of red-soil sloping farmland. This is consistent with the results reported by Fang et al. [24] and can be attributed to the formation of a physical barrier by PM, which reduces soil evaporation and improves the topsoil’s drought-resistance capability. Therefore, in the dry season in this region, surface mulching practices such as PM are effective tillage practices for water conservation and moisture retention in red-soil slope cultivation.
Soil aggregates and nutrients are crucial for defining soil structure and fertility. Characteristics of soil aggregates and nutrient content directly impact crop growth and agricultural performance [46]. Proper soil structure is essential for nutrient movement, and stable soil aggregates facilitate the efficient transport of nutrients, water, and air, contributing to favorable soil structure for crop growth [47]. Many scholars have researched soil structure in the red-soil slope areas of southern China, and these studies have revealed significant disparities in aggregate distribution and stability among different tillage practices. Studies have shown that conservation tillage practices stimulate the development of macro-aggregates, resulting in increased soil carbon sequestration, enhanced soil fertility, and higher crop yields [48]. According to this study, RT showed significantly higher values in soil aggregate characteristics (MWD, GMD, and WSAR) compared to the other three tillage practices, which is consistent with the results reported by other researchers [49]. This outcome can be attributed to the microtopographic features generated by RT, which effectively intercepts runoff sediment, diminishes the erosive force of runoff, safeguards OM, and prevents nutrient loss. On the contrary, DT creates a natural pathway for runoff collection and flow, resulting in increased erosive force, which may cause structural damage and nutrient loss. Additionally, among PM, DT, and CT tillage practices, PM showed significantly higher values in soil aggregate and nutrient characteristics compared to the other two practices. This is due to the fact that PM reduces human-induced soil disturbances and alters microtopography, creating a conducive environment for soil macro-aggregate formation. This, in turn, enhances soil organic carbon sequestration by increasing the quantity and stability of water-stable aggregates.
Soil quality serves as a sensitive indicator for evaluating the dynamic changes in soil environments and management. The SQI is a numerical measure that quantifies soil quality, with higher values indicating better quality [3,38]. The influence of tillage practices on soil quality, as assessed in this study using the MDS, signifies the impact of human cultivation on agricultural land. Taking into consideration the soil water-holding capacity, aggregates, nutrient-related soil structure, and functional characteristics mentioned before, the soil quality assessment ranked the tillage practices as follows: RT > PM > CT > DT. Additionally, RT and PM showed higher soil quality levels, whereas CT and DT achieved moderate levels. This is mainly attributed to RT, which modifies the micro-topographic structure on slopes, reducing soil erosion effects. On the other hand, PM forms a physical barrier between the soil and the external environment, maintaining good water-holding capacity and creating a conducive environment for soil aggregation. In contrast, DT promotes the collection of surface runoff, intensifies erosion effects, negatively impacts soil water retention, and leads to relatively lower soil quality. Rational tillage practices clearly improve soil structural properties; promote soil aggregate formation; and enhance water, carbon, and nitrogen retention, leading to reduced soil moisture and nutrient loss. Among the four tillage practices in red-soil sloping farmland in southern China, RT and PM excel in improving the soil’s structural properties. In line with prior research, the conducted study revealed that the aging process of polyethylene film employed in PM could lead to soil acidification and modify nutrient forms, resulting in various adverse impacts on soil quality [50]. Consequently, prioritizing RT is essential for promoting sustainable tillage practices in red-soil sloping farmland in southern China, as it improves the soil’s structural properties, reduces soil erosion on slopes, and enhances the topsoil quality.

4.2. Effect of Crop Growth Stages on Soil Quality in Red-Soil Sloping Farmland

Soil erosion is a primary factor causing soil quality degradation in sloped farmland. Throughout crop growth, vegetation cover plays a vital role in intercepting rainfall and decreasing runoff, ultimately enhancing soil quality [51,52]. In southern China’s red-soil area, major grain crops are cultivated from April to November, coinciding with the natural rainfall erosion period. Crop growth stages significantly affect water and soil loss on sloping surfaces, and researchers have conducted scientific studies to explore the dynamic changes in soil physico-chemical properties during these stages. Studies indicate that appropriate crop cultivation improves topsoil physico-chemical properties, reduces soil erosion, and enhances soil quality [27]. This study revealed a significant increase (p < 0.05) in the content and stability of soil macro-aggregates as crop growth stages advanced, while CP, SMC, and SQI exhibited remarkable enhancement (p < 0.05) from the early-growth stage to the mature stage. This research shows that the crop growth process improves soil pore structure, enhances water-holding capacity in red-soil sloping farmland, and promotes soil quality improvement. The findings of this study contrast with those of Ferreira et al., potentially attributed to differences in crop tillage techniques and local rainfall patterns [26]. Moreover, mid-term crop performance shows notable advantages in water-holding capacity and soil quality. This is attributed to robust root distribution during the mid-term growth stage and the application of fertilizers to the crops, resulting in lower BD due to root decomposition of residues. This process enhances soil pore formation, resulting in a significant increase in soil water-holding capacity and overall quality. Overall, crop cultivation intercepts surface rainfall, minimizing nutrient runoff. Meanwhile, root system development stabilizes soil particles underground, reducing soil erosion and enhancing soil aggregation. Clearly, the growth process of crops, with the integrated impact of above-ground and below-ground factors, improves soil structure, enhances erosion resistance, effectively reduces soil erosion, and plays a pivotal role in safeguarding soil quality and promoting sustainable agriculture.

5. Conclusions

When comparing the soil physical and chemical properties under different tillage practices, PM exhibits higher levels of total porosity, capillary porosity, and saturated moisture content (p < 0.05), while RT shows higher content of soil macro-aggregates, mean weight diameter, geometric mean diameter, and soil water-stable aggregate stability rate (p < 0.05). Additionally, both PM and RT practices present higher levels of total nitrogen, organic matter, available phosphorus, and available potassium (p < 0.05). The soil quality index (SQI) for both practices is at a high level, with potential soil acidification more prominent in PM. In contrast, the soil properties of CT and DT practices exhibit relatively lower levels across all indicators, resulting in a moderate SQI. Furthermore, there is a significant improvement in soil quality from the early-growth stage to maturity (p < 0.05). From a SQI perspective, RT plays a positive role in soil quality improvement and is recommended for prioritized adoption in the cultivation processes of red-soil slopes, followed by PM and then CT, with DT being discouraged due to its potential negative impacts.

Author Contributions

Conceptualization, K.Y., J.L. (Jianxing Li) and Z.C.; methodology, K.Y. and J.L. (Jing Li); software, K.Y. and C.Z.; validation, K.Y., J.L. (Jianxing Li) and Z.C.; investigation, K.Y., D.W., Y.H. and Z.W.; data curation, K.Y.; writing—original draft preparation, K.Y.; writing—review and editing, J.L. (Jianxing Li) and Z.C.; funding acquisition, Z.C. and K.Y. All authors have read and agreed to the published version of the manuscript.

Funding

This research was supported by the Basic Research Project of Yunnan Province [202201AT070272], the Agricultural Basic Research Joint Special Project of Yunnan Province [202301BD070001-033], the Scientific Research Fund of Education Department of Yunnan Province [2023Y1015], and the open fund of Yunnan Key Laboratory of Crop Production and Smart Agriculture.

Institutional Review Board Statement

Not applicable.

Informed Consent Statement

Not applicable.

Data Availability Statement

We would like to thank the Agricultural Water-Saving Research Center of Yunnan Agricultural University for providing support with the artificial simulated rainfall test platform.

Conflicts of Interest

Author Jianxing Li (J.L.) was employed by the company Kunming Engineering Corporation Limited of Power China. He participated in “Effects of Varied Tillage Practices on Soil Quality in the Experimental Field of Red-Soil Sloping Farmland in Southern China” in the study. The role of the company was Director of Soil and Water Conservation. The remaining authors declare that the research was conducted in the absence of any commercial or financial relationships that could be construed as a potential conflict of interest.

References

  1. Xue, J.; Zhang, X.; Chen, S.; Lu, R.; Wang, Z.; Wang, N.; Hong, Y.; Chen, X.; Xiao, Y.; Ma, Y.; et al. The validity domain of sensor fusion in sensing soil quality indicators. Geoderma 2023, 438, 116657. [Google Scholar] [CrossRef]
  2. Chen, E. Causes of maturation and development of tilling depth and gradation of agricultural soil. J. Shenyang Agric. Univ. 1975, 2, 25–34. [Google Scholar]
  3. Karlen, D.L.; Veum, K.S.; Sudduth, K.A.; Obrycki, J.F.; Nunes, M.R. Soil health assessment: Past accomplishments, current activities, and future opportunities. Soil Tillage Res. 2019, 195, 104365. [Google Scholar] [CrossRef]
  4. Sun, J.; Niu, W.; Du, Y.; Zhang, Q.; Li, G.; Ma, L.; Zhu, J.; Mu, F.; Sun, D.; Gan, H.; et al. Combined tillage: A management strategy to improve rainfed maize tolerance to extreme events in northwestern China. Agric. Water Manag. 2023, 289, 108503. [Google Scholar] [CrossRef]
  5. Jin, H.; Shi, D.; Lou, Y.B.; Zhang, J.; Ye, Q.; Jiang, N. Evaluation of the quality of cultivated-layer soil based on different degrees of erosion in sloping farmland with purple soil in China. Catena 2021, 198, 105048. [Google Scholar] [CrossRef]
  6. Fu, B.J.; Liu, S.L.; Chen, L.D.; Lu, Y.H.; Qiu, J. Soil quality regime in relation to land cover and slope position across a highly modified slope landscape. Ecol. Res. 2004, 19, 111–118. [Google Scholar] [CrossRef]
  7. Hammac, W.A.; Stott, D.E.; Karlen, D.L.; Cambardella, C.A. Crop, Tillage, and Landscape Effects on Near-Surface Soil Quality Indices in Indiana. Soil Sci. Soc. Am. J. 2016, 80, 1638–1652. [Google Scholar] [CrossRef]
  8. Shao, W.; Guan, Q.; Tan, Z.; Luo, H.; Li, H.; Sun, Y.; Ma, Y. Application of BP - ANN model in evaluation of soil quality in the arid area, northwest China. Soil Tillage Res. 2021, 21, 104907. [Google Scholar] [CrossRef]
  9. Zhang, Y.; Liu, H.; Bingham, C. Integrated evaluation of soil fertility based on grey correlation analysis at regional scales. Afr. J. Agric. Res. 2015, 10, 1450–1456. [Google Scholar] [CrossRef]
  10. de Paul Obade, V.; Lal, R. A standardized soil quality index for diverse field conditions. Sci. Total Environ. 2016, 541, 424–434. [Google Scholar] [CrossRef]
  11. Larson, W.E.; Pierce, F.J. The Dynamics of Soil Quality as a Measure of Sustainable Management. In Defining Soil Quality for a Sustainable Environment, 2nd ed.; Doran, J.W., Coleman, D.C., Bezdicek, D.F., Stewart, B.A., Eds.; Soil Science Society of America, Inc.: Madison, WI, USA, 1994; Volume 35, pp. 37–51. [Google Scholar] [CrossRef]
  12. Kahsay, A.; Haile, M.; Gebresamuel, G.; Mohammed, M.; Okolo, C.C. Assessing land use type impacts on soil quality: Application of multivariate statistical and expert opinion-followed indicator screening approaches. Catena 2023, 231, 107351. [Google Scholar] [CrossRef]
  13. Nunes, M.R.; Karlen, D.L.; Veum, K.S.; Moorman, T.B. A SMAF assessment of U.S. tillage and crop management strategies. Environ. Sustain. Indic. 2020, 8, 100072. [Google Scholar] [CrossRef]
  14. Yu, P.; Liu, S.; Zhang, L.; Li, Q.; Zhou, D. Selecting the minimum data set and quantitative soil quality indexing of alkaline soils under different land uses in northeastern China. Sci. Total Environ. 2018, 616, 564–571. [Google Scholar] [CrossRef] [PubMed]
  15. da Luz, F.B.; Da Silva, V.R.; Mallmann, F.J.K.; Pires, C.A.B.; Debiasi, H.; Franchini, J.C.; Cherubin, M.R. Monitoring soil quality changes in diversified agricultural cropping systems by the Soil Management Assessment Framework (SMAF) in southern Brazil. Agriculture. Ecosyst. Environ. 2019, 281, 100–110. [Google Scholar] [CrossRef]
  16. Chu, C.; Wu, Z.; Huang, Q.; Han, C.; Zhong, W. Effect of Organic Matter Promotion on Nitrogen-Cycling Genes and Functional Microorganisms in Acidic Red Soils. Environ. Sci. 2020, 41, 2468–2475. [Google Scholar] [CrossRef]
  17. Guo, J.; Yang, J.; Zhang, L.; Chen, H.; Jia, Y.; Wang, Z.; Wang, D.; Liao, W.; Chen, L.; Li, Y. Lower soil chemical quality of pomelo orchards compared with that of paddy and vegetable fields in acidic red soil hilly regions of southern China. J. Soils Sediments 2019, 19, 2752–2763. [Google Scholar] [CrossRef]
  18. Schäfer-Landefeld, L.; Brandhuber, R.; Fenner, S.; Koch, H.J.; Stockfisch, N. Effects of agricultural machinery with high axle load on soil properties of normally managed fields. Soil Tillage Res. 2004, 75, 75–86. [Google Scholar] [CrossRef]
  19. Wang, Y.; Fan, J.; Cao, L.; Zheng, X.; Ren, P.; Zhao, S. The influence of tillage practices on soil detachment in the red soil region of China. Catena 2018, 165, 272–278. [Google Scholar] [CrossRef]
  20. Jin, H.; Zhong, Y.; Shi, D.; Li, J.; Lou, Y.; Li, Y.; Li, J. Quantifying the impact of tillage practices on the cultivated-layer soil quality in the red soil hilly region: Establishing the thresholds of the minimum data set. Ecol. Indic. 2021, 130, 108013. [Google Scholar] [CrossRef]
  21. Yang, J.; Zheng, H.; Chen, X.; Shen, L. Effects of tillage practices on nutrient loss and soybean growth in red-soil slope farmland. Int. Soil Water Conserv. Res. 2013, 1, 49–55. [Google Scholar] [CrossRef]
  22. Puerta, V.L.; Pereira, E.I.P.; Wittwer, R.; Heijden, M.V.D.; Six, J. Improvement of soil structure through organic crop management, conservation tillage and grass-clover ley. Soil Tillage Res. 2018, 180, 1–9. [Google Scholar] [CrossRef]
  23. Xie, J.; Wang, L.; Li, L.; Coulter, J.A.; Chai, Q.; Zhang, R.; Luo, Z.; Carberry, P.; Rao, K.P.C. Subsoiling increases grain yield, water use efficiency, and economic return of maize under a fully mulched ridge-furrow system in a semiarid environment in China. Soil Tillage Res. 2020, 199, 104584. [Google Scholar] [CrossRef]
  24. Fang, H.; Liu, F.; Gu, X.; Chen, P.; Li, Y.; Li, Y. The effect of source–sink on yield and water use of winter wheat under ridge-furrow with film mulching and nitrogen fertilization. Agric. Water Manag. 2022, 267, 107616. [Google Scholar] [CrossRef]
  25. Mao, Y.; Cui, R.; Chen, A.; Ping, F.; Lei, B. Effects of Ridge Directions on Water Characteristic Curves of Cultivated Top-Layer Soils in Different Slope Positions. Chin. J. Soil Sci. 2022, 53, 308–314. [Google Scholar] [CrossRef]
  26. Ferreira, V.; Panagopoulos, T.; Andrade, R.; Guerrero, C.; Loures, L. Spatial variability of soil properties and soil erodibility in the Alqueva reservoir watershed. Solid Earth 2015, 6, 383–392. [Google Scholar] [CrossRef]
  27. Ghosh, B.N.; Meena, V.S.; Singh, R.J.; Alam, N.M.; Patra, S.; Bhattacharyya, R.; Sharma, N.K.; Dadhwal, K.S.; Mishra, P.K. Effects of fertilization on soil aggregation, carbon distribution and carbon management index of maize-wheat rotation in the north-western Indian Himalayas. Ecol. Indic. 2019, 105, 415–424. [Google Scholar] [CrossRef]
  28. Chen, Z.; Shi, D.; He, W.; Xia, J.; Jin, H.; Lou, Y. Spatio-temporal distribution and evolution characteristics of slope farmland resources in Yunnan from 1980 to 2015. Trans. Chin. Soc. Agric. Eng. 2019, 35, 256–265. [Google Scholar]
  29. Gong, L.; Ran, Q.; He, G.; Tiyip, T. A soil quality assessment under different land use types in Keriya river basin, Southern Xinjiang, China. Soil Tillage Res. 2014, 146, 223–229. [Google Scholar] [CrossRef]
  30. Liu, X.; Zhang, G.; Heathman, G.C.; Wang, Y.; Huang, C. Fractal features of soil particle-size distribution as affected by plant communities in the forested region of Mountain Yimeng, China. Geoderma 2009, 154, 123–130. [Google Scholar] [CrossRef]
  31. Nakajima, T.; Lal, R.; Jiang, S. Soil quality index of a crosby silt loam in central Ohio. Soil Tillage Res. 2015, 146, 323–328. [Google Scholar] [CrossRef]
  32. Yang, X.; Wander, M.M. Temporal changes in dry aggregate size and stability: Tillage and crop effects on a silty loam Mollisol in Illinois. Soil Tillage Res. 1998, 49, 173–183. [Google Scholar] [CrossRef]
  33. Walkley, A.; Black, I.A. An examination of the Degtjareff method for the determining soil organic matter and proposed modification of the chromic titration method. Soil Sci. 1934, 37, 29–38. [Google Scholar] [CrossRef]
  34. Bremner, J.M. Determination of nitrogen in soil by the Kjeldahl method. J. Agric. Sci. 1960, 55, 11–33. [Google Scholar] [CrossRef]
  35. Murphy, J.; Riley, J.P. A modified single solution method for the determination of phosphate in natural waters. Anal. Chim. Acta 1962, 27, 31–36. [Google Scholar] [CrossRef]
  36. Bao, S. Soil and Agricultural Chemistry Analysis, 3rd ed.; Chinese Agriculture Press: Beijing, China, 2000; pp. 106–107. [Google Scholar]
  37. Yu, P.; Li, Q.; Jia, H.; Li, G.; Zheng, W.; Shen, X.; Diabate, B.; Zhou, D. Effect of Cultivation on Dynamics of Organic and Inorganic Carbon Stocks in Songnen Plain. Agron. J. 2014, 106, 1574–1582. [Google Scholar] [CrossRef]
  38. Li, P.; Shi, K.; Wang, Y.; Kong, D.; Liu, T.; Jiao, J.; Liu, M.; Li, H.; Hu, F. Soil quality assessment of wheat-maize cropping system with different productivities in China: Establishing a minimum data set. Soil Tillage Res. 2019, 190, 31–40. [Google Scholar] [CrossRef]
  39. Nash, J.E.; Sutcliffe, J.V. River flow forecasting through conceptual models part I: A discussion of principles. J. Hydrol. 1970, 10, 282–290. [Google Scholar] [CrossRef]
  40. Xu, M. Soil Quality Evolvement Mechanism in the Process of Ecosystem Restoration and Its Management in Loess Hilly-Gully Region. Doctor’s Dissertation, Northwest Sci-Tech University of Agriculture and Forestry, Yangling, China, November 2003. [Google Scholar]
  41. Vilakazi, B.S.; Zengeni, R.; Mafongoya, P. Selected Soil Physicochemical Properties under Different Tillage practices and N Fertilizer Application in Maize Mono-Cropping. Agriculture 2022, 12, 1738. [Google Scholar] [CrossRef]
  42. Du, R.; Wu, J.; Tian, F.; Yang, J.; Han, X.; Chen, M.; Zhao, B.; Lin, J. Reversal of soil moisture constraint on vegetation growth in North China. Sci. Total Environ. 2022, 865, 161246. [Google Scholar] [CrossRef]
  43. Williams, J.; Prebble, R.E.; Williams, W.T.; Hignett, C.T. The influence of texture, structure and clay mineralogy on the soil moisture characteristic. Soil Res. 1983, 21, 15–32. [Google Scholar] [CrossRef]
  44. Xie, C.; Cai, S.; Yu, B.; Yan, L.; Liang, A.; Che, S. The effects of tree root density on water infiltration in urban soil based on a Ground Penetrating Radar in Shanghai, China. Urban For. Urban Green. 2020, 50, 126648. [Google Scholar] [CrossRef]
  45. Chen, Z.; Zhu, Z.; Zhang, W.; Sun, S. Subsoiling tillage increased core microbiome associated with nitrogen fixation in the fallow season under rainfed maize monoculture. Soil Tillage Res. 2024, 235, 105885. [Google Scholar] [CrossRef]
  46. Hu, R.; Liu, Y.; Chen, T.; Zheng, Z.; Peng, G.; Zou, Y.; Tang, C.; Shan, X.; Zhou, Q.; Li, J. Responses of soil aggregates, organic carbon, and crop yield to short-term intermittent deep tillage in Southern China. J. Clean. Prod. 2021, 298, 126767. [Google Scholar] [CrossRef]
  47. Li, W.; Liu, Y.; Zheng, H.; Wu, J.; Yuan, H.; Wang, X.; Xie, W.; Qin, Y.; Zhu, H.; Nie, X.; et al. Complex vegetation patterns improve soil nutrients and maintain stoichiometric balance of terrace wall aggregates over long periods of vegetation recovery. Catena 2023, 227, 107141. [Google Scholar] [CrossRef]
  48. Mamta; Shambhavi, S.; Kumar, R.; Bairwa, R.; Meena, P.; Meena, M.C. Assessment of Carbon Pools and Stability of Soil Aggregates in Inceptisols of Indo-Gangetic Plains as Influenced by Seven-Year Continuous Tillage practices Under Maize-Based Cropping System. Commun. Soil Sci. Plant Anal. 2023, 54, 544–558. [Google Scholar] [CrossRef]
  49. Lei, J.; He, J.; Lei, X.; Zhou, L.; Yu, J.; Ji, L.; Zhang, H.; Lu, F. Effects of tillage on soil aggregates and crop yield on gentle slope lands in Southern Ningxia. Agric. Res. Arid. Areas 2020, 38, 245–250. [Google Scholar] [CrossRef]
  50. Ding, F.; Li, S.; Lu, J.; Penn, C.J.; Wang, Q.; Lin, G.; Sardans, J.; Penuelas, J.; Wang, J.; Rillig, M.C. Consequences of 33 Years of Plastic Film Mulching and Nitrogen Fertilization on Maize Growth and Soil Quality. Environ. Sci. Technol. 2023, 57, 9174–9183. [Google Scholar] [CrossRef]
  51. Wang, J.; Lu, P.; Valente, D.; Petrosillo, I.; Subhash; Xu, S.; Li, C.; Huang, D.; Liu, M. Analysis of soil erosion characteristics in small watershed of the loess tableland Plateau of China. Ecol. Indic. 2022, 137, 108765. [Google Scholar] [CrossRef]
  52. Tang, C.; Liu, Y.; Li, Z.; Guo, L.; Xu, A.; Zhao, J. Effectiveness of vegetation cover pattern on regulating soil erosion and runoff generation in red soil environment, southern China. Ecol. Indic. 2021, 129, 107956. [Google Scholar] [CrossRef]
Figure 1. The setting of the research site in this study.
Sustainability 16 07843 g001
Figure 2. Layout schematic of experimental plots with different tillage practices.
Sustainability 16 07843 g002
Figure 3. Soil water-retention characteristics at different growth stages under various tillage practices. (a) Changes in saturated moisture content during different growth stages under different tillage practices; (b) Changes in bulk density during different growth stages under different tillage practices; (c) Changes in total porosity during different growth stages under different tillage practices; (d) Changes in capillary porosity during different growth stages under different tillage practices. In the figure, different uppercase letters indicate significant differences among different tillage practices (p < 0.05), while different lowercase letters indicate significant differences among different growth stages within the same tillage practice (p < 0.05); the same applies throughout.
Sustainability 16 07843 g003
Figure 4. Distribution characteristics of soil mechanically stable aggregates (a) and soil water-stable aggregates (b) in different growth stages under different cultivation methods.
Sustainability 16 07843 g004
Figure 5. Characteristics of soil aggregate stability under different tillage practices during various growth stages. (a) Changes in Abbreviations of treatments: mean weight diameter (MWD) during different growth stages under different tillage practices; (b) Changes in geometric mean diameter (GMD) during different growth stages under different tillage practices; (c) Changes in percentage aggregate destruction rate (PAD) during different growth stages under different tillage practices; (d) Changes in soil water-stable aggregates stability rate (WSAR) during different growth stages under different tillage practices.
Sustainability 16 07843 g005
Figure 6. Characteristics of soil chemical properties under different tillage practices during various growth stages. (a) Changes in pH during different growth stages under different tillage practices; (b) Changes in organic matter during different growth stages under different tillage practices; (c) Changes in total nitrogen during different growth stages under different tillage practices; (d) Changes in available phosphorus during different growth stages under different tillage practices. (e) Changes in available potassium during different growth stages under different tillage practices.
Sustainability 16 07843 g006
Figure 7. Correlation analysis and weight distribution of soil quality evaluation indicators: (a) correlation analysis of soil quality evaluation indicators; (b) weight distribution of TDS and MDS indicators for soil quality evaluation. Note: The meanings of index codes X1~X13 are shown in Table 3.
Sustainability 16 07843 g007
Figure 8. The SQI and their correlations: (a) the correlation between the SQI of farmland based on MDS and TDS; (b) changes in SQI during different growth stages under different tillage practices.
Sustainability 16 07843 g008
Table 1. The basic physical and chemical properties of the soil studied.
pHMechanical Composition/(%)Total Nitrogen (TN)Organic Matter (OM)Available Potassium (AK)Available Phosphorus
(AP)
Sand Particles (20–2000 μm)Silt Particles (2–20 μm)Clay Particles (<2 μm)
6.53 ± 0.2249.5835.8614.562.66 ± 0.1354.69 ± 1.21673 ± 1.4747.42 ± 0.27
Table 2. Types and determination methods of membership functions for soil evaluation indicators.
Soil Indicator and AbbreviationUnitMembership Function TypeMembership FunctionMembership Function Method Description/Instrument
a1b1b2a2
SMC%S-shaped
membership function
μ ( x ) = 1 , x b 0.9 ( x a ) ( b a ) 0.1 , x a + 0.1 ,   a < x < b 54.2170.11Gravimetric with oven drying method
[29]
TP%49.1065.12Cutting-ring method
[30]
CP%22.1126.92Cutting-ring method
[30]
MWDmm0.8431.491The calculation method refers to the reference
[31]
GMDmm0.3910.627
WSAR%68.1275.94The calculation method refers to the reference
[32]
OMg·kg−145.52053.405K2Cr2O7 colorimetric oxidization method
[33]
TNg·kg−12.4803.240Kjeldahl method
[34]
APmg·kg−117.9259.70Sodium bicarbonate extraction, colorimetric
[35]
AKmg·kg−1149.70814.001 molL−1 NH4OAC extraction—flame
[36]
BDg·cm−3Inverse
S-shaped membership function
μ ( x ) = 1 , x a 0.9 ( x b ) ( a b ) 0.1 , x b + 0.1 ,   a < x < b 0.780.99Cutting-ring method
[30]
PAD%24.0631.88The calculation method refers to the reference
[32]
pHParabolic
membership function
μ ( x ) = 1 , b 2 x b 1 0.9 ( x a 1 ) ( b 1 a 1 ) + 0.1 ,   a 1 < x < b 1 0.9 ( x a 2 ) ( b 2 a 2 ) + 0.1 , a 2 > x > b 2 0.1 ,   x a 1 , x a 2 6.056.406.757.10Potentiometric method
(1:5 soil–water ratio)
[37]
Note: x is the average value of each indicator for each point; a1 and a2 are the minimum and maximum values of the measured indicators, respectively; b1 and b2 are the upper and lower boundary points of the optimal value, respectively. Abbreviations of treatments: saturated moisture content (SMC), total porosity (TP), capillary porosity (CP), mean weight diameter (MWD), geometric mean diameter (GMD), soil water-stable aggregates stability rate (WSAR), organic matter (OM), total nitrogen (TN), available phosphorus (AP), available potassium (AK), bulk density (BD), percentage aggregate destruction rate (PAD), pH (potential of hydrogen).
Table 3. Loading matrix and normalized values of evaluation indicators.
Indicator CodeIndexGroupMain IngredientNorm ValueMinimum
Date Set
PC1PC2PC3PC4
X1BD20.008−0.886−0.0850.2571.638
X2SMC10.5620.736−0.195−0.2431.878
X3CP10.7380.408−0.278−0.1721.867
X4TP30.252−0.166−0.7250.0651.201
X5MWD20.741−0.560.114−0.1321.964
X6GMD10.796−0.4980.239−0.1522.039
X7WSAR10.789−0.2240.435−0.0461.919
X8PAD1−0.8130.234−0.4310.0381.971
X9pH1−0.655−0.3490.4230.3081.739
X10OM30.0990.7550.583−0.0871.614
X11TN40.470.444−0.2240.6951.549
X12AP10.6540.3630.2980.561.765
X13AK1−0.7590.3130.448−0.0641.905
Eigenvalue5.0533.3051.9511.106
Variance contribution/%38.87025.42215.0118.510
Cumulative variance contribution/%38.87064.29279.30387.813
Note: Abbreviations of treatments: bulk density (BD), saturated moisture content (SMC), capillary porosity (CP), total porosity (TP), mean weight diameter (MWD), geometric mean diameter (GMD), soil water-stable aggregates stability rate (WSAR), percentage aggregate destruction rate (PAD), pH (potential of hydrogen), organic matter (OM), total nitrogen (TN), available phosphorus (AP), available potassium (AK).
Disclaimer/Publisher’s Note: The statements, opinions and data contained in all publications are solely those of the individual author(s) and contributor(s) and not of MDPI and/or the editor(s). MDPI and/or the editor(s) disclaim responsibility for any injury to people or property resulting from any ideas, methods, instructions or products referred to in the content.

